Article

Measurement-Based Current-Harmonics Modeling of Aggregated Electric-Vehicle Loads Using Power-Exponential Functions

by
Georgios Foskolos
Division of Business, Society and Engineering, Mälardalen University, P.O. Box 883, SE-721 23 Västerås, Sweden
World Electr. Veh. J. 2020, 11(3), 51; https://doi.org/10.3390/wevj11030051
Submission received: 30 April 2020 / Revised: 17 June 2020 / Accepted: 27 July 2020 / Published: 28 July 2020

Abstract

:
This paper presents an aggregate current-harmonic load model using power exponential functions and built from actual measurement data during the individual charging of four different fully electric vehicles. The model is based on individual emitted current harmonics as a function of state of charge (SOC), and was used to deterministically simulate the simultaneous charging of six vehicles fed from the same bus. The aggregation of current harmonics up to the 11th was simulated in order to find the circumstances when maximal current-harmonic magnitude occurs, and the phase-angle location. The number of possible identical vehicles was set to four, while battery SOC, the start of charging, and the kind of vehicle were randomized. The results are presented in tables, graphs, and polar plots. Even though simulations did not consider the surrounding harmonics, supply-voltage variation, or network impedance, this paper presents an innovative modeling approach that gives valuable information on the individual current-harmonic contribution of aggregated electric-vehicle loads. With the future implementation of vehicle-to-grid technology, this way of modeling presents new opportunities to predict the harmonic outcome of multiple electric vehicles charging.

1. Introduction

In recent years, energy policies and the desire to reduce air pollution have resulted in increased reception of electric vehicles (EVs). Nonetheless, the transport sector in 2016 still accounted for 24% of global emissions from fuel combustion, which is equivalent to more than 8 billion tons of emitted CO2 [1]. In order to meet the goals of the Paris Declaration on Electromobility and Climate Change that set the requirements that at least 20% of all road transport vehicles globally need to be electrically driven by 2030, EVs play a major role in the future of sustainable transport systems, and the global proliferation of EVs is necessary [2].
In 2017, sales of new electric cars (battery EVs (BEVs), plug-in hybrid EVs (PHEVs), and fuel-cell EVs (FCEVs) exceeded 1 million vehicles, representing a growth in new electric car sales of 54% compared with 2016, and global stock surpassed 3 million vehicles [3].
The steady growth of EVs can, however, have adverse impact on distribution networks: increased peak demand and power losses, voltage violations, power-quality issues, and transformer heating and overloading. This impact was evaluated in multiple studies, for example, [4,5,6,7,8,9,10], and may vary on the basis of EV penetration level, battery characteristics, charging patterns, locations, modes, and times, battery state of charge (SOC) while charging, driving patterns, fleet charging profiles, driving distances, demand-response strategy, and tariffs [11].
The power-quality issue of harmonic distortion is mainly determined by the current-harmonic emissions of power electronic components and the network impedance of the grid. These current-harmonic emissions are normally quantified in terms of magnitude. However, phase angle is also of importance, as it allows for a better understanding of potential cancellation effects between devices and customers. Harmonic distortion is time-varying; current distortion varies with load levels, and harmonic voltages at the point of common coupling (PCC) aggravate the emission of harmonic currents. The authors in [12] stated that one can assume that harmonic currents are independent of bus voltages without much error. Other authors in [13,14] showed that, in some situations, when considering the sums of harmonics at different supply voltages, the variation can be significant. In [15], different voltage magnitudes and phase angles were applied while the harmonic currents of devices were measured. The results show that harmonic currents are mostly amplified by harmonic voltages.
In terms of EV charger models, there are two major approaches: circuit-based models in the time domain, and frequency-domain-based models. The first requires detailed a priori knowledge of the electrical equipment and its circuits, while the latter is based on excessive measurements that are matched, in an assumed or postulated model, with parameters fitted to the measured data. This work is based on the latter approach.
The first analysis of the effects of current harmonics generated by a cluster of EV battery chargers was theoretically done as early as the early 1980s. The authors concluded that consequences could be severe [4,16]. In those days, commercially available EVs were limited, and charging technology was in its early stages. In analysis made in 1996 [17], it was concluded that the improvement of EV battery-charging technology had affected the extent of emitted current harmonics, which were continuously decreasing. In [18], harmonic impact was investigated, and simulations showed that that the rise of total harmonic distortion (THDv) would be very low. A method for predicting harmonic currents generated by a concentration of EVs was presented in [19]. The authors’ analysis showed that the net produced harmonic current was not proportional to the number of EVs being charged, that is, the current-harmonics magnitude sum was far less than the total value of the current harmonics emitted by each charger. In [20], the integration of EVs in the Portuguese distribution grid was analyzed and showed that the simultaneous operation of multiple one-phase chargers in the same LV feeder could significantly raise current-harmonic levels. Simulations made in [21], where an EV charging station was modeled, showed that permissible current-harmonic limits were exceeded when six or more vehicles were simultaneously charging. In [22,23], it was shown that distortion limits would be exceeded when charging in relatively weak grids. The combination of four different EVs, and what their cancellation effect does to phase-angle diversity, was analyzed in [24]. Analysis was made during constant-charging mode, during which the phase angles were assumed to be constant. The results show significant harmonic cancellation. The same authors simulated a distribution network supplied by EV charging load, and the result indicate a minor increase in harmonic currents due to EV charging [13]. Kim et al. [25] showed that the low penetration and slow charging rate of EVs slightly impacted network harmonic distortion. However, the high penetration of EVs and fast charging rates may result in considerable voltage- and current-harmonic distortion [25,26]. Deilami et al. [27] established that randomly charging EVs could violate the standard level of voltage harmonics.
In some works, the interaction between EVs and other grid-connected equipment was examined. For example, in [28], the effect of combining EV charging and photovoltaics (PVs) was analyzed, and it was shown that the cancellation/amplification effect varied on the type of equipment and individual current harmonics. In [29], a harmonic decoupled power-flow model was developed to study the impact of multiple EVs with and without wind generators. The simulations demonstrated that low EV penetration had a significant impact on THDi (total harmonic distortion of current), but had low impact on THDv, while moderate-to-high EV penetration was shown to have an adverse impact on both THDi and THDv. With wind generation included in the simulations, THD could either be reduced or cause an increase; hence, the size and placement of wind generation is essential in order to manage THD levels. In [30], the interaction between EVs and other loads (foremost heat pumps) was analyzed. The study showed that the level of cancellation depends on the considered harmonic order, EV operating state, the phase angles of the background harmonic voltages, and the harmonic currents emitted by other loads.
In summation, the review of previous studies showed difficulties in predicting EV harmonic impact and the importance of further research within the field. The review also indicated that phase-angle fluctuation during charging is mostly neglected. In terms of hosting-capacity studies, there are no acceptable models for EV chargers [31].
The behavior of EV charging units is problematic for power systems, as each charger design differs from the next and usually contains some proprietary design. These design differences can result in different harmonic characteristics that can also fluctuate depending on the SOC. In other words, the magnitude and phase angle of each individual emitted current harmonic, at least in some of the measured vehicles and for some individual current harmonics, vary depending on vehicle and SOC. Since SOC is an important battery parameter that can be directly obtained and measured with high accuracy, its practical engineering value is great. It was shown that charging loads corresponding to different charging stages have significant difference; therefore, their impact on the power grid is also different [32]. In more recent works, Sheng et al. showed in their optimized charging model that the effect of a harmonic current can be reduced when EVs are charged at different initial SOC [33]. The authors in [34] analyzed the harmonic characteristics of multiple charging during asynchronous charging (charging of EVs with different initial SOC and starting at different points in time). They concluded that the harmonic current could be reduced by decentralizing EV charging start time and improving the charging state at the beginning of charging. When analyzing the effect on the distribution transformer, the authors in [35] concluded that the accuracy of harmonic assessment was improved if SOC was considered. In [36], the relationship between the amplitude and phase angle of each harmonic current and fundamental voltage, SOC, and the type of rectifier was nonlinearly mapped by the radial-basis-function network for an EV charging-station harmonic-modeling application. Similarly, the constructed EV charger models made in this work did not treat EVs as a constant power element, but also considered the SOC. Discrete SOC sets allow for aggregation analysis of multiple EVs at various states in the charging process. Even though harmonics can be reasonably statistic in the range of 20–80%, this is not always true, as presented in [37].
In this work, the magnitude and phase angles of current-harmonic emissions of four fully electric vehicles were measured several times during the mains part of the charging cycle. All calculations and analyses were based on nominal voltage magnitude (Un = 230 V); hence, on the assumption of nonvarying voltage supply. This was justified by the measured voltage levels and individual voltage harmonics. This is, of course, a simplification, since harmonics are affected by nearby loads and distortion in the supply voltage. It can, therefore, be argued that the modeling is only applicable in certain grid configurations. However, as an initial work that will be followed by a more exhaustive model (i.e., coupled Norton model) where these factors are considered, it is still justified because of the originality of the model construction.
Measurement results were checked for repeatability, i.e., maximal current-harmonic-magnitude deviation of 5%. On the basis of measurement data, power exponential functions were used to model individual current-harmonics behavior for each EV. In order to construct a continuous function with peaks and valleys where steepness and slopes were independent of each other, an analytically extended function was used that consisted of piecewise linear combinations of the power exponential function that was scaled and translated. Modeling the emitted harmonics as a function of SOC instead of using a look-up table presents new opportunities. One of these opportunities emerged as vehicle-to-grid (V2G) technology started to be implemented. This technology requires both new hardware (power electronics in the EV and the wallbox that enables bidirectional energy flow) and new software. The latter means that during the connection between the EV and complex wallbox, information, such as SOC information, is exchanged. When vehicles are connected, individual current-harmonic functions can be combined, and the aggregation can be made momentarily or be used to foresee aggregated effects to come. This method of harmonics modeling is a novelty in the research community. Technical standard ISO 15118, which handles the technical requirements on both hardware and software, is still under development.
Subsequently, the models were used to simulate the aggregation of multiple EV charging. This was followed by deterministic simulations to find situations (number of EV types, start time of charging, and level of SOC) when the maximal amplitude of individual current harmonics occurred.
The paper is organized as follows. Section 2 describes the theoretical background of harmonics and the aggregation of harmonic phasors. Section 3 describes the measurement setup. Section 4 describes the mathematical modeling, and Section 5 presents the results. In Section 6, results are discussed and conclusions are drawn.

2. Theoretical Background

2.1. Electric Vehicles and Harmonics

In a linear system, that is, a circuit with ideal resistors, capacitors, and/or inductors, the voltage and current waveforms are perfectly sinusoidal. In reality, such a system is highly unlikely, and there are always some nonlinearities. For example, certain types of loads (nonlinear loads) produce currents and voltages with frequencies that are whole multiples of the frequency at which the supply system was designed to operate (e.g., 50 or 60 Hz). These currents and voltages are called harmonics and range up to 2 kHz (40th harmonic).
A way to characterize the harmonic distortion of a signal is to use the so called THD that gives information on the harmonic content, and can be expressed as
T H D i , % = h = 2 H I h 2 I 1 100 % ,
where h is the harmonic order, H is the highest order of the observed harmonic categorical, Ih is the RMS value of the current h-th harmonic component, and I1 is the current RMS value of the main frequency. THDv can be similarly calculated, but with the current values in Equation (1) replaced with respective voltage values. THDi does not always reflects the actual harmonic content. For example, if the fundamental current decreases while the harmonic content remains the same, the THDi value is higher, indicating higher emissions, but not reflecting the adverse impact on the grid. A more suitable way to express distortion in terms of current harmonics is the total harmonic current (THC):
T H C = h = 2 40 I h 2 ,
where Ih is the RMS value of each harmonic order, and h is the harmonic order.
In order to prevent harmonics from affecting the utility supply, standards such as IEC-61000-3-2 [38]/3-12 [39] and EN-50160 [40] were established with the goal of developing recommended practices and requirements for harmonic control in electrical power systems. IEC-61000-3-2 sets the emission limits for equipment connected to public low-voltage systems with input current ≤ 16 A per phase, and IEC-61000-3-12 for equipment with input current > 16 A and ≤ 75 A per phase. EN-50160 gives the main voltage characteristics at the customer’s supply terminals in low- and medium-voltage networks; in terms of harmonics, it sets limits for harmonic voltage for orders up to the 24th. These standards concern both utilities and end users—the former because they are obliged to provide power of “good” quality, and the latter because they are responsible for not degrading voltage by drawing significant nonlinear or distorted currents. In this context, it becomes evident that power quality is of concern for both.
EV batteries require direct current (DC) for charging and power electronic converters for converting alternating current (AC) to DC, as well as charging control, presenting nonlinear load, and resulting in injected current harmonics. These harmonics are closely related to EV charger circuit topology that provides an interface with the AC network. While harmonic currents themselves do not directly affect customers, they can, as they are introduced into the distribution system, affect power losses in the entire low-voltage system, and cause nonlinear voltage drop that leads to distorted supply voltage, which can, in turn, affect electrical-distribution equipment (e.g., motors, transformers, lines, and capacitors) [41].
When a variety of vehicles with different SOCs and current variation during the charging cycle are connected to the electrical system, harmonic-frequency magnitude and individual harmonic phase-angle variation may be expected. The emissions of combined operations result in different cancellation and amplification effects, including mutual influence between voltage distortion and harmonic currents. As presented in the introduction, previous studies have not been univocal.

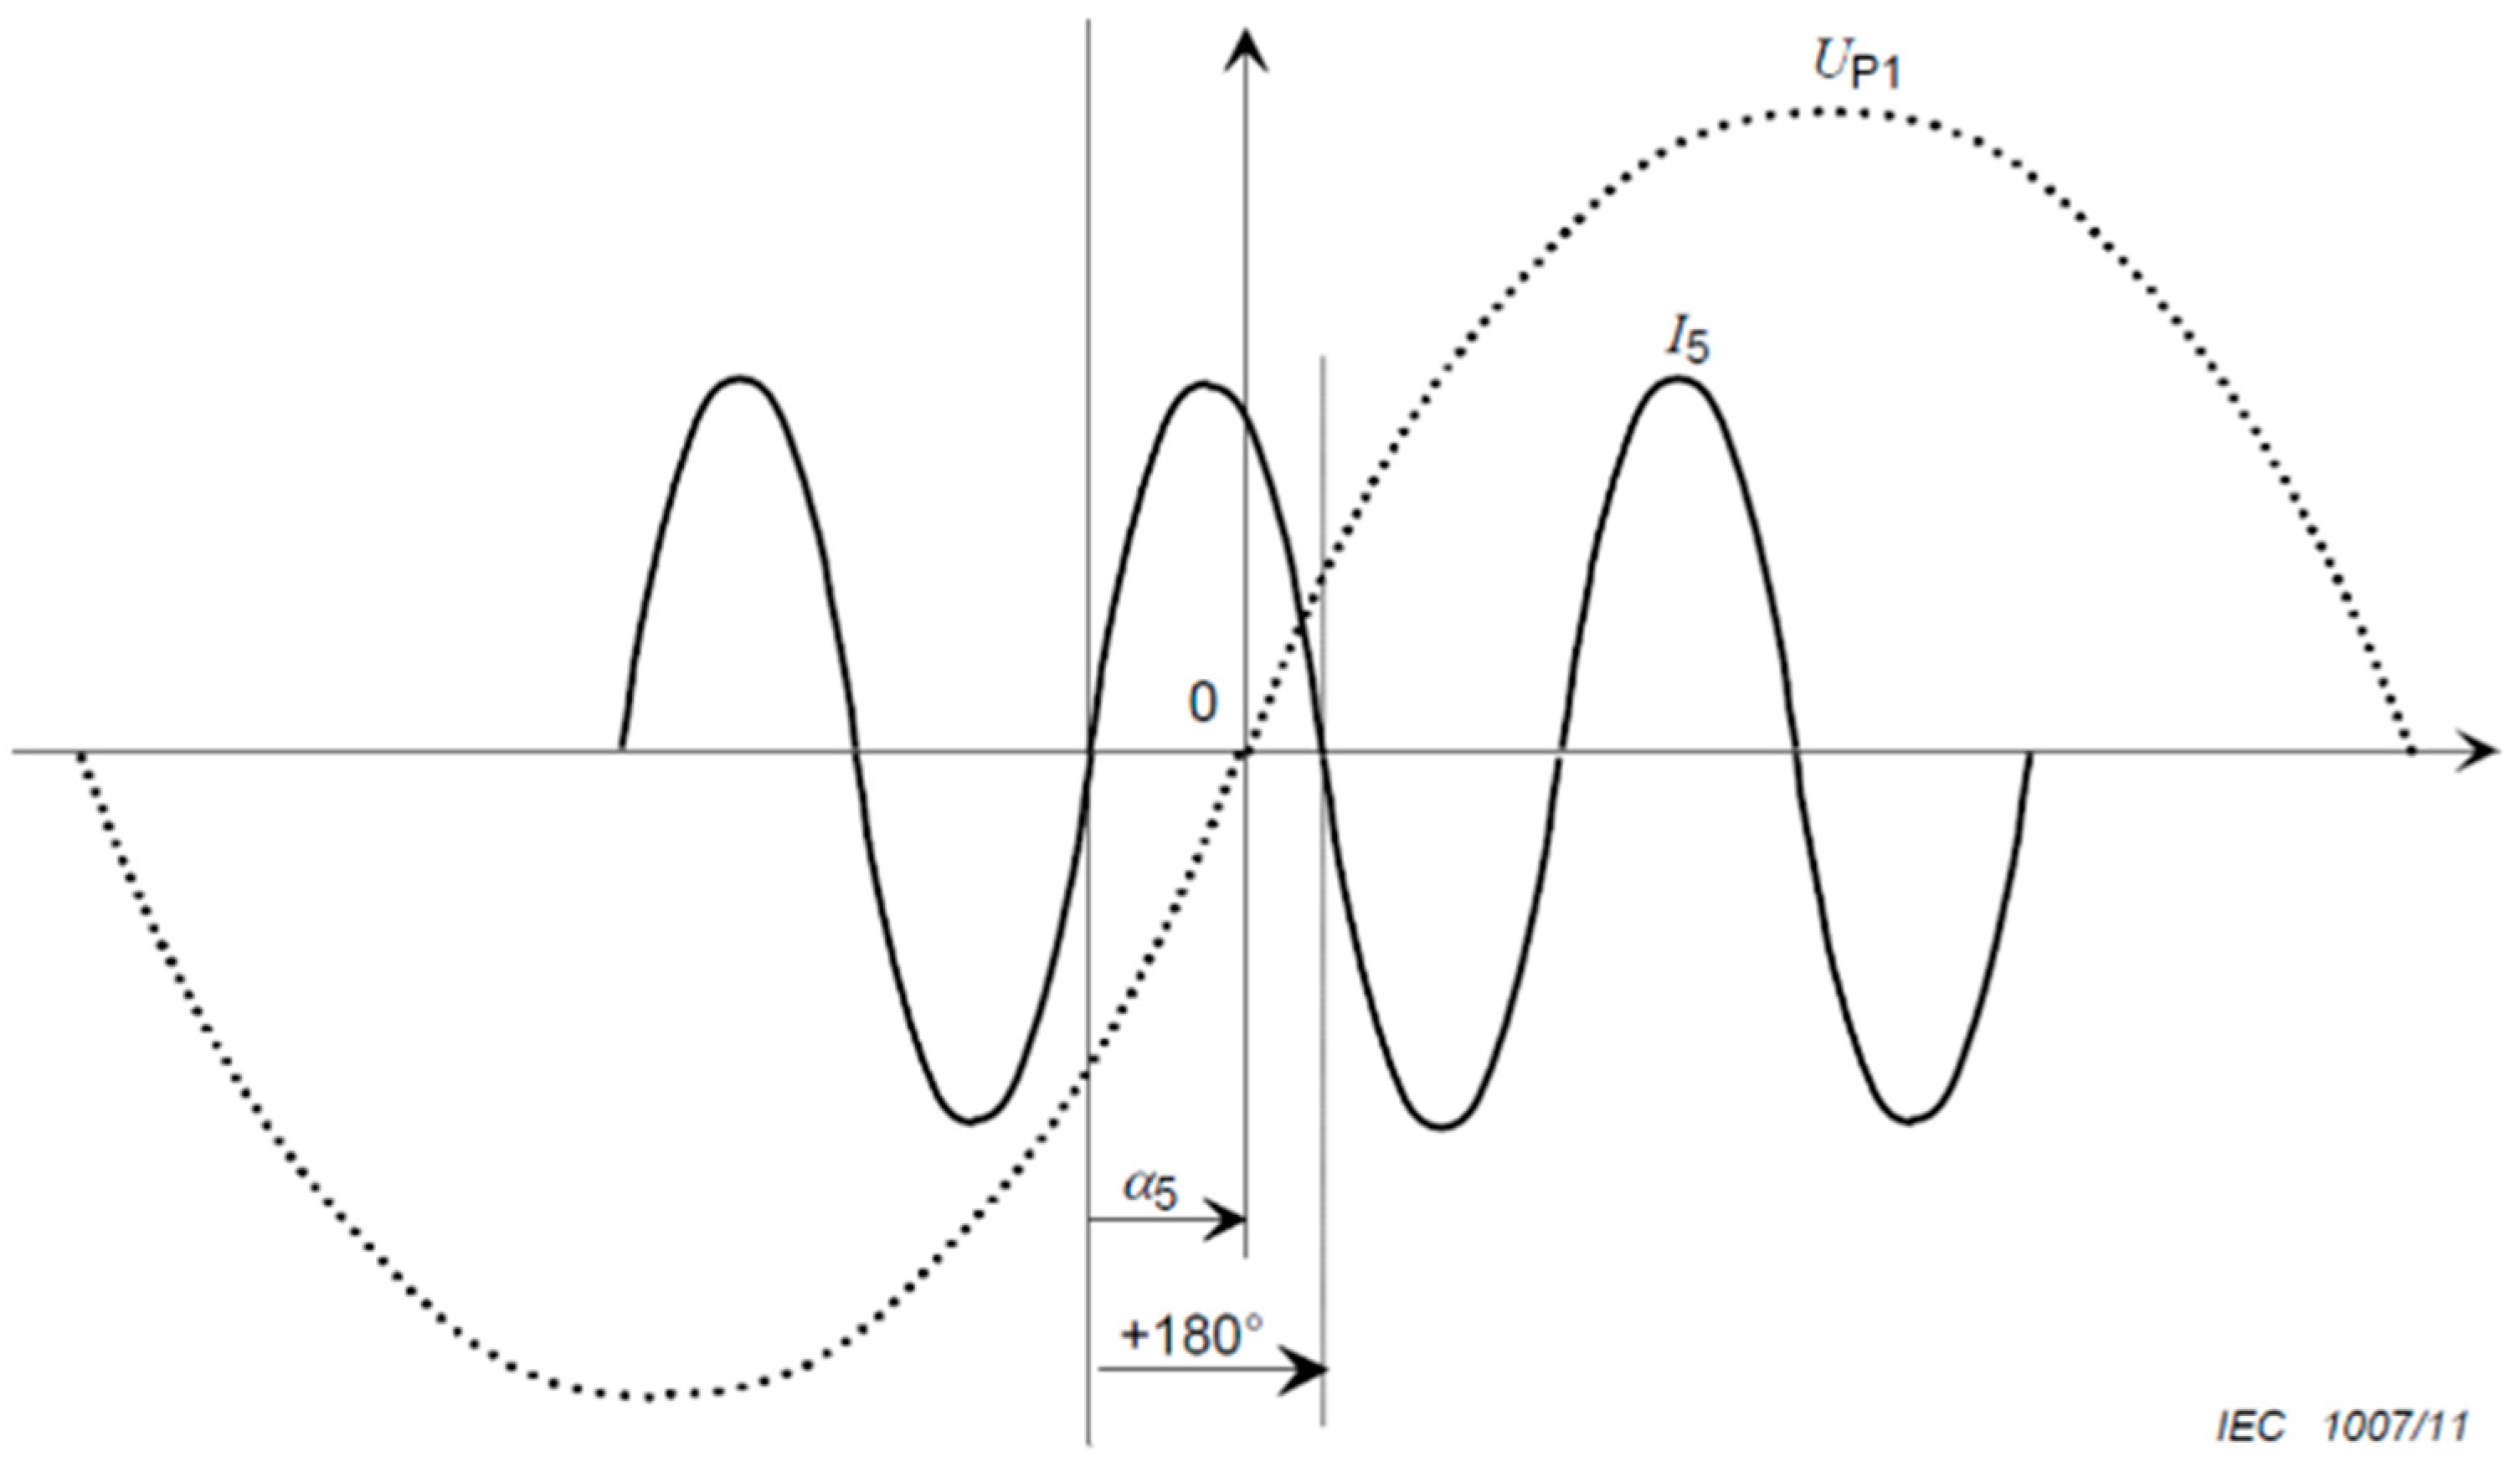
2.2. Harmonic Phasor Aggregation

Harmonic-aggregation studies are a complex topic, and research within the field is limited. For instance, up to now, little importance has been given to harmonic phase angles. The reason is the lack of standardization that has led to most instruments not providing that kind of information. Because of the difficulty in assessing phase angles from individual harmonics, most harmonic-aggregation studies used probabilistic approaches, for example, [9,12,42,43,44,45,46].
An important aspect of realistic harmonic studies is an accurate representation of harmonic-current summations. When a number of loads are fed from the same bus, the total harmonic current injected at that bus is the sum of all individually generated harmonic currents. Since harmonic currents can be represented by vectors, the magnitudes and phase angles of all individual vectors are needed in order to make the vector summation. The diversification of devices with different circuit topologies can cause a diversity of current-harmonic phase angles, and may lead to a lower magnitude of vector sum than the arithmetical sum of harmonic currents [47].
The study of aggregated loads and the cancellation or amplification effects of harmonic currents needs the “absolute” harmonic phase angle; that is, the angle between current harmonics and fundamental voltage, as specified in IEC 61000-3-12 [39]. This differs from harmonic power-flow studies that require the “relative” harmonic phase angle (angle between harmonic voltage and harmonic current).

3. Measurement Setup

The power-quality (PQ) measurement equipment used in this work was a Yokogawa WT3004E precision power analyzer [48] compliant with IEC 61000-4-7 [49] measurement-instrumentation requirements that stores gapless 10/12-period values and each spectral component k at magnitude (rms) YC,k and phase angle φk. In a 50 Hz network, harmonic component YH,h is identical to spectral component YC,k, with k = h × 10, and is represented by harmonic phasor
Y _ H , h = Y H , h φ H , h ,
where Y is replaced by either I for current or U for voltage, and h indicates the harmonic order.
The instrument has advanced computation installed that, in combination with the harmonic-/flicker-measurement software, allows us to perform harmonic measurements conforming to IEC 61000-3-2 and IEC 61000-3-12. This standard uses positive zero crossings as reference, thus calculating sine-based harmonic-phase angles (Figure 1). This differs from the Fourier definition, where cosine-based calculation is used.
When measuring harmonics, the period of the fundamental signal (fundamental period) must be determined in order to analyze higher-order harmonics. The phase-locked loop (PLL) source is the signal that is used to determine the fundamental period. The data-update interval is automatically determined by the fundamental frequency of the PLL source and the number of periods of the PLL source used for analysis.
The measurement setup used in this work was a direct-input single-phase (two-wire) system. This setup can be seen in Figure 2.
Measurements were made on four fully electric vehicles in an environment within a local distribution grid; namely, the charging facilities of a distribution-system-operator, at 1 of the 8 outbound cables in an electrical enclosure; grid configuration can be seen in Figure 3. All vehicles were charged with one-phase charging, and, during measurements, only the charger included in the measurement was connected. Measurements were done several times and checked for repeatability. This feature was included in the software and compared, so that the measured magnitudes of the first 11 harmonics were within 5% deviation.
EVs indicate their SOC level in parts of full bar visualization on the instrument panel. The initial intention was to start charging and measure at SOC 25%. However, after measuring the amount of transferred energy from the grid to the vehicle, and comparing this to the battery capacity, it was concluded that the initial SOC varied from 20% to 36%.
Vehicles were chosen with respect to the most popular fully electric private vehicles in Sweden (Tesla models excluded). Technical and some measurement data of the EVs can be seen in Table 1. Due to sensitive issues, the names of these EVs are not disclosed.
The required measurement accuracy, referred to in the PQ instrument, is defined in IEC 61000-4-7 (exemplified in Table 2). The standard defines the required uncertainty for harmonic magnitudes, but excludes harmonic phase-angle uncertainty.
All vehicles were measured at least twice. As stated earlier, the measurements were checked for repeatability and examined so that the harmonic amplitude (up to the 11th harmonic) was lower than ±5%. Polar plots of the third current harmonic during the measurements of each vehicle can be seen in Figure 4.

4. Modeling Harmonic Currents Using Power Exponential Functions

In order to find a continuous function with multiple peaks, and where the steepness of the rise between peaks and the slope of the decaying parts are independent of each other, an analytically extended function was constructed. The function, with the same expression before and after maxima (or minima) time moments, but for different parameters, was used for approximating harmonic currents. This function consisted of a piecewise combination of the power exponential function that was scaled and translated, so that the resulting function was continuous.
First the power exponential function is, as described in [50], defined as
f ( t ; p ) = ( t e 1 t ) p ,   0 t .
For non-negative values of t (time) and p (iterative obtained value for model fitting that could be negative), this function has a steeply rising part followed by a more slowly decaying part, exemplified in Figure 5.
Then, a linear combination of a power exponential function, and a mirrored and translated power exponential function was constructed in order to obtain a function that best fit the measured values (see Appendix A for more details of the function):
g ( t ; t 1 , t 2 , p 1 , p 2 , p 3 ) = p 3 f ( t t 1 t 2 t 1 ; p 1 ) + ( 1 p 3 ) f ( t t 1 t 2 t 1 ; p 2 ) .
Analysis showed that extending this function with more parameters pn marginally improves the model, but at the expense of computational effort.
In accordance with the IEC 61000-4-7 [49] standard, the following notation for frequency analysis of a current was used: I ( t ) = c 0 + m = 1 b m ( t ) + j a m ( t ) .
I a m p ( t ) = c 0 ( t ) + m = 1 c m ( t ) sin ( m N ω 1 t + φ m ) ,
where
c m ( t ) = | b m ( t ) + j a m ( t ) | = a m 2 + b m 2 ,
C m ( t ) = c m 2 ,
φ m ( t ) = {   arc tan ( a m ( t ) b m ( t ) ) ,   b m 0 , π + arc tan ( a m ( t ) b m ( t ) ) ,   b m < 0.
Since the harmonic curve can dramatically change shape at certain times due to an actual change to the charging circuit imposed by the control circuitry in the electric vehicle, a piecewise approximation of the harmonic currents using functions of the form g given in Equation (5) was used:
b m ( t ) = {   0 , t < 0 g ( t ; t n , t n + 1 , p m , n , 1 , p m , n , 2 , p m , n , 3 ) , t n t < t n + 1 , 1 n N   0 , t t N
a m ( t ) = {   0 , t < 0 g ( t ; t n , t n + 1 , q m , n , 1 , q m , n , 2 , q m , n , 3 ) , t n t < t n + 1 , 1 n N   0 , t t N
This approach is similar to the model used in [52,53] to describe electrostatic-discharge currents. The function’s main advantages (as mentioned in [54]) are: simply adjustable derivative value, rise-time value, time-to-peak value, and exact peak values chosen prior to adjusting other parameters. Changes in the current-harmonic curve could also reflect sudden changes on the supply side, e.g., due to switching events. After examination of the voltage levels (and voltage harmonics), it was concluded that the curves in fact reflected the control circuit of the EVs reasonably well.
The first step in fitting the model is to choose intervals given by [ t n , t n + 1 ] in Expressions (7) and (8). This is done manually on the basis of the inspection of the measured data, that is, identifying peaks at certain times t. Expressions (7) and (8) show that values prior to t1 are set to zero, that is, before the vehicle starts to charge. In many cases, choosing suitable intervals for one individual harmonic gives a set of suitable points for most or all other harmonics. The second step is then separately fitting the model in each interval. For this application, a least-squares fitting procedure was applied, and, since the model was nonlinear with respect to the parameters, a numerical procedure for finding the fitting was used. This was conducted with software [54] that uses an interior reflective algorithm based on [55,56].
The model construction can be summarized in the following steps:
  • inspection of measured value (imaginary and real part is done separately);
  • manually choosing moments in time when peaks occur;
  • choosing initial values for p1, p2, and p3 (or q1, q2 and q3);
  • applying Function (7) or (8) between peaks;
  • least-squares fitting procedure (MATLAB) to find values of p1, p2 and p3 (or q1, q2 and q3) for a function that best fits measured values between peaks;
  • procedure is repeated until all peaks are handled. Functions between each peak are acquired, and a piecewise combination of the functions is scaled and translated, so that the resulting function is continuous.
Examples of functions over different time intervals are presented in Figure 6.
When performing the fitting, it is important to use initial parameters that at least qualitatively match the desired output; otherwise, the algorithm is likely to produce poor fitting. The result is graphically exemplified in Figure 7, where the real and imaginary part of the third current-harmonic during the charging of EV1 and the corresponding fitted function are presented in a complex plane.

Aggregation of Multiple Electric-Vehicle Loads

The simulation prerequisites are the following: we assumed that we had four vehicles of each model, and six charging points fed from the same bus. The numbers of charging points were based on an actual charging facility within a local distribution grid. The numbers of vehicles of each model were chosen so that at least two models would be simultaneously charged during the simulations. If the numbers of identical vehicles were equal to or more than the number of charging points, we likely had the largest current harmonics when identical vehicles were being charged, as the cancellation effect in this situation was limited. The measurement equipment stores gapless 10/12-period values—amplitude and “absolute” phase angle for individual current harmonics. These values can be represented by real and imaginary values, as seen in Equation (6), and the summation at each time instance can be made according to
I a g g ( t ) = c 0 ( t ) + m = 1 A g g c m ( t ) sin ( m N ω 1 t + A g g φ m )
A g g c m ( t ) = | b m e v 1 ( t ) + b m e v 6 ( t ) + j a m e v 1 ( t ) + j a m e v 6 ( t ) |
= ( a m e v 1 + a m e v 6 ) 2 + ( b m e v 1 + b m e v 6 ) 2   ,
A g g c m ( t ) = A g g C m 2
A g g φ m ( t ) = { arc tan ( a m e v 1 ( t ) + a m e v 6 ( t ) b m e v 1 ( t ) + b m e v 6 ( t ) ) ,   b m 0 , π + arc tan ( a m e v 1 ( t ) + a m e v 6 ( t ) b m e v 1 ( t ) + b m e v 6 ( t ) ) ,   b m < 0.
The aggregated harmonic phasor can be expressed according to
I _ a g g ( t ) = A g g C m ( t ) A g g φ m ( t )
The continuous SOC value of each model was calculated so that it corresponded to the time series of each model. For EV1, the time series started at SOC 20%; for EV2, the time series started at SOC 36%; for EV3, the time series started at SOC 32%; and for EV4, the time series started at SOC 25%.
The measurement series for all EVs and all individual current harmonics were randomly simulated (100,000 times) in terms of model, initial SOC, and charging start time (from time t = 1 min to t = 800 min). Lastly, a deterministic approach was applied to find circumstances when the maximal current-harmonic magnitude of individual harmonics occurred.

5. Results

Figure 8 displays the result of the third current-harmonic simulation. The maximal current-harmonic magnitude of 6.89 A occurred when all four EV1 vehicles (and two EV2 vehicles) were being simultaneously charged. The polar plot visualizes the continuous function as charging started (from one end of the line at zero amps) until the charging stopped (at the other end of the line at zero amps). The phase angle during the entire time the vehicles were being charged was situated in the second and third quadrant.
Table 3 shows the resulting situation for each individual current harmonic, the maximal magnitude and time when this occurred, the EV model being charged, the SOC level at the start, the time when the EVs started charging, and in which quadrant the phase angle was found.

6. Discussion and Conclusions

This paper describes how power exponential functions can be used to model current harmonics emitted by the onboard charger, and thereafter simulate the aggregation of six fully electric vehicles.
On the basis of several measurements during the charging of each of the vehicles, fitted functions were created for all uneven individual current harmonics up to the 11th order. These fitted functions were then used to simulate aggregated EV loads fed from the same bus. The number of vehicles to be simultaneously charged was set to six, and the maximal quantity of each vehicle model was set to four. The SOC and start of charging were randomly selected, and each of the current harmonics were simulated 100,000 times. The simulation had a deterministic approach—to find the situation where the maximal current-harmonic magnitude could be found. Certainly, 100,000 simulations could not cover every single case, so the actual situation where the maximal magnitude occurred was not found. However, the results show an indication of the magnitude to be expected in which the quadrant the phase angle could be found, as well as the individual start and SOC of each of the vehicles. As expected, depending on the individual current-harmonic emissions, we mostly had all vehicles of the same model simultaneously charging because identical current-harmonic characteristics amplify the effects of aggregation and limit the cancellation effects. For all the harmonics except the ninth, a combination of the vehicles with the highest-rated charging power resulted in the highest harmonic magnitude.
The developed model is useful for determining the range of the current-distortion level of aggregated EV loads under different loading scenarios. Since the absolute phase angle varies during a charging cycle, cancellation and amplification vary too.
When technical standard ISO 15118 is implemented in both EVs and the wallbox, SOC information can be exchanged. If this information is collected, simulations can be continuously made, and the harmonic outcome can be predicted. This enables the more reliable operation and planning of the electrical grid.
Further improvements in the model can be achieved with load data from more EV models and measurements of a greater part of the battery’s SOC. Most importantly, these simulations do not consider the surrounding environment, such as feeding voltage variations and other influencing nonlinear loads. Surrounding load characteristics, including prevailing phase angles and network impedance, affect the resulting influence of large-scale EV penetration. Modeling an entire network (e.g., using a harmonic coupled Norton-equivalent model) with included parameters largely improves the usability of the model. In future work, these parameters will be considered. Furthermore, the measurement equipment used in this work stored 10/12 period values, an unrealistic time resolution for permanent power-quality instruments located in the distribution grid. For this reason, future work will also be made on the impact of aggregation time intervals on harmonic phasors.

Funding

This work was carried out under the auspices of industrial postgraduate school Reesbe (https://www.hig.se/Ext/En/University-of-Gavle/Organisation/Akademier/Faculty-of-Engineering-and-Sustainable-Development/Research-at-the-Faculty/Research-School-Reesbe.html). Financers were Mälarenergi Elnät AB and the Knowledge Foundation (KK-stiftelsen).

Acknowledgments

The author gratefully acknowledge the contributions of Karl Lundengård for helping with the mathematical modeling.

Conflicts of Interest

The author declares no conflict of interest.

Appendix A

The constructed function:
g ( t ; t 1 , t 2 , p 1 , p 2 , p 3 ) = p 3 ( t t 1 t 2 t 1 e ( 1 t t 1 t 2 t 1 ) ) p 1 + ( 1 p 3 ) ( t t 1 t 2 t 1 e ( 1 t t 1 t 2 t 1 ) ) p 2 .
Definition of power exponential function:
f ( t ; p ) = ( t e 1 t ) p .
Derivatives of the power exponential function:
d f d t = p ( e 1 t t e 1 t ) ( t e 1 t ) p 1 = p ( 1 t ) e 1 t ( t e 1 t ) p 1 = p ( 1 t ) 1 t ( t e 1 t ) p = p 1 t t f ( t ; p )
d d t ( f ( 1 t ; p ) ) = p t 1 t f ( 1 t ; p ) .
Derivatives of constructed function:
d g d t = p 3 p 1 1 t t 1 t 2 t 1 t t 1 t 2 t 1 f ( t t 1 t 2 t 1 ; p 1 ) ( 1 p 3 ) p 2 t t 1 t 2 t 1 1 t t 1 t 2 t 1 f ( 1 t t 1 t 2 t 1 ; p 2 ) = p 3 p 1 t 2 t t t 1 f ( t t 1 t 2 t 1 ; p 1 ) ( 1 p 3 ) p 2 t t 1 t 2 t f ( 1 t t 1 t 2 t 1 ; p 2 ) .
Power exponential function integrated over time t:
0 t f ( τ ; p ) d τ = 0 t ( τ e 1 τ ) p d τ = e p p p + 1 γ ( p + 1 , p t )
0 t f ( τ ; p ) d τ = e p p p + 1 γ ( p + 1 , p ) ,   γ ( p , t ) = 0 t τ p 1 e τ d τ .
Laplace transform of power exponential function:
( f ( t ; p ) ) ( s ) = 0 f ( t ; p ) e s t d t = 0 ( t e 1 t ) p e s t d t = 0 t p e p p t s t d t = e p 0 t p e ( p + s ) t d t
τ = ( p + s ) t
τ = ( p + s ) t = e p 0 τ p ( p + s ) p e τ ( p + s ) d τ = e p ( p + s ) ( p + s ) p 0 τ p e τ d τ = e p ( p + s ) ( p + s ) p Γ ( p + 1 ) ,
where
Γ ( p ) = 0 τ p 1 e τ d τ .

References

  1. CO2 Emissions from Fuel Combustion Highlights; IEA: Paris, France, 2018. Available online: https://webstore.iea.org/co2-emissions-from-fuel-combustion-2018-highlights (accessed on 11 March 2019).
  2. UNFCCC. Paris Declaration on Electro-Mobility and Climate Change and Call to Action. In Proceedings of the Paris 2015 UN Climate Change Conference, Paris, France, 30 November–12 December 2015; Available online: https://unfccc.int/gcse?q=the-paris-declaration-on-electro-mobility-and-climate-change-and-call-to-action (accessed on 22 March 2019).
  3. OECD/IEA. Global EV Outlook 2018: Towards Cross-Modal Electrification. 2018. Available online: https://webstore.iea.org/download/direct/1045?fileName=Global_EV_Outlook_2018.pdf (accessed on 21 March 2019).
  4. Orr, J.A.; Emanuel, A.E.; Oberg, K.W. Current Harmonics Generated by a Cluster of Electric Vehicle Battery Chargers. IEEE Trans. Power Appar. Syst. 1982, PAS-101, 691–700. [Google Scholar]
  5. Rahman, S.; Shrestha, G.B. An investigation into the impact of electric vehicle load on the electric utility distribution system. IEEE Trans. Power Deliv. 1993, 8, 591–597. [Google Scholar] [CrossRef]
  6. Taylor, J.; Maitra, M.; Alexander, M.; Brooks, D.; Duvall, M. Evaluation of the impact of plug-in electric vehicle loading on distribution system operationse. In Proceedings of the IEEE Power Energy Society General Meeting, Calgary, AB, Canada, 26–30 July 2009; pp. 1–6. [Google Scholar]
  7. Taylor, J.; Maitra, M.; Alexander, M.; Brooks, D.; Duvall, M. Evaluations of plug-in electric vehicle distribution system impacts. In Proceedings of the IEEE Power Energy Society General Meeting, Minneapolis, MN, USA, 25–29 July 2010; pp. 1–6. [Google Scholar]
  8. Kutt, L.; Saarijärvi, E.; Lehtonen, M.; Molder, H.; Niitsoo, J. A Review of the Harmonic and Unbalance Effects in Electrical Distribution Networks due to EV Charging. In Proceedings of the 12th International Conference on Environment and Electrical Engineering, Wroclaw, Poland, 5–8 May 2013; pp. 28–33. [Google Scholar]
  9. Jiang, C.; Torquato, R.; Salles, D.; Xu, W. Method to assess the power quality impact of plug-in electric vehicles. In Proceedings of the 2014 16th International Conference on Harmonics and Quality of Power, Bucharest, Romania, 25–28 May 2014; Volume 29, pp. 177–180. [Google Scholar]
  10. Wanik, M.Z.C.; Siam, M.F.; Subiyanto, A.A.; Mohamed, A.; HanifahAzit, A.; Sulaiman, S.; Mohamed, A.M.A.; Hussein, Z.F.; MatHussin, A.K. Harmonic Measurement and Analysis during Electric Vehicle Charging. Engineering 2013, 5, 215–220. [Google Scholar] [CrossRef]
  11. Shareef, H.; Islam, M.M.; Mohamed, A. A review of the stage-of-the-art charging technologies, placement methodologies, and impacts of electric vehicles. Renew. Sustain. Energy Rev. 2016, 64, 403–420. [Google Scholar] [CrossRef]
  12. Baghzouz, Y.; Burch, R.F.; Capasso, A.; Cavallini, A.; Emanuel, A.E.; Halpin, M.; Langella, R.; Montanari, G.; Olejniczak, K.J.; Ribeiro, P.; et al. Time-varying harmonics. II. Harmonic summation and propagation. IEEE Trans. Power Deliv. 2002, 17, 279–285. [Google Scholar] [CrossRef]
  13. Kutt, L.; Saarijarvi, E.; Lehtonen, M.; Molder, H.; Niitsoo, J. Estimating the harmonic distortions in a distribution network supplying EV charging load using practical source data—Case example. In Proceedings of the IEEE Power and Energy Society General Meeting, National Harbor, MD, USA, 27–31 July 2014; pp. 4–8. [Google Scholar]
  14. Meyer, J.; Mueller, S.; Ungethuem, S.; Xiao, X.; Collin, A.; Djokic, S. Harmonic and supraharmonic emission of on-board electric vehicle chargers. In Proceedings of the 2016 IEEE PES Transmission and Distribution Conference and Exposition-Latin America (PES T and D-LA), Morelia, Mexico, 20–24 September 2016. [Google Scholar]
  15. Hansen, S.; Nielsen, P.; Blaabjerg, F. Harmonic Cancellation by Mixing Nonlinear. IEEE Trans. Ind. Appl. 2000, 36, 152–159. [Google Scholar] [CrossRef]
  16. Emanuel, A.E.; Orr, J.A.; Pileggi, D.J. Current Harmonics, Voltage Distortion, and Powers Associated with Electric Vehicle Battery Chargers Distributed. IEEE Trans. Ind. Appl. 1984, I, 727–734. [Google Scholar]
  17. Berisha, S.H.; Karady, G.G.; Ahmad, R.; Hobbs, R.; Karner, D. Current harmonics generated by electric vehicle battery chargers. In Proceedings of the International Conference on Power Electronics, Drives and Energy Systems for Industrial Growth, New Delhi, India, 8–11 January 1996; Volume 1, pp. 584–589. [Google Scholar]
  18. Bass, R.; Harley, R.; Lambert, F.; Rajasekaran, V.; Pierce, J. Residential harmonic loads and EV charging. In Proceedings of the 2001 IEEE Power Engineering Society Winter Meeting. Conference Proceedings (Cat. No.01CH37194), Columbus, OH, USA, 28 January–1 February 2001; Volume 2, pp. 803–808. [Google Scholar]
  19. Lu, X.; Jiang, J. Harmonic Study of Electric Vehicle Chargers. In Proceedings of the 2005 International Conference on Electrical Machines and Systems, Nanjing, China, 27–29 September 2005; pp. 2404–2407. [Google Scholar]
  20. Melo, N.; Mira, F.; De Almeida, A.; Delgado, J. Integration of PEV in Portuguese distribution grid: Analysis of harmonic current emissions in charging points. In Proceedings of the 11th International Conference on Electrical Power Quality and Utilisation, Lisbon, Portugal, 17–19 October 2011; pp. 791–796. [Google Scholar]
  21. Yang, W.; Wang, J.; Zhang, Z.; Gao, Y. Simulation of electric vehicle charging station and harmonic treatment. In Proceedings of the 2012 International Conference on Systems and Informatics, ICSAI 2012, Yantai, China, 19–20 May 2012; pp. 609–613. [Google Scholar]
  22. Niitsoo, J.; Kilter, J.; Palu, I.; Taklaja, P.; Kütt, L. Harmonic levels of domestic and electrical vehicle loads in residential distribution networks. In Proceedings of the IEEE AFRICON Conference, Pointe-Aux-Piments, Mauritius, 9–12 September 2013; pp. 1–5. [Google Scholar]
  23. Nguyen, V.L.; Tran-Quoc, T.; Bacha, S. Harmonic distortion mitigation for electric vehicle fast charging systems. In Proceedings of the 2013 IEEE Grenoble Conference, Grenoble, France, 16–20 June 2013. [Google Scholar]
  24. Kutt, L.; Saarijarvi, E.; Lehtonen, M.; Molder, H.; Niitsoo, J. Current harmonics of EV chargers and effects of diversity to charging load current distortions in distribution networks. In Proceedings of the 2013 International Conference on Connected Vehicles and Expo, Las Vegas, NV, USA, 2–6 December 2013; pp. 726–731. [Google Scholar]
  25. Kim, K.; Song, C.S.; Byeon, G.; Jung, H.; Kim, H.; Jang, G. Power demand and total harmonic distortion analysis for an EV charging station concept utilizing a battery energy storage system. J. Electr. Eng. Technol. 2013, 8, 1234–1242. [Google Scholar] [CrossRef] [Green Version]
  26. Lucas, A.; Bonavitacola, F.; Kotsakis, E.; Fulli, G. Grid harmonic impact of multiple electric vehicle fast charging. Electr. Power Syst. Res. 2015, 127, 13–21. [Google Scholar] [CrossRef]
  27. Deilami, S.; Masoum, A.S.; Moses, P.S.; Masoum, M.A.S. Voltage profile and THD distortion of residential network with high penetration of plug-in electrical vehicles. In Proceedings of the IEEE PES Innovative Smart Grid Technologies Conference Europe (ISGT Europe), Gothenberg, Sweden, 11–13 October 2010; pp. 1–6. [Google Scholar]
  28. Müller, S.; Möller, F.; Meyer, J.; Collin, A.J.; Djokic, S.Z. Characterisation of harmonic interactions between electric vehicle battery chargers and PV inverters. In Proceedings of the International Conference on Harmonics and Quality of Power (ICHQP), Bucharest, Romania, 25–28 May 2014; pp. 645–649. [Google Scholar]
  29. Misra, R.; Paudyal, S. Analysis and reduction of total harmonic distortions in distribution system with electric vehicles and wind generators. In Proceedings of the IEEE Power and Energy Society General Meeting, Denver, CO, USA, 26–30 July 2015. [Google Scholar]
  30. Malano, A.A.; Müller, S.; Meyer, J.; Bachmann, S. Harmonic interaction of electric vehicle chargers in a central charging infrastructure. In Proceedings of the 17th International Conference on Harmonics and Quality of Power (ICHQP), Belo Horizonte, Brazil, 16–19 October 2016; pp. 367–372. [Google Scholar]
  31. Bollen, M.H.J.; Rönnberg, S.K. Hosting capacity of the power grid for renewable electricity production and new large consumption equipment. Energies 2017, 10, 1325. [Google Scholar] [CrossRef] [Green Version]
  32. Hu, C.; Song, Y.; Xu, Z.; Luo, Z.; Zhan, K.; Jia, L. Impacts and Utilization of Electric Vehicles Integration Into Power Systems. Proc. Chin. Soc. Electr. Eng. 2012, 32, 1–10. [Google Scholar]
  33. Sheng, Q.; Chen, M.; Li, Q.; Wang, Y.; Arshad Shehzad Hassan, M. Analysis for the Influence of Electric Vehicle Chargers with Different SOC on Grid Harmonics; Springer: Singapore, 2018; Volume 925, ISBN 978-981-13-2380-5. [Google Scholar]
  34. Xu, H.; Xia, X.; Liang, W.; Ouyang, F.; Zhu, W.; Li, H. Charging Harmonic Characteristic Analysis of Electric Vehicles Based on Simulation and Analytical Methods. In Proceedings of the 3rd Conference on Energy Internet and Energy System Integration (EI2), Changsha, China, 8–10 November 2019; pp. 1166–1171. [Google Scholar]
  35. Alame, D.; Azzouz, M.; Kar, N.C. Impact assessment of electric vehicle charging on distribution transformers including state-of-charge. In Proceedings of the 61st International Midwest Symposium on Circuits and Systems (MWSCAS), Windsor, ON, Canada, 5–8 August 2018; pp. 607–610. [Google Scholar]
  36. Liu, Y.; Li, Y.; Ren, J.; Wang, S.; Li, L. A data-driven harmonic modeling method for electric vehicle charging station. In Proceedings of the 25th International Conference on Electricity Distribution, Madrid, Spain, 3–6 June 2019; pp. 3–6. [Google Scholar]
  37. Zimmerman, N.; Bass, R. Impacts of Electric Vehicle Charging on Electric Power Distribution Systems; Oregon Transportation Research and Education Consortium: Portland, OR, USA, 2013; Volume OTREC-SS-731. [Google Scholar]
  38. International Electrotechnical Commission. IEC 61000-3-2 ed. 4 Electromagnetic Compatibility (EMC)—Part 3-2: Limits—Limits for Harmonic Current Emissions (Equipment Input Current ≤16 A per Phase); International Electrotechnical Commission: Geneva, Switzerland, 2014.
  39. International Electrotechnical Commission. IEC 61000-3-12 ed. 2 Electromagnetic Compatibility (EMC)—Part 3-12: Limits—Limits for Harmonic Currents Produced by Equipment Connected to Public Low-Voltage Systems with Input Current >16 A and ≤75 A per Phase; International Electrotechnical Commission: Geneva, Switzerland, 2011.
  40. Euopean Standard EN 50160 ed. 3—Voltage Characteristics of Electricity Supplied by Public Distribution Networks; CENELEC: Brussels, Belgium, 2010.
  41. Vinnal, T.; Kutt, L.; Jarkovoi, M. Harmonic Currents and Voltages in Industrial LV Networks—Case Studies. In Proceedings of the 2018 International Symposium on Power Electronics, Electrical Drives, Automation and Motion (SPEEDAM), Amalfi, Italy, 20–22 June 2018; pp. 177–182. [Google Scholar]
  42. Staats, P.T.; Grady, W.M.; Arapostathis, A.; Thallam, R.S. A Statistical Method for Predicting the Net Harmonic Currents Generated by a Concentration of Electric Vehicle Battery Chargers. IEEE Trans. Power Deliv. 1997, 12, 1258–1266. [Google Scholar] [CrossRef]
  43. Staats, P.T.; Grady, W.M.; Arapostathis, A.; Thallam, R.S. A statistical analysis of the effect of electric vehicle battery charging on distribution system harmonic voltages. IEEE Trans. Power Deliv. 1998, 13, 640–645. [Google Scholar] [CrossRef]
  44. Au, M.T.; Milanović, J.V. Development of stochastic aggregate harmonic load model based on field measurements. IEEE Trans. Power Deliv. 2007, 22, 323–330. [Google Scholar] [CrossRef]
  45. Ćuk, V.; Cobben, J.F.G.; Kling, W.L.; Ribeiro, P.F. Analysis of harmonic current summation based on field measurements. IET Gener. Transm. Distrib. 2013, 7, 1391–1400. [Google Scholar] [CrossRef]
  46. Xiao, Y.; Yang, X. Harmonic summation and assessment based on probability distribution of phase angle. In Proceedings of the 15th International Conference on Harmonics and Quality of Power, Hong Kong, China, 17–20 June 2012; pp. 581–584. [Google Scholar]
  47. Blanco, A.M.; Meyer, J.; Schegner, P. Calculation of phase angle diversity for time-varying harmonic currents from grid measurement. In Proceedings of the International Conference on Renewable Energies and Power Quality, Cordoba, Spain, 8–10 April 2014; Volume 1, pp. 2–7. [Google Scholar]
  48. Yokogawa. Wt3001e/wt3002e/wt3003e/wt3004e Precision Power Analyzer—User’s Manual; Yokogawa Meters and Instruments Corporation: Tokyo, Japan, 2015. [Google Scholar]
  49. International Electrotechnical Commission Electromagnetic Compatibility (EMC) Part 4–7:Testing and Measurement Techniques—General Guide on Harmonics and Interharmonics Measurements and Instrumentation, for Power Supply Systems and Equipment Connected Thereto; International Electrotechnical Commission: Geneva, Switzerland, 2009.
  50. Lundengård, K. Generalized Vandermonde Matrices and Determinants in Electromagnetic Compatibility. Licentiate Thesis, Mälardalen University, Västerås, Sweden, 2017. [Google Scholar]
  51. Lundengård, K. Extreme Points of the Vandermonde Determinant and Phenomenological Modelling with Power Exponential Functions. Ph.D. Thesis, Mälardalen University, Västerås, Sweden, 2019. [Google Scholar]
  52. Lundengård, K.; Rančić, M.; Javor, V.; Silvestrov, S. Application of the multi-peaked analytically extended function to representation of some measured lightning currents. Serb. J. Electr. Eng. 2016, 13, 145–155. [Google Scholar] [CrossRef]
  53. Javor, V. New function for representing IEC 61000-4-2 standard electrostatic discharge current. Facta Univ. Ser. Electron. Energ. 2014, 27, 509–520. [Google Scholar] [CrossRef]
  54. MATLAB and Optimization Toolbox Release R2019a; The Math Works, Inc.: Natick, MA, USA, 2019.
  55. Coleman, T.F.; Li, Y. On the convergence of reflective Newton methods for nonlinear minimization subject to bounds. Math. Progr. 1994, 67, 189–224. [Google Scholar] [CrossRef]
  56. Coleman, T.F.; Li, Y. An Interior Trust Region Approach for Nonlinear Minimization Subject to Bounds. Siam J. Optim. 1996, 6, 418–445. [Google Scholar] [CrossRef] [Green Version]
Figure 1. Measurement of fifth harmonic-current phase angle (I5 leads Up1 α5 > 0) [39].
Wevj 11 00051 g001
Figure 2. Measurement setup.
Wevj 11 00051 g002
Figure 3. Grid configuration.
Wevj 11 00051 g003
Figure 4. Third current harmonic during electric-vehicle (EV) charging of (a) EV1, (b) EV2, (c) EV3, and (d) EV4.
Wevj 11 00051 g004aWevj 11 00051 g004b
Figure 5. Illustration of how steepness and slopes of power exponential function varies with p [51].
Wevj 11 00051 g005
Figure 6. Some examples of what g ( t ; t 1 , t 2 , p 1 , p 2 , p 3 ) function can look like in interval [ t 1 , t 2 ] .
Wevj 11 00051 g006
Figure 7. Example of third current harmonic during (blue) charging of EV1 with (orange) fitted function.
Wevj 11 00051 g007
Figure 8. Third current-harmonic simulation of aggregated electric vehicle loads (100,000 random simulations). Current magnitude and phase angle during circumstances when maximal current-harmonic magnitude was obtained. Maximal number of simultaneous charging vehicles was set to six. Polar plot visualizes how magnitude and phase angle continuously changed over time.
Wevj 11 00051 g008
Table 1. Technical and measurement data of vehicles included in the study. Note: THC, total harmonic current.
EV 1EV 2EV 3EV 4
Battery capacity (kWh) 18.82424.218.7
Motor engine power (kW) 125808560
Maximum charging power (kW) 7.36.73.63.6
Charging current (A)Mean20.916.713.314.5
THC (A)Mean1.130.790.560.58
Table 2. Uncertainty requirements for current measurements (CLASS I instruments) [49]. Inom, nominal range of power-quality (PQ) instrument; Im, measured value.
MeasurementConditionsMaximum Error (±ε)
CurrentIm ≥ 3% of Inom ±5% of Im
Im < 3% of Inom±0.15% of Inom
Table 3. Third–eleventh current-harmonic simulation results. Note: SOC, state of charge.
Harmonic Order357911
Imax (A)6.892.521.611.881.26
Time (min) at Imax400437439598354
Phase-angle location (Quadrant)Second and thirdSecond and thirdFirst and secondThirdSecond
Charging start time (min)SOC (%)Charging start time (min)SOC (%)Charging start time (min)SOC (%)Charging start time (min)SOC (%)Charging start time (min)SOC (%)
EV1 (1)22930–4035670–8039770–8050830–4028950–60
EV1 (2)28170–8032930–4032970–80Not charging34950–60
EV1 (3)28850–6028050–6031630–40Not charging28360–70
EV1 (4)27760–7042760–7039580–9051750–6033180–90
EV2 (1)Not charging30936–40Not chargingNot charging73660–70
EV2 (2)35740–5030290–10058690–100Not chargingNot charging
EV2 (3)25136–40Not charging31590–100Not charging5140–50
EV2 (4)Not chargingNot chargingNot chargingnot chargingNot charging
EV3 (1)Not chargingNot chargingNot charging37340–50Not charging
EV3 (2)Not chargingNot chargingNot charging52870–80Not charging
EV3 (3)Not chargingNot chargingNot chargingNot chargingNot charging
EV3 (4)Not chargingNot chargingNot chargingNot chargingNot charging
EV4 (1)Not chargingNot chargingNot charging47280–90Not charging
EV4 (2)Not chargingNot chargingNot charging58750–60Not charging
EV4 (3)Not chargingNot chargingNot chargingNot chargingNot charging
EV4 (4)Not chargingNot chargingNot chargingNot chargingNot charging

