

NeXtFusion: Attention-Based Camera-Radar Fusion Network for Improved Three-Dimensional Object Detection and Tracking


Abstract
:1. Introduction
2. Literature Review on Relevant Studies
2.1. Camera-Based Object Detection
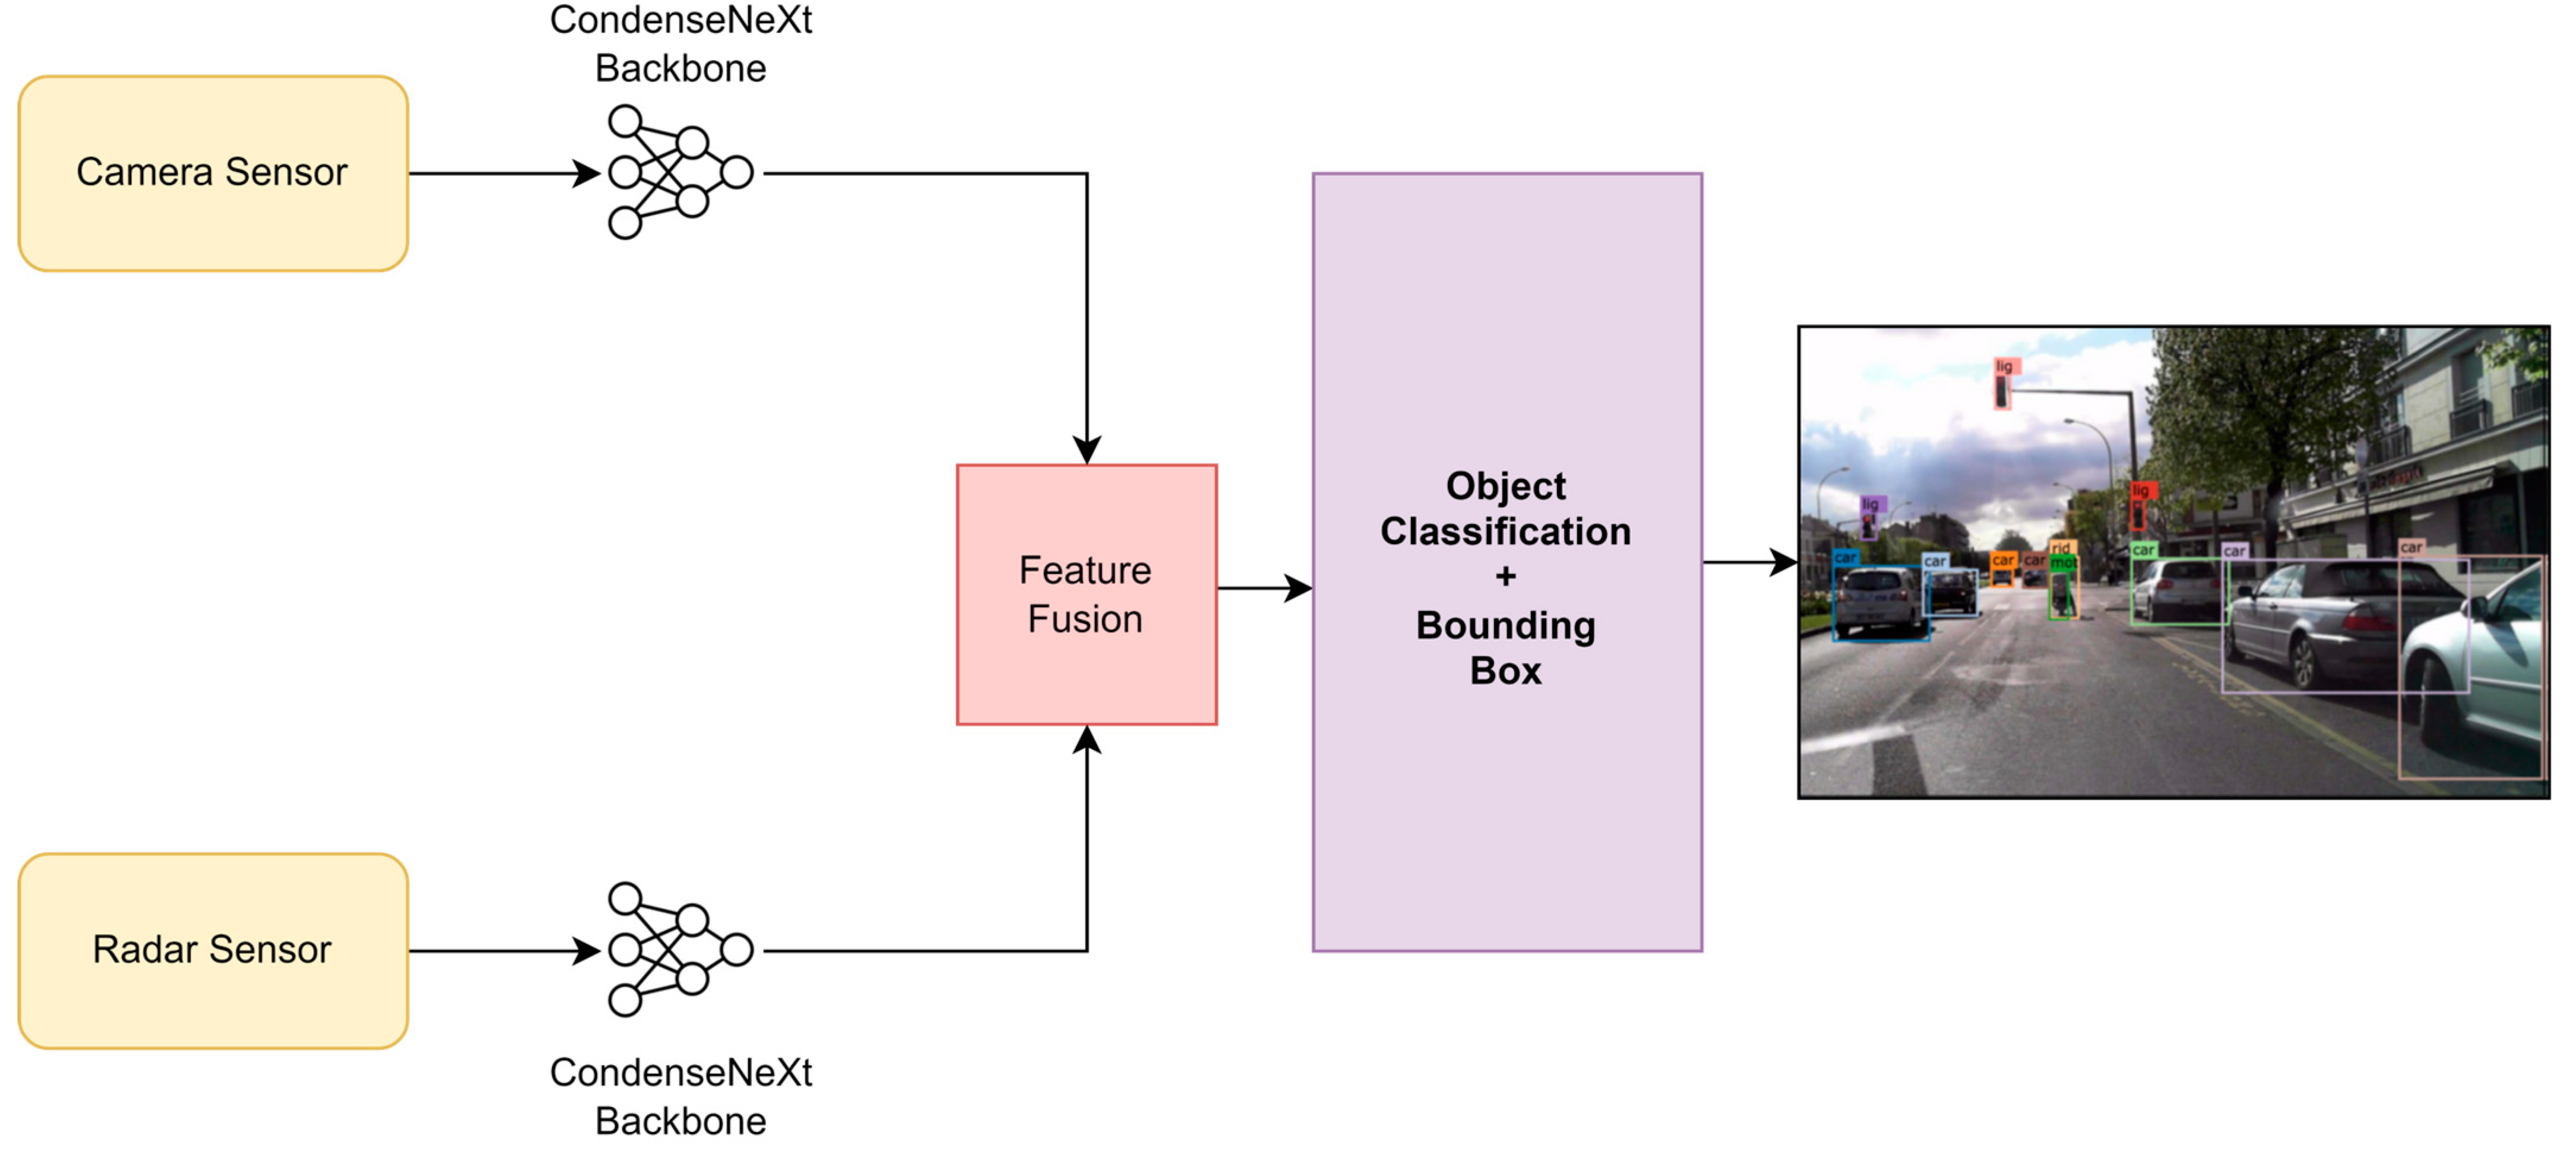
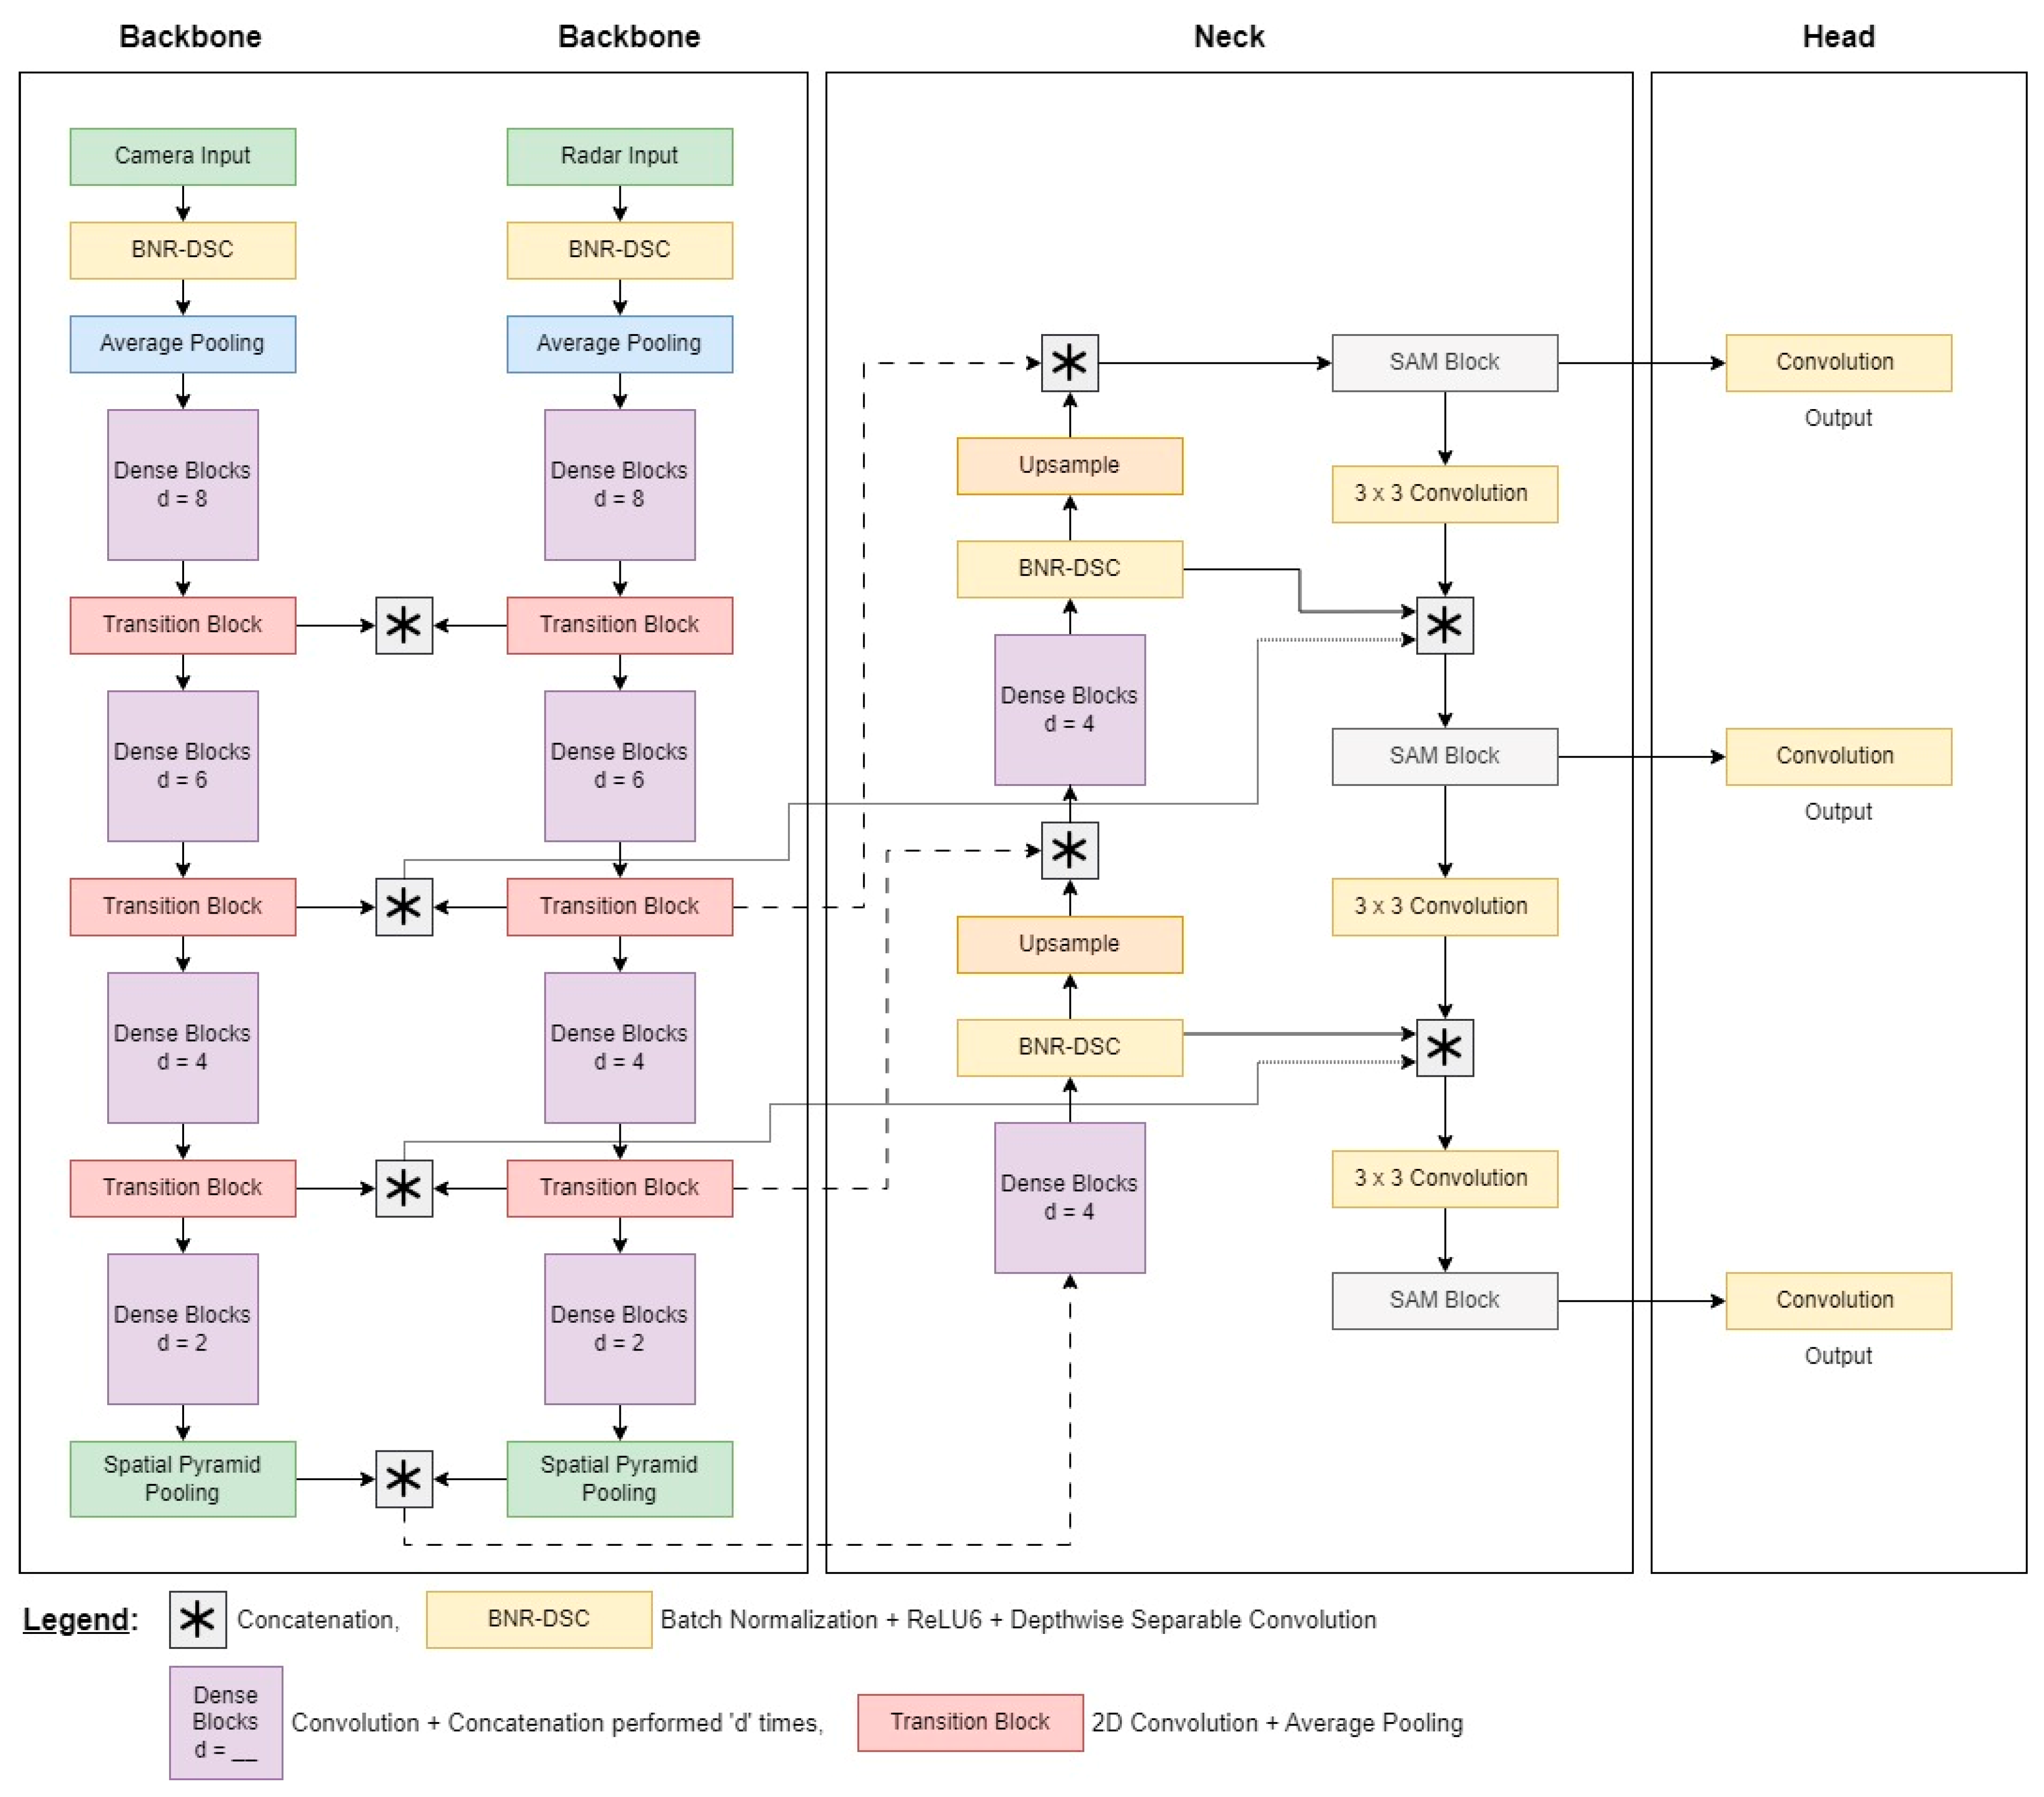
- Backbone: This module acts as the foundation, extracting salient features from the image and producing a compressed representation through a robust image classifier. Imagine it like a skilled photographer capturing the essence of a scene.
- Neck: This module acts as the bridge, connecting the backbone and skillfully merging features extracted from different levels of the backbone. Consider it like a data sculptor, gathering and harmonizing different perspectives to create a richer understanding.
- Head: This module is the decision maker responsible for drawing bounding boxes around objects and classifying their types. Think of it as a detective, analyzing the combined information and identifying what each object is and where it lies.
2.2. Radar Point Cloud and Camera-Based Sensor Fusion for Object Detection
3. The Proposed NeXtFusion 3D Object Detection Network
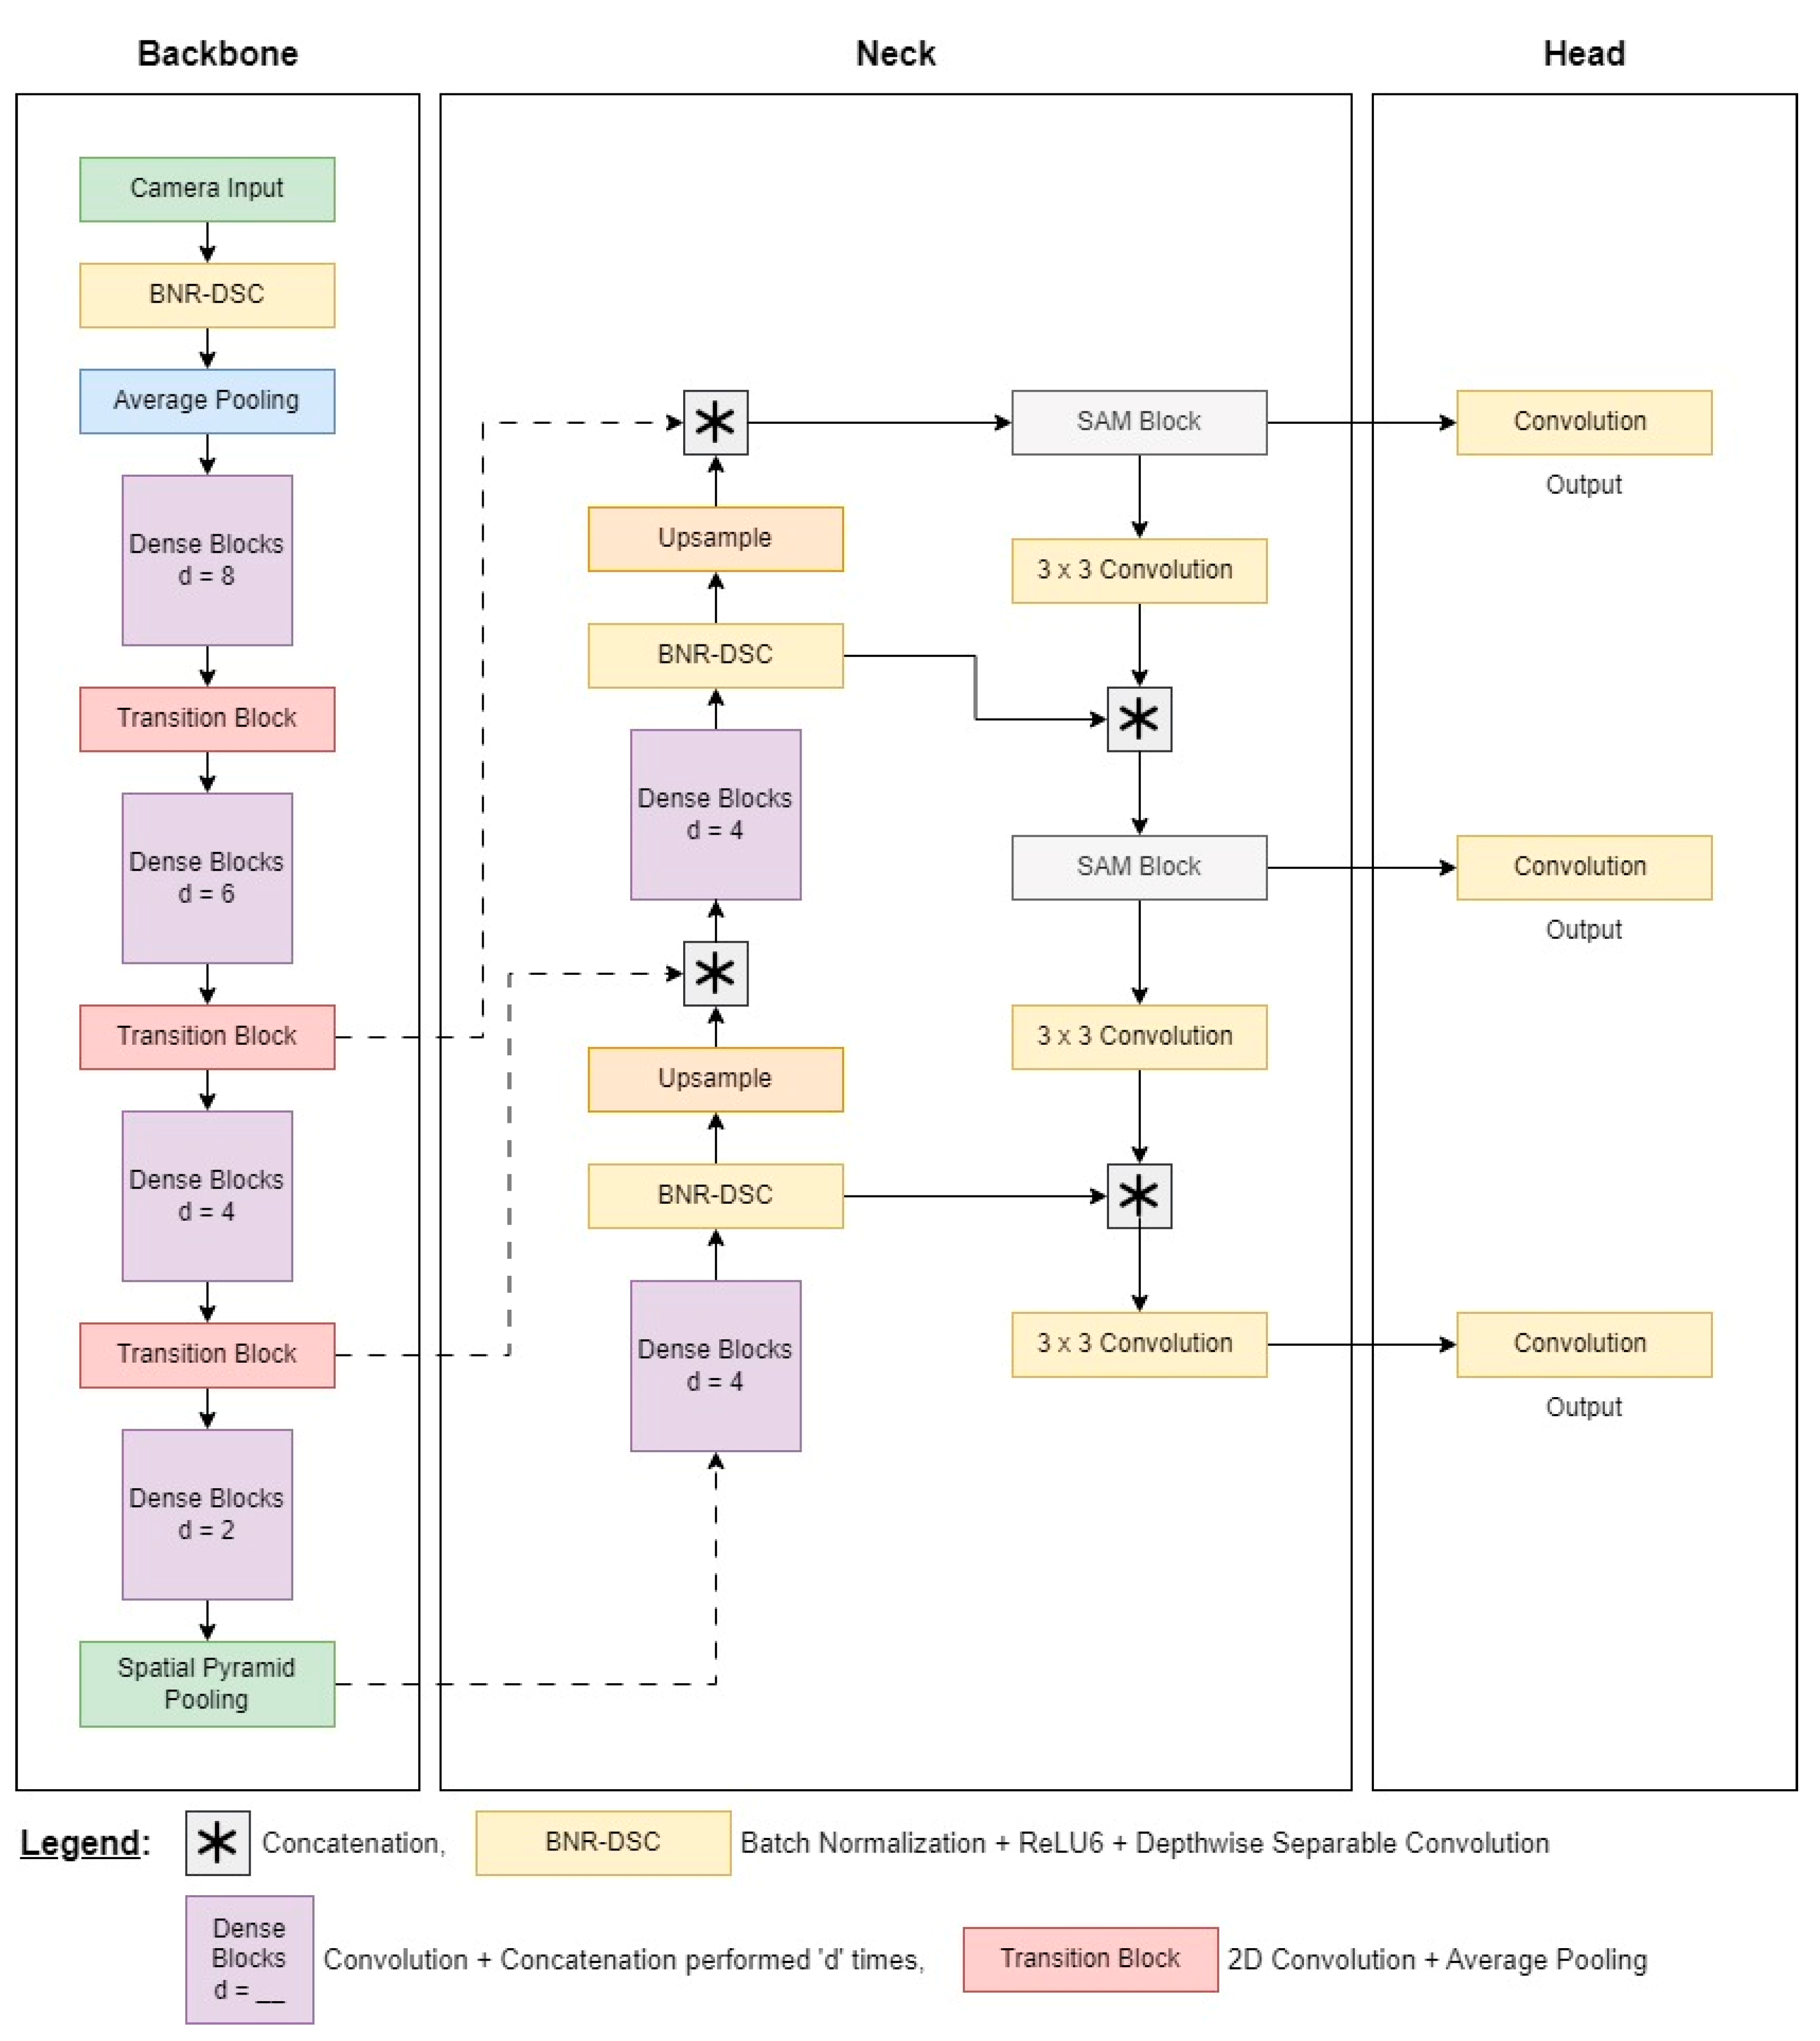
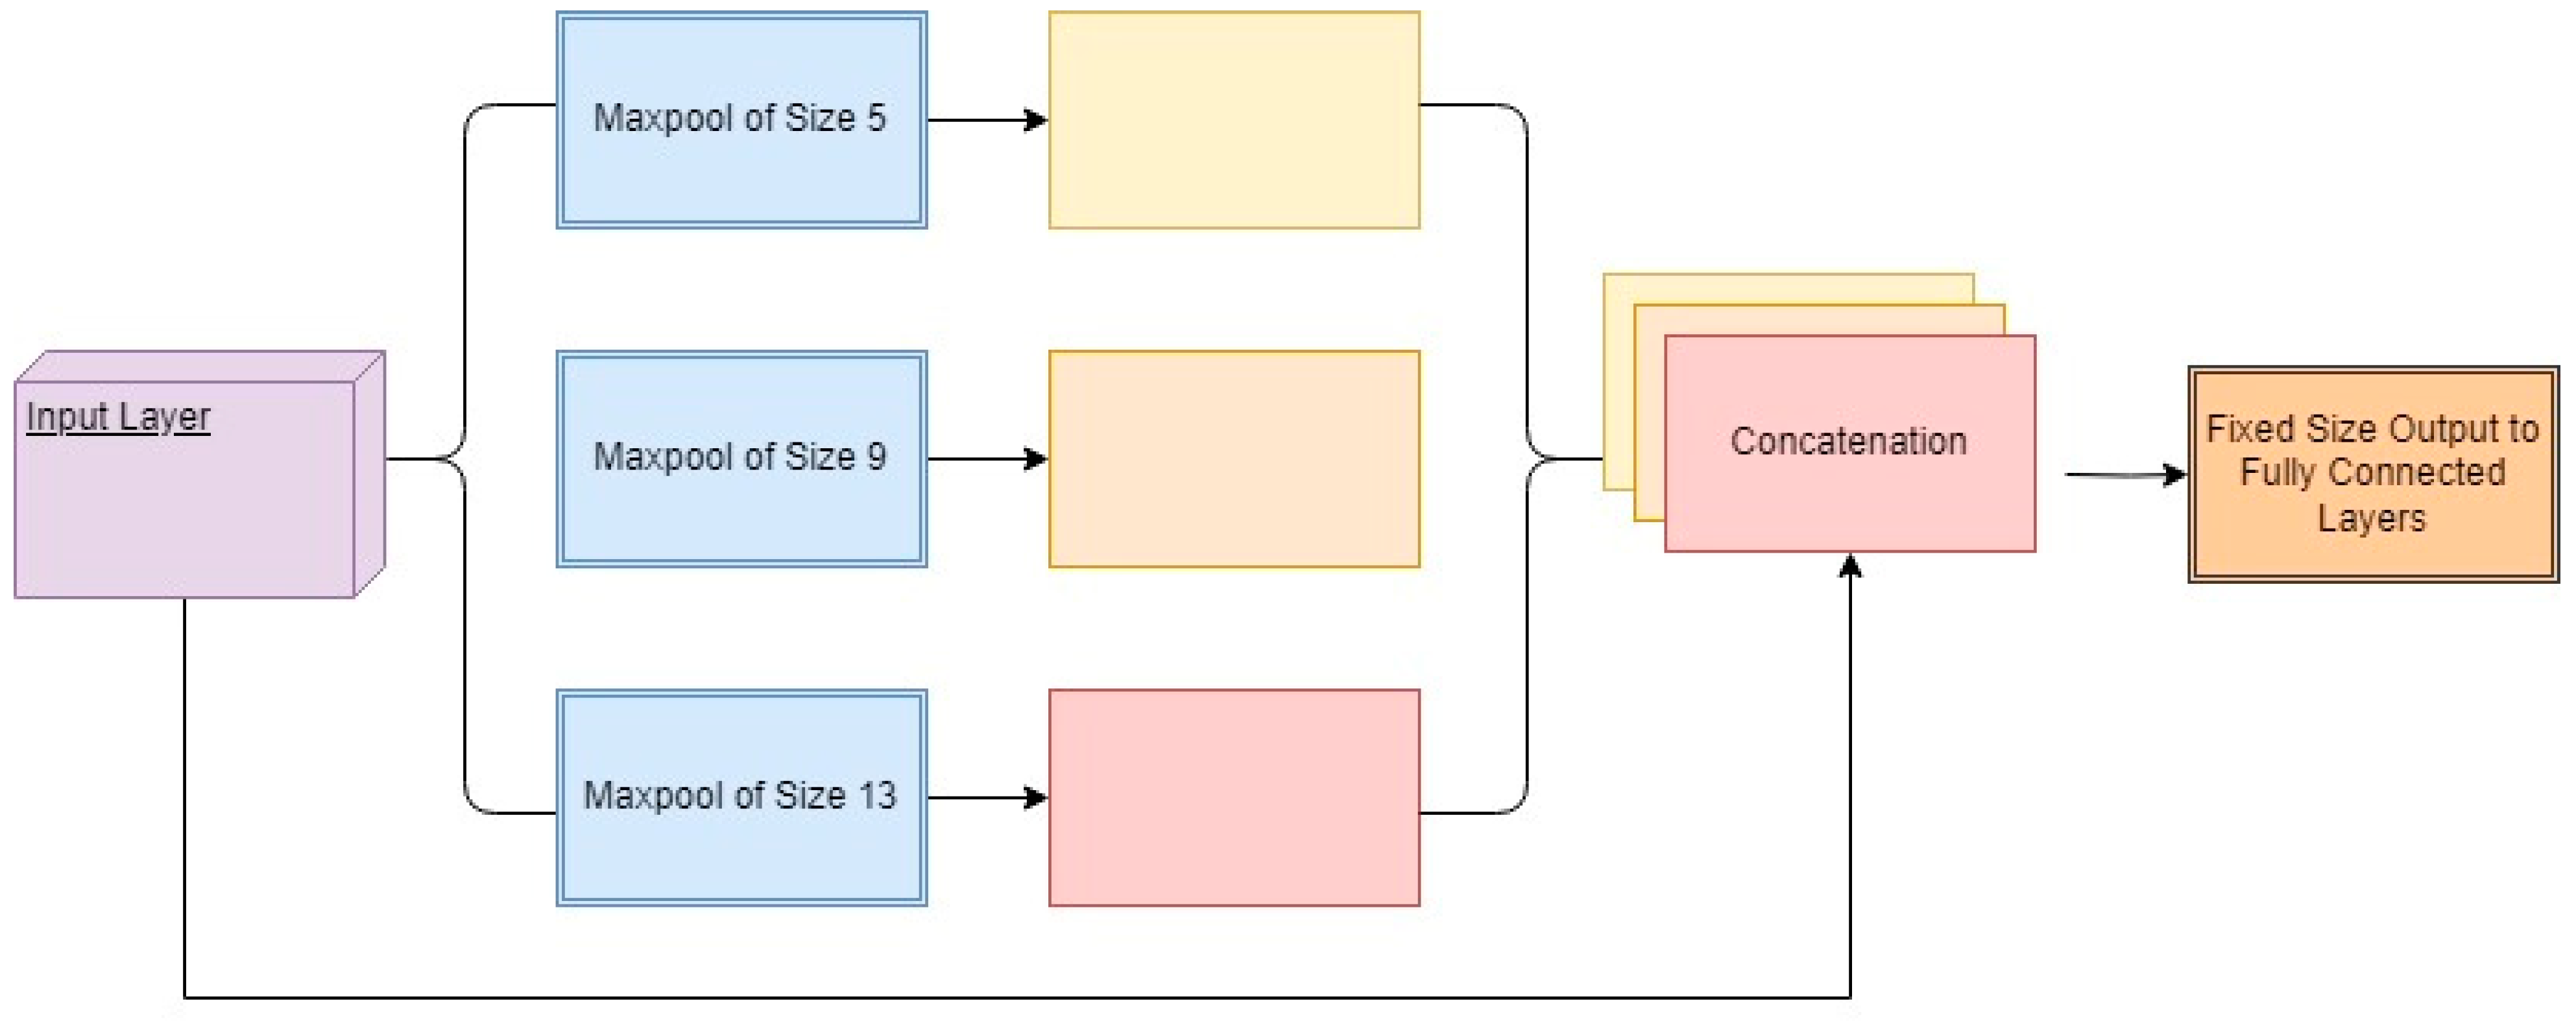
3.1. Backbone
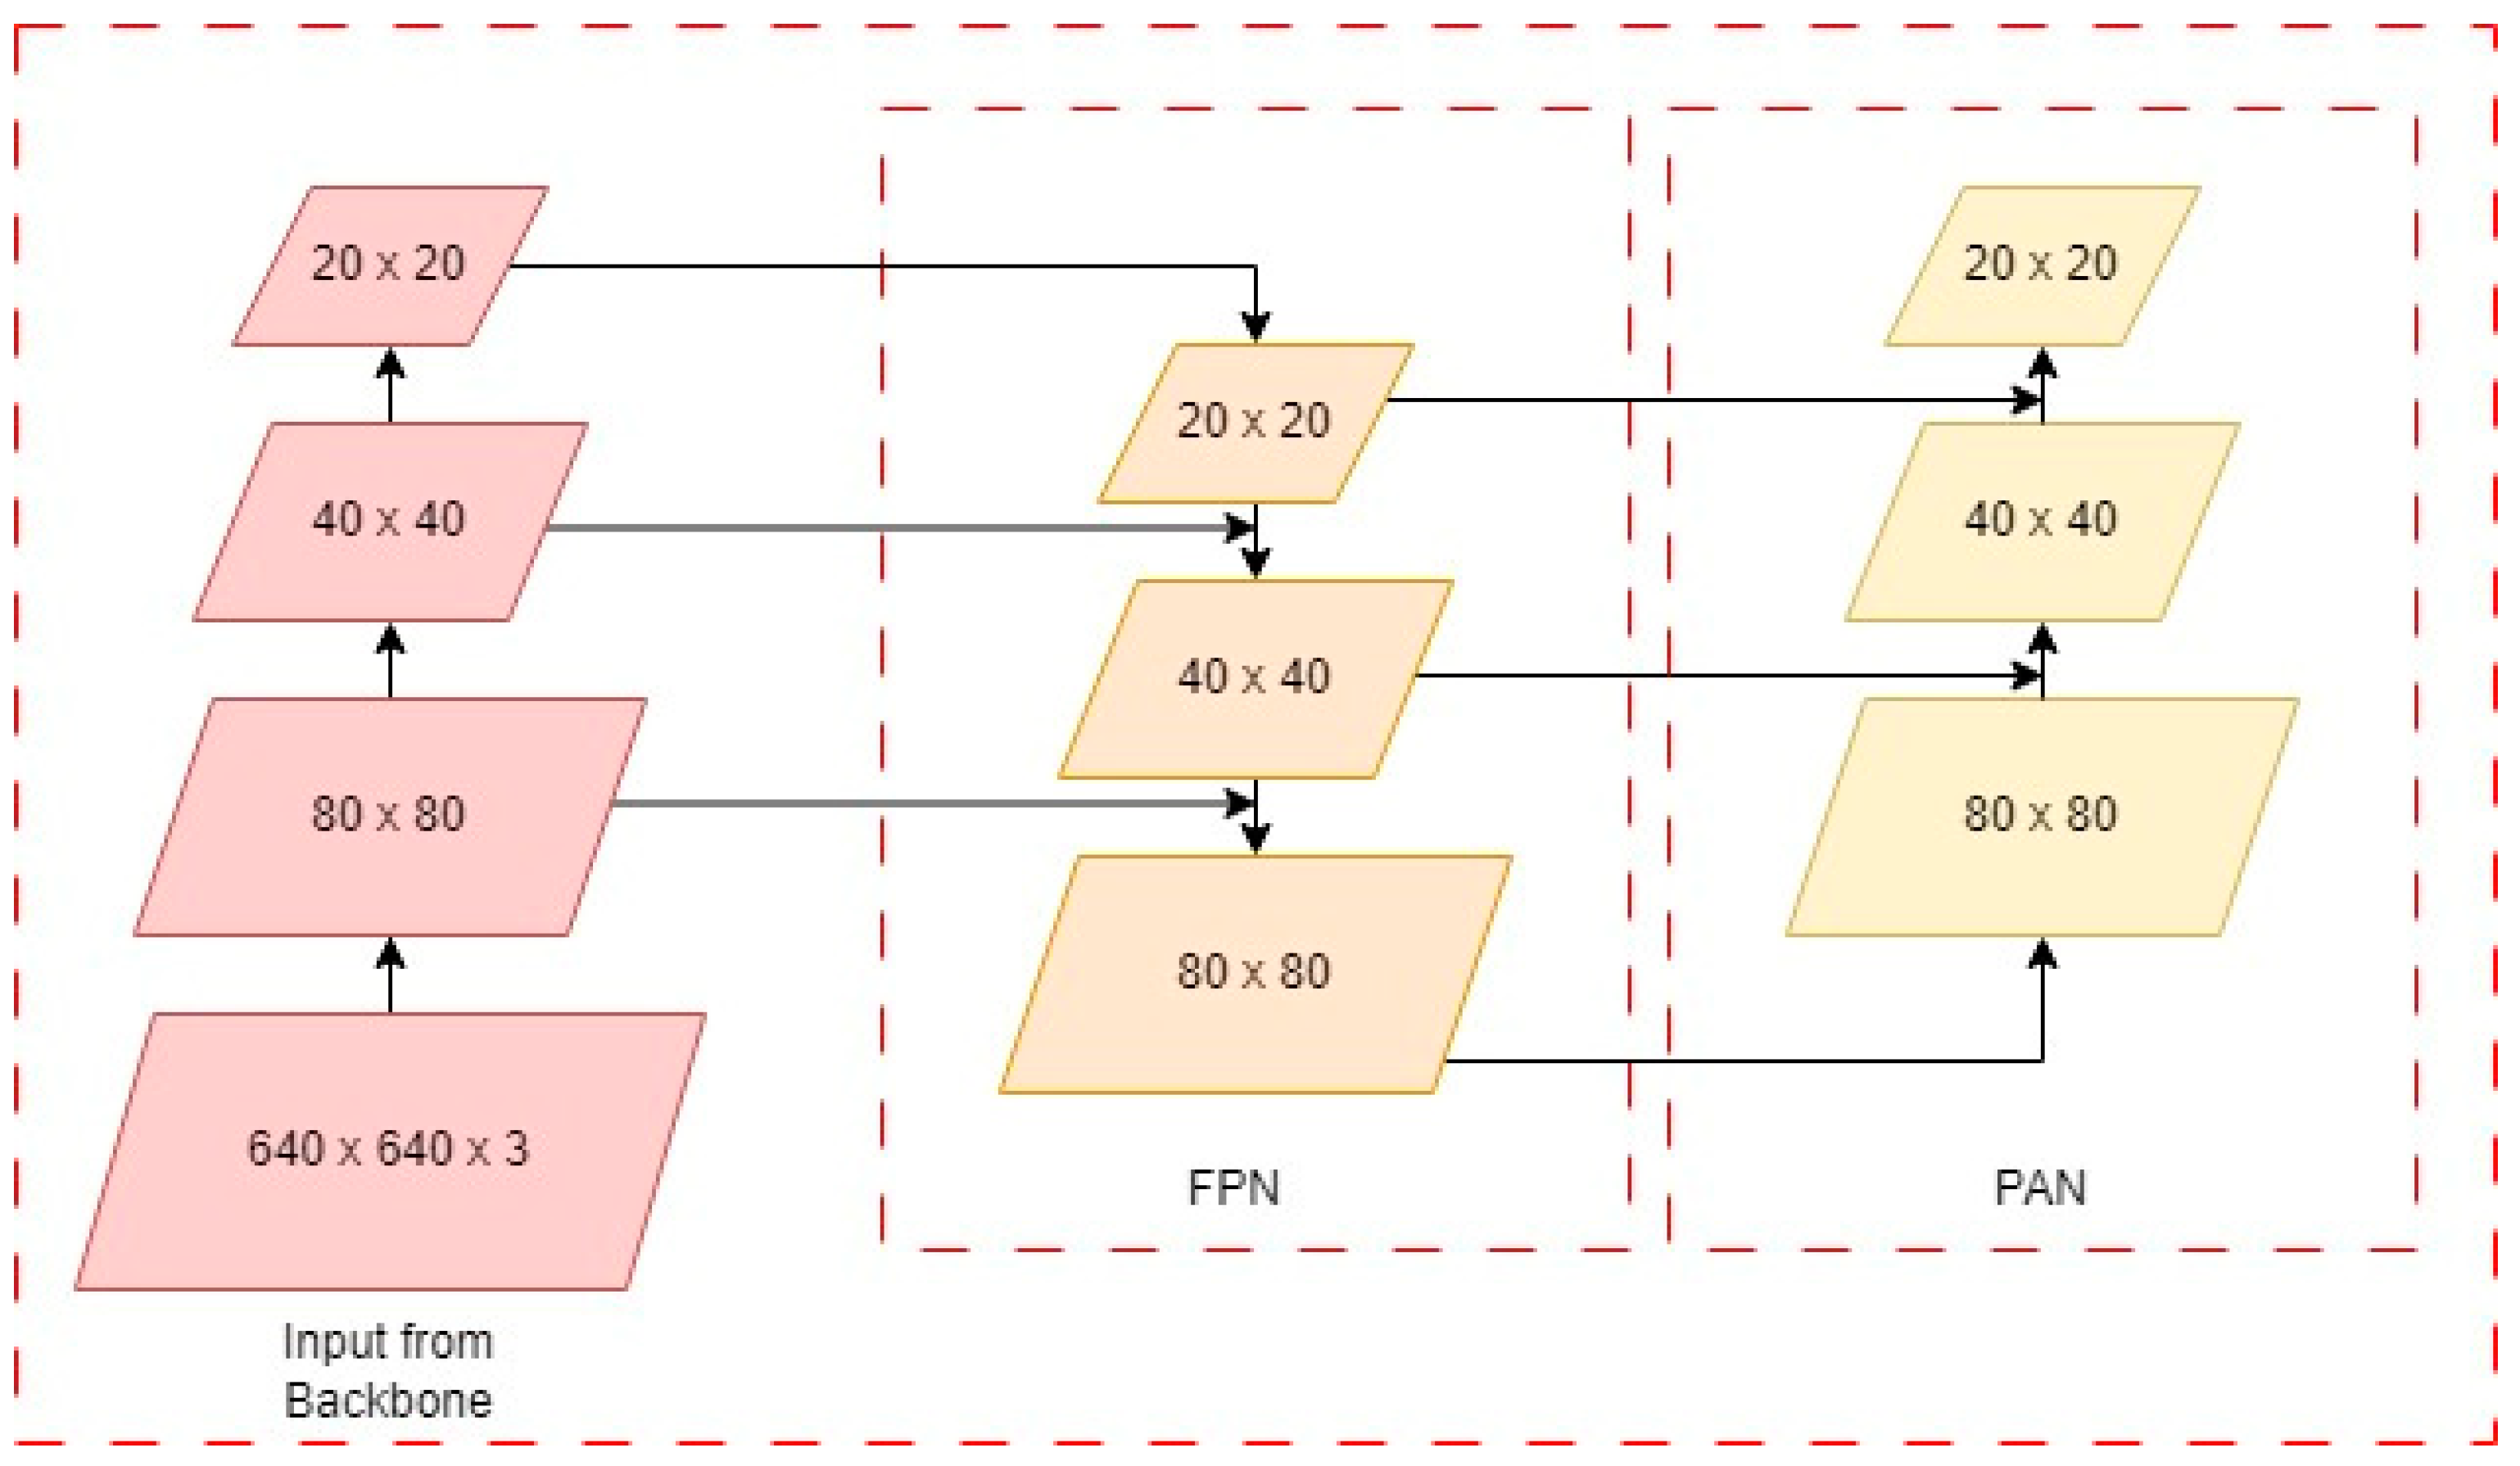
3.2. Neck
3.3. Head
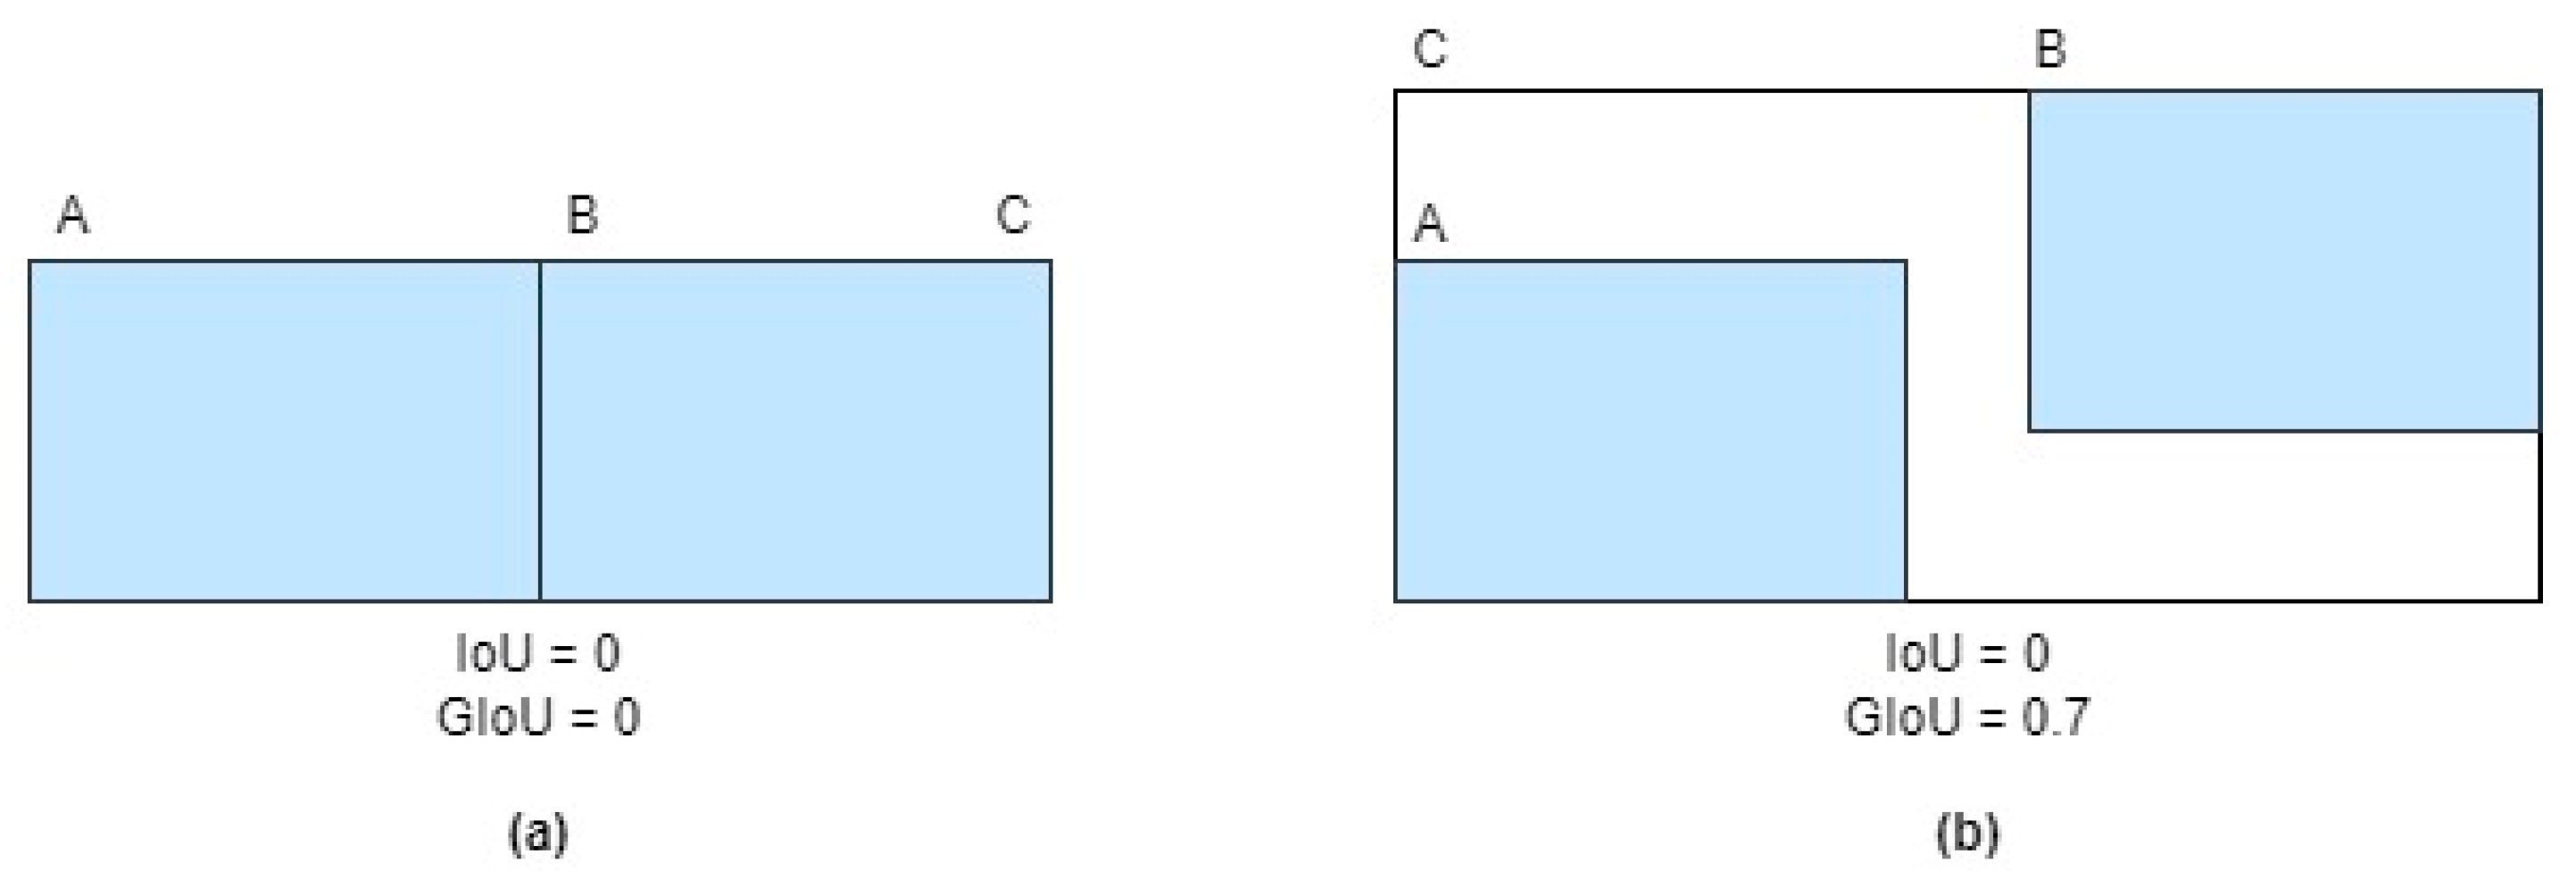
3.4. Bounding-Box Regression
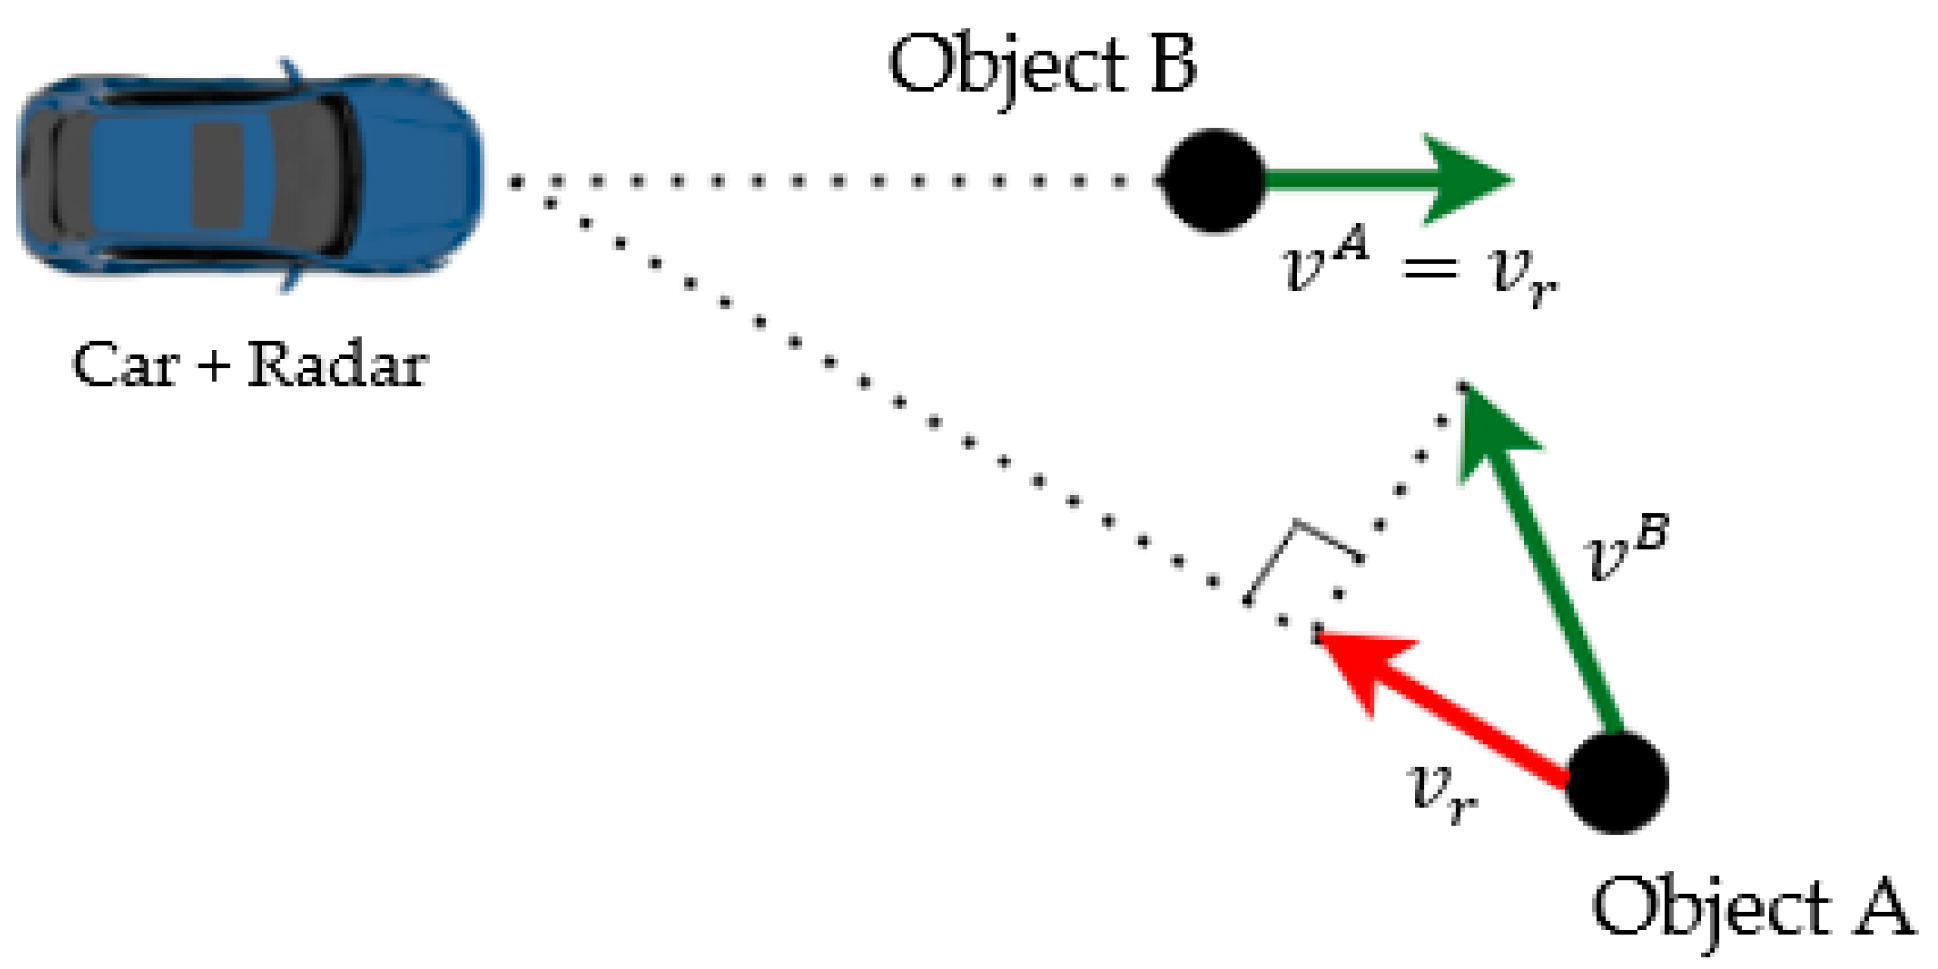
3.5. Extracting Radar Features
3.6. Assosciating Radar Data to the Image Plane
4. Experiments and Results
4.1. Dataset
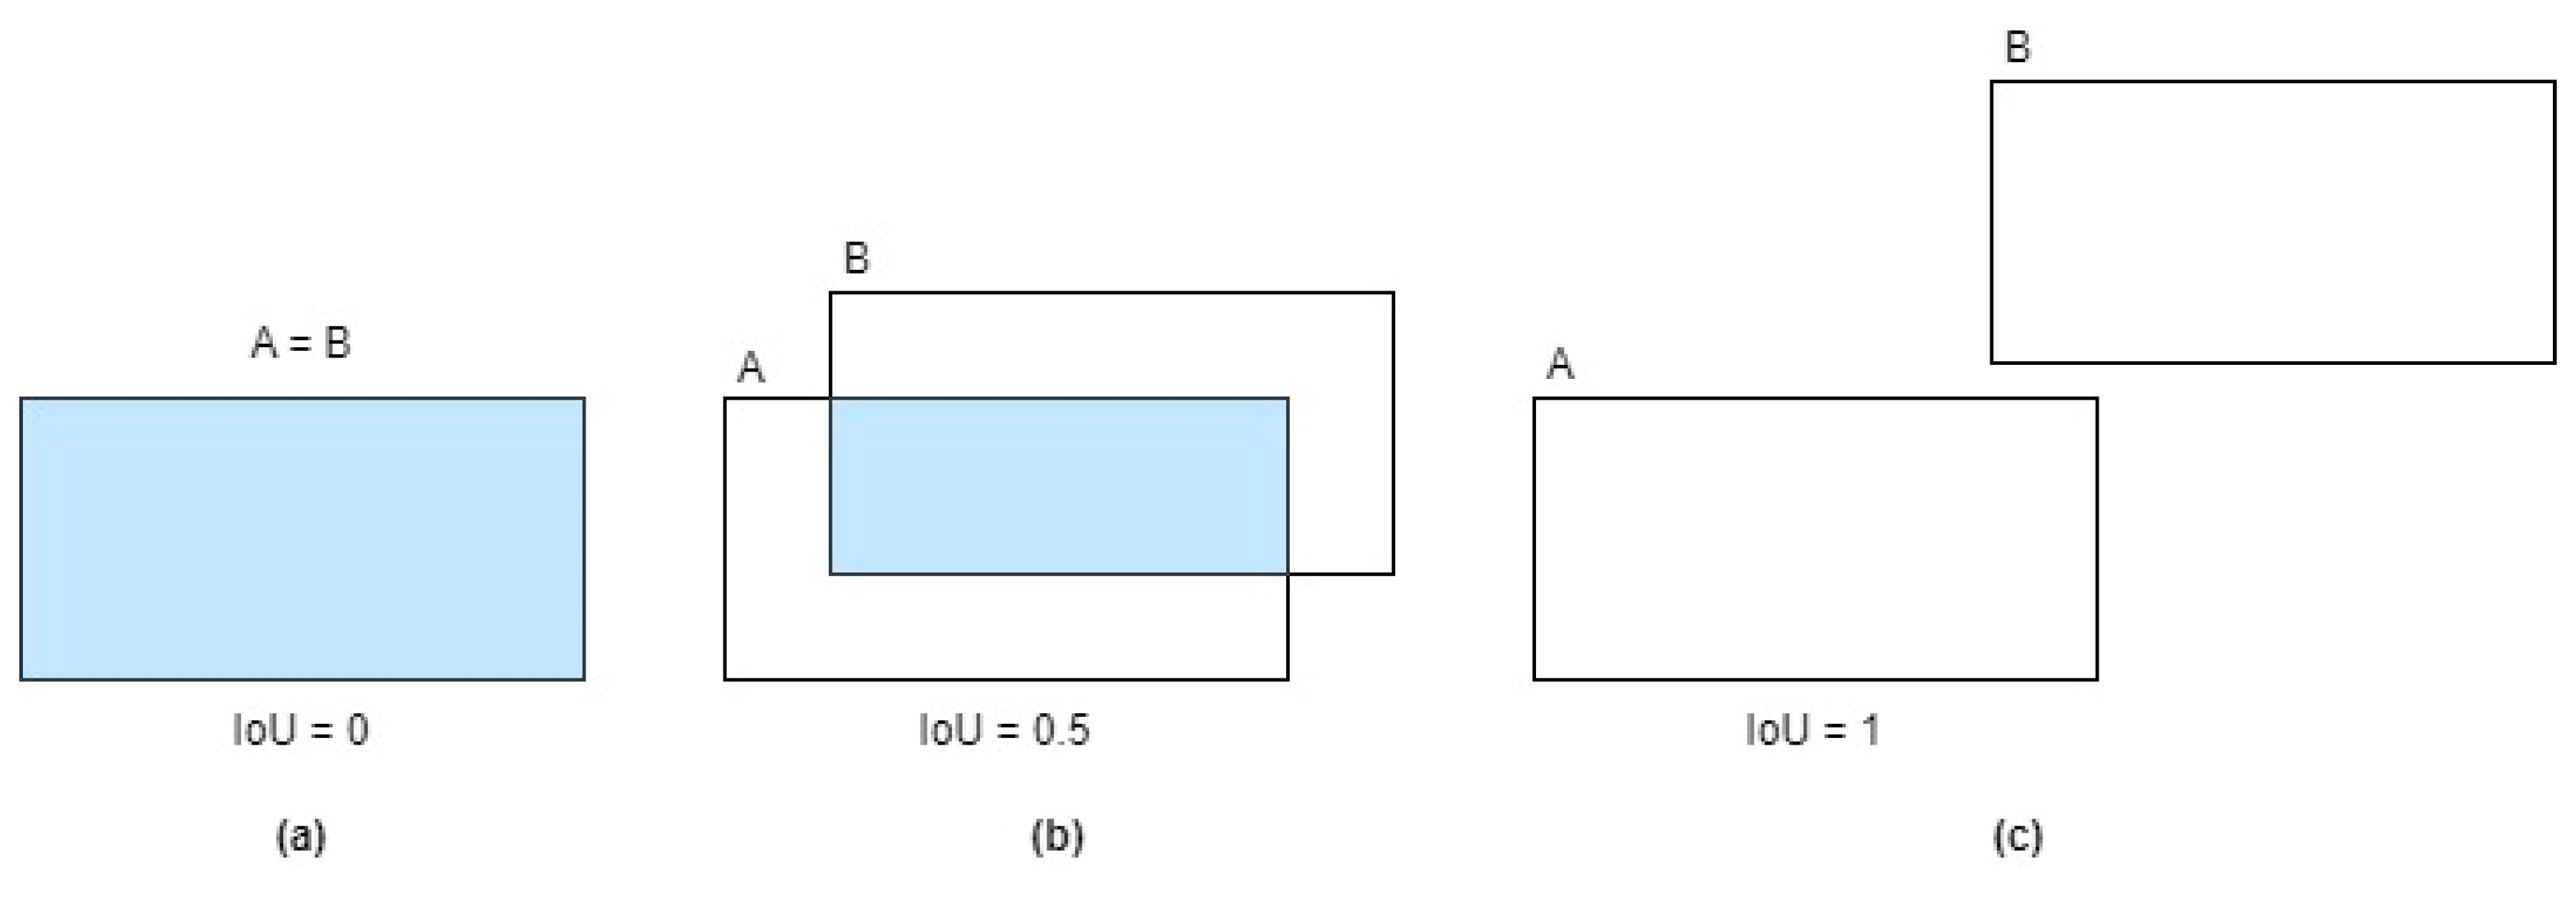
4.2. Evaluation Metrics
- True positive (TP) represents correctly identified objects where the predicted bounding box overlaps with the ground-truth box.
- False positive (FP) denotes erroneous detections where the predicted box has some overlap with the ground truth but falls, indicating an incorrect identification.
- False negative (FN) occurs when the model fails to detect a valid object present in the scene, resulting in a missed target.
- Mean average translation error (mATE): This metric represents the average Euclidean distance (in meters) between the predicted and ground-truth 3D translation (, , ) of an object across all objects and scenes in the dataset.
- Mean average scale error (mASE): This metric represents the average absolute difference between the predicted and ground-truth scale (measured as the product of length, width, and height) of an object across all objects and scenes.
- Mean average orientation error (mAOE): This metric represents the average minimum yaw angle difference (in radians) between the predicted and ground-truth orientation of an object across all objects and scenes. It is typically calculated on a per-class basis due to variations in object types.
- Mean average velocity error (mAVE): This metric represents the average absolute difference between the predicted and ground-truth velocity (magnitude in m/s) of an object across all objects and scenes. It is usually calculated on a per-class basis.
- Mean average attribute error (mAAE): This metric represents the average absolute difference between the predicted and ground-truth attributes (depending on the specific attribute considered) of an object across all objects and scenes. It is typically calculated on a per-class basis and depends on the specific set of attributes considered for the object category.
4.3. Training Infrastructure
- NVIDIA Tesla V100 GPU: Delivers high-performance graphics processing for efficient training.
- Intel Xenon Gold 6248 20-core CPU: Provides robust central processing power for computations.
- 1.92 TB solid-state drive: Ensures fast data storage and retrieval.
- 768 GB of RAM: Supports large model training and data handling.
- PyTorch 1.12.1: A deep-learning framework for model development and training.
- Python 3.7.9: The general-purpose programming language used for the research.
- CUDA 11.3: Enables efficient utilization of the NVIDIA GPUs for computations.
4.4. Experiment Results

| Object Detection Network | Training Dataset | Optimizer | Learning Rate | Batch Size | Weight Decay | Momentum | # of Epochs |
|---|---|---|---|---|---|---|---|
| OFT | Y | Adam | 0.0001 | 64 | 0.0005 | 0.85 | 400 |
| MonoDIS | Y | Adam | 0.0001 | 64 | 0.0005 | 0.85 | 400 |
| InfoFocus | Y | Adam | 0.0001 | 64 | 0.0005 | 0.85 | 400 |
| NeXtFusion | Y | Adam | 0.0001 | 64 | 0.0005 | 0.85 | 400 |
| Object Detection Network | Validation Dataset | ||||||
|---|---|---|---|---|---|---|---|
| OFT | Y | 0.122 | 0.819 | 0.359 | 0.848 | 1.727 | 0.479 |
| MonoDIS | Y | 0.301 | 0.737 | 0.266 | 0.544 | 1.531 | 0.140 |
| InfoFocus | Y | 0.396 | 0.361 | 0.263 | 1.130 | 0.617 | 0.394 |
| NeXtFusion | Y | 0.473 | 0.449 | 0.261 | 0.534 | 0.538 | 0.139 |
4.5. Ablation Studies
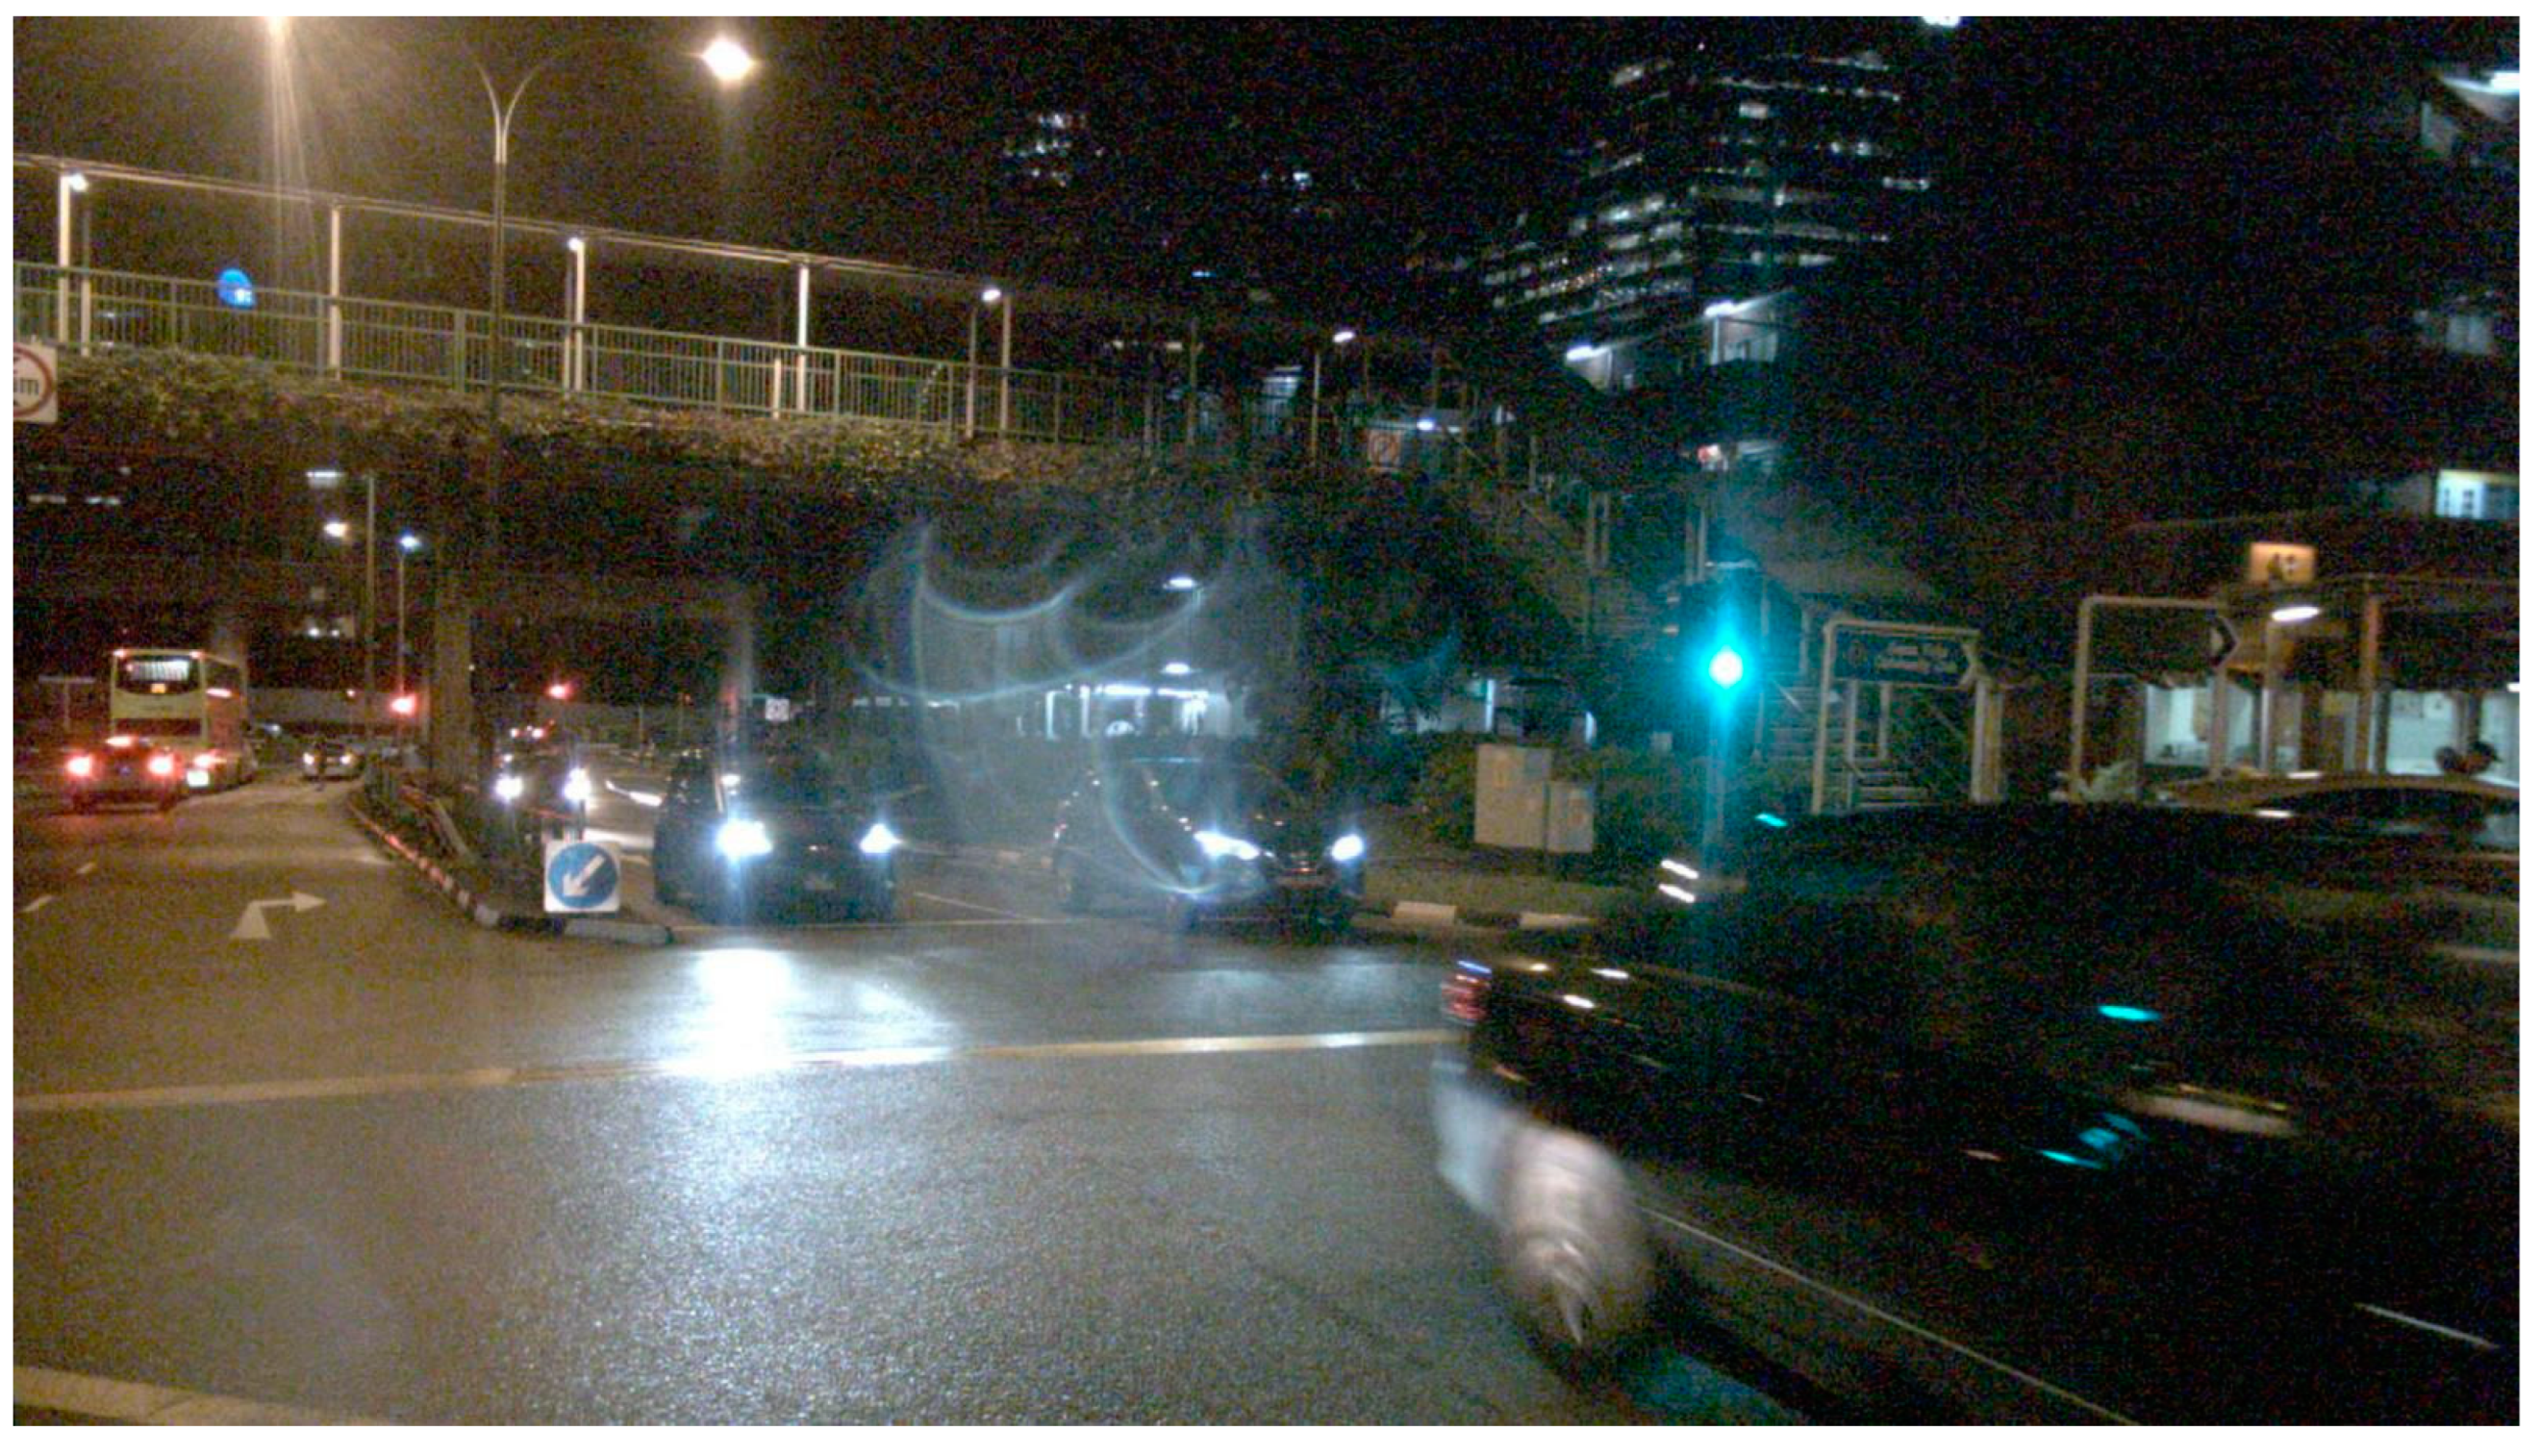
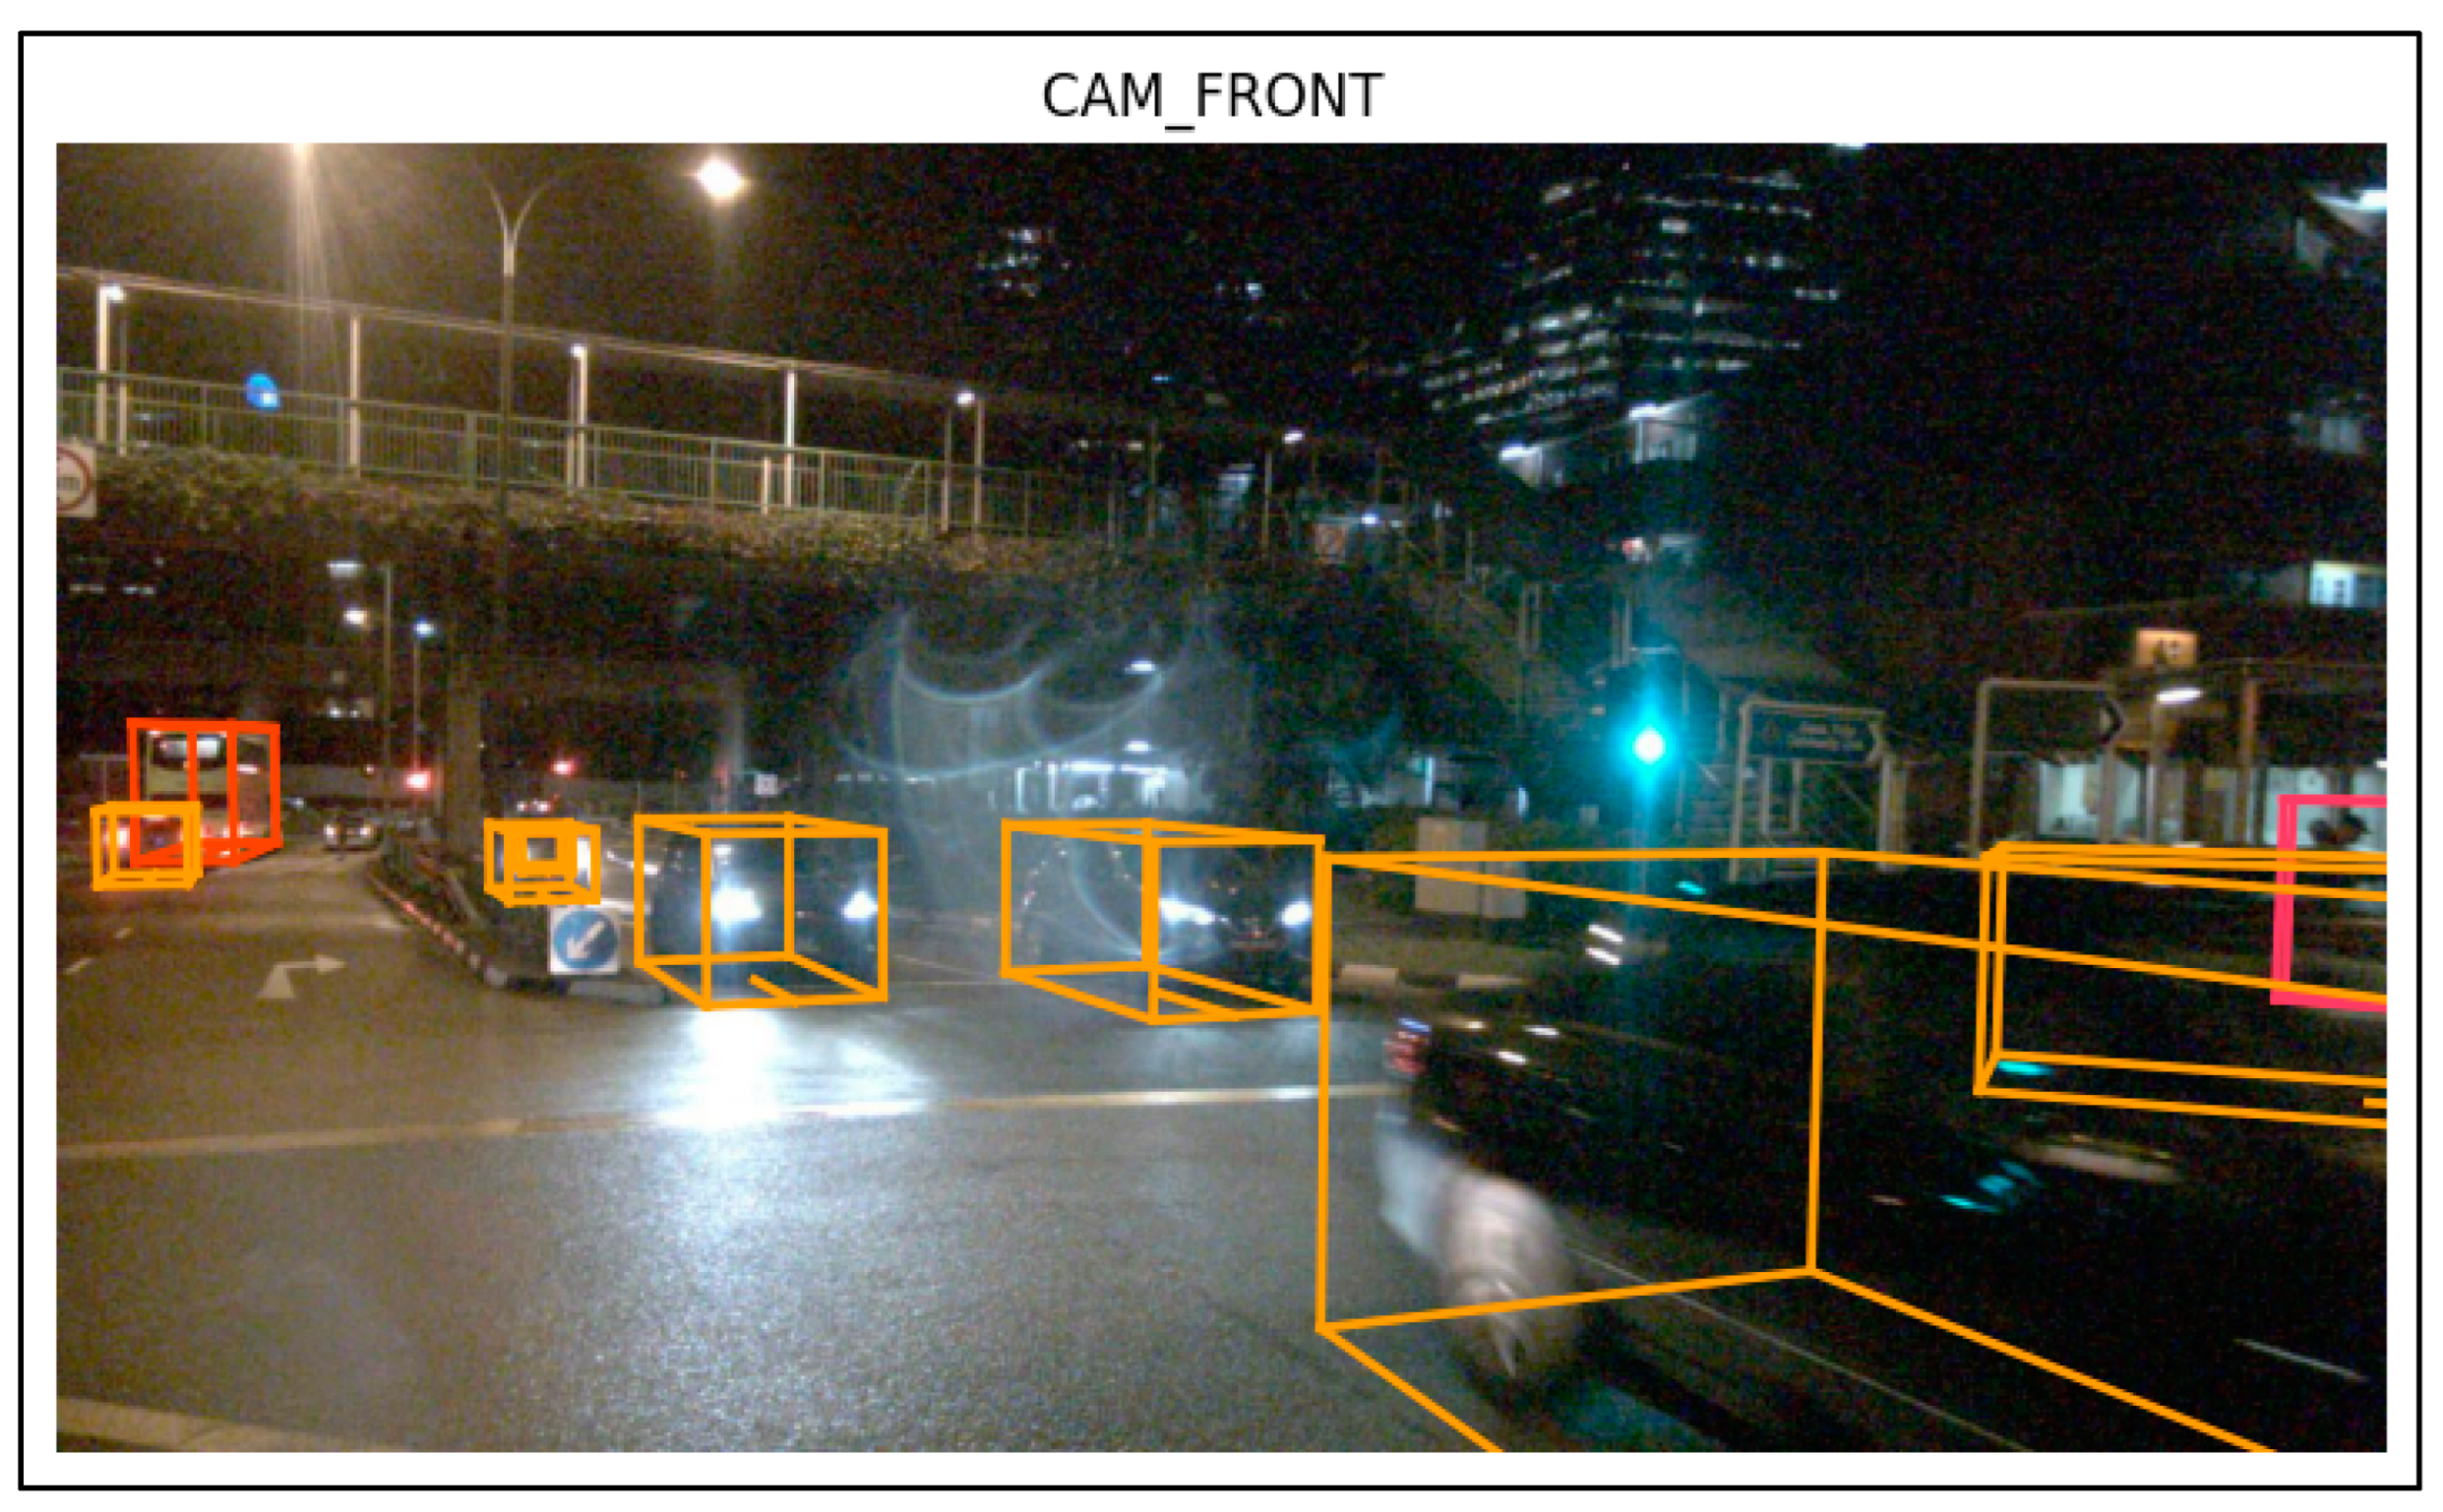
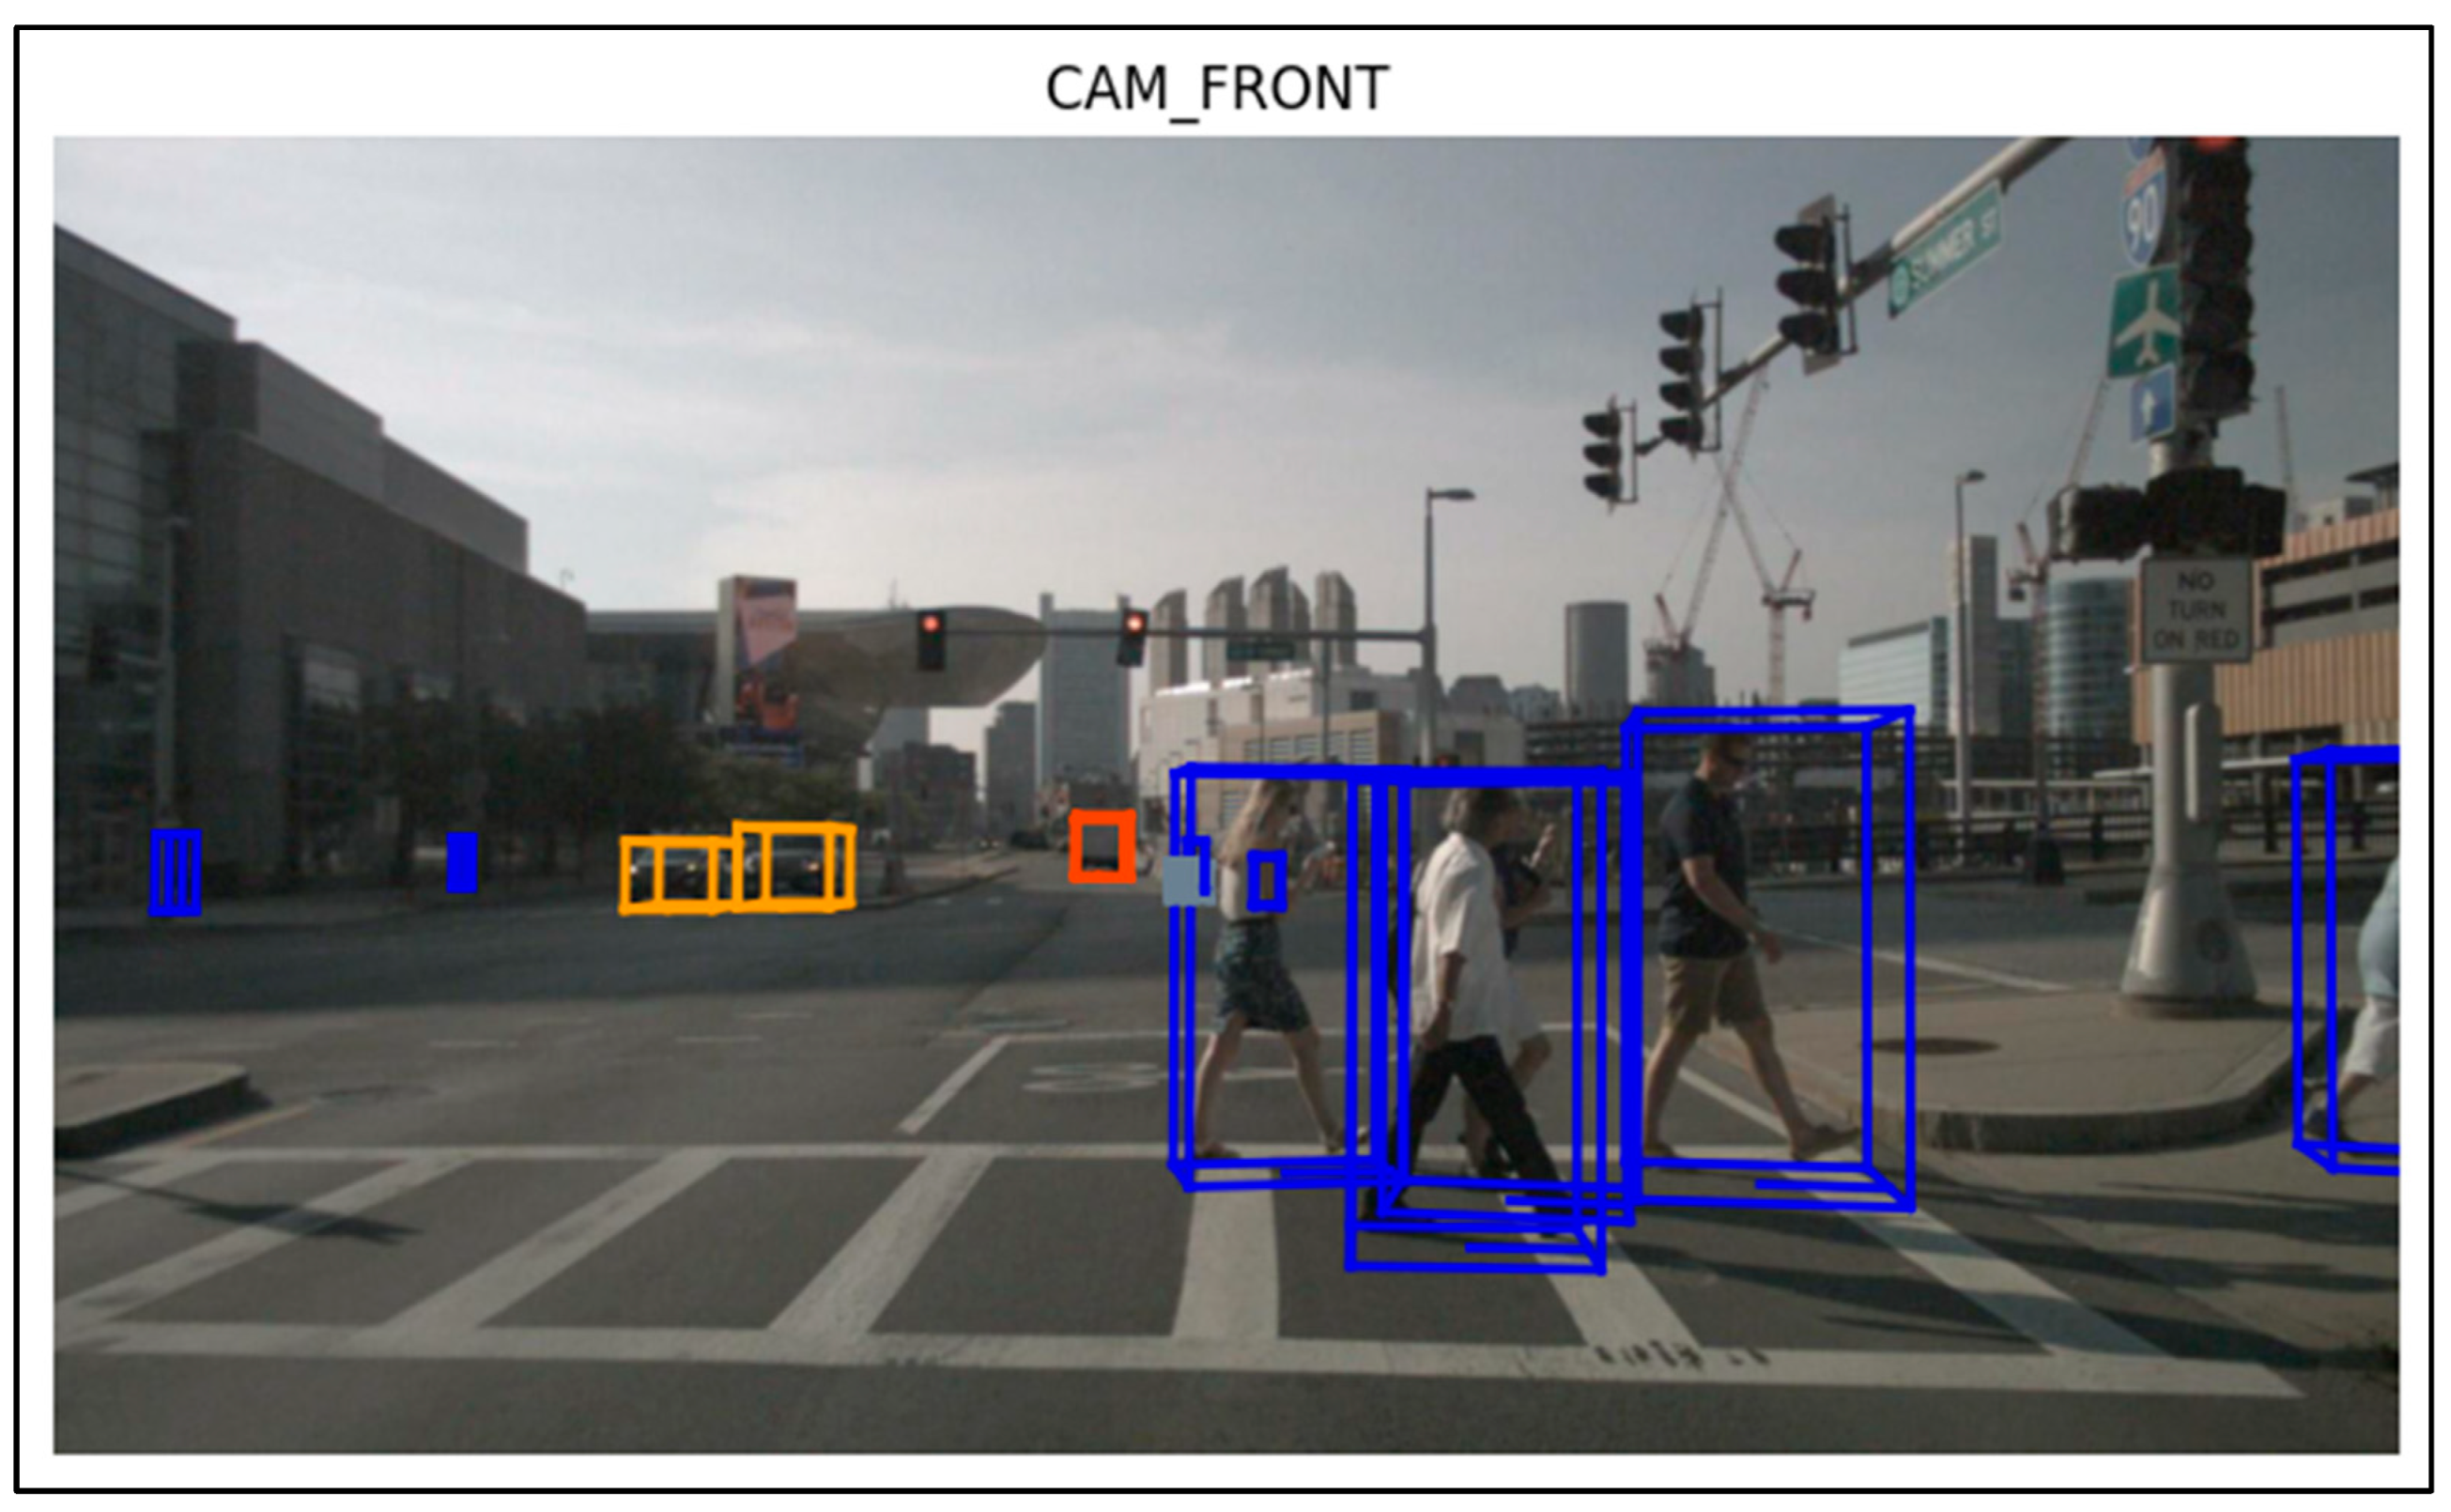
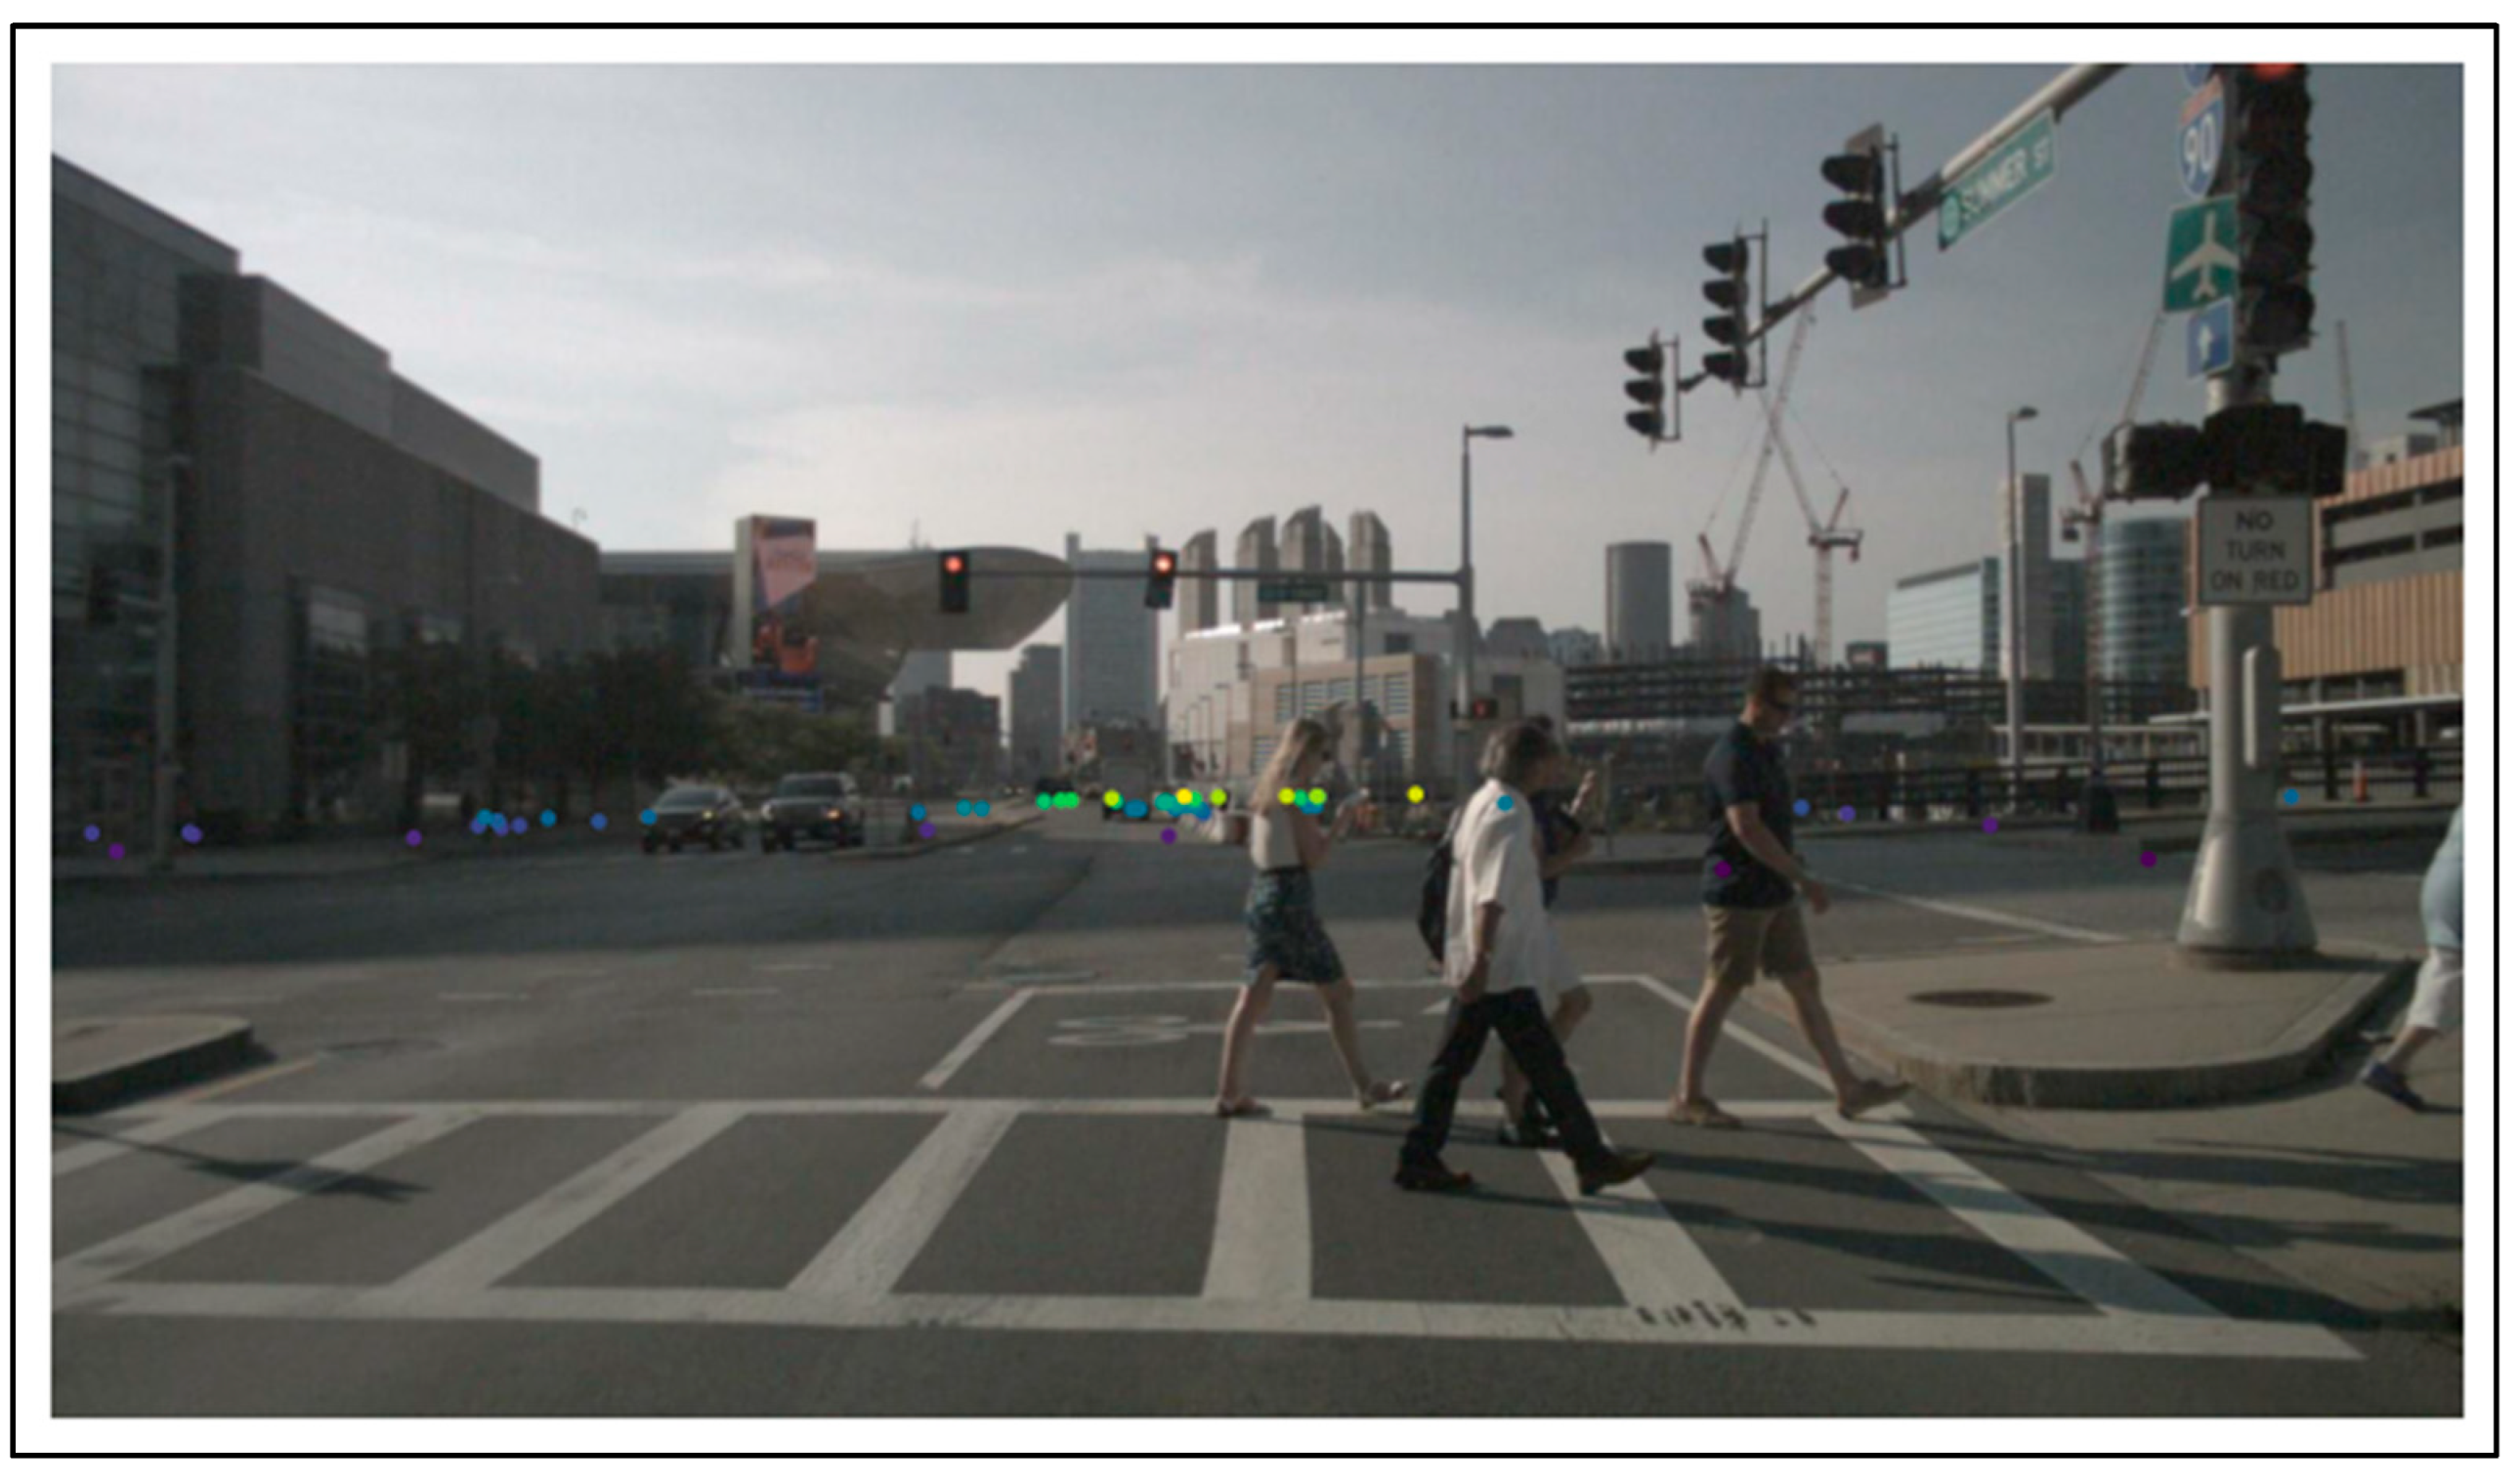
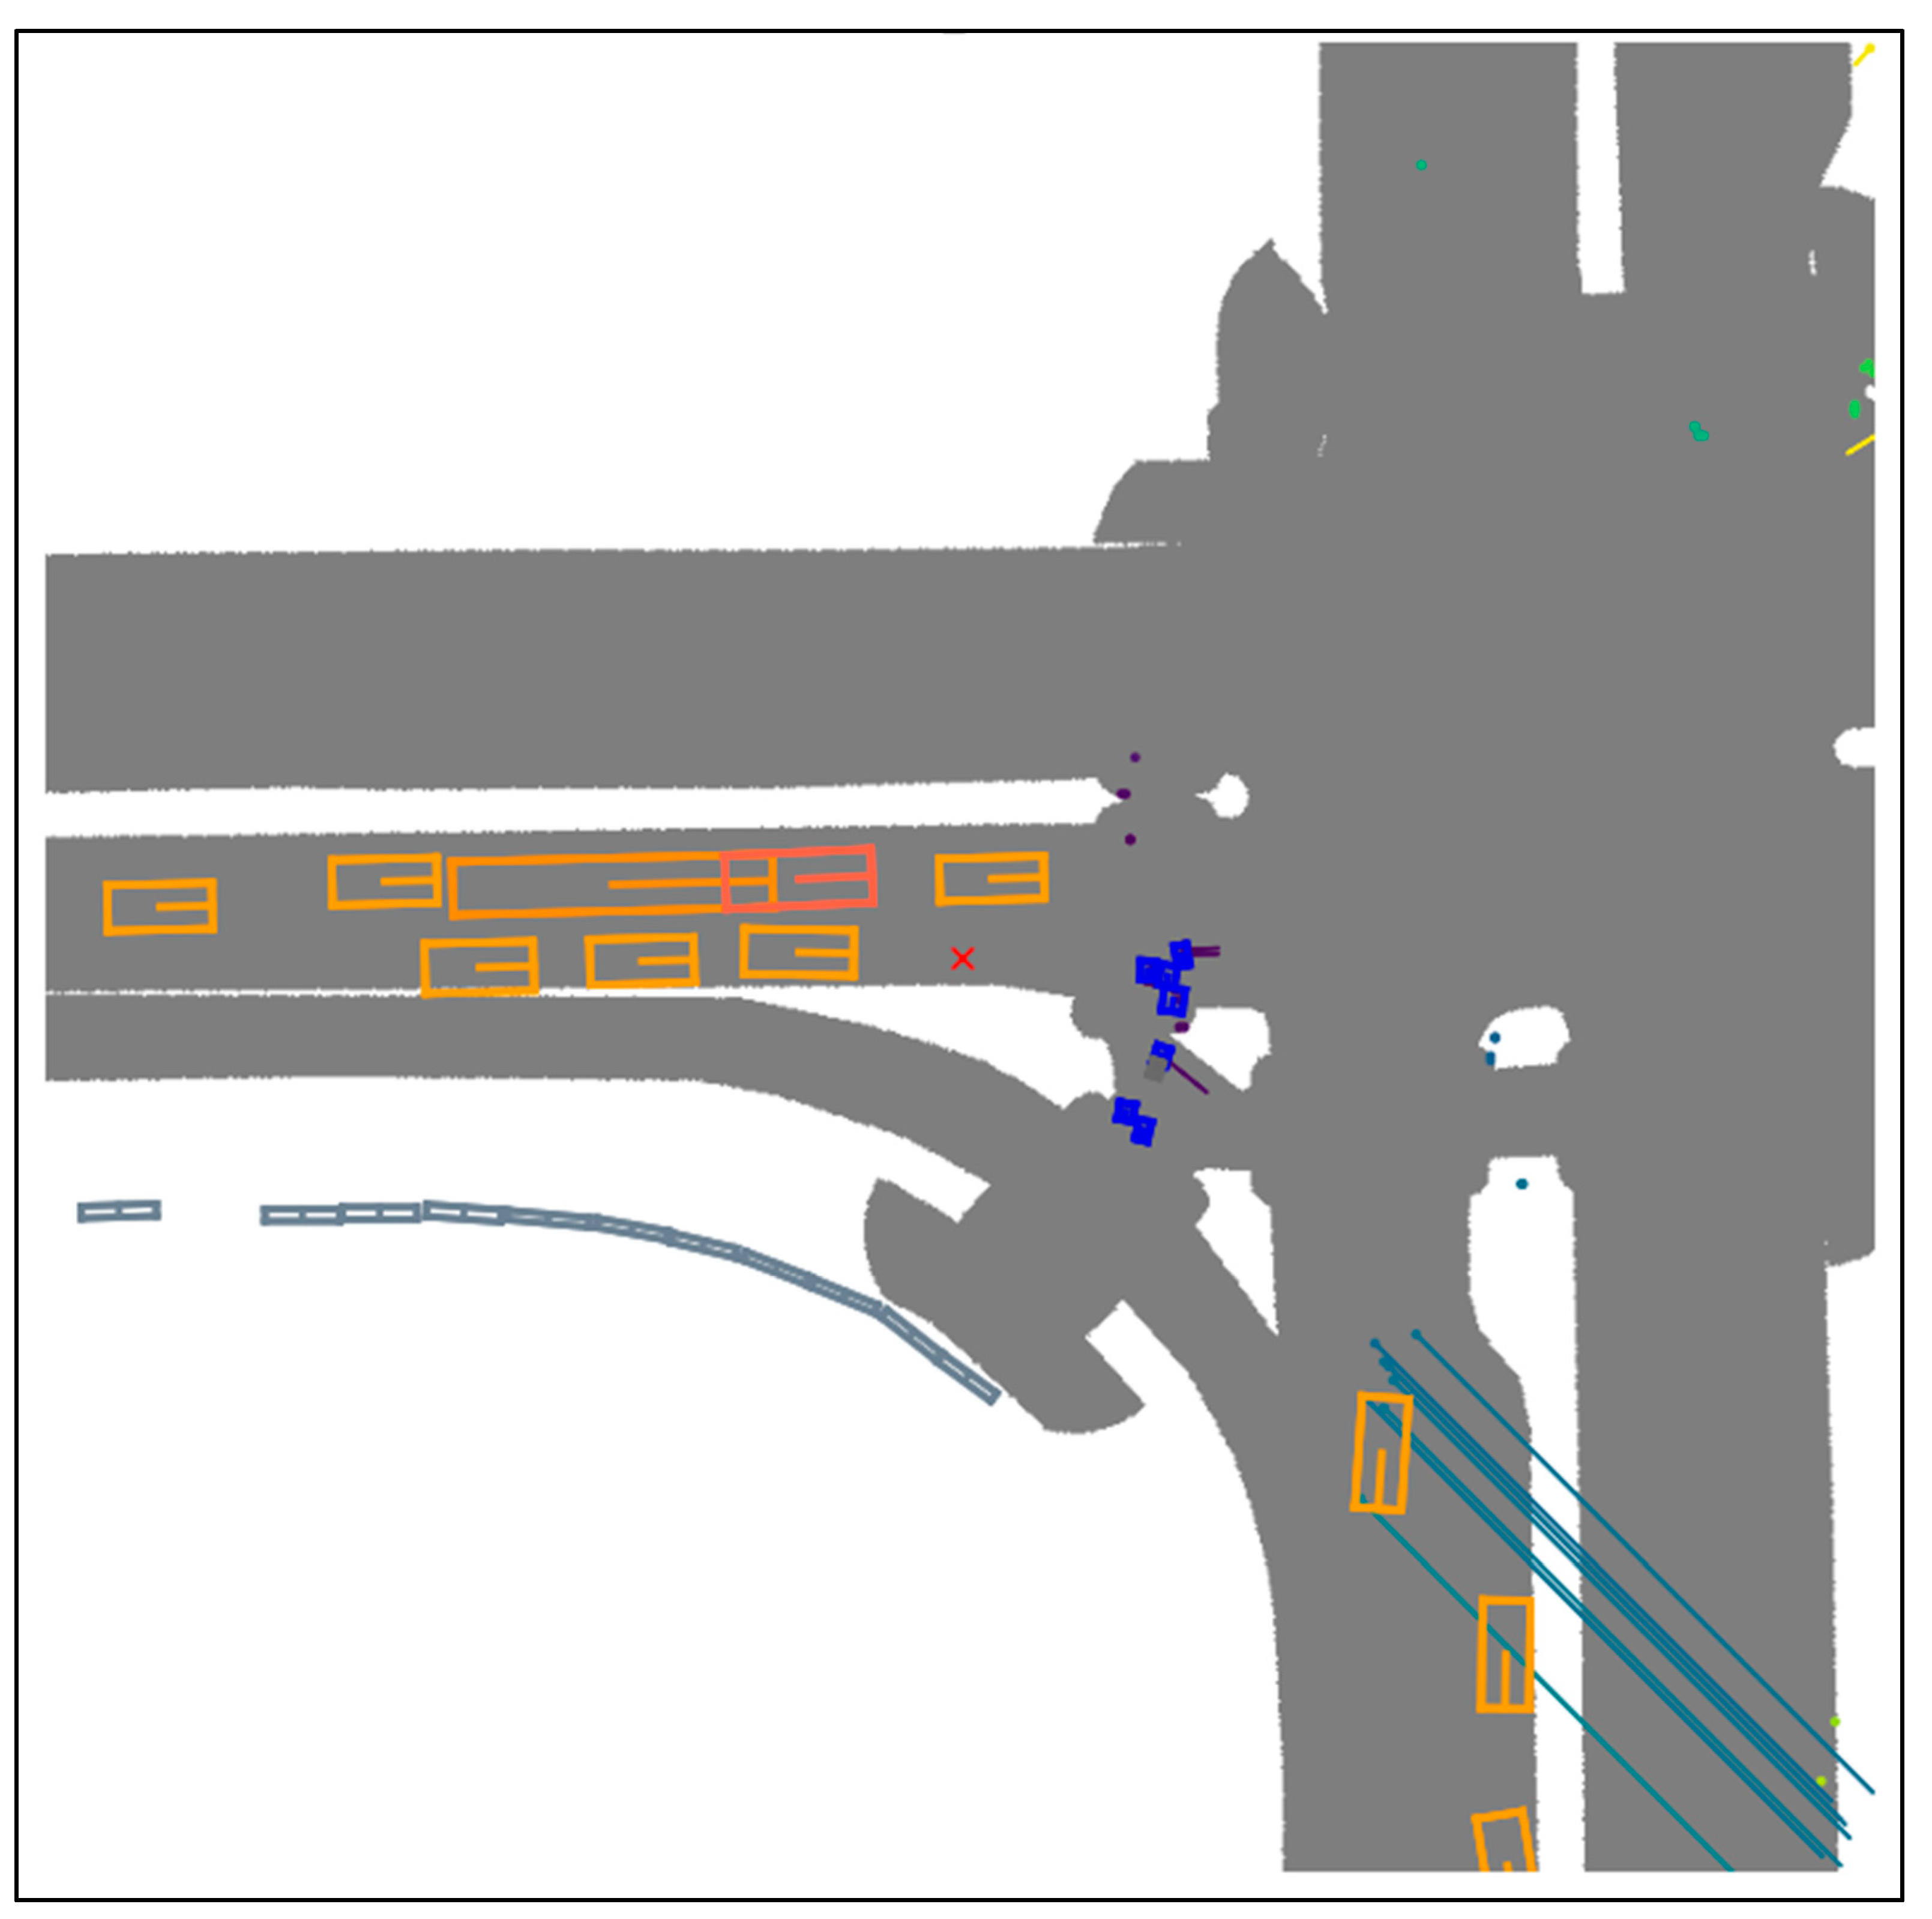
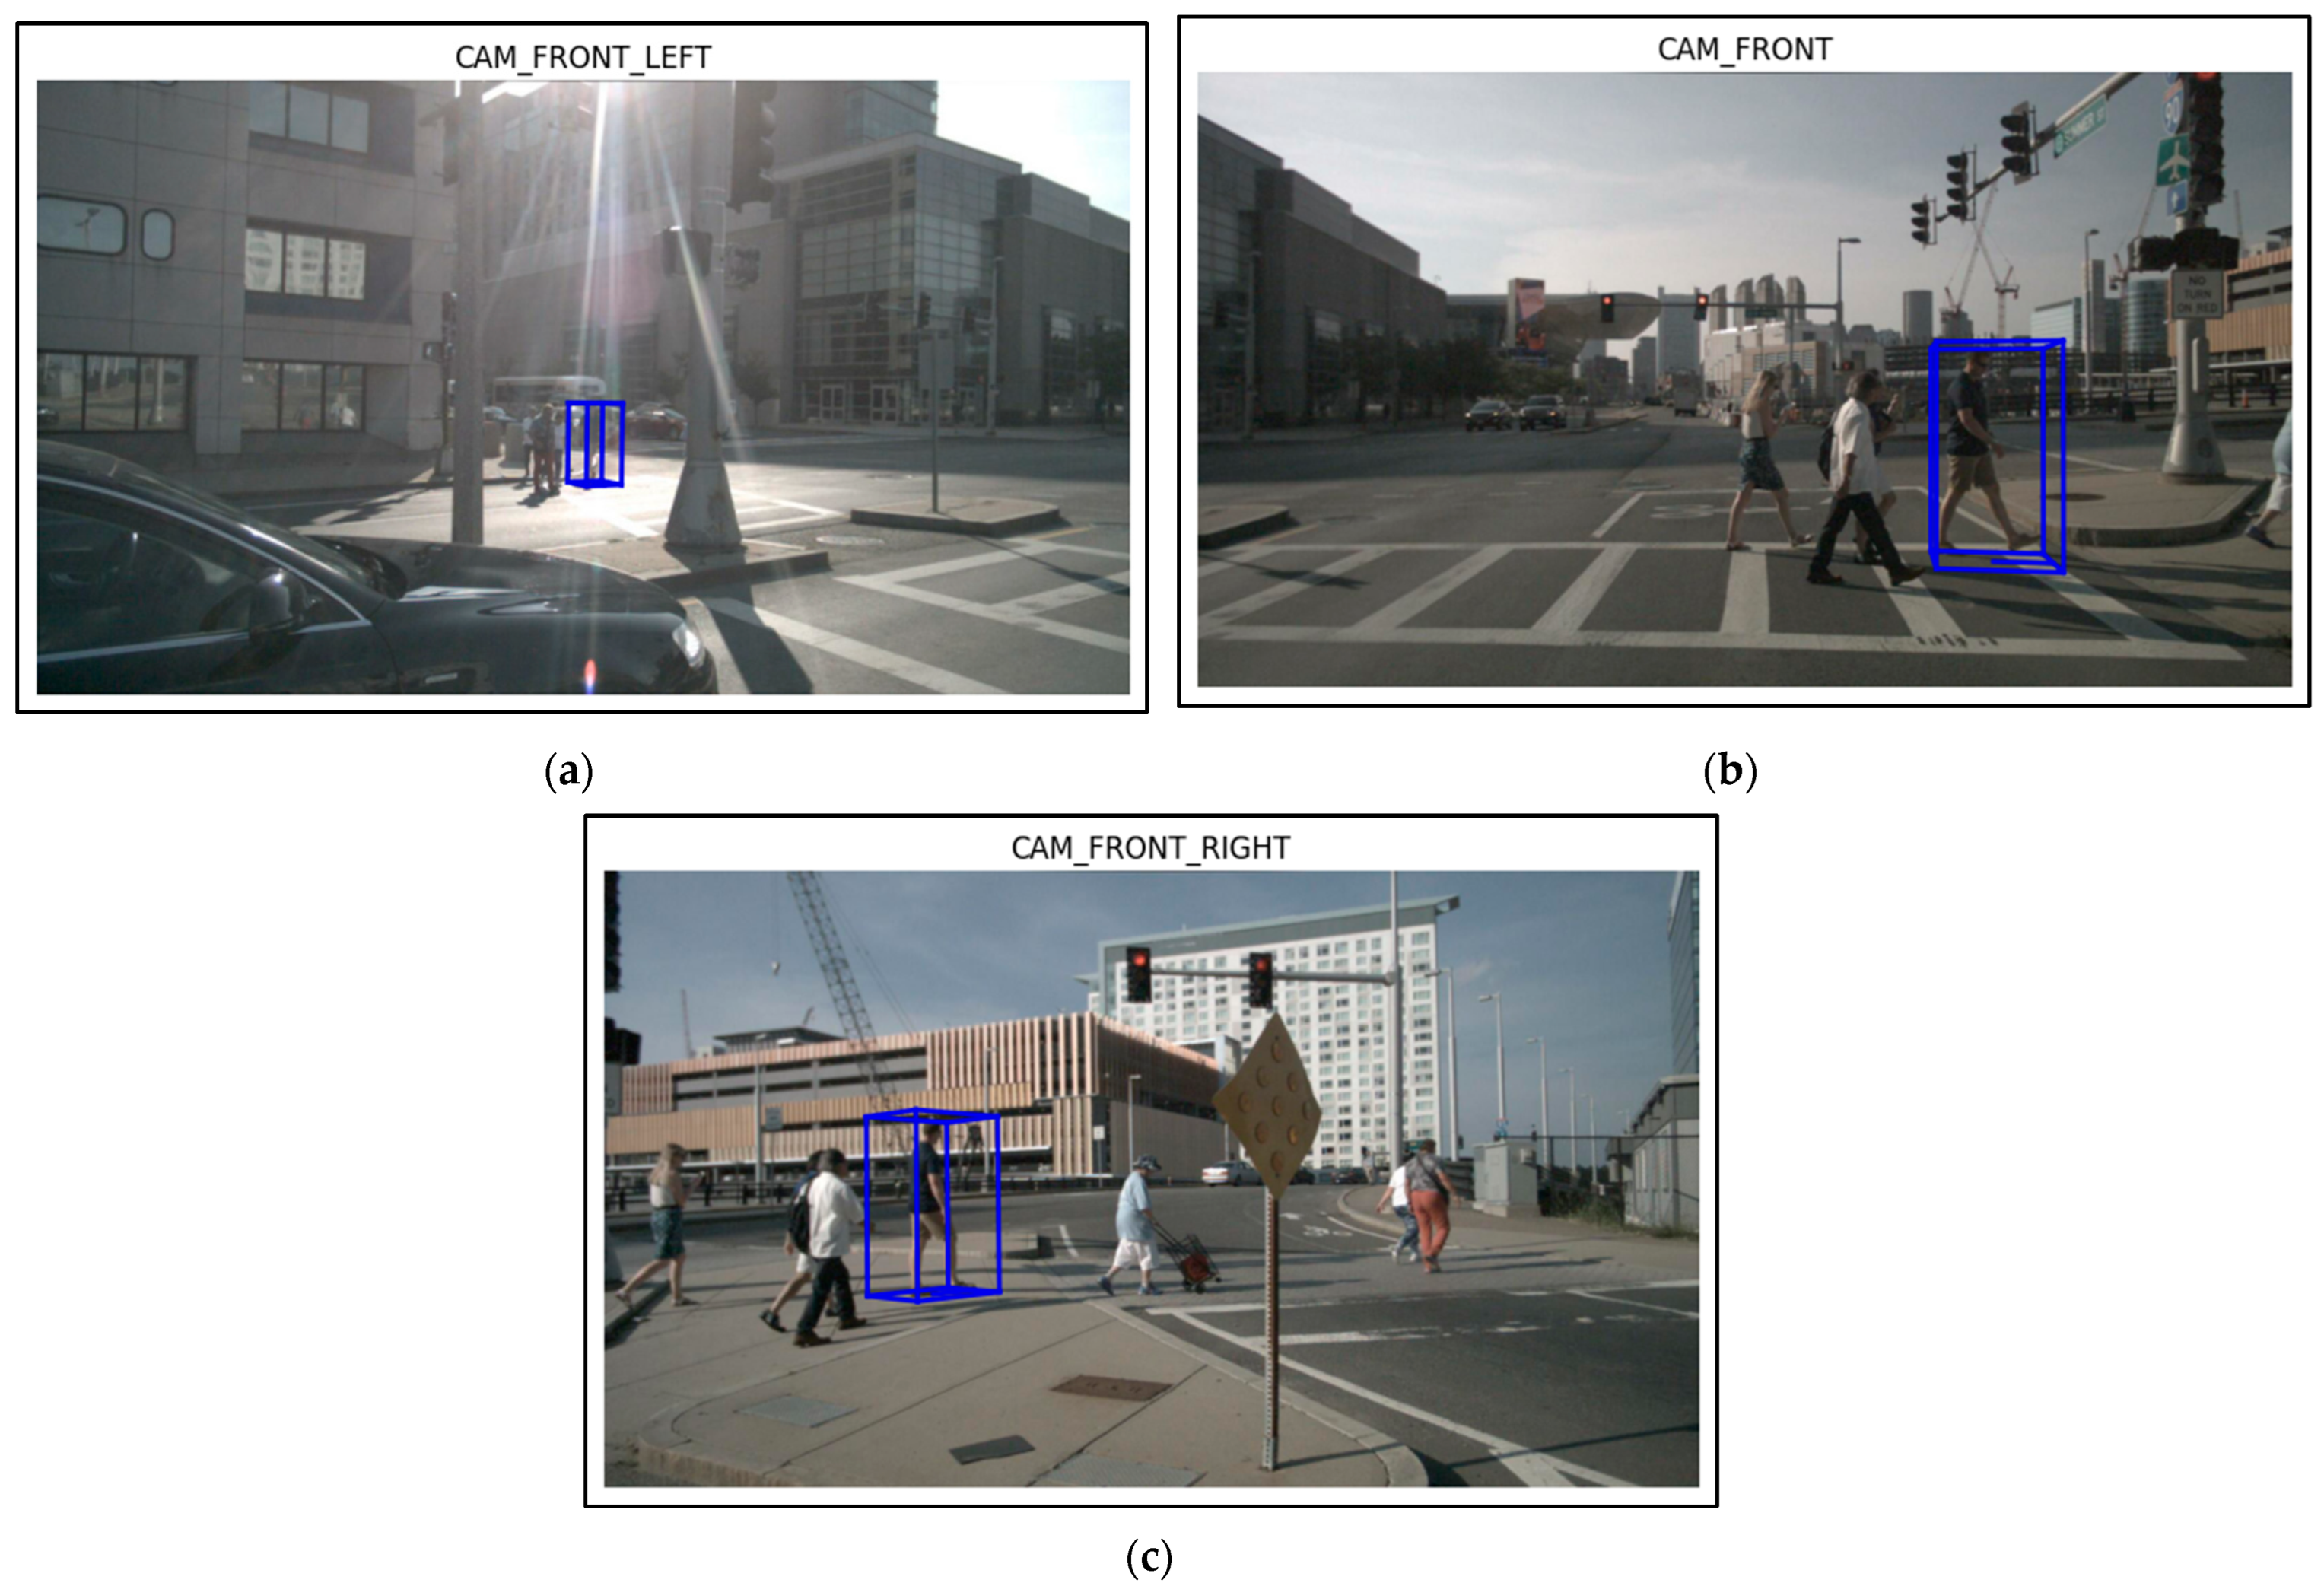
4.6. Visualization of Samples
- One LIDAR (light detection and ranging) sensor:
- LIDAR_TOP
- Five RADAR (radio detection and ranging) sensors:
- RADAR_FRONT
- RADAR_FRONT_LEFT
- RADAR_FRONT_RIGHT
- RADAR_BACK_LEFT
- RADAR_BACK_RIGHT
- Six camera sensors:
- CAM_FRONT
- CAM_FRONT_LEFT
- CAM_FRONT_RIGHT
- CAM_BACK
- CAM_BACK_LEFT
- CAM_BACK_RIGHT
- Continuously monitor the movement of objects in its environment.
- Classify and differentiate between different types of objects and understand their potential intentions even under unfavorable conditions.
- Make informed decisions by planning safe maneuvers based on perceived information about the environment.
5. Conclusions
Author Contributions
Funding
Data Availability Statement
Acknowledgments
Conflicts of Interest
References
- Robson, K. Full Self-Driving Cars Might Not Be with Us until 2035, Experts Predict. Available online: https://www.verdict.co.uk/fully-self-driving-cars-unlikely-before-2035-experts-predict/ (accessed on 21 December 2023).
- Tang, Y.; He, H.; Wang, Y.; Mao, Z.; Wang, H. Multi-Modality 3D Object Detection in Autonomous Driving: A Review. Neurocomputing 2023, 553, 126587. [Google Scholar] [CrossRef]
- Qian, R.; Lai, X.; Li, X. 3D Object Detection for Autonomous Driving: A Survey. Pattern Recognit. 2022, 130, 108796. [Google Scholar] [CrossRef]
- Le, H.-S.; Le, T.D.; Huynh, K.-T. A Review on 3D Object Detection for Self-Driving Cars. In Proceedings of the 2022 RIVF International Conference on Computing and Communication Technologies (RIVF), Ho Chi Minh City, Vietnam, 20–22 December 2022; pp. 398–403. [Google Scholar]
- Alessandretti, G.; Broggi, A.; Cerri, P. Vehicle and Guard Rail Detection Using Radar and Vision Data Fusion. IEEE Trans. Intell. Transp. Syst. 2007, 8, 95–105. [Google Scholar] [CrossRef]
- Zhou, Y.; Liu, L.; Zhao, H.; López-Benítez, M.; Yu, L.; Yue, Y. Towards Deep Radar Perception for Autonomous Driving: Datasets, Methods, and Challenges. Sensors 2022, 22, 4208. [Google Scholar] [CrossRef] [PubMed]
- Wang, Y.; Chao, W.-L.; Garg, D.; Hariharan, B.; Campbell, M.; Weinberger, K.Q. Pseudo-LiDAR From Visual Depth Estimation: Bridging the Gap in 3D Object Detection for Autonomous Driving. In Proceedings of the 2019 IEEE/CVF Conference on Computer Vision and Pattern Recognition (CVPR), Long Beach, CA, USA, 15–20 June 2019; pp. 8437–8445. [Google Scholar]
- Ku, J.; Mozifian, M.; Lee, J.; Harakeh, A.; Waslander, S.L. Joint 3D Proposal Generation and Object Detection from View Aggregation. In Proceedings of the 2018 IEEE/RSJ International Conference on Intelligent Robots and Systems (IROS), Madrid, Spain, 1–5 October 2018; pp. 1–8. [Google Scholar]
- Kalgaonkar, P.; El-Sharkawy, M. NextDet: Efficient Sparse-to-Dense Object Detection with Attentive Feature Aggregation. Future Internet 2022, 14, 355. [Google Scholar] [CrossRef]
- Kalgaonkar, P. AI on the Edge with CondenseNeXt: An Efficient Deep Neural Network for Devices with Constrained Computational Resources. Master’s Thesis, Purdue University Graduate School, Indianapolis, IN, USA, 2021. [Google Scholar]
- Bochkovskiy, A.; Wang, C.-Y.; Liao, H.-Y.M. YOLOv4: Optimal Speed and Accuracy of Object Detection. arXiv 2020, arXiv:2004.10934. [Google Scholar]
- Liu, W.; Anguelov, D.; Erhan, D.; Szegedy, C.; Reed, S.; Fu, C.-Y.; Berg, A.C. SSD: Single Shot MultiBox Detector. In Computer Vision—ECCV 2016: 14th European Conference, Amsterdam, The Netherlands, 11–14 October 2016, Proceedings, Part I 14; Springer International Publishing: Cham, Switzerland, 2016; Volume 9905, pp. 21–37. [Google Scholar]
- Lin, T.-Y.; Goyal, P.; Girshick, R.; He, K.; Dollár, P. Focal Loss for Dense Object Detection. In Proceedings of the IEEE International Conference on Computer Vision, Salt Lake City, UT, USA, 18–23 June 2018. [Google Scholar]
- Law, H.; Deng, J. CornerNet: Detecting Objects as Paired Keypoints. In Proceedings of the European Conference on Computer Vision (ECCV), Seoul, Republic of Korea, 27 October–2 November 2019. [Google Scholar]
- Duan, K.; Bai, S.; Xie, L.; Qi, H.; Huang, Q.; Tian, Q. CenterNet: Keypoint Triplets for Object Detection. In Proceedings of the IEEE/CVF International Conference on Computer Vision, Seoul, Republic of Korea, 27 October–2 November 2019. [Google Scholar]
- Girshick, R. Fast R-CNN. In Proceedings of the IEEE International Conference on Computer Vision, Santiago, Chile, 7–13 December 2015. [Google Scholar]
- Ren, S.; He, K.; Girshick, R.; Sun, J. Faster R-CNN: Towards Real-Time Object Detection with Region Proposal Networks. IEEE Trans. Pattern Anal. Mach. Intell. 2016, 39, 1137–1149. [Google Scholar] [CrossRef] [PubMed]
- He, K.; Gkioxari, G.; Dollár, P.; Girshick, R. Mask R-CNN. In Proceedings of the IEEE International Conference on Computer Vision (ICCV), Venice, Italy, 24 January 2018; pp. 2980–2988. [Google Scholar]
- Cai, Z.; Vasconcelos, N. Cascade R-CNN: Delving into High Quality Object Detection. In Proceedings of the IEEE Conference on Computer Vision and Pattern Recognition, Honolulu, HI, USA, 21–26 July 2017. [Google Scholar]
- Pang, J.; Chen, K.; Shi, J.; Feng, H.; Ouyang, W.; Lin, D. Libra R-CNN: Towards Balanced Learning for Object Detection. In Proceedings of the IEEE/CVF Conference on Computer Vision and Pattern Recognition, Long Beach, CA, USA, 15–20 June 2019. [Google Scholar]
- Kim, J.; Sung, J.-Y.; Park, S. Comparison of Faster-RCNN, YOLO, and SSD for Real-Time Vehicle Type Recognition. In Proceedings of the 2020 IEEE International Conference on Consumer Electronics—Asia (ICCE-Asia), Seoul, Republic of Korea, 1–3 November 2020; pp. 1–4. [Google Scholar]
- He, K.; Zhang, X.; Ren, S.; Sun, J. Spatial Pyramid Pooling in Deep Convolutional Networks for Visual Recognition. In Proceedings of the Computer Vision—ECCV 2014; Fleet, D., Pajdla, T., Schiele, B., Tuytelaars, T., Eds.; Springer International Publishing: Cham, Switzerland, 2014; pp. 346–361. [Google Scholar]
- Lin, T.-Y.; Dollár, P.; Girshick, R.; He, K.; Hariharan, B.; Belongie, S. Feature Pyramid Networks for Object Detection. In Proceedings of the IEEE Conference on Computer Vision and Pattern Recognition, Honolulu, HI, USA, 21–26 July 2017. [Google Scholar]
- Liu, S.; Qi, L.; Qin, H.; Shi, J.; Jia, J. Path Aggregation Network for Instance Segmentation. In Proceedings of the IEEE Conference on Computer Vision and Pattern Recognition, Salt Lake City, UT, USA, 18–23 June 2018. [Google Scholar]
- Kalgaonkar, P.; El-Sharkawy, M. CondenseNeXt: An Ultra-Efficient Deep Neural Network for Embedded Systems. In Proceedings of the 2021 IEEE 11th Annual Computing and Communication Workshop and Conference (CCWC), Las Vegas, NV, USA, 27–30 January 2021; pp. 0524–0528. [Google Scholar]
- Modas, A.; Sanchez-Matilla, R.; Frossard, P.; Cavallaro, A. Towards Robust Sensing for Autonomous Vehicles: An Adversarial Perspective. IEEE Signal Process. Mag. 2020, 37, 14–23. [Google Scholar] [CrossRef]
- Hoermann, S.; Henzler, P.; Bach, M.; Dietmayer, K. Object Detection on Dynamic Occupancy Grid Maps Using Deep Learning and Automatic Label Generation. In Proceedings of the 2018 IEEE Intelligent Vehicles Symposium (IV), Changshu, China, 26–30 June 2018; pp. 826–833. [Google Scholar]
- El Natour, G.; Bresson, G.; Trichet, R. Multi-Sensors System and Deep Learning Models for Object Tracking. Sensors 2023, 23, 7804. [Google Scholar] [CrossRef]
- Srivastav, A.; Mandal, S. Radars for Autonomous Driving: A Review of Deep Learning Methods and Challenges. IEEE Access 2023, 11, 97147–97168. [Google Scholar] [CrossRef]
- Huang, G.; Liu, Z.; Maaten, L.V.D.; Weinberger, K.Q. Densely Connected Convolutional Networks. In Proceedings of the 2017 IEEE Conference on Computer Vision and Pattern Recognition (CVPR), Honolulu, HI, USA, 21–26 July 2017; pp. 2261–2269. [Google Scholar]
- Zhang, Y.; Jin, R.; Zhou, Z.-H. Understanding Bag-of-Words Model: A Statistical Framework. Int. J. Mach. Learn. Cyber. 2010, 1, 43–52. [Google Scholar] [CrossRef]
- Woo, S.; Park, J.; Lee, J.-Y.; Kweon, I.S. CBAM: Convolutional Block Attention Module. In Proceedings of the Computer Vision—ECCV 2018; Ferrari, V., Hebert, M., Sminchisescu, C., Weiss, Y., Eds.; Springer International Publishing: Cham, Switzerland, 2018; pp. 3–19. [Google Scholar]
- Rezatofighi, H.; Tsoi, N.; Gwak, J.; Sadeghian, A.; Reid, I.; Savarese, S. Generalized Intersection Over Union: A Metric and a Loss for Bounding Box Regression. In Proceedings of the 2019 IEEE/CVF Conference on Computer Vision and Pattern Recognition (CVPR), Long Beach, CA, USA, 15–20 June 2019; pp. 658–666. [Google Scholar]
- Llinas, M.L.I.; David Hall, J. (Eds.) Handbook of Multisensor Data Fusion: Theory and Practice, 2nd ed.; CRC Press: Boca Raton, FL, USA, 2017; ISBN 978-1-315-21948-6. [Google Scholar]
- Caesar, H.; Bankiti, V.; Lang, A.H.; Vora, S.; Liong, V.E.; Xu, Q.; Krishnan, A.; Pan, Y.; Baldan, G.; Beijbom, O. nuScenes: A Multimodal Dataset for Autonomous Driving. In Proceedings of the 2020 IEEE/CVF Conference on Computer Vision and Pattern Recognition (CVPR), Seattle, WA, USA, 13–19 June 2020; pp. 11618–11628. [Google Scholar]
- Nabati, R.; Qi, H. CenterFusion: Center-Based Radar and Camera Fusion for 3D Object Detection. In Proceedings of the 2021 IEEE Winter Conference on Applications of Computer Vision (WACV), Waikoloa, HI, USA, 3–8 January 2021; pp. 1526–1535. [Google Scholar]
- He, K.; Zhang, X.; Ren, S.; Sun, J. Deep Residual Learning for Image Recognition. In Proceedings of the 2016 IEEE Conference on Computer Vision and Pattern Recognition (CVPR), Las Vegas, NV, USA, 26 June–1 July 2016; pp. 770–778. [Google Scholar]
- Padilla, R.; Passos, W.L.; Dias, T.L.B.; Netto, S.L.; da Silva, E.A.B. A Comparative Analysis of Object Detection Metrics with a Companion Open-Source Toolkit. Electronics 2021, 10, 279. [Google Scholar] [CrossRef]
- Stewart, C.A.; Welch, V.; Plale, B.; Fox, G.; Pierce, M.; Sterling, T. Indiana University Pervasive Technology Institute. 2017. Available online: https://scholarworks.iu.edu/dspace/items/ddb55636-7550-471d-be5f-d9df6ee82310 (accessed on 26 March 2024).
- Roddick, T. Orthographic Feature Transform for Monocular 3D Object Detection. arXiv 2018, arXiv:1811.08188. [Google Scholar]
- Chen, X.; Kundu, K.; Zhang, Z.; Ma, H.; Fidler, S.; Urtasun, R. Monocular 3D Object Detection for Autonomous Driving. In Proceedings of the 2016 IEEE Conference on Computer Vision and Pattern Recognition (CVPR), Las Vegas, NV, USA, 26 June–1 July 2016; pp. 2147–2156. [Google Scholar]
- Wang, J.; Lan, S.; Gao, M.; Davis, L.S. InfoFocus: 3D Object Detection for Autonomous Driving with Dynamic Information Modeling. In Proceedings of the Computer Vision—ECCV 2020; Vedaldi, A., Bischof, H., Brox, T., Frahm, J.-M., Eds.; Springer International Publishing: Cham, Switzerland, 2020; pp. 405–420. [Google Scholar]


| Network | C | R | NM | FAM | ||||||
|---|---|---|---|---|---|---|---|---|---|---|
| MonoDIS |  | - | - | - | 0.301 | 0.738 | 0.269 | 0.544 | 1.532 | 0.141 |
| NeXtDet | | - | - | - | 0.351 | 0.635 | 0.271 | 0.550 | 1.346 | 0.142 |
| NeXtFusion | | | | - | 0.427 | 0.499 | 0.268 | 0.541 | 0.846 | 0.140 |
| NeXtFusion | | | - | | 0.474 | 0.448 | 0.262 | 0.534 | 0.536 | 0.138 |
Disclaimer/Publisher’s Note: The statements, opinions and data contained in all publications are solely those of the individual author(s) and contributor(s) and not of MDPI and/or the editor(s). MDPI and/or the editor(s) disclaim responsibility for any injury to people or property resulting from any ideas, methods, instructions or products referred to in the content. |
© 2024 by the authors. Licensee MDPI, Basel, Switzerland. This article is an open access article distributed under the terms and conditions of the Creative Commons Attribution (CC BY) license (https://creativecommons.org/licenses/by/4.0/).
Share and Cite
Kalgaonkar, P.; El-Sharkawy, M. NeXtFusion: Attention-Based Camera-Radar Fusion Network for Improved Three-Dimensional Object Detection and Tracking. Future Internet 2024, 16, 114. https://doi.org/10.3390/fi16040114
Kalgaonkar P, El-Sharkawy M. NeXtFusion: Attention-Based Camera-Radar Fusion Network for Improved Three-Dimensional Object Detection and Tracking. Future Internet. 2024; 16(4):114. https://doi.org/10.3390/fi16040114
Chicago/Turabian StyleKalgaonkar, Priyank, and Mohamed El-Sharkawy. 2024. "NeXtFusion: Attention-Based Camera-Radar Fusion Network for Improved Three-Dimensional Object Detection and Tracking" Future Internet 16, no. 4: 114. https://doi.org/10.3390/fi16040114