
UP-SDCG: A Method of Sensitive Data Classification for Collaborative Edge Computing in Financial Cloud Environment

 ,
,
Abstract
:1. Introduction
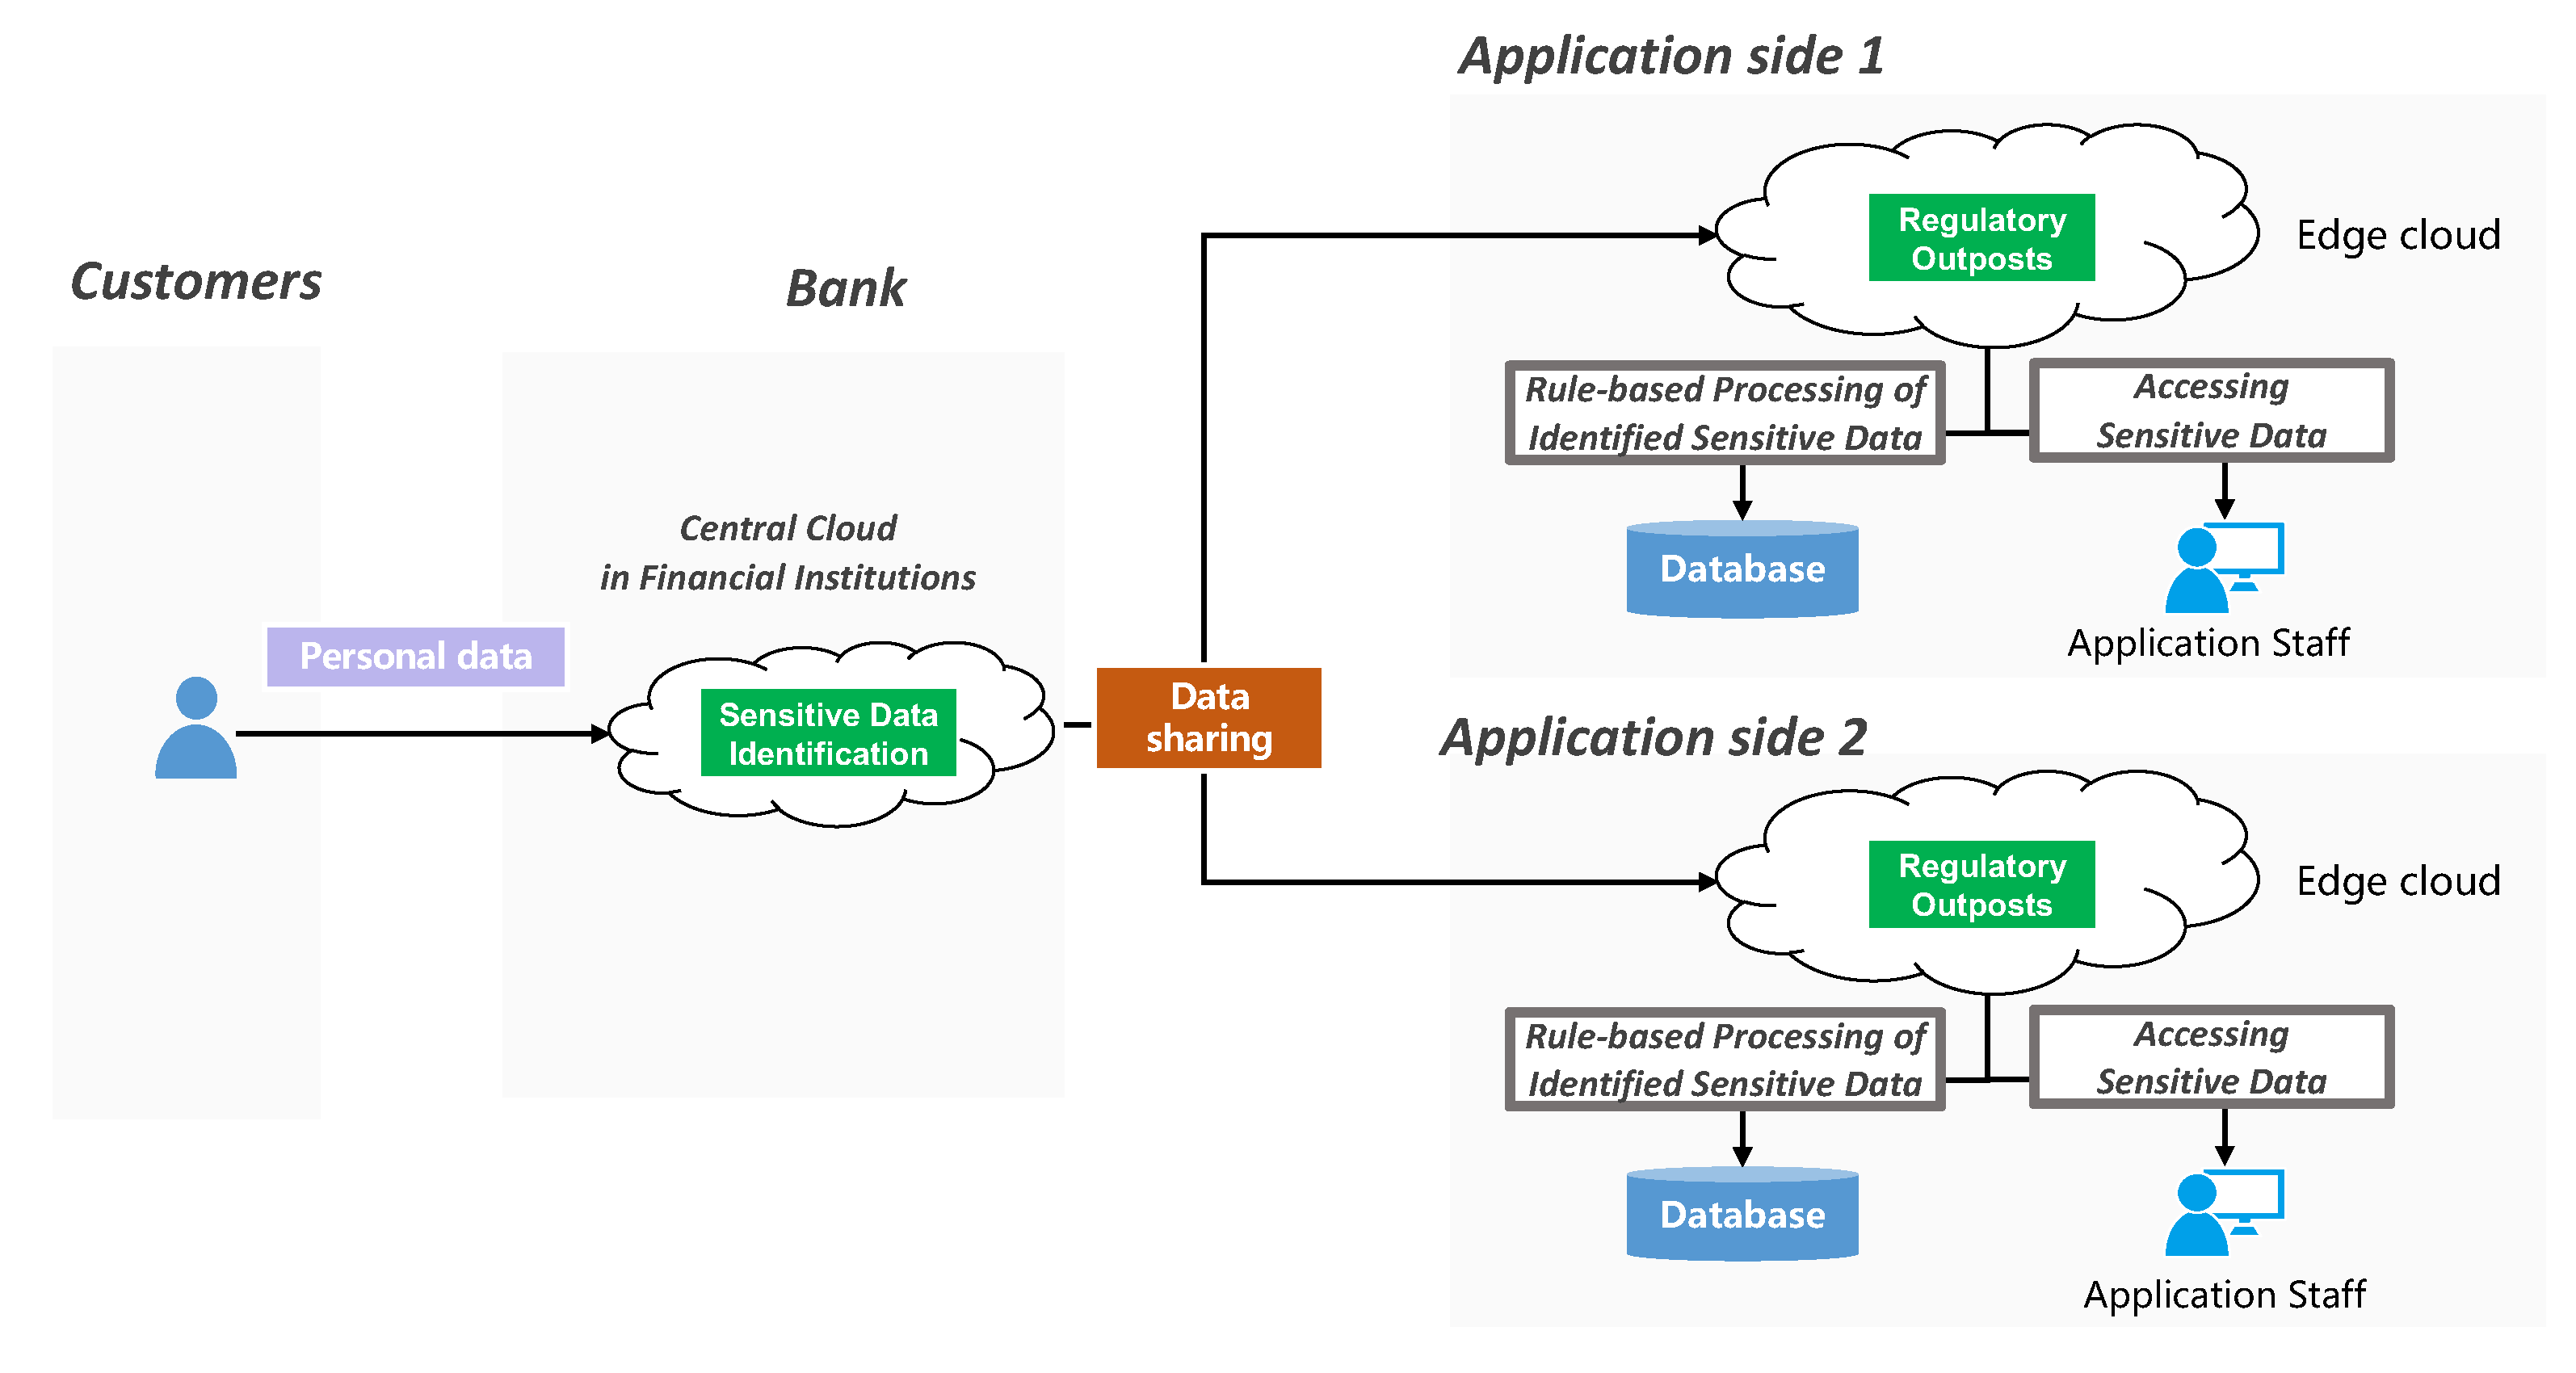
- Elastic scalability of resources: As data processing by the application side requires computational resources, which fluctuate with varying data volumes, the deployment should allow for elastic scalability of resources to minimize investment costs for the application side.
- Low bandwidth utilization cost and reduced data processing latency: The data traffic accessed by the application side needs to pass through the regulatory outpost. It is crucial to ensure low bandwidth utilization costs and reduced data processing latency to minimize any impact on the application side’s user experience.
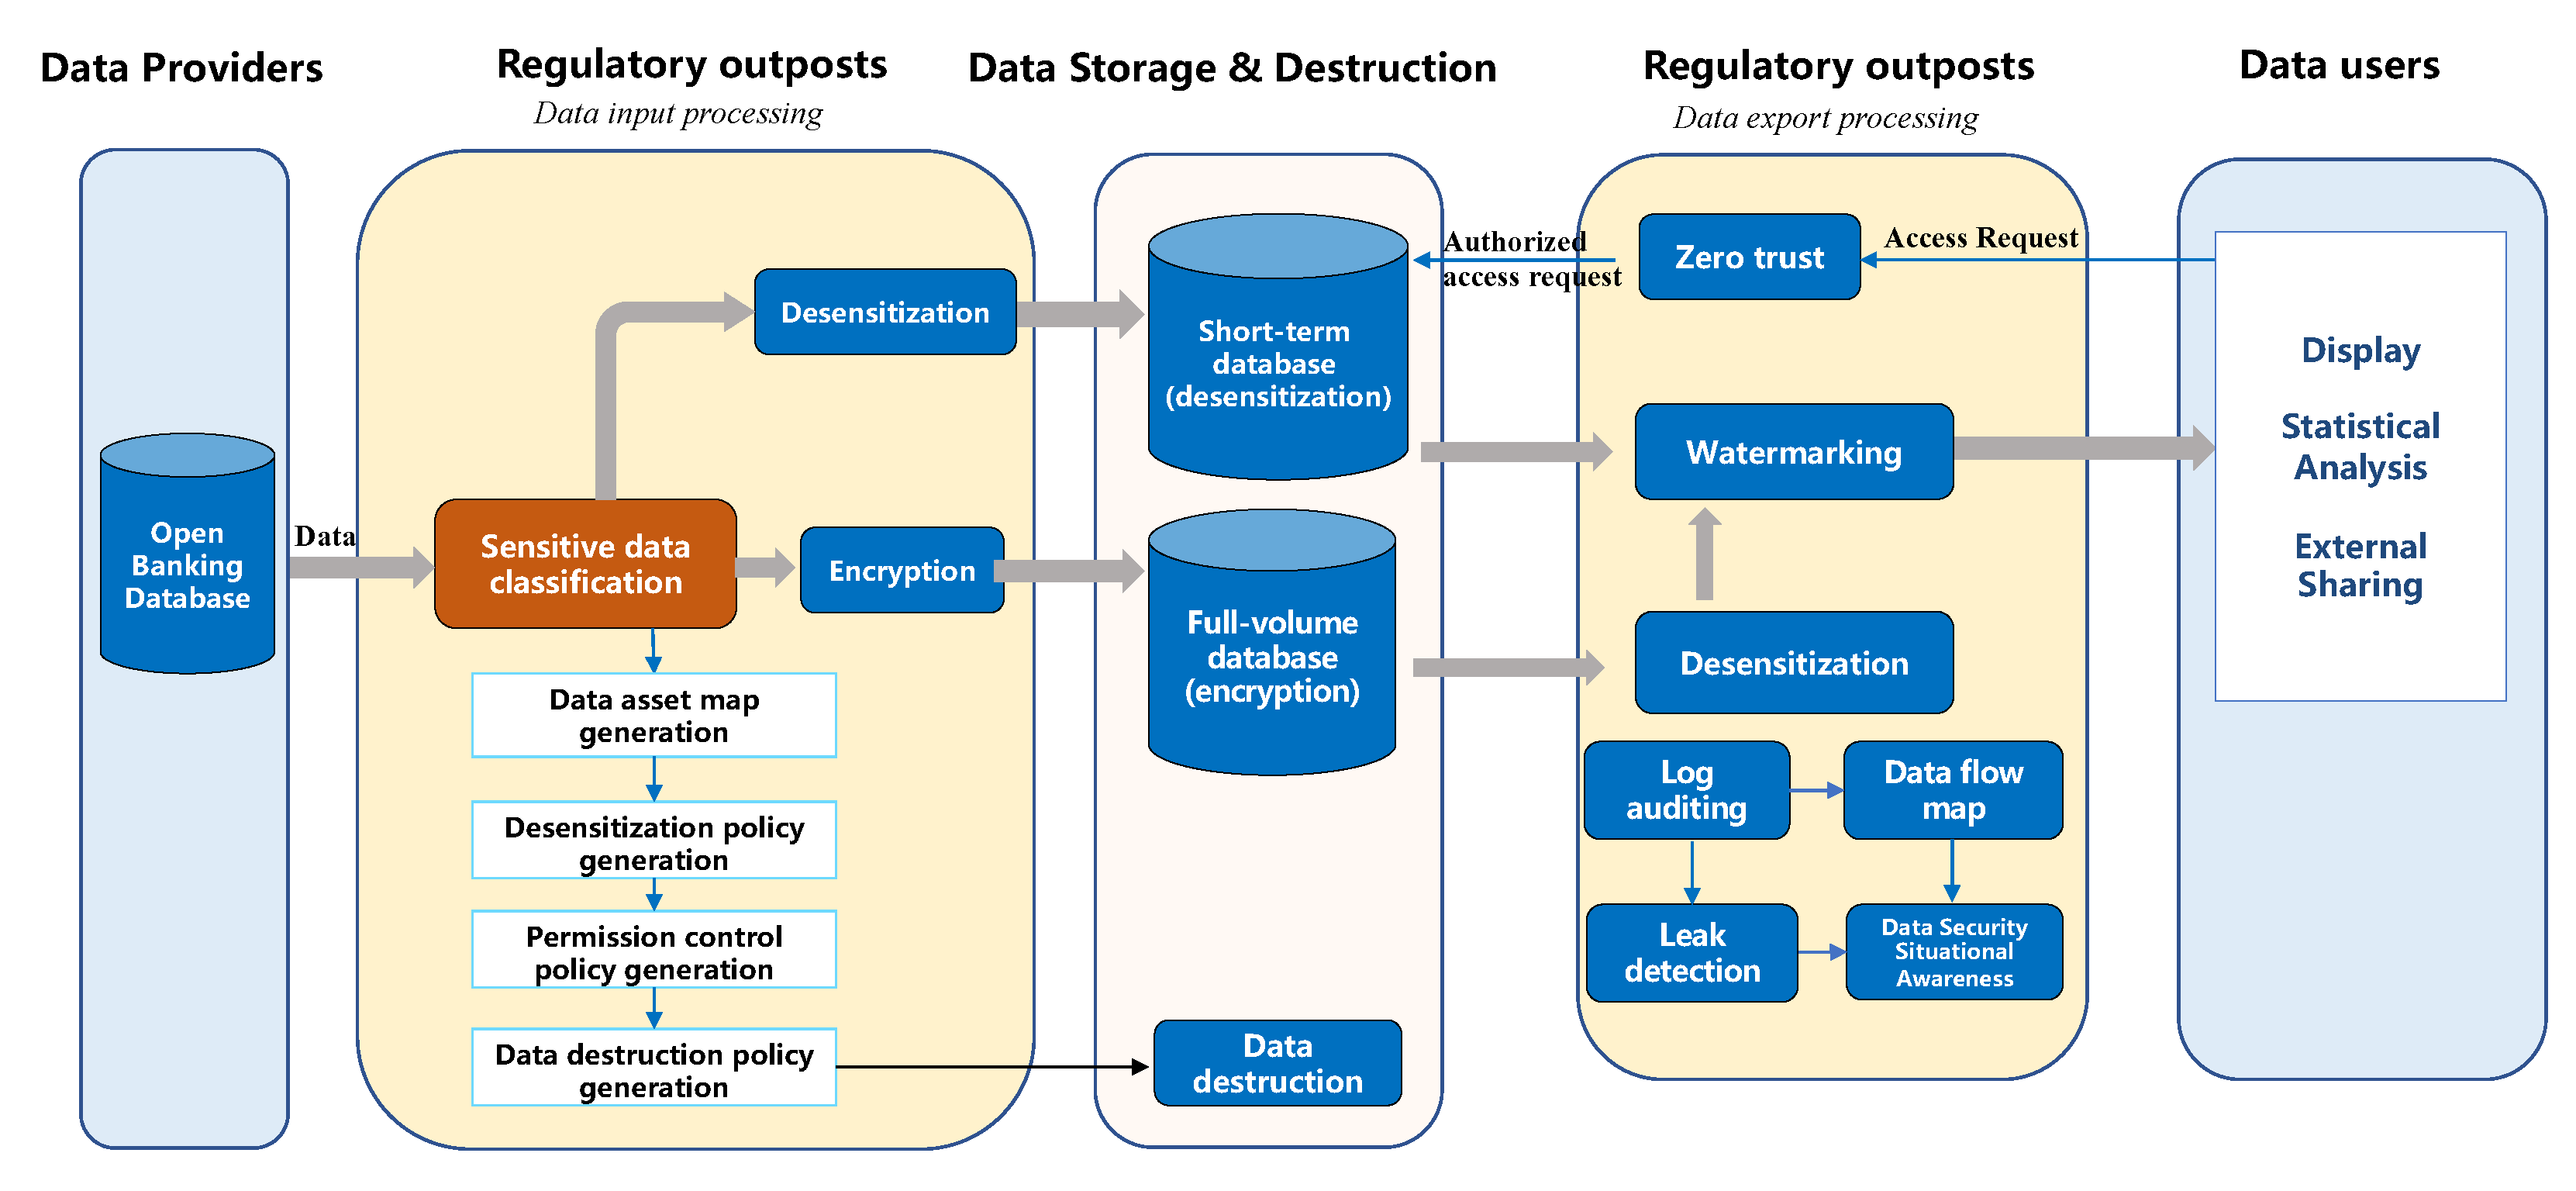
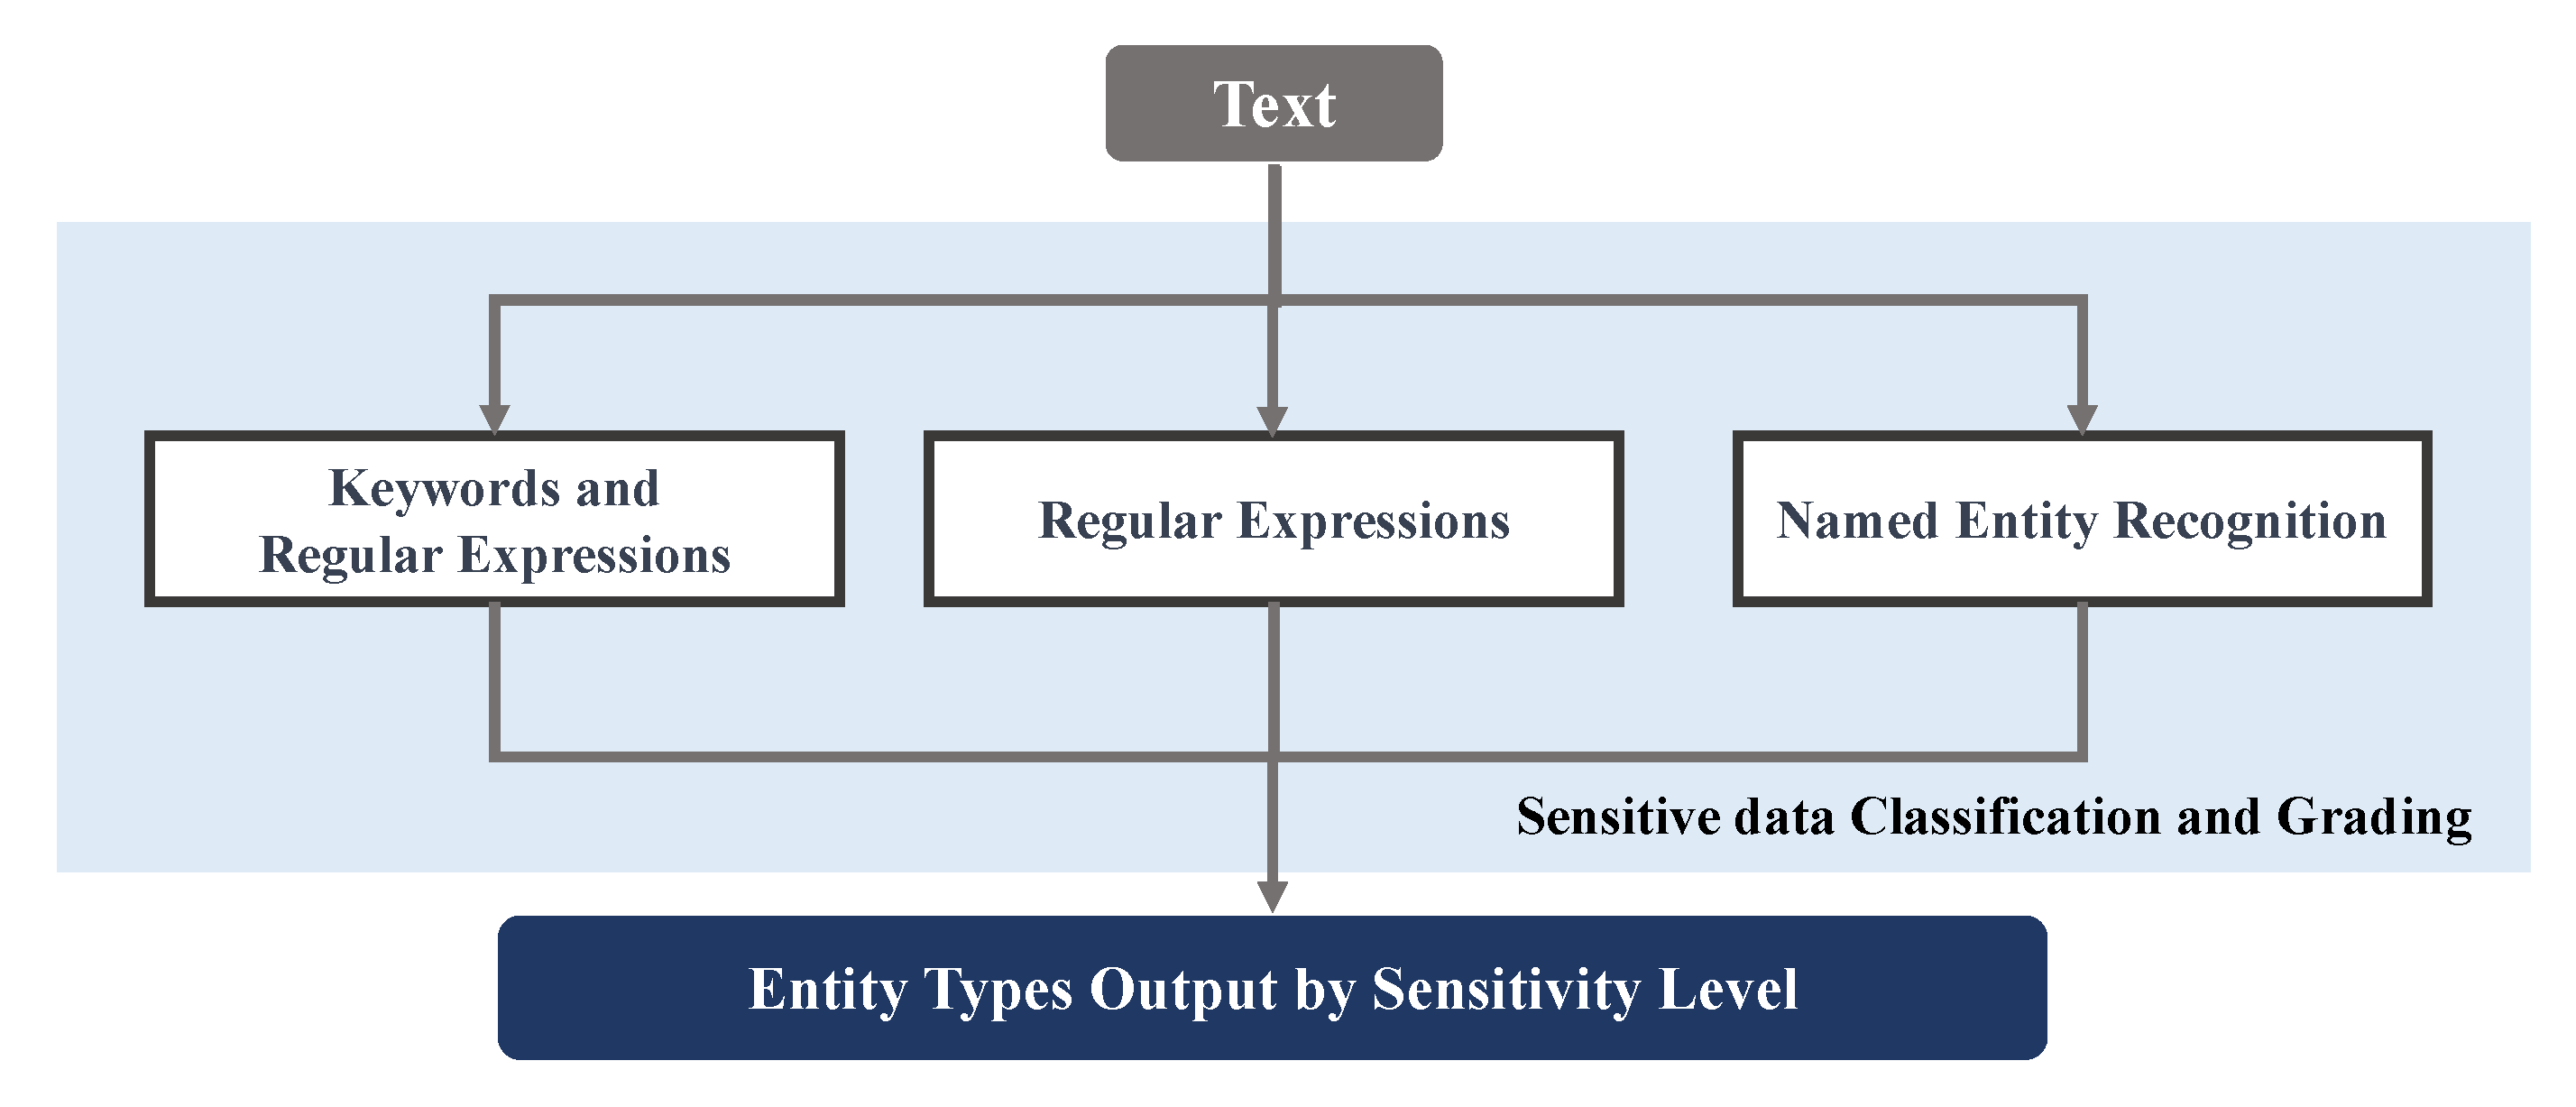
- Ensuring data compliance: In the context of open banking, the application side tends to locally store open banking data, necessitating compliance checks on these data to prevent potential leaks. As shown in Figure 2, a way is given for the application side to perform operations such as data desensitization and watermarking locally to enhance data security, in which data classification and grading is the basis.
- We propose a financial data classification and grading framework and a self-enlarging structured sensitive data classification and grading algorithm named UP-SDCG, with a synonym discrimination model innovatively introduced to further expand keywords and lexicons.
- Testing on real-world financial industry data, UP-SDCG outperforms existing public cloud algorithms in terms of accuracy and recall for sensitive data classification and grading.
- We further propose unstructured sensitive data classification and grading design scheme and scenario analysis.
2. Related Work
2.1. Structured Sensitive Data Classification
2.2. Unstructured Sensitive Data Classification
2.3. Data Classification and Grading Framework
3. Methodology
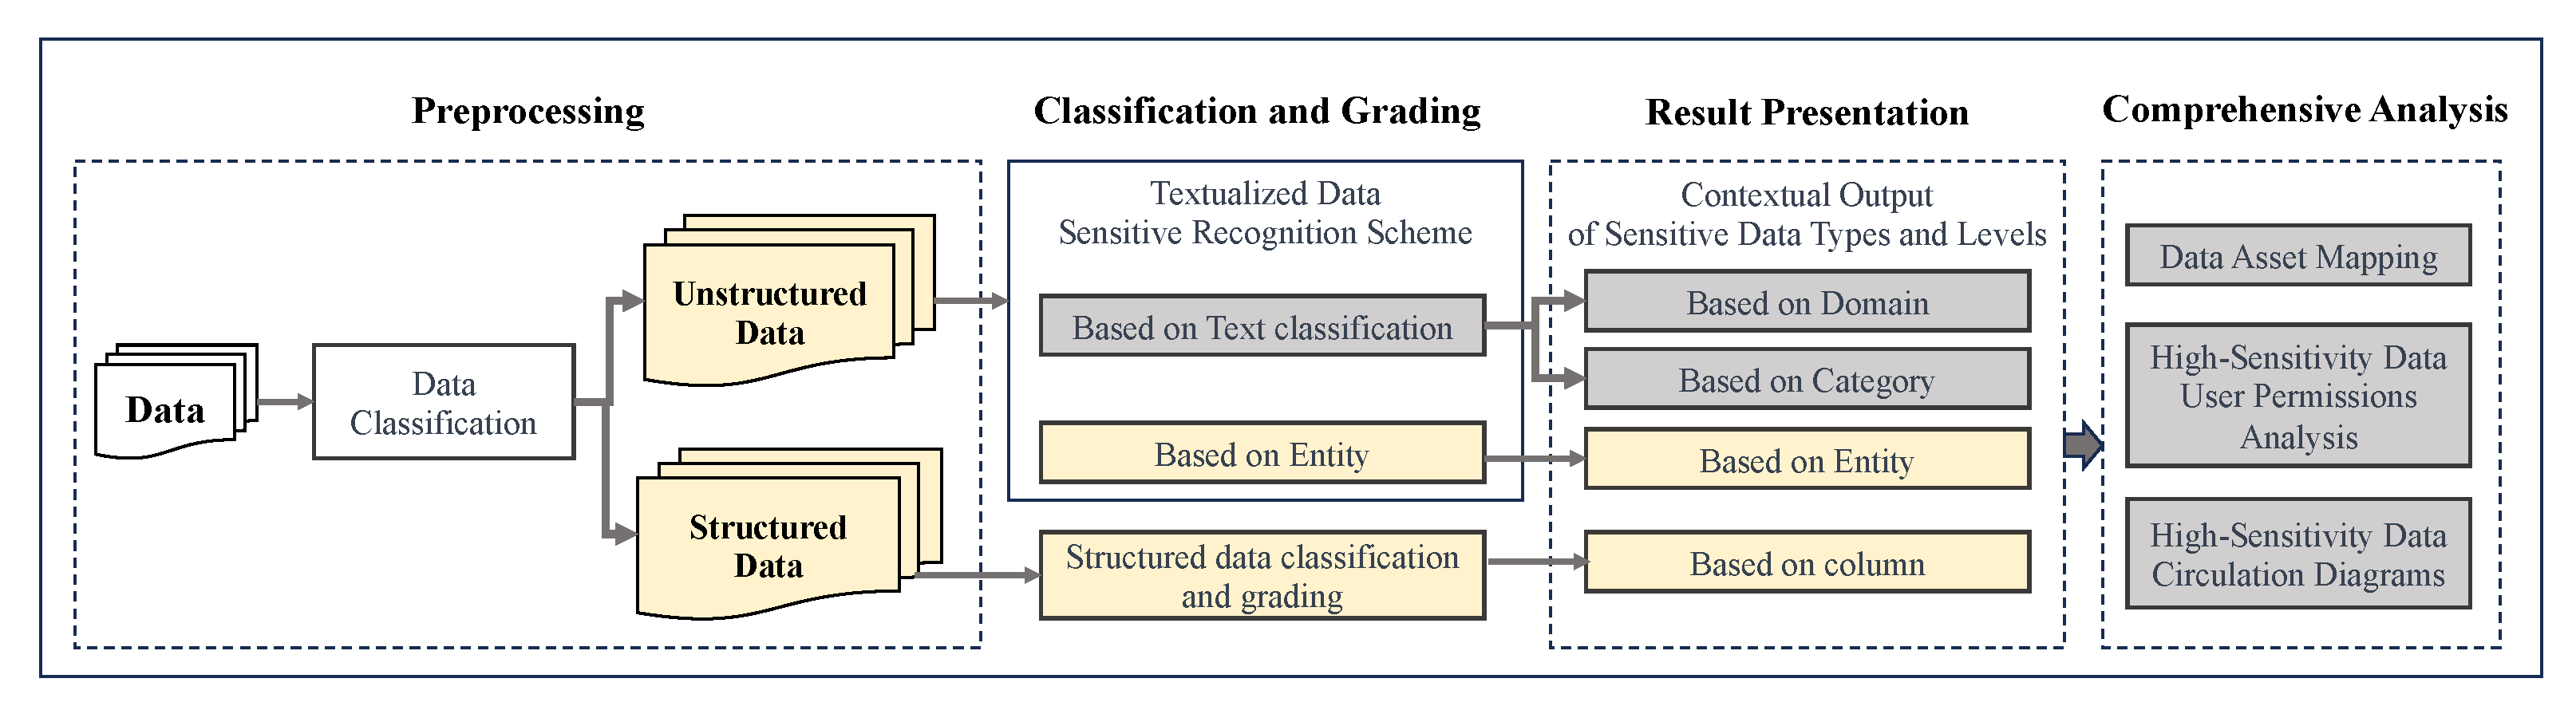
3.1. Data Classification Framework
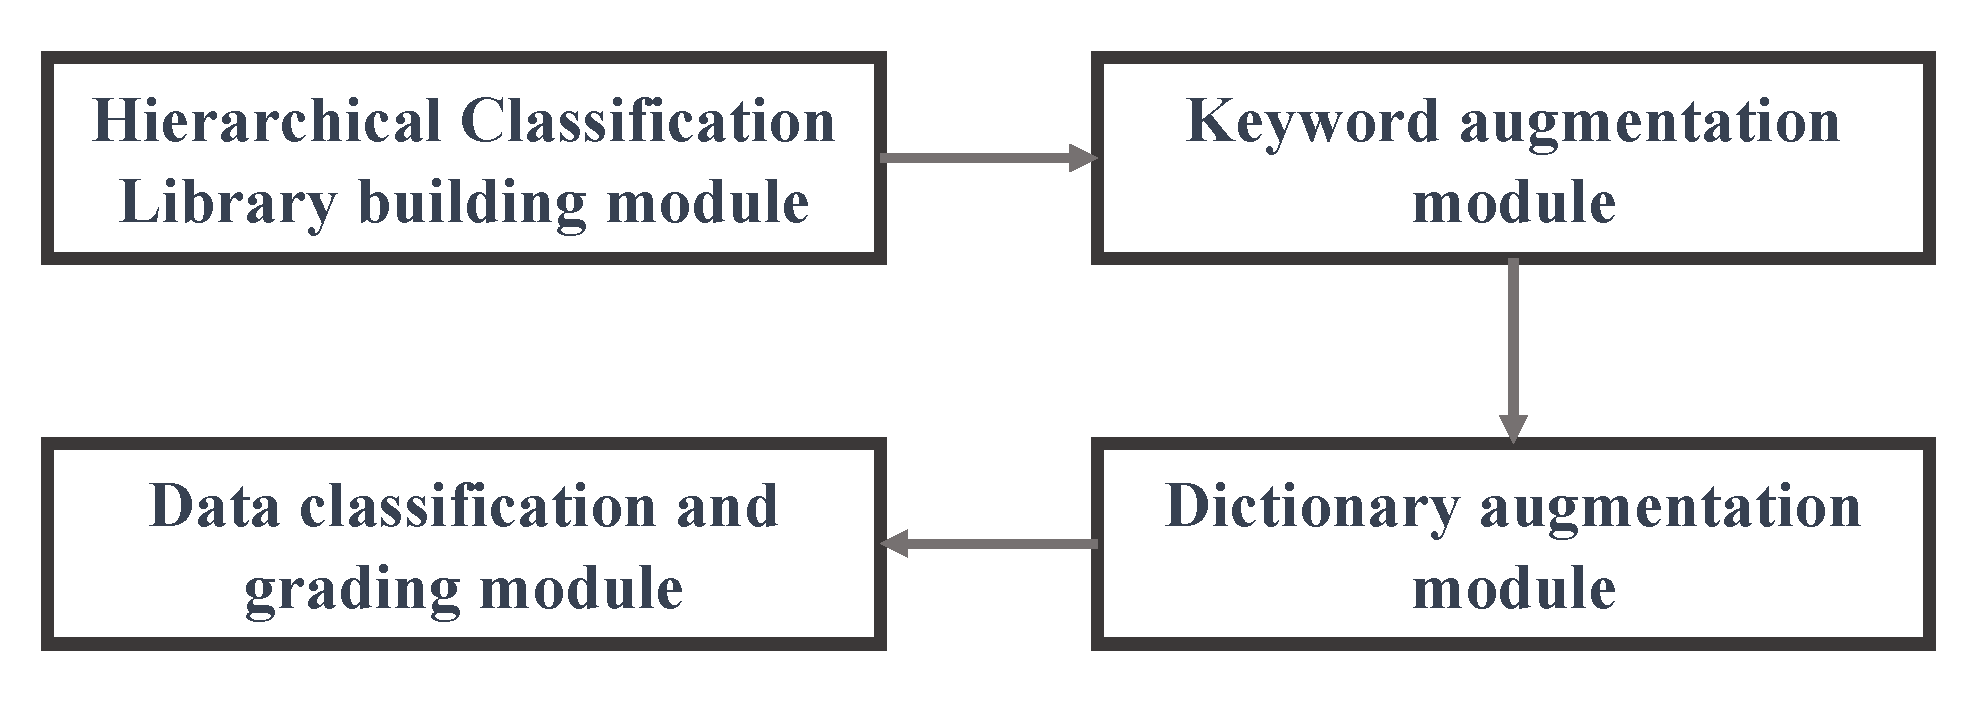
3.2. Structured Data Classification Framework
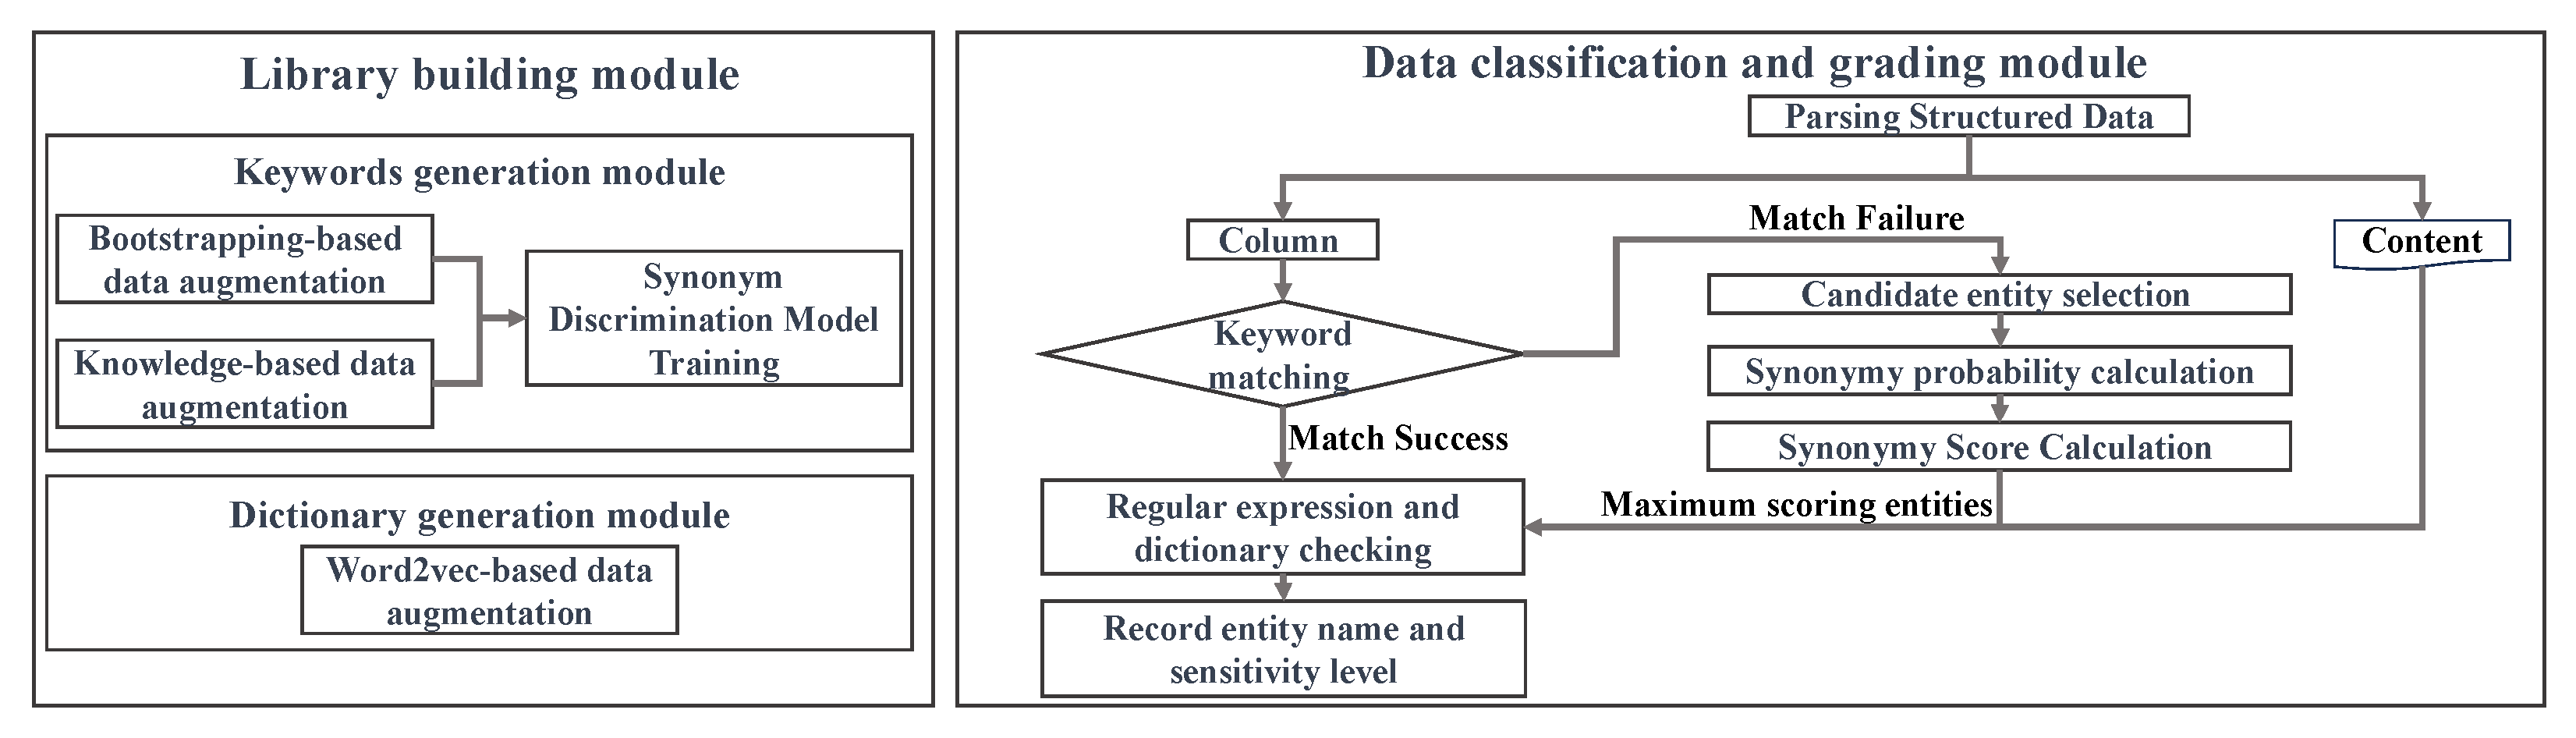
3.2.1. Library Building Module
- Strong Rule Entities: These entities are characterized by explicit and well-defined rules, resulting in minimal recognition errors, including Chinese ID numbers and Chinese cell phone numbers.
- Weak Rule Entities: These entities, including passwords and balances, exhibit some identifiable patterns, but regular expressions alone cannot guarantee complete matching.
- Irregular Entities: Unlike strong and weak rule entities, irregular entities lack discernible patterns or rules, making their identification particularly challenging.
3.2.2. Keyword Augmentation Module
- Keyword Augmentation Framework
- (1)
- Publicly available financial datasets: We used publicly accessible financial structured data to accumulate keywords. For example, we extracted statistics provided by the China Banking and Insurance Regulatory Commission;
- (2)
- Extended Synonym Thesaurus: Considering the uniqueness of Chinese synonyms, we employed the Synonym Thesaurus [32] compiled by Mei J. et al. [33] at the Harbin Institute of Technology Information Retrieval Laboratory as the foundation to construct the Extended Synonym Thesaurus. This extended version encompasses nearly 70,000 entries organized in a hierarchical tree-like structure, utilizing a five-level encoding pattern to classify the entries into five tiers: major category, intermediate category, minor category, word group, and atomic word group. Each atomic word group includes one or more synonymous words;
- (3)
- HowNet [34]: KnowNet utilizes tree-like sense-principal graphs and net-like sense-principal graphs to describe lexical properties;
- (4)
- Real data of the financial industry: We incorporated real information from the financial industry, specifically the banking industry interface.
- (1)
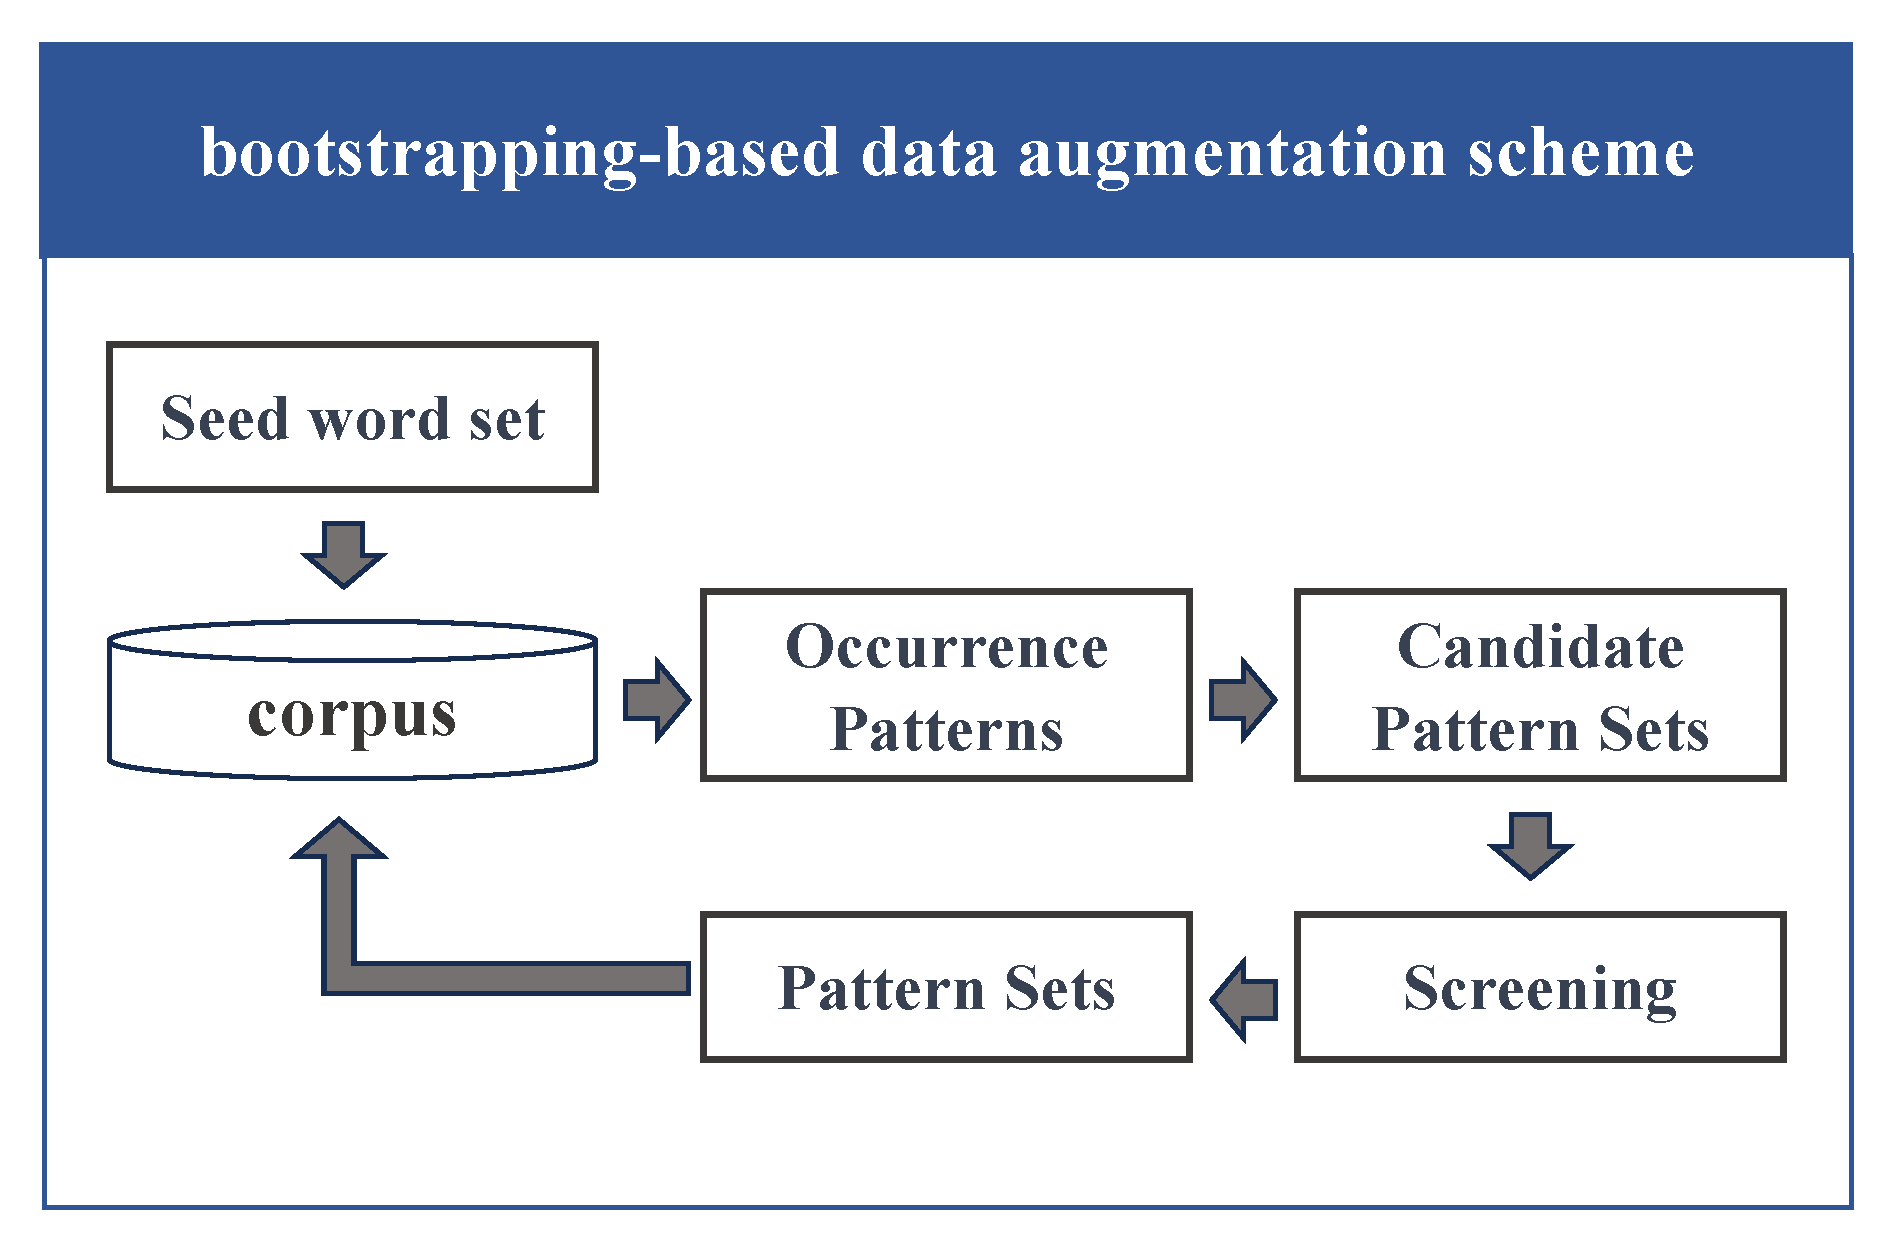
- Preparing the seed word set: This step involves collecting a set of high-quality alias word pairs for the current keyword;
- (2)
- Mining the occurrence patterns: We analyzed the occurrence patterns of both the native names and aliases in a corpus constructed from Wikipedia and the Baidu Encyclopedia. These patterns encompass instances like “X, also known as Y.” Furthermore, we utilized the seed word set to facilitate the identification of these patterns;
- (3)
- Generating pattern sets: Based on the identified occurrence patterns, we generated sets of patterns that can be used for further analysis;
- (4)
- Mining synonym pairs: Using the pattern sets, we extracted pairs of synonyms from the corpus. This step expands the range of synonymous terms associated with the designated keyword and facilitates a more comprehensive understanding of its semantic variations.
- Synonym Discrimination Model
- (1)
- We extracted keyword sets from the existing UP-SDCG Financial Data Hierarchical Classification Library. Each keyword set consists of several words with similar meanings;
- (2)
- For each keyword set , we employed knowledge-based and pattern-based keyword expansion techniques to extract the top five similarity words . These similarity words are used to construct the keyword candidate set;
- (3)
- We labeled the candidate words in the keyword candidate set. Words belonging to this keyword set were labeled as 1, while those not belonging to it were labeled as 0. Candidate keywords labeled as 1 were then expanded into the keyword set, resulting in the expanded keyword set. To train the classifier, we generated a collection of keyword training set-instance pairs from the pattern-based augmented keyword set. For each keyword set , we randomly retained an instance and constructed a positive set of instance samples where the label was 1. For each positive sample , we generated a negative sample by randomly selecting a negative instance where the label was 0. Following the research [36] experimental analysis, for each positive instance sample, we constructed five negative instance samples as shown in Table 4.
- (4)
- Next, we constructed the keyword set-candidate word classifier. We set the keyword set as , the candidate word as , and the corresponding label as . We followed work [36] for similar candidate word discrimination through scores. First, we used to quantify the degree of set similarity:where was put into the embedding layer to obtain the embedding vector and after that the original score representation was obtained and represents the post-transformer, we then used a fully connected neural network with three hidden layers to transform the obtained vectors into scores.Then, we computed the difference between the set and the set , and transformed it into a probability to determine the similarity between and keyword in :where is the sigmoid function. The model was optimized by minimizing the loss function:where belongs to while equals to 1, and is 0 when does not belong to . We set the parameter to to prevent the loss function from yielding infinite values.
3.2.3. Dictionary Augmentation Module
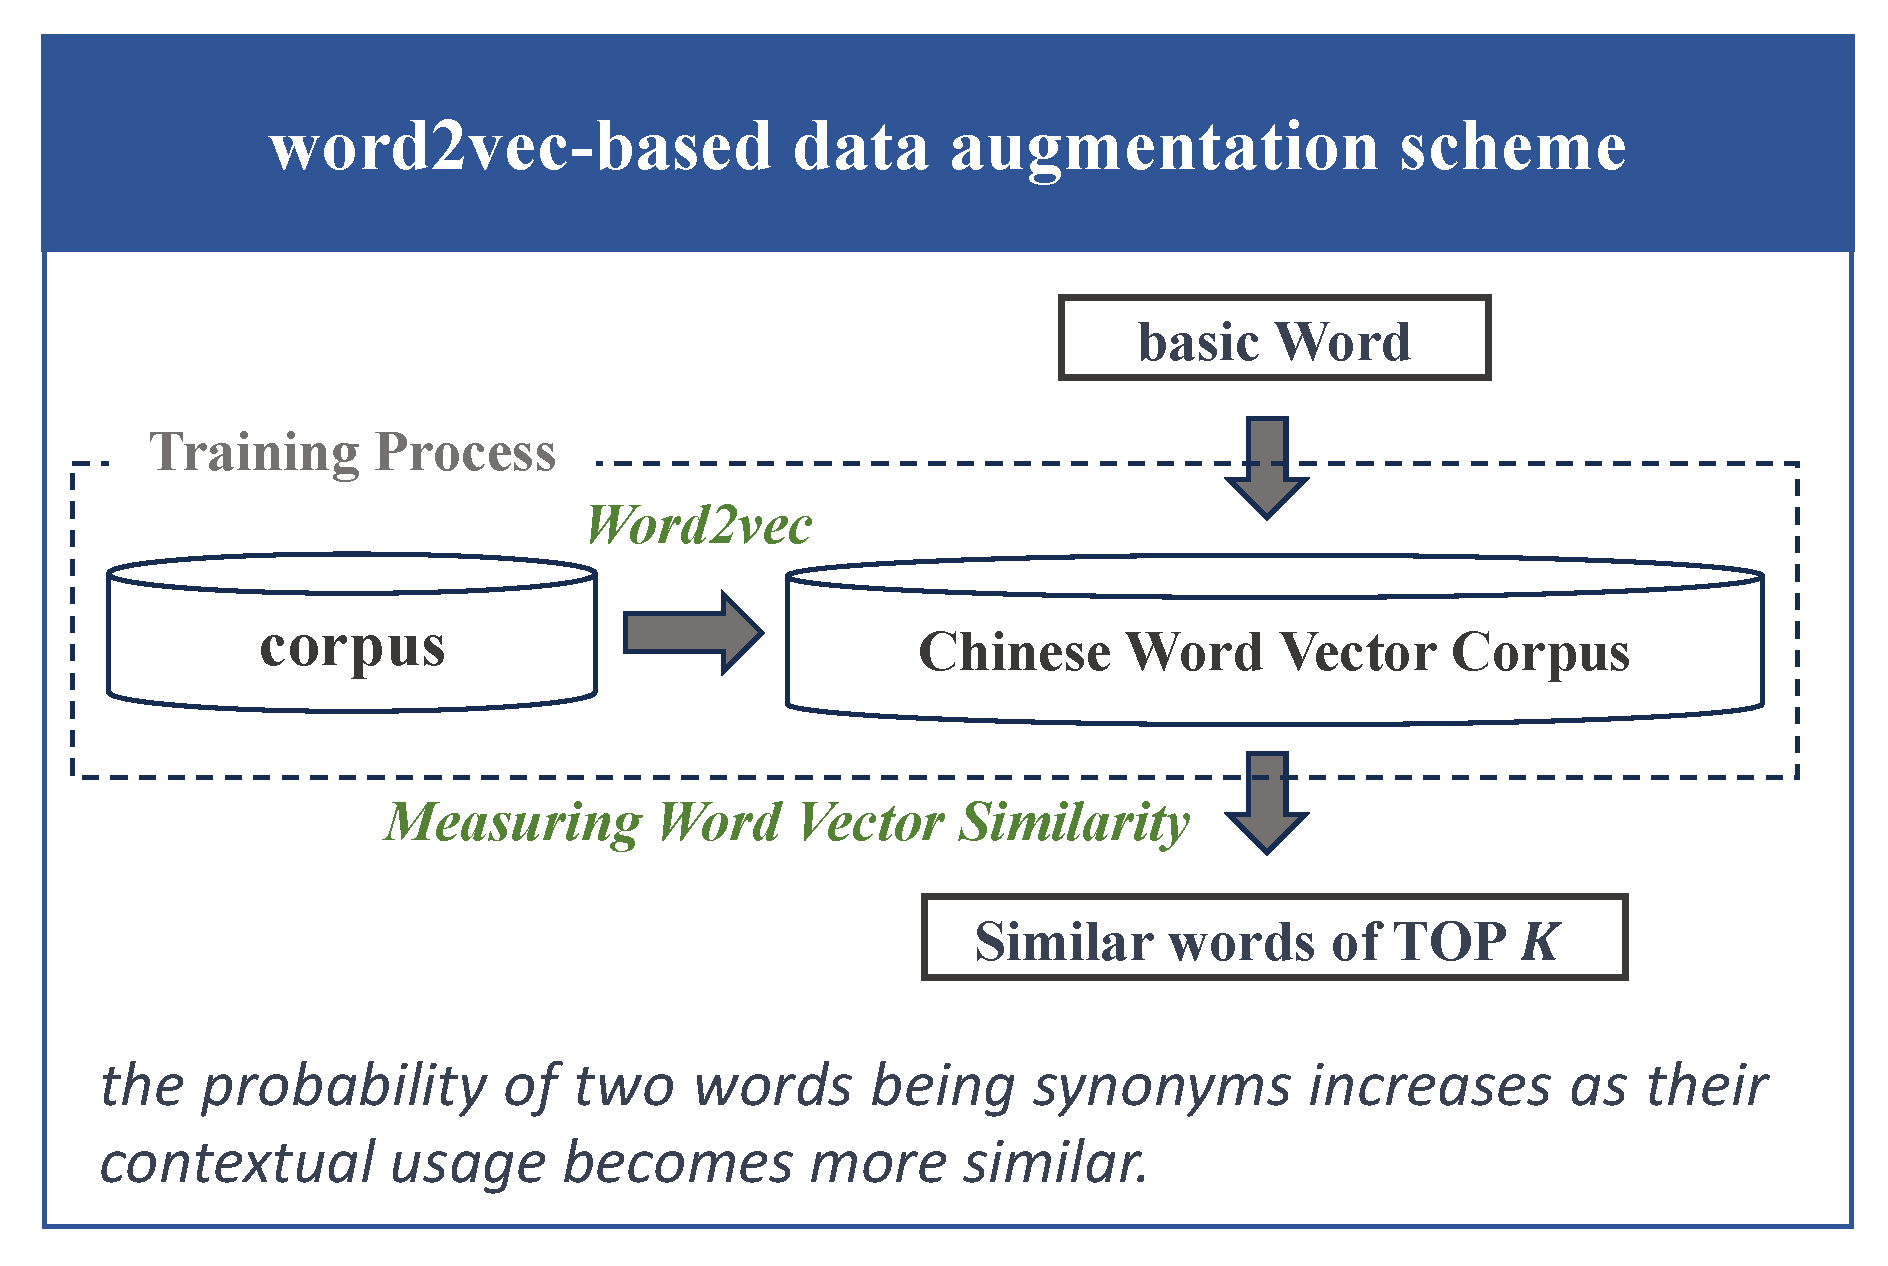
- (1)
- (2)
- Load the Embedding model with the selected pre-trained word vectors and fine-tune it using the financial corpus, which includes financial reports, financial news messages, etc.;
- (3)
- Subsequently, extract similar words from the fine-tuned word vectors using cosine distance to calculate the distance between words and construct the dictionary.
3.2.4. Data Classification and Grading Module
- (1)
- Parsing: Structure the data into two parts: field names and data content;
- (2)
- Field name identification: Utilize the keywords from the financial data hierarchical classification library to match the field names. If a corresponding field name is found, proceed to step 6; otherwise, move to step 3;
- (3)
- Candidate entity selection: Randomly select 100 rows of data (denoted as for ) and identify the data types, such as numeric value, English character, Chinese character, mixed character and date. Consider entities with the same data type from the Financial Data Hierarchical Classification Library as candidate entities;
- (4)
- Synonym probability calculation: Apply the synonym discriminant model to determine if the field name is synonymous with the keyword set of the candidate entity. Input the candidate entity’s keyword set and the field name s into the synonym discriminant model, resulting in the probability that the field name belongs to the keyword set. Iteratively traverse all candidate entities to obtain:
- (5)
- Synonym score calculation: Calculate the number of discrete information q and information entropy of the data:where represents the weight share of each index. The entity belonging to the keyword set with the highest score becomes the classification result, and step (6) is executed;
- (6)
- Calibration: Perform stratified sampling of the corresponding content of the field name. Apply sensitive rules belonging to the keywords that match successfully in the feature library under its regular items and dictionaries for secondary detection of the sampling results. Recognition is considered successful if the matching rate exceeds the set threshold; otherwise, it is considered a recognition failure;
- (7)
- Output: Output the corresponding entity name and sensitivity level from the Financial Data Hierarchical Classification Library if the recognition is successful. If the recognition fails, output NULL.
4. Experiments
4.1. Evaluation Metrics
4.2. Comparative Analysis
4.2.1. Datasets
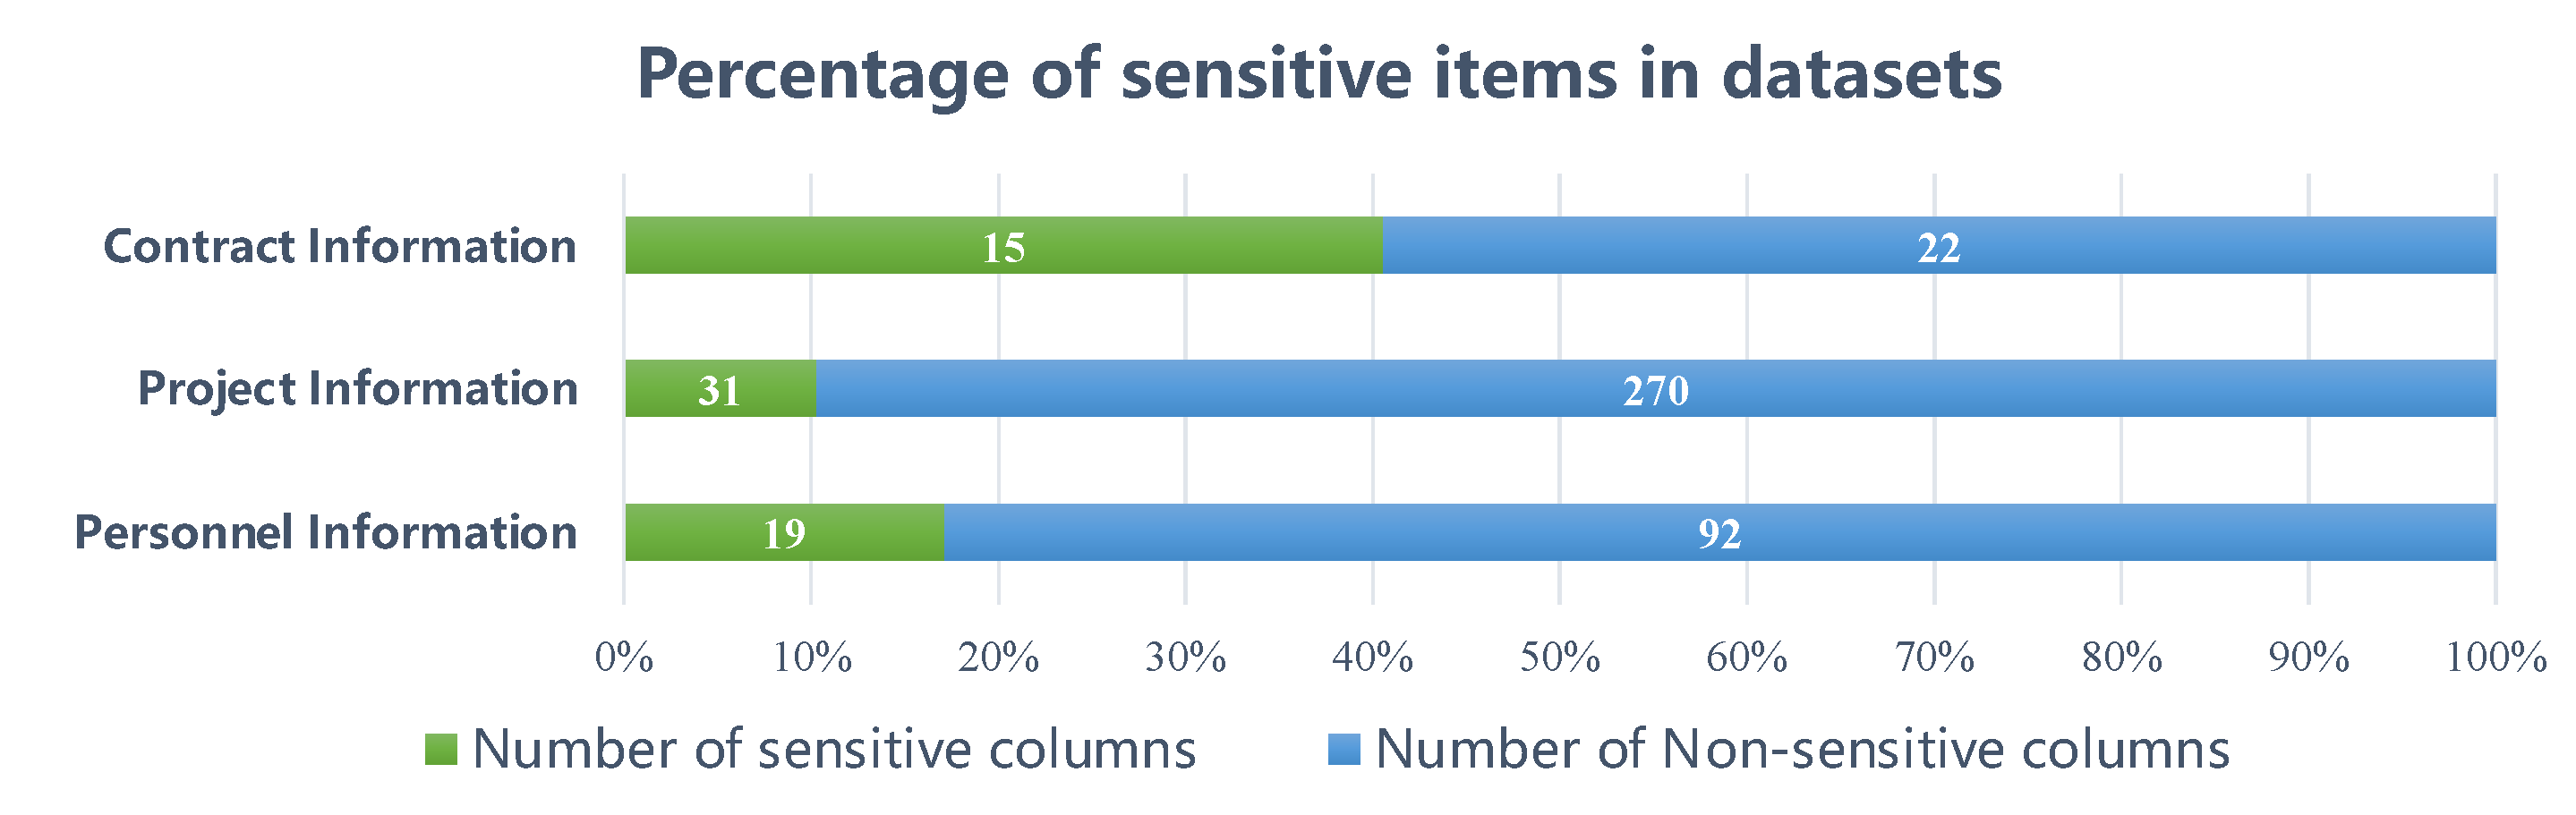
- Personnel information: The personnel dataset consists of 111 variables (columns) and 22,618 data points, encompassing details such as the employee’s name, gender, work number, cell phone number, email, department, and position.
- Project information: The project dataset contains basic information about the bank’s projects, comprising 301 variables and 23,208 data points. This dataset includes information pertaining to project personnel, departments, project budgets, and other relevant factors. It is noteworthy that the dataset contains a substantial amount of missing values.
- Contract information: The contract dataset has 37 variables and 6351 data points that relate to basic contract information as well as supplier information.
4.2.2. Experimental Results
- DSC sensitive data identification model(Alibaba): Including 210 detection rules, the financial classification template in the DSC sensitive data identification model is constructed with reference to the industry standard Financial Data Security Data Security Classification Guide;
- DSGC Sensitive Data Identification Model (Tencent): Use the built-in general classification and grading standard template for identification, which contains 41 detection rules;
- GoDLP (Bytedance): ByteDance’s open source tool for sensitive data identification in 2022, which can support structured data and unstructured data identification, with 36 built-in detection rules.
4.3. Practical Validation
4.3.1. Dataset
- Customer information: The customer dataset comprises 73 variables, encompassing a wide range of data including customer names, ID numbers, income details, addresses, phone numbers, and account passwords.
- Service data: The service dataset, encompassing information on loans, insurance, bonds, and cross-border transactions, comprises a total of 103 variables.
- Operation management: The Operation management dataset has 13 variables related to personal information as well as company financial information.
- Financial supervision: The financial supervision dataset has three variables related to information on regulatory indicators.
4.3.2. Experimental Results
- Ambiguous content representation: The data content pertaining to real-world business scenarios lacked clarity, which leads to certain omissions and false alarms in our analysis;
- Data quality challenges: In real business scenarios, we encounter issues such as typos, missing characters, and other irregularities, which contributed to certain omissions in our data processing.
4.4. Performance Analysis
5. Conclusions
Author Contributions
Funding
Data Availability Statement
Conflicts of Interest
Appendix A. Unstructured Data Classification and Grading Framework

Appendix A.1. Data Classification Based on Text Classification

| Text Classification Algorithm | Suitable Scenarios | Advantages | Disadvantages |
|---|---|---|---|
| FastText | Large sample sizes, multiple categories, tasks with limited semantic understanding | Fast, low computational requirements | Limited semantic understanding |
| CNN | Tasks requiring some semantic understanding | Captures more, broader, and finer text features | Long training time |
| Self-Attention | Tasks requiring some semantic understanding | Captures more, broader, and finer text features, long-term dependencies within the text | Long training time |
| Traditional Machine Learning | Short texts (e.g., messages, microblogs, comments) with less than 150 words | Fast training | Unable to handle long texts |
| BERT | Limited labeled data scenarios | High accuracy | Long training and prediction time |
Appendix A.2. Data Classification Based on Entity

| Model | Application Scenarios | Advantages | Disadvantages |
|---|---|---|---|
| BiLSTM + CRF | Large sample data, multiple label categories | Simple model structure, fast training speed | Moderate entity extraction performance |
| StructBert | Insufficient annotated data | Good entity extraction | Lower overall performance |
| StructBert + CRF | Small data scenarios | Good entity extraction performance | Lower overall performance |
Appendix B. Unstructured Data Classification and Grading Framework
| Industry | Compliance Standard | Regulatory Authority |
|---|---|---|
| General | “Guidelines for Cybersecurity Standard Practice—Network Data Classification and Grading” | National Information Security Standardization Technical Committee |
| Industrial | “Guidelines for Industrial Data Classification and Grading” | Ministry of Industry and Information Technology (MIIT) of China |
| Financial | “Financial Data Security—Data Classification and Grading Guidelines” | People’s Bank of China (PBOC) |
| Financial | “Technical Specifications for Personal Financial Information Protection” | People’s Bank of China (PBOC) |
| Financial | “Guidelines for Securities and Futures Industry Data Classification and Grading” | China Securities Regulatory Commission (CSRC) |
| Telecommunication | “Method for Data Classification and Grading of Basic Telecommunication Enterprises” | Ministry of Industry and Information Technology (MIIT) of China |
| Telecommunication | “Guidelines for Identifying Important Data in Basic Telecommunication Enterprises” | Ministry of Industry and Information Technology (MIIT) of China |
| Medical | “Information Security Technology—Healthcare Data Security Guidelines” | China National Information Security Standardization Technical Committee |
| Automotive | “Regulations on Automotive Data Security Management” | Ministry of Industry and Information Technology (MIIT) of China |
References
- Seaman, J. PCI DSS: An Integrated Data Security Standard Guide; Apress: Berkeley, CA, USA, 2020. [Google Scholar]
- George, G. The Public Company Accounting Reform and Investor Protection Act of 2002: Any implications for Australia? Aust. J. Corp. Law 2002, 14, 286–295. [Google Scholar]
- General Data Protection Regulation. General Data Protection Regulation (GDPR)—Final Text Neatly Arranged. Available online: https://gdpr.verasafe.com/ (accessed on 13 March 2024).
- Pardau, S.L. The California consumer privacy act: Towards a European-style privacy regime in the United States. J. Technol. Law Policy 2018, 23, 68. [Google Scholar]
- Brodsky, L.; Oakes, L. Data Sharing and open Banking; McKinsey & Company: Chicago, IL, USA, 2017; p. 1105. [Google Scholar]
- Yuan, J. Practice and Thoughts on Information Security Protection of Open Banks under the New Financial Situation; Financial Electronification: 2021. Available online: https://www.secrss.com/articles/35541 (accessed on 13 March 2024).
- Zu, L.; Li, H.; Zhang, L.; Lu, Z.; Ye, J.; Zhao, X.; Hu, S. E-SAWM: A Semantic Analysis-Based ODF Watermarking Algorithm for Edge Cloud Scenarios. Future Internet 2023, 15, 283. [Google Scholar] [CrossRef]
- Guan, X.; Zhou, C.; Cao, W. Research on Classification Method of Sensitive Structural Data of Electric Power. In Proceedings of the 2022 IEEE 12th International Conference on Electronics Information and Emergency Communication (ICEIEC), Beijing, China, 15–17 July 2022; pp. 268–271. [Google Scholar]
- Rajkamal, M.; Sumathi, M.; Vijayaraj, N.; Prabu, S.; Uganya, G. Sensitive data identification and protection in a structured and unstructured data in cloud based storage. Ann. Rom. Soc. Cell Biol. 2021, 25, 1157–1166. [Google Scholar]
- Ray, S.; Mishra, K.N.; Dutta, S. Sensitive data identification and security assurance in cloud and IoT based networks. Int. J. Comput. Netw. Inf. Secur. IJCNIS 2022, 14, 11–27. [Google Scholar] [CrossRef]
- Mouza, C.; Métais, E.; Lammari, N.; Akoka, J.; Aubonnet, T.; Comyn-Wattiau, I.; Fadili, H.; Cherfi, S.S.S. Towards an automatic detection of sensitive information in a database. In Proceedings of the 2010 Second International Conference on Advances in Databases, Knowledge, and Data Applications, Menuires, France, 11–16 April 2010; pp. 247–252. [Google Scholar]
- Yi, T.; Shi, M. Privacy protection method for multiple sensitive attributes based on strong rule. Math. Probl. Eng. 2015, 2015, 464731. [Google Scholar] [CrossRef]
- Xiao, Y.; Li, H. Privacy preserving data publishing for multiple sensitive attributes based on security level. Information 2020, 11, 166. [Google Scholar] [CrossRef]
- Chong, P. Deep Learning Based Sensitive Data Detection. In Proceedings of the 2022 19th International Computer Conference on Wavelet Active Media Technology and Information Processing (ICCWAMTIP), Chengdu, China, 16–18 December 2022; pp. 1–6. [Google Scholar]
- Silva, P.; Gonçalves, C.; Godinho, C.; Antunes, N.; Curado, M. Using nlp and machine learning to detect data privacy violations. In Proceedings of the IEEE INFOCOM 2020—IEEE Conference on Computer Communications Workshops (INFOCOM WKSHPS), Toronto, ON, Canada, 6–9 July 2020; pp. 972–977. [Google Scholar]
- Ma, J.; Zhang, J.; Xiao, L.; Chen, K.; Wu, J. Classification of power quality disturbances via deep learning. IETE Tech. Rev. 2017, 34, 408–415. [Google Scholar] [CrossRef]
- Park, J.s.; Kim, G.w.; Lee, D.h. Sensitive data identification in structured data through genner model based on text generation and ner. In Proceedings of the 2020 International Conference on Computing, Networks and Internet of Things, Sanya, China, 24–26 April 2020; pp. 36–40. [Google Scholar]
- Jiang, H.; Chen, C.; Wu, S.; Guo, Y. Classification of Medical Sensitive Data based on Text Classification. In Proceedings of the 2019 IEEE International Conference on Consumer Electronics-Taiwan (ICCE-TW), Yilan, Taiwan, 20–22 May 2019; pp. 1–2. [Google Scholar]
- Považanec, A. Comparison of Machine Learning Methods for Sensitive Data Identification. Undergraduate Thesis, Masaryk University, Brno, Czech Republic, 2020. [Google Scholar]
- Yang, R.; Gao, X.; Gao, P. Research on intelligent recognition and tracking technology of sensitive data for electric power big data. In Proceedings of the 2021 13th International Conference on Measuring Technology and Mechatronics Automation (ICMTMA), Beihai, China, 16–17 January 2021; pp. 229–234. [Google Scholar]
- Gambarelli, G.; Gangemi, A.; Tripodi, R. Is Your Model Sensitive? SPeDaC: A New Benchmark for Detecting and Classifying Sensitive Personal Data. arXiv 2022, arXiv:2208.06216. [Google Scholar]
- Dias, M.; Boné, J.; Ferreira, J.C.; Ribeiro, R.; Maia, R. Named entity recognition for sensitive data discovery in Portuguese. Appl. Sci. 2020, 10, 2303. [Google Scholar]
- García-Pablos, A.; Perez, N.; Cuadros, M. Sensitive data detection and classification in Spanish clinical text: Experiments with BERT. arXiv 2020, arXiv:2003.03106. [Google Scholar]
- Aldeco-Pérez, R.; Moreau, L. A provenance-based compliance framework. In Proceedings of the Future Internet Symposium, Berlin, Germany, 20–22 September 2010; pp. 128–137. [Google Scholar]
- Aldeco Perez, R.; Moreau, L. Provenance-based auditing of private data use. In Proceedings of the Visions of Computer Science—BCS International Academic Conference (VOCS), London, UK, 22–24 September 2008. [Google Scholar]
- Yang, M.; Tan, L.; Chen, X.; Luo, Y.; Xu, Z.; Lan, X. Laws and regulations tell how to classify your data: A case study on higher education. Inf. Process. Manag. 2023, 60, 103240. [Google Scholar] [CrossRef]
- Elluri, L.; Nagar, A.; Joshi, K.P. An integrated knowledge graph to automate gdpr and pci dss compliance. In Proceedings of the 2018 IEEE International Conference on Big Data (Big Data), Shanghai, China, 15–17 January 2018; pp. 1266–1271. [Google Scholar]
- Elluri, L.; Joshi, K.P. A knowledge representation of cloud data controls for EU GDPR compliance. In Proceedings of the 2018 IEEE World Congress on Services (SERVICES), San Francisco, CA, USA, 2–7 July 2018; pp. 45–46. [Google Scholar]
- Yang, M.; Chen, X.; Tan, L.; Lan, X.; Luo, Y. Listen carefully to experts when you classify data: A generic data classification ontology encoded from regulations. Inf. Process. Manag. 2023, 60, 103186. [Google Scholar]
- Wang, J.; Wang, L.; Gao, S.; Tian, M.; Li, Y.; Xiao, K. Research on Data Classification and Grading Method Based on After sales Energy Replenishment Scenarios. In Proceedings of the 2022 2nd International Conference on Big Data, Artificial Intelligence and Risk Management (ICBAR), Xi’an, China, 25–27 November 2022; pp. 11–15. [Google Scholar]
- JR/T 0197-2022; Financial Data Security—Guidelines for Data Security Classification. Technical Report; People’s Bank of China: Beijing, China, 2020.
- Quan, Y.; Yuquan, S. Research on Semantic Similarity Calculation Based on the Depth of “Synonymous Treebank”. J. Comput. Eng. Appl. 2020, 56, 48–54. [Google Scholar]
- Mei, J.; Zhu, Y.; Gao, Y.; Yin, H. Synonym Word Forest; Shanghai Dictionary Press: Shanghai, China, 1983. [Google Scholar]
- Dong, Z.; Dong, Q. HowNet—A hybrid language and knowledge resource. In Proceedings of the International Conference on Natural Language Processing and Knowledge Engineering, Beijing, China, 26–29 October 2003; pp. 820–824. [Google Scholar]
- Agichtein, E.; Gravano, L. Snowball: Extracting relations from large plain-text collections. In Proceedings of the Proceedings of the Fifth ACM Conference on Digital Libraries, San Antonio, TX, USA, 2–7 June 2000; pp. 85–94. [Google Scholar]
- Shen, J.; Lyu, R.; Ren, X.; Vanni, M.; Sadler, B.; Han, J. Mining entity synonyms with efficient neural set generation. In Proceedings of the AAAI Conference on Artificial Intelligence, Honolulu, HI, USA, 27 January–1 February 2019; Volume 33, pp. 249–256. [Google Scholar]
- Mikolov, T.; Chen, K.; Corrado, G.; Dean, J. Efficient estimation of word representations in vector space. arXiv 2013, arXiv:1301.3781. [Google Scholar]
- Song, Y.; Shi, S.; Li, J.; Zhang, H. Directional skip-gram: Explicitly distinguishing left and right context for word embeddings. In Proceedings of the 2018 Conference of the North American Chapter of the Association for Computational Linguistics: Human Language Technologies, New Orleans, LA, USA, 1–6 June 2018; Volume 2 (Short Papers), pp. 175–180. [Google Scholar]
- Pennington, J.; Socher, R.; Manning, C.D. Glove: Global vectors for word representation. In Proceedings of the 2014 Conference on Empirical Methods in Natural Language Processing (EMNLP), Doha, Qatar, 25–29 October 2014; pp. 1532–1543. [Google Scholar]
- Bojanowski, P.; Grave, E.; Joulin, A.; Mikolov, T. Enriching word vectors with subword information. Trans. Assoc. Comput. Linguist. 2017, 5, 135–146. [Google Scholar] [CrossRef]
- He, W. Intelligent Recognition Algorithm and Adaptive Protection Model for Sensitive Data. Master’s Thesis, Guizhou University, Guiyang, China, 2020. [Google Scholar]


| Entity Type | Structured Recognition Method |
|---|---|
| Strong Rule Entities | Regular Expression |
| Weak Rule Entities | Keyword + Regular Expression |
| Irregular Entities | Keyword + Dictionary |
| Entity Name | Sensitivity Level | Entity Type | Keywords | Features |
|---|---|---|---|---|
| Name | 3 | Irregular Entity | Name | Name |
| Gender | 3 | Weak Rule Entities | Gender | Gender (Broad) |
| Gender | 3 | Strong Rule Entities | - | Gender (Narrow) |
| Nationality | 3 | Irregular Entity | Nationality | Country Name |
| ID Effective Date | 3 | Weak Rule Entities | ID Effective Date | Date |
| Enrollment Date | 2 | Weak Rule Entities | Enrollment Date | Date |
| Personal Income | 3 | Weak Rule Entities | Personal Income | Amount |
| Deposit | 2 | Weak Rule Entities | Deposit | Amount |
| Feature Name | Regular Expression | Dictionary |
|---|---|---|
| Name | - | Chinese Name |
| Gender (Broad) | - | |
| Gender (Narrow) | - | |
| Country Name | - | Country Name |
| Date | \ | |
| \ | - | |
| Amount | ⌃ | - |
| Candidate Keywords | Keywords Set | Label |
|---|---|---|
| 0 | ||
| 1 | ||
| ⋯ | ⋯ | ⋯ |
| 1 | ||
| 1 | ||
| ⋯ | ⋯ | ⋯ |
| 0 | ||
| 0 |
| Dataset | Row Number | Column Number | Sensitive Columns | Non-Sensitive Columns | Sensitive Type |
|---|---|---|---|---|---|
| Personnel Information | 22,618 | 111 | 19 | 92 | Name, gender, phone number, email address, company name |
| Project Information | 23,208 | 301 | 31 | 270 | Information about departments and personnel involved in the project |
| Contract Information | 6351 | 37 | 15 | 22 | Contract payment information |
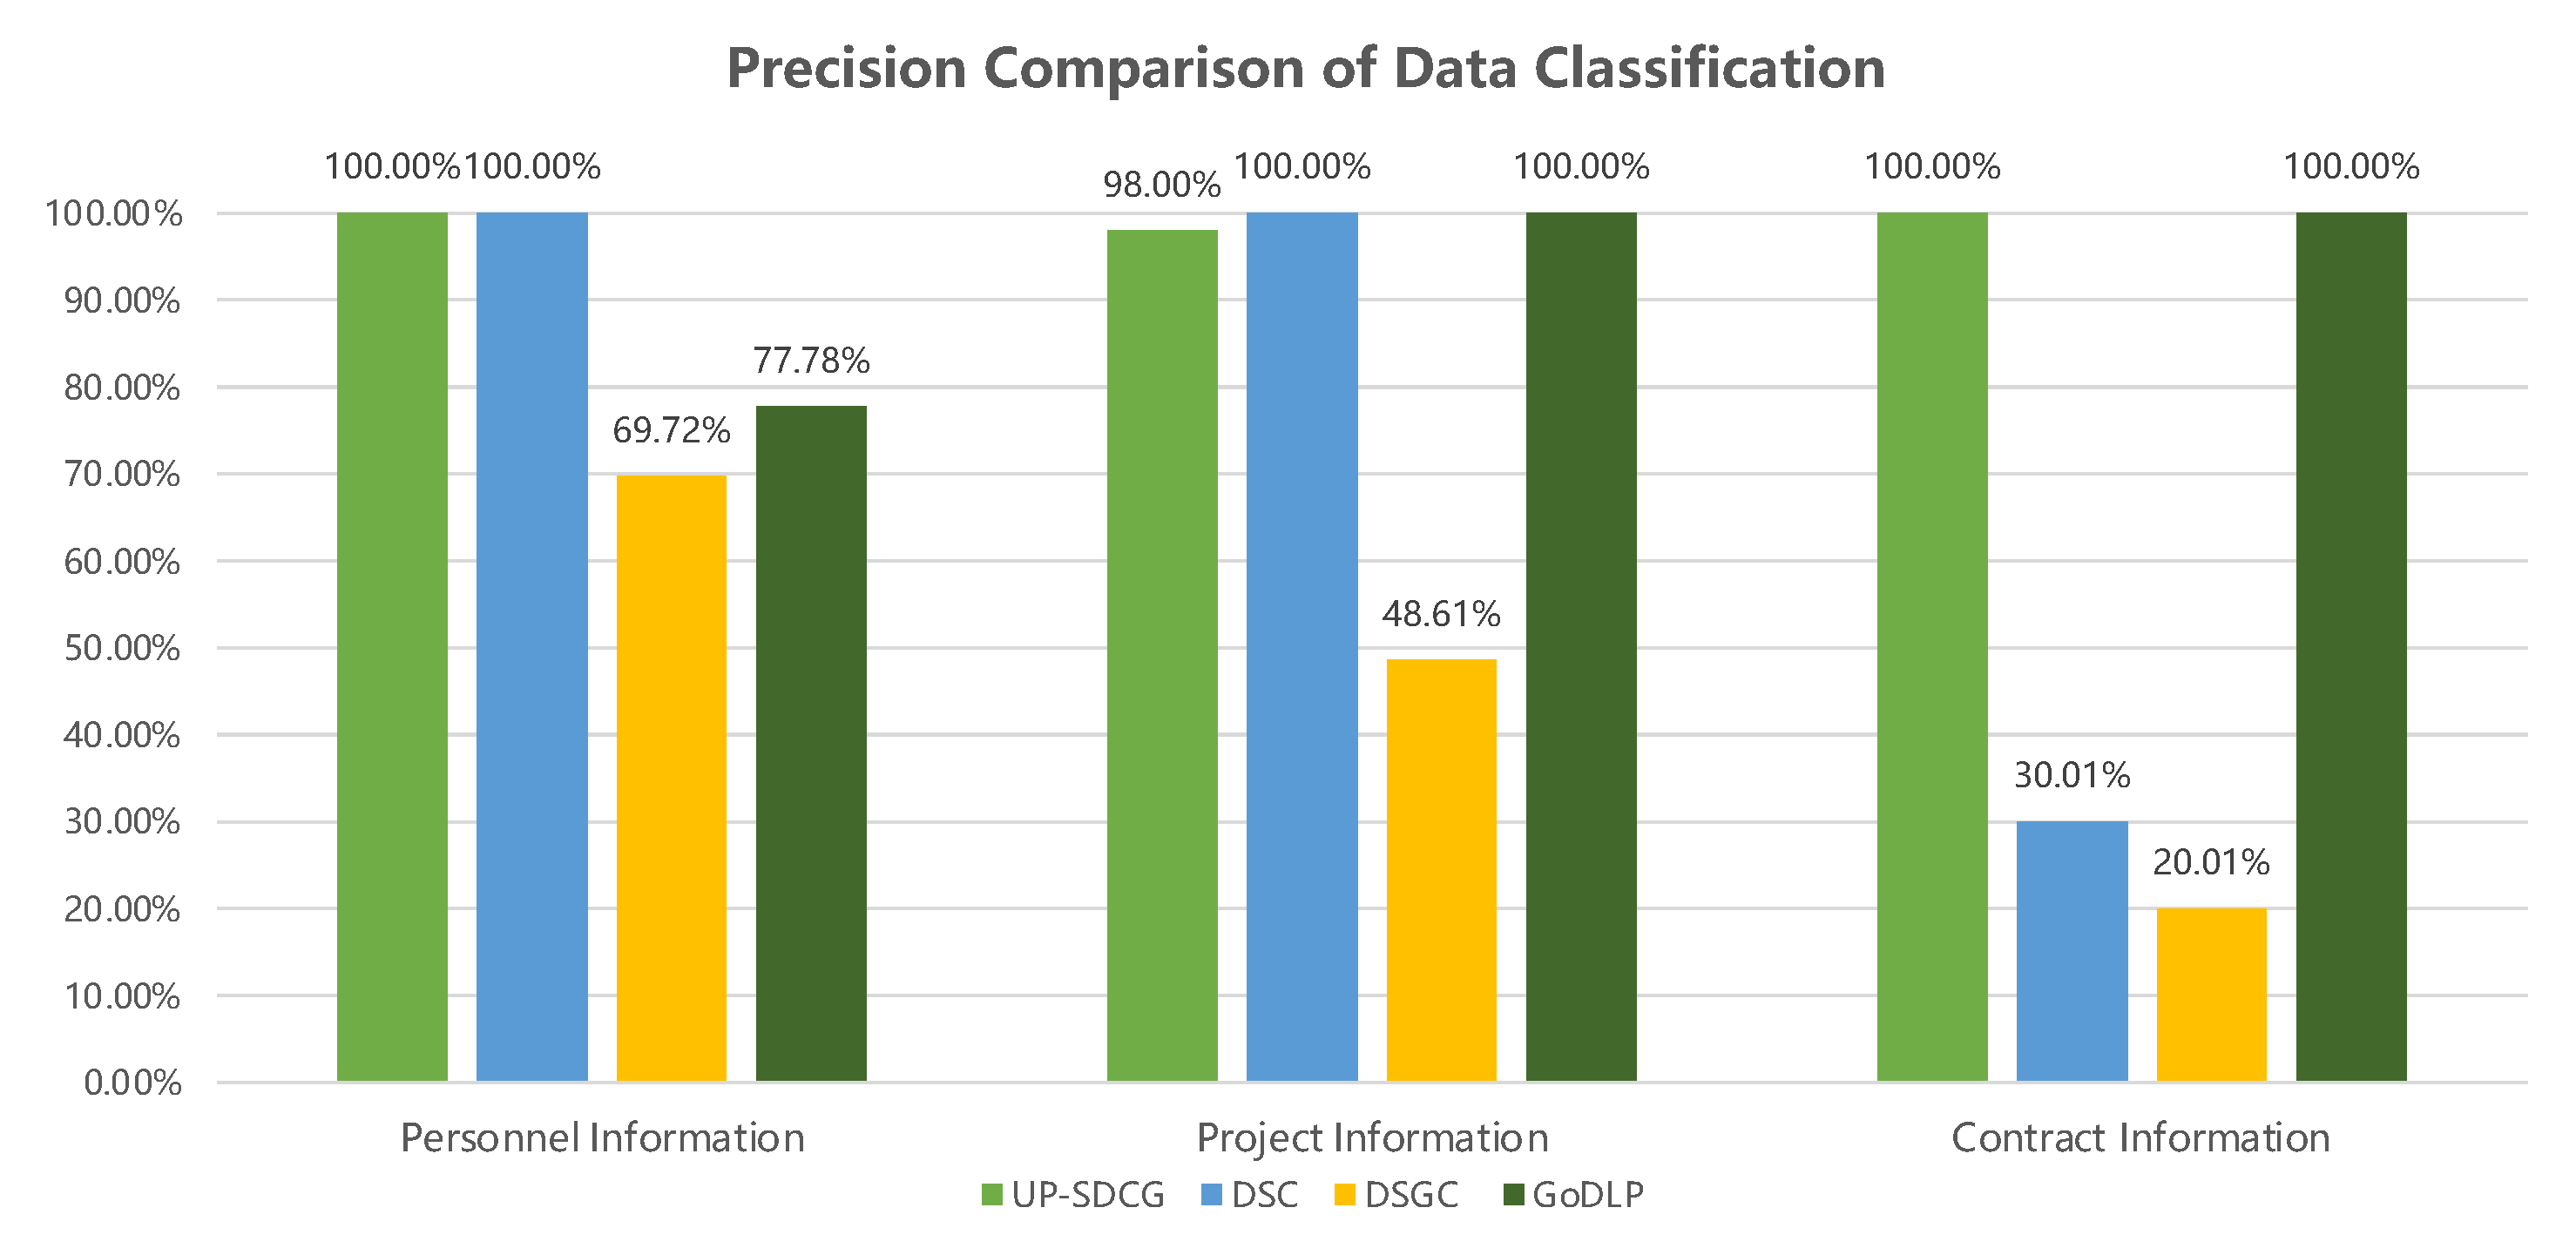
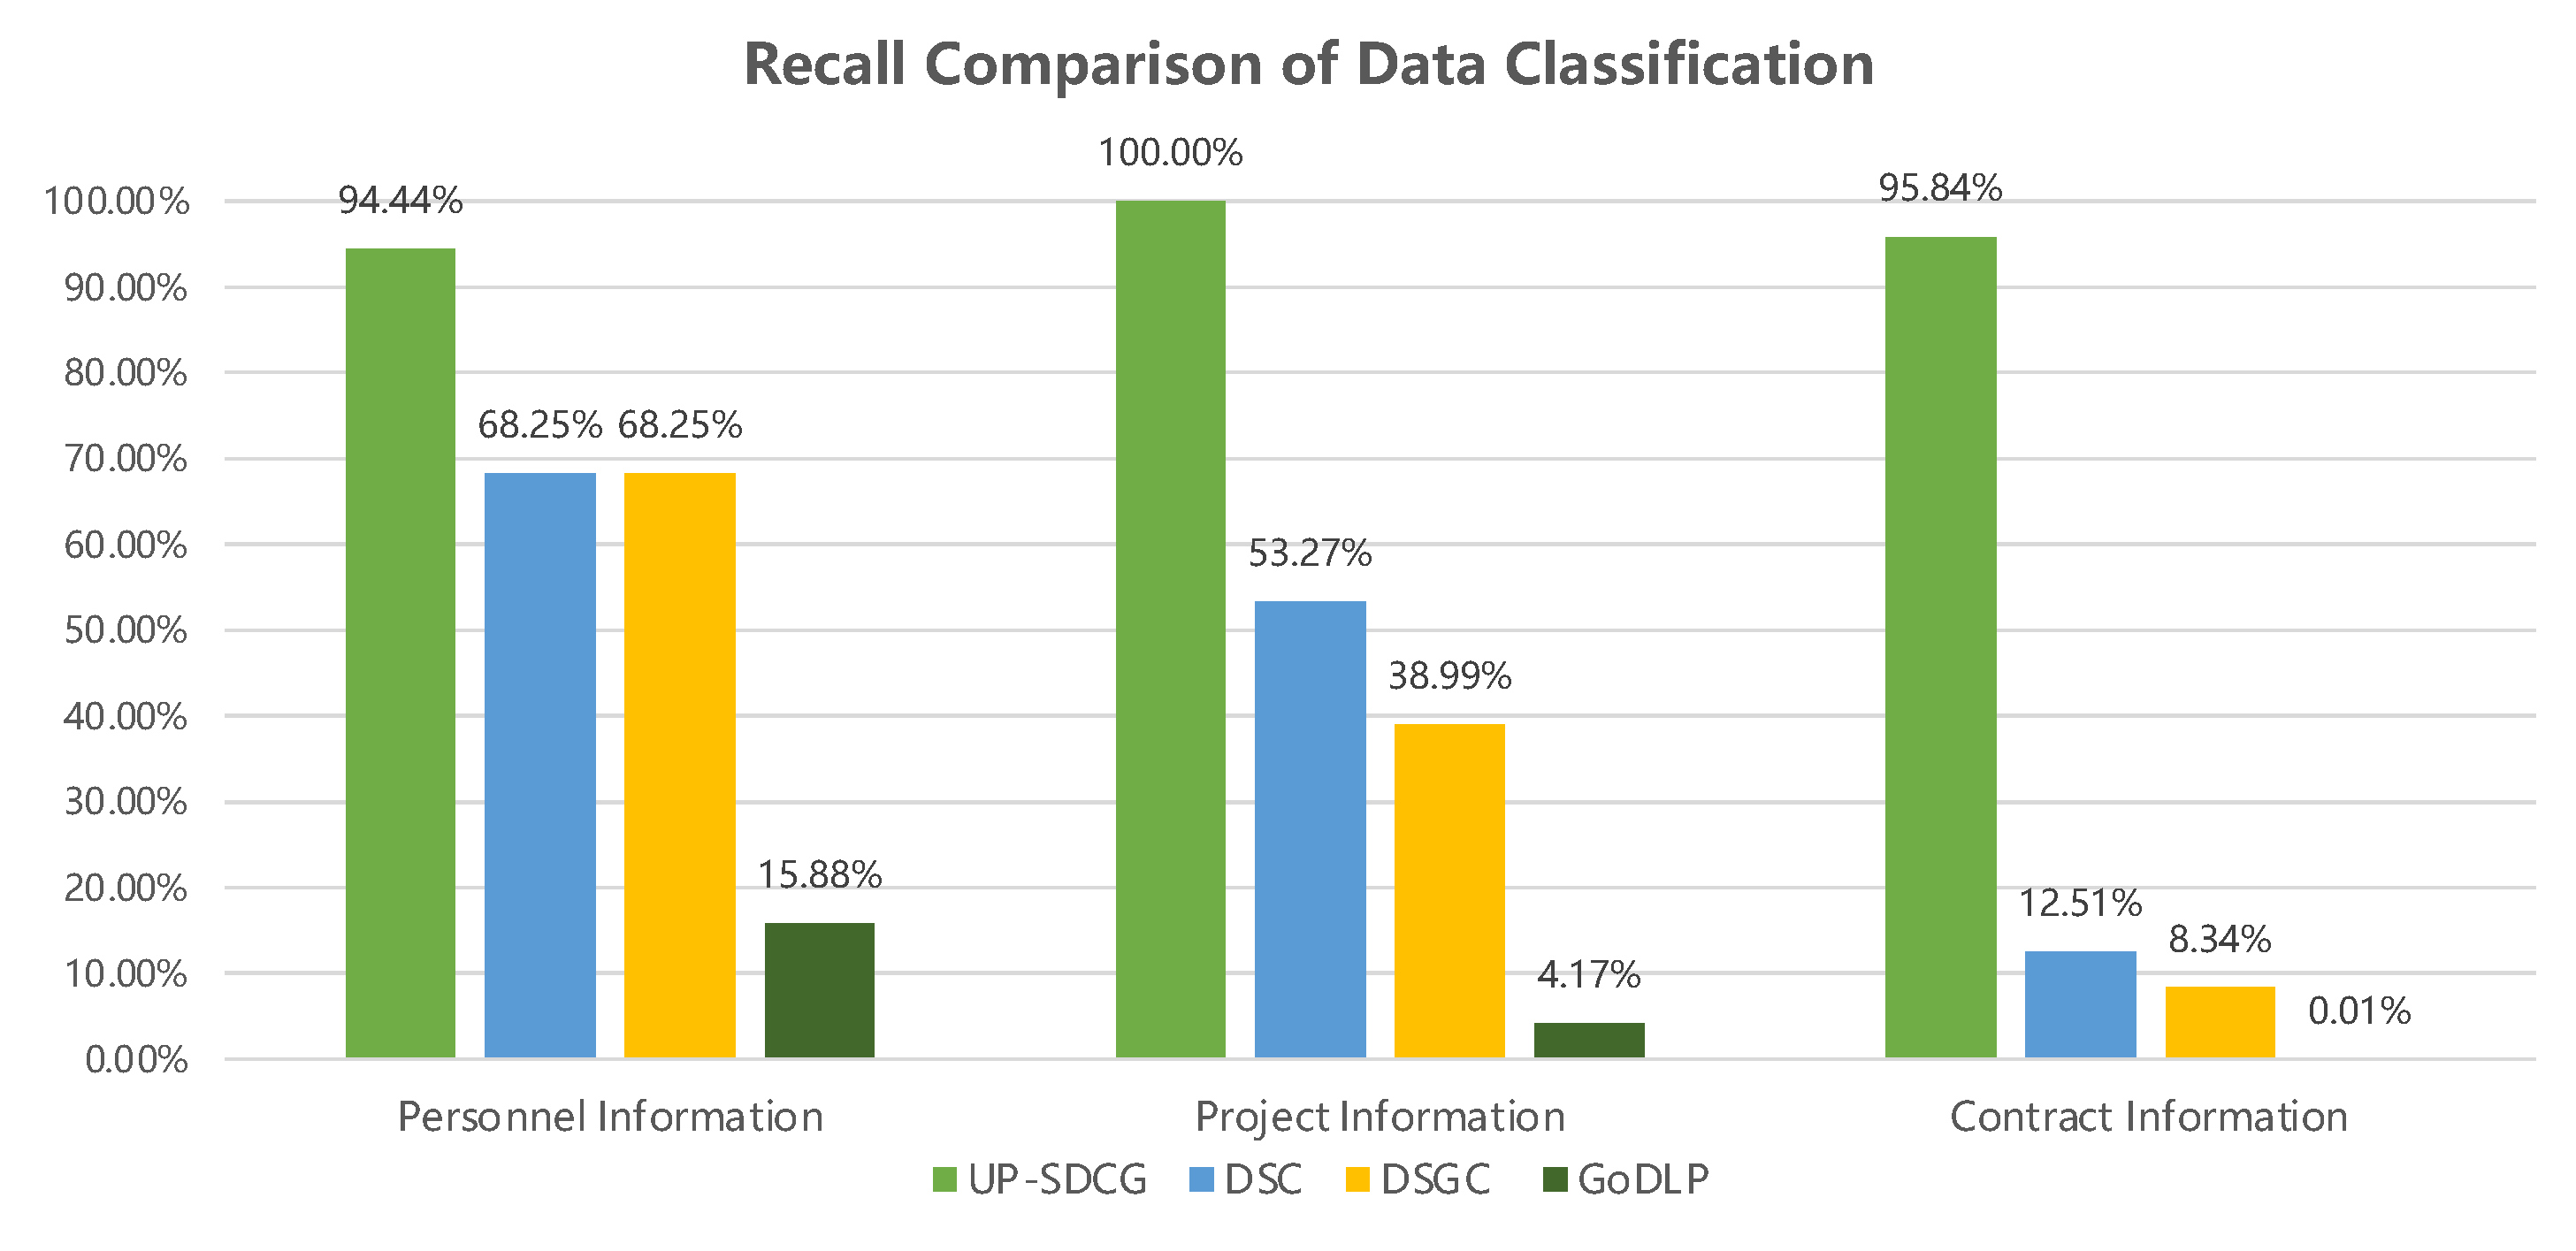
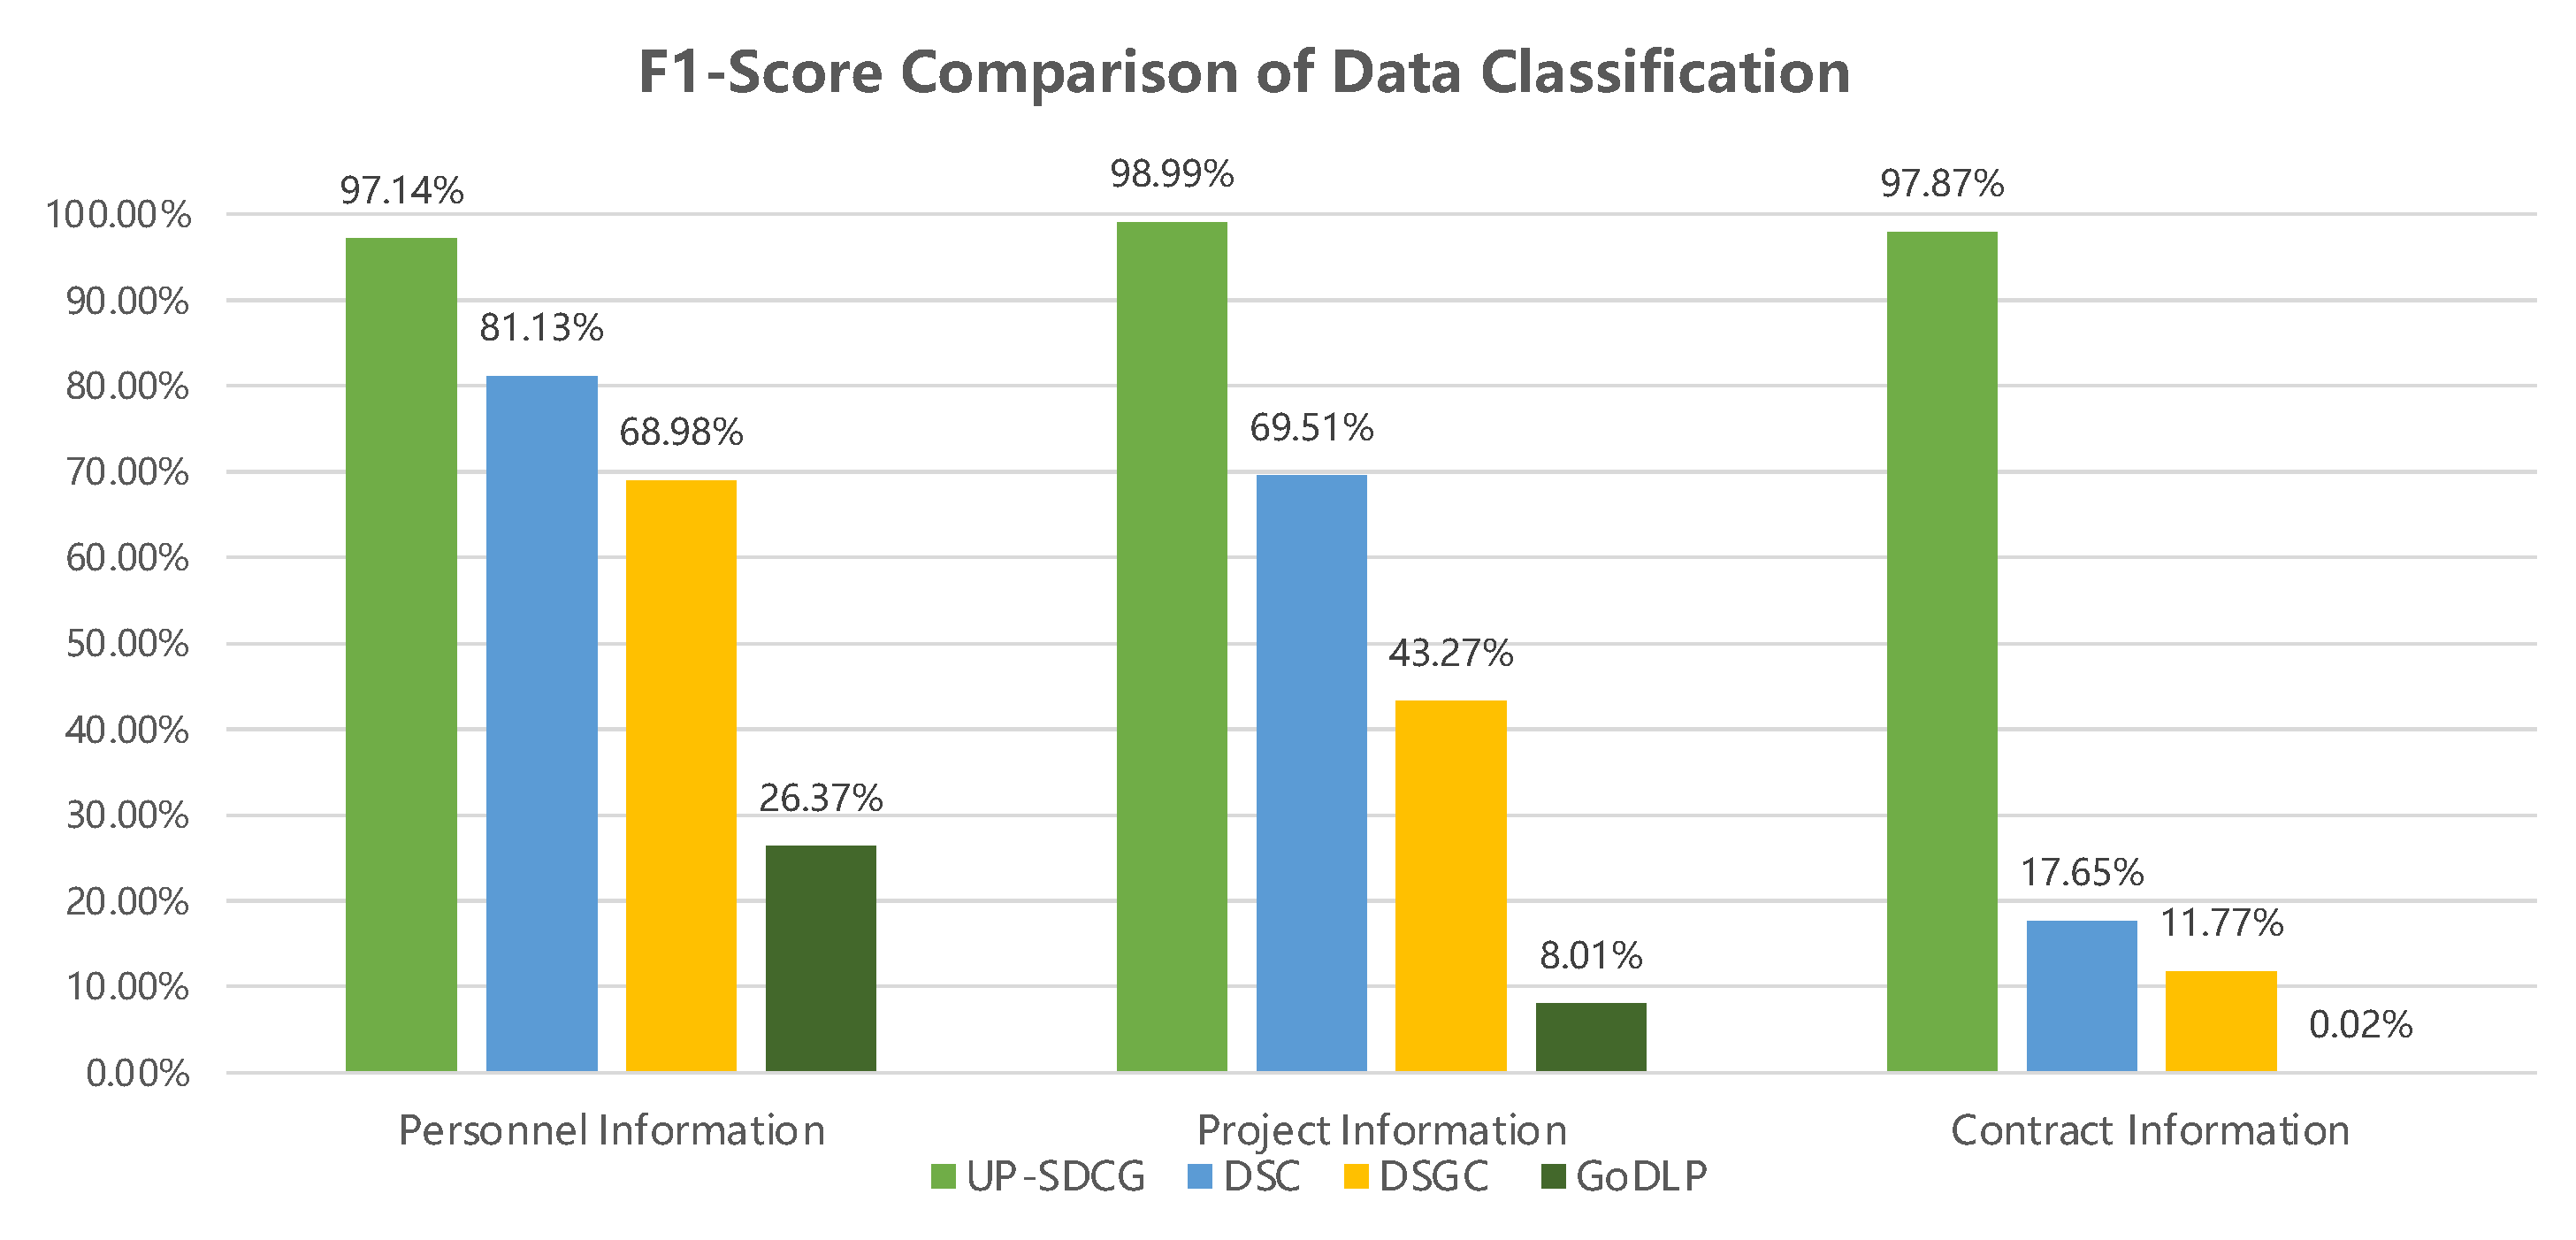
| Dataset | UP-SDCG | DSC | DSGC | GoDLP | ||||||||
|---|---|---|---|---|---|---|---|---|---|---|---|---|
| Precision | Recall | F1 | Precision | Recall | F1 | Precision | Recall | F1 | Precision | Recall | F1 | |
| Personnel Information | 100.00% | 94.44% | 97.14% | 100.00% | 68.25% | 81.13% | 69.72% | 68.25% | 68.98% | 77.78% | 15.88% | 26.37% |
| Project Information | 98.00% | 100.00% | 98.99% | 100.00% | 53.27% | 69.51% | 48.61% | 38.99% | 43.27% | 100.00% | 4.17% | 8.01% |
| Contract Information | 100.00% | 95.84% | 97.87% | 30.01% | 12.51% | 17.65% | 20.01% | 8.34% | 11.77% | 100.00% | 0.01% | 0.02% |
| Dataset | Row Number | Sensitive Columns | Non-Sensitive Columns | Sensitive Type |
|---|---|---|---|---|
| Customer Information | 73 | 12 | 61 | Personal information, such as name, certificate number, income, address, phone number, account password, etc. |
| Service Data | 23,208 | 103 | 78 | Loans, insurance, bonds, cross-border business, etc. |
| Operation Management | 13 | 0 | 13 | Personal and financial information |
| Financial Supervision | 3 | 0 | 3 | Risky assets and capital adequacy |
| Dataset | Precison | Recall | F1-Score |
|---|---|---|---|
| Customer Information | 100.00% | 98.36% | 99.17% |
| Service data | 96.05% | 93.59% | 94.81% |
| Operation management | 91.67% | 92.31% | 91.99% |
| Financial Supervision | 100.00% | 100.00% | 100.00% |
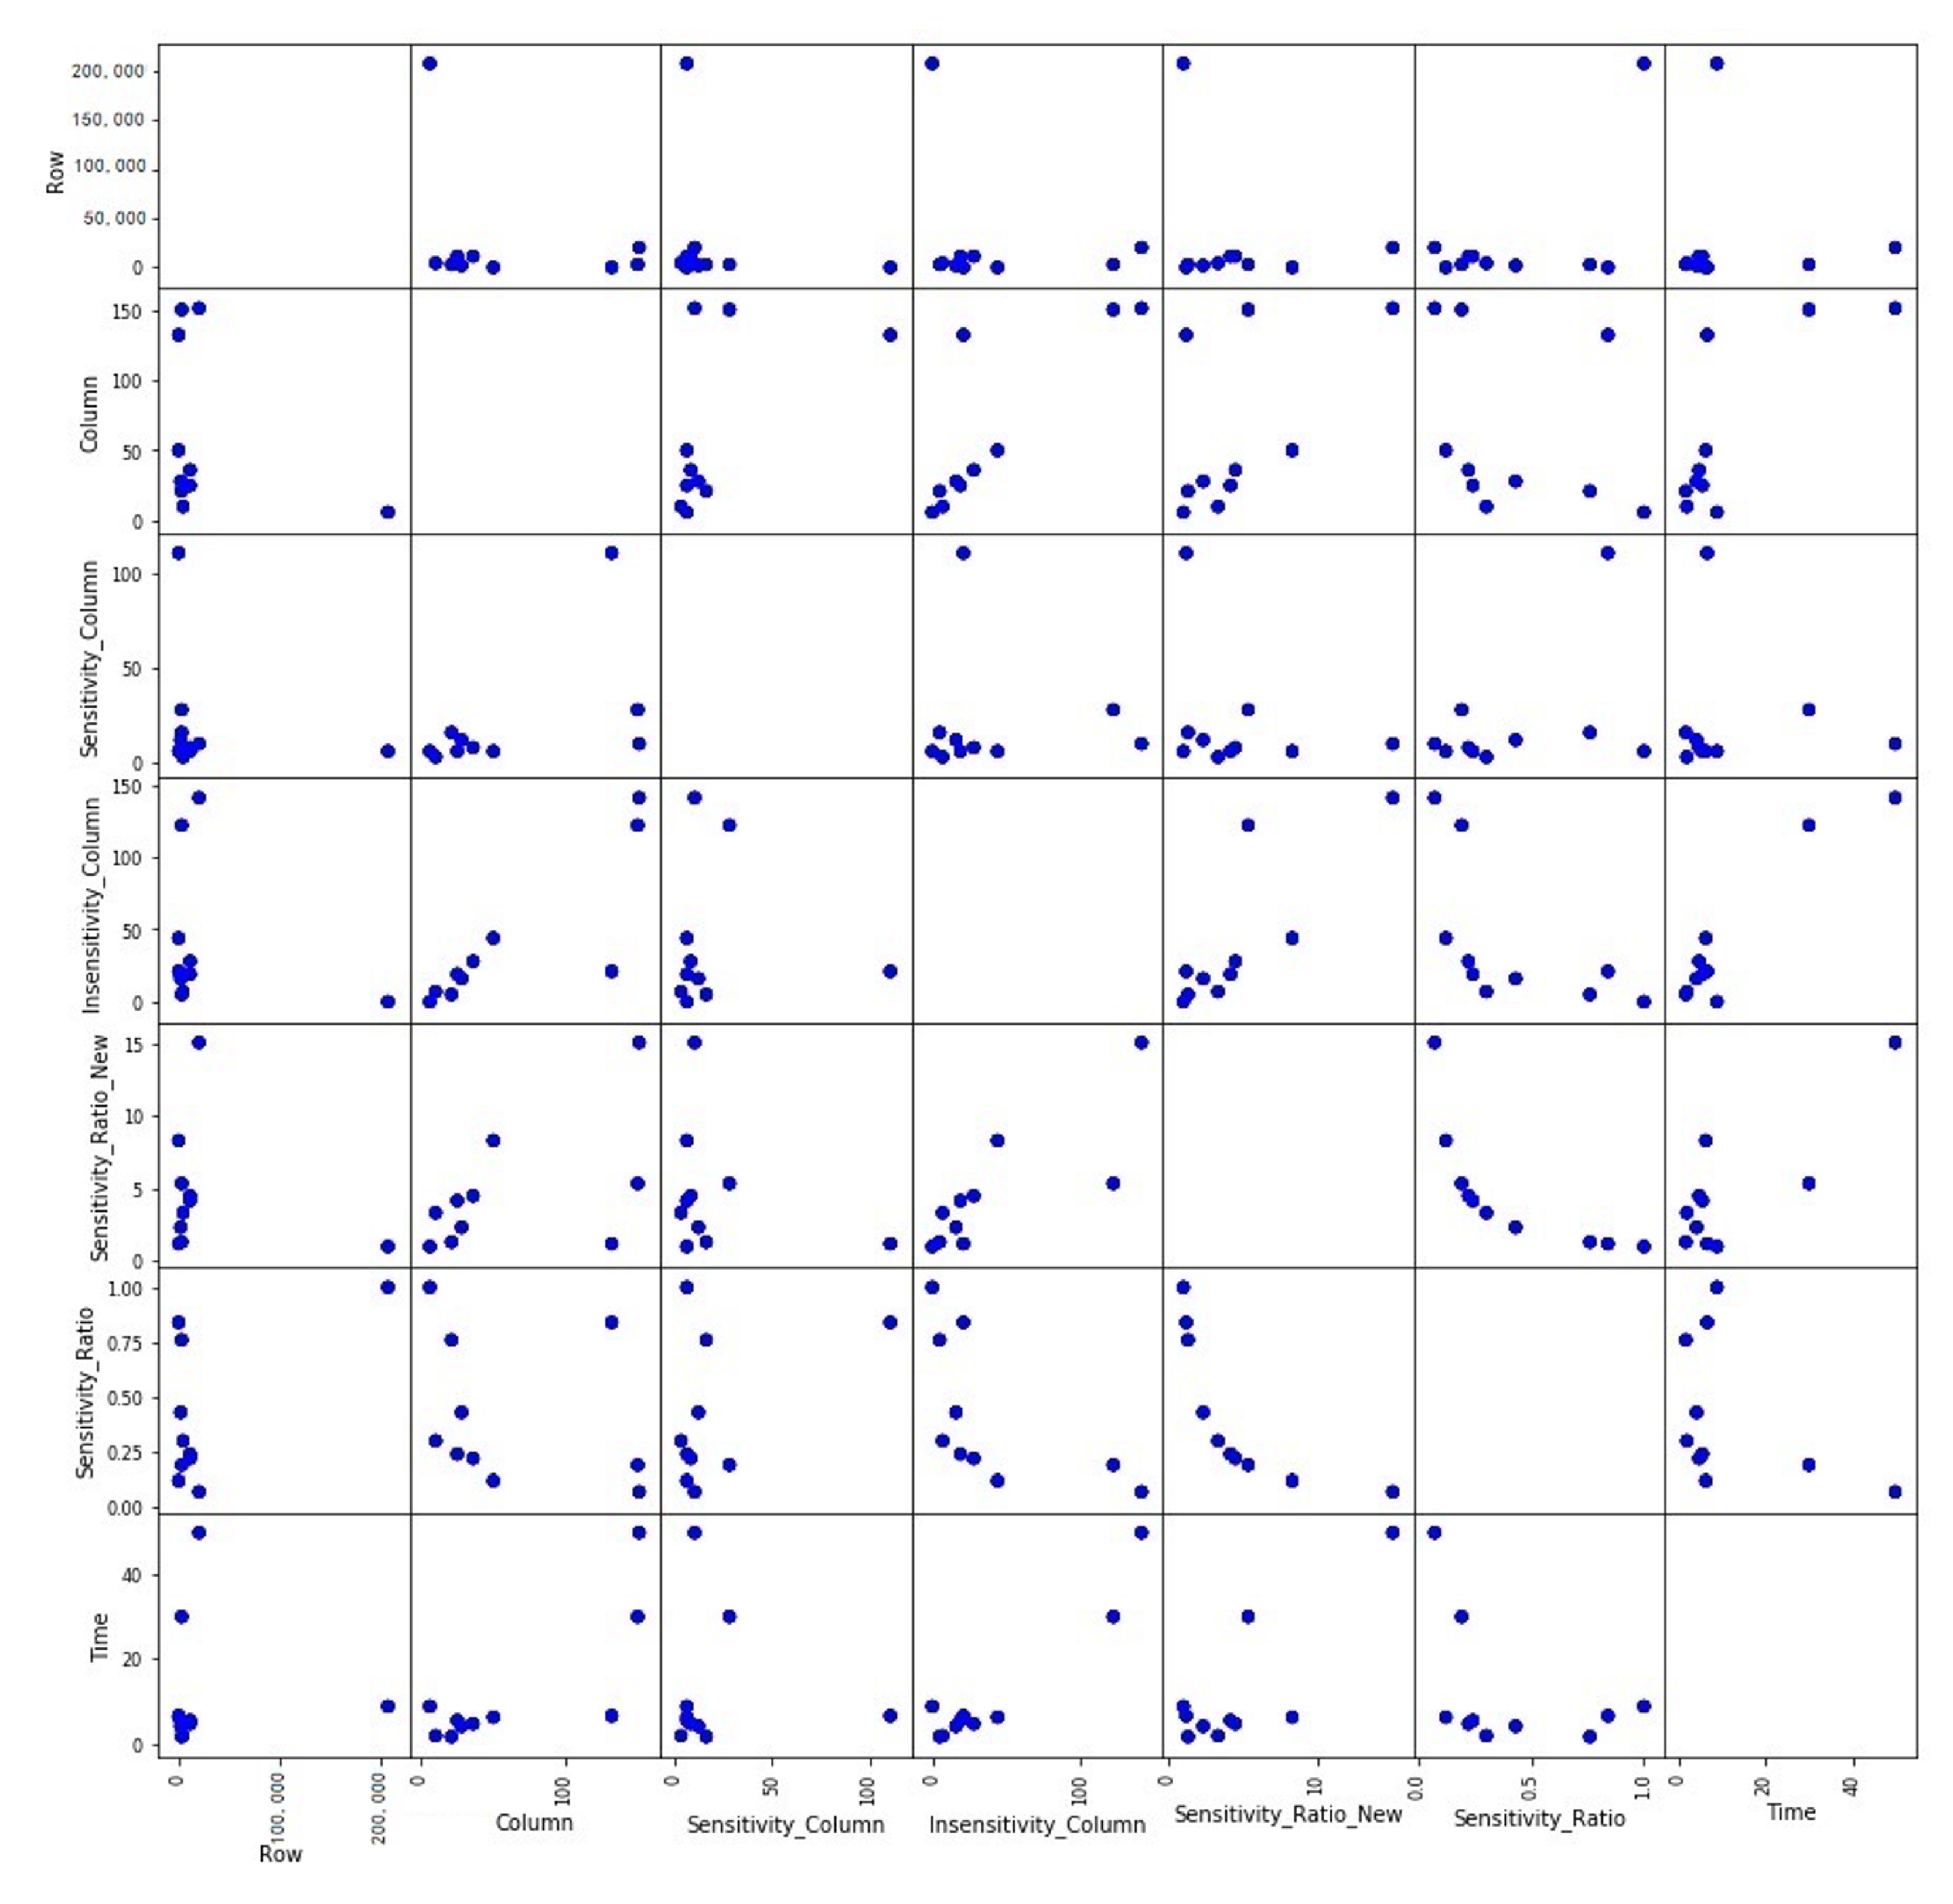
| Dataset | Rows | Columns | Sensitive Columns | Non-Sensitive Columns | Sensitive Ratio | Time (s) |
|---|---|---|---|---|---|---|
| Personnel Information1 | 9 | 50 | 6 | 44 | 0.120 | 6.351 |
| Personnel Information2 | 11,280 | 25 | 6 | 19 | 0.240 | 5.597 |
| Personnel Information3 | 11,329 | 36 | 8 | 28 | 0.222 | 4.825 |
| Contract Information1 | 4372 | 9 | 3 | 6 | 0.333 | 2.025 |
| Contract Information2 | 1979 | 28 | 12 | 16 | 0.429 | 4.269 |
| Project Information1 | 20,206 | 151 | 10 | 141 | 0.066 | 49.493 |
| Project Information2 | 3002 | 150 | 28 | 122 | 0.187 | 29.860 |
| Bank Data1.csv | 48 | 132 | 111 | 21 | 0.841 | 6.675 |
| ... | ... | ... | ... | ... | ... | ... |
| Rows | Columns | Sensitive Columns | Non-Sensitive Columns | Sensitive Ratio | Time (s) | |
|---|---|---|---|---|---|---|
| Rows | 1.000 | −0.305 | −0.193 | −0.235 | 0.576 | −0.008 |
| Columns | −0.305 | 1.000 | 0.537 | 0.834 | −0.268 | 0.779 |
| Sensitive Columns | −0.194 | 0.537 | 1.000 | −0.017 | 0.429 | −0.032 |
| Non-sensitive Columns | −0.235 | 0.834 | −0.017 | 1.000 | −0.598 | 0.944 |
| Sensitive Ratio | 0.576 | −0.268 | 0.429 | −0.598 | 1.000 | −0.421 |
| Time(s) | −0.008 | 0.779 | −0.032 | 0.944 | −0.421 | 1.000 |
| Rows | Columns | Sensitive Columns | Non-Sensitive Columns | Sensitive Ratio | |
|---|---|---|---|---|---|
| Time (s) | −0.00756 | 0.77861 | −0.03227 | 0.94370 | −0.80537 |
Disclaimer/Publisher’s Note: The statements, opinions and data contained in all publications are solely those of the individual author(s) and contributor(s) and not of MDPI and/or the editor(s). MDPI and/or the editor(s) disclaim responsibility for any injury to people or property resulting from any ideas, methods, instructions or products referred to in the content. |
© 2024 by the authors. Licensee MDPI, Basel, Switzerland. This article is an open access article distributed under the terms and conditions of the Creative Commons Attribution (CC BY) license (https://creativecommons.org/licenses/by/4.0/).
Share and Cite
Zu, L.; Qi, W.; Li, H.; Men, X.; Lu, Z.; Ye, J.; Zhang, L. UP-SDCG: A Method of Sensitive Data Classification for Collaborative Edge Computing in Financial Cloud Environment. Future Internet 2024, 16, 102. https://doi.org/10.3390/fi16030102
Zu L, Qi W, Li H, Men X, Lu Z, Ye J, Zhang L. UP-SDCG: A Method of Sensitive Data Classification for Collaborative Edge Computing in Financial Cloud Environment. Future Internet. 2024; 16(3):102. https://doi.org/10.3390/fi16030102
Chicago/Turabian StyleZu, Lijun, Wenyu Qi, Hongyi Li, Xiaohua Men, Zhihui Lu, Jiawei Ye, and Liang Zhang. 2024. "UP-SDCG: A Method of Sensitive Data Classification for Collaborative Edge Computing in Financial Cloud Environment" Future Internet 16, no. 3: 102. https://doi.org/10.3390/fi16030102