1. Introduction
Wireless sensor networks (WSNs), as a data-transfer source, have gained significant roles in a wide range of applications, primarily attributed to their cost effectiveness, functional capabilities, adaptability, and extensive coverage. Data collection becomes an essential task using sensor networks. However, the effectiveness of WSNs is compromised by obstructions that impair signal strength and introduce synchronization. Consequently, these limitations result in reduced operating distances and increased latency. Therefore, accurate data interpretation faces challenges, and synchronization is needed.
Time synchronization is essential for accurate data interpretation in WSNs. It achieves reliable measurements, facilitates action coordination, and ensures seamless data exchange between devices. Numerous synchronization methods and protocols have been extensively studied and developed to address various tasks within the realm of data reading. These methodologies encompass diverse approaches, such as harnessing GPS modules, utilizing pulse-per-second (PPS) signals, and employing synchronization protocols that focus on estimating nondeterministic delays to achieve accurate time measurements [
1,
2], the sensorimotor synchronization method [
3], or the Sync-ESP-NOW protocol and other specialized protocols, such as NTP and PTP, for IoT devices [
4,
5]. Furthermore, investigations into synchronization have extended to Bluetooth-based sensor networks [
6] and time measurement in medical devices [
7]. An extension of reference-broadcast infrastructure synchronization (RBIS) with wide coverage of multiple access points and a significantly improved timing accuracy superior to NTP was implemented in research presented in [
8]. Special attention was given to developing systems that accurately mark events and interact with digital data on internet-of-things platforms [
9]. Some studies include the development of hardware and architectures for IoT applications in the field of vibration measurement [
10] and synchronized acquisition of ECG signals for emotion recognition [
11]. The approach outlined in [
12] proposed millisecond-precision synchronization with simple, budget-friendly, hardware, making it applicable in scenarios prioritizing cost and time constraints. Such a diverse spectrum of research reflects the general interest in time synchronization, its meaning in various contexts, and additional possibilities for application in modern information-collection and data-analysis scenarios.
Data synchronization, regarding time, is a critical factor for successful implementations of data-fusion methods. Therefore, data synchronization in WSNs is a significant research problem. For example, in the research [
13], time synchronization has been addressed through temperature-sensitive compensation in WSNs. Cluster-based maximum consensus time synchronization for industrial WSNs has also been explored in [
14]. In the study [
15], sensor data fusion has been applied to engine fault diagnosis through a multisensor approach. A similar approach based on multisensor system-on-chip platforms is presented in [
16], where the authors implemented data fusion for sports activity monitoring in eHealth systems. The main advantage of implementing a multisensor approach via WSNs is that it allows for partially overcoming synchronization problems. Typically, data from all sensors are sent as a single data package, neglecting minor delays during the collection of data from sensors. The practical application of industrial big data also requires synchronization. In [
17], data fusion has been used in the domain of cloud-control platforms to enhance their applicability. Sensor data fusion via wireless networks is a versatile and powerful tool with applications in mechanical fault diagnosis, indoor location services, medical diagnostics, wearable sensors, vehicle localization, aquaculture, robotics, industrial big data, healthcare, education, structural health monitoring, engine fault diagnosis, and sport activity monitoring. Continuous development and improvement of data-fusion algorithms and strategies are essential to optimize the performance and reliability of wireless sensor networks in various applications [
18]. Integrating sensor data through fusion algorithms is critical to providing enhanced and reliable information in various fields, including medical diagnostics, industrial monitoring, and environmental sensing [
19,
20,
21].
The efficient timing sync protocol for sensor networks (TPSN) described in [
22] creates a hierarchical structure in the network and performs synchronization to create a global time scale. Methods and protocols for synchronization, emphasizing the need for a new class of secure synchronization protocols that are scalable and energy efficient, were revealed by researchers in [
23]. In [
24], a comprehensive review that analyzes wireless sensor networks for structural health monitoring from different points of view is presented. Time synchronization is a critical issue in wireless sensor networks, and a study demonstrates that an optimized multilayer time-synchronized MAC with relay nodes shows better results than state-of-the-art nonsynchronized algorithms [
25]. Wireless sensor networks have three key performance metrics: reliability, power consumption, and latency. The time-slotted channel-hopping technique (TSCH) introduced in the IEEE 802.15.4 standard compromises these indicators. With the help of a mathematical model based on real measurements, the authors characterize the behavior of the network and its interaction with the environment. The research showed that optimizing one of the indicators can lead to the degradation of others [
26]. Data transmission in communication networks often has to meet certain deadlines. The authors developed a probabilistic model that allows one to determine the delay of sensor data in a wireless sensor network depending on the routing used. The model provides a tool for routing delay analysis, which allows one to compare the probability of missing a deadline between different routing policies [
27].
The importance of time synchronization in wireless sensor networks is emphasized due to its role in accuracy, energy consumption, and computational complexity, where the main emphasis is on the energy-efficient beacon-free scheme [
28]. This idea is further extended to WSNs with a low level of activity, where a new synchronization algorithm is presented [
29]. To synchronize network units regarding the common clock, the authors used additional reference data packets sent by the reference node.
Temperature deviations also play a part in the network-synchronization algorithms [
30]. Temperature fluctuations affect the accuracy of the time calculation, according to which the network is synchronized. The authors proved that adjusting local units’ time according to predefined dependency between outside temperatures and time drift makes it possible to increase network-synchronization accuracy. Similarly, synchronization in underwater sensor networks could use the Doppler effect to increase accuracy [
31].
An adaptive walking detection method based on inertial sensors uses data fusion to improve detection accuracy, as presented in [
32]. This data-fusion approach is extended to a support system for firefighters, where different sensors are used to monitor their gait [
33] and classify predefined events using the Hiden Markov model and a neural network. Data fusion is also proven to be essential for the health monitoring of composite aircraft structures [
34] and vehicle networks for creating smart cities based on 6G technology [
35], offering more advanced data-synchronization capabilities.
In the context of robotics, time synchronization is critical, especially for autonomous driving, where a system for precise synchronization has been developed [
36]. For wireless body area networks, a new synchronization algorithm based on a fractional time approach is presented in [
37]. It achieves more accurate time evaluation and minimizes energy consumption due to managing on–off stages.
A summary of research cases most relevant to synchronization in WSNs is provided in
Table 1.
Wireless sensor networks (WSNs) play a significant role in physical and environmental monitoring. Smart environmental monitoring (SEM) systems are being developed using internet-of-things (IoT) technologies and wireless sensor networks. This approach makes it possible to control air, water management, radiation emissions, etc., thoroughly. The reliability of these systems is based on proven machine-learning techniques and classifiers that ensure effective analysis and infusion of SEM [
38]. In [
39], the authors provide a comprehensive overview of the use of wireless sensor networks (WSNs), unmanned aerial vehicles (UAVs), and crowdsensing technologies. The authors identify cooperation between ground-based (WSN/crowdsensing) and aerial (UAVs) surveillance systems and the use of advanced signal-processing techniques as crucial components of future integrated large-scale environmental monitoring systems. Changes in the ecological environment have serious consequences for people, particularly air pollution. Using cloud storage and wireless sensor networks (WSNs), greater accuracy can be achieved in monitoring environmental factors as well as healthcare aspects. Such monitoring tasks are essential in smart cities, where air quality control is critical to maintaining population health and economic development [
40].
There are three main challenges for environmental monitoring in buildings: optimizing the software for processing data from different types of sensors, data synchronization, and ensuring network stability when new sensors are connected or existing ones are removed. In [
41], a platform and a software system for efficient data-acquisition collection, preprocessing, and packaging from various sensors were presented, simplifying the network’s setup and ensuring its reliability. A gateway system developed for a wireless sensor network aimed at environmental monitoring is presented in [
42]. This system allows the collection and storage of the data provided by the sensor network and ensures convenient remote access to this data through a website or console application. In [
43], the authors presented the application of multiple consumer-grade internet-of-things (IoT) technologies to measure four common air pollutants. They identified the impact of indoor air quality on sleep quality and demonstrated that elevated levels of some air pollutants can negatively affect sleep quality while others can improve it.
In mechanical fault diagnosis, multilevel and hierarchical information fusions are used in WSNs to address the challenge of real-time transmission of many vibration signals [
44]. WSNs are also used for indoor location services, particularly for visually impaired individuals, by combining data from wireless networks with inertial sensors [
15,
45,
46]. In medicine, sensor data fusion through wireless networks is particularly beneficial for improving diagnostics accuracy. Integration of eye-tracking data into magnetic angular rate gravity (MARG) sensor-based head-orientation estimation has been explored for applications in rehabilitation robotics and medical diagnostics [
47]. Additionally, electronic medical records and the biomedical literature have been used to support the diagnosis of rare diseases through data fusion [
48]. Sensor data fusion is also being applied in the context of wearable sensors for fall detection, where data-fusion techniques have been compared to single-sensor machine-learning techniques to improve fall detection accuracy [
49].
In the area of vehicle localization, the adaptive diagnosis for fault-tolerant data fusion based on the α-Rényi divergence strategy has been explored [
50]. In the absence of synchronization between nodes, the localization problem in wireless networks is considered based on hybrid measurements of signal strength (RSS) and time of arrival (TOA). The developed two-step algorithm simplifies calibration and localization, improving accuracy and reducing computational complexity compared to existing methods [
51]. In the field of wireless sensor networks and the use of artificial intelligence techniques, a comprehensive discussion of recent research on area coverage, moving object localization, and WSN optimization is reviewed. The authors point out the need to optimize routes for localization and develop multicriteria models to resolve issues in this area [
52].
In aquaculture, sensor data fusion has been applied for temperature monitoring in ponds, which is critical to ensuring the health and growth of aquatic species [
53]. Additionally, sensor data fusion is used in robotics, particularly for simultaneous localization and mapping (SLAM) in underground power pipeline galleries [
54]. Moreover, multisource data fusion has been employed to diagnose rolling bearings based on an improved multiscale CNN [
55]. In the educational domain, sensor data fusion has been used to improve affect detection in game-based learning through multimodal data fusion [
56]. Structural health monitoring (SHM) sensors are proposed for damage diagnostics of composite panels, encompassing four levels: detection, localization, type, and severity of damage, with the aim of implementing condition-based maintenance (CBM) schemes [
57]. Data-fusion algorithms inspired by fuzzy entropy have been proposed to improve the reliability of WSNs [
58]. Multiprotocol mobile agents have also been used to design and analyze data-fusion schemes in mobile WSNs [
59].
The designed system’s hardware and software would need to comply with the human-gait analysis device requirements. The OneStep application uses an inertial measurement device with a sample rate of 100 Hz [
60]. This sample rate is standard for many motion and gait analysis applications but does not significantly affect or increase the detail of the information because dynamic gaits are smaller. Shimmer sensor platforms [
61] use a frequency of about 100 Hz for acceleration measurements. The autonomous sensing unit recorder system uses a sample rate more than 100 Hz to record data [
62], but increasing the data collection rate does not provide significant benefits when studying detailed characteristics. Nevertheless, it is essential to note that measurement accuracy is often considered more important for analysis than sampling rate. In an article [
63], it is concluded that a sampling rate as low as 17 Hz yields sufficient results in experiments of human-body movement monitoring. In general, measurement accuracy has a much greater impact than high sampling-rate values, as it is essential for adequate analysis and interpretation of results in the context of medical and research applications.
Real-life engineering tasks often deal with special or original equipment, the absence of synchronizing data features, and the implementation of modern network protocols, widening the area of original device implementation. The problem of sensor data aligning with respect to time, when data are obtained using independent devices, requires such a solution. One of these tasks often occurs in the medical or health monitoring area, when there are inconvenient devices to install to inform human (sometimes on animal) limbs without a wire connection.
This paper is dedicated to testing human-gait monitoring systems under real conditions using original sensors and independent data-acquisition systems. For the synchronization of independent data-acquisition systems, two simple methods were proposed: a solution involving repeated synchronization of the entire system by issuing network requests to extract sensors’ data with very low latency and an alternative method where a synchronizing message is sent only at the beginning of a data-logging session, leaving only part of the system synchronized. The suitability of the proposed network methodologies for a human-gait monitoring system was explored by conducting data logging and network performance experiments and comparing the results with those found in other related studies.
2. Materials and Methods
The implementation of local network-driven data-synchronization methodology was realized in the original ad hoc local network, a 3-member single-level network between equal microcontrollers with data flow control.
This experimental setup covers the human-gait analysis system, which is suitable for rehabilitation and medical monitoring of human-gait issues. The setup collects data from the sensor on each foot, acquiring a three-point foot-pressure sensor array and a single three-axis accelerometer and gyroscope module for each foot. Data are transmitted to the microcontroller, which accumulates data and transmits data to the cloud storage or PC via USB cable for further analysis.
For such monitoring systems, the monitored process and monitoring aim set the main requirements for performance and accuracy. Continuous monitoring of human gait, trying to define minor changes, requires a data-acquisition rate of about 30 samples per second and a data-synchronization accuracy in the range of a few milliseconds. Such a sampling rate is not an issue for popular microcontrollers like Atmega, but adding wireless data transfer from a few devices and strict data-synchronization requirements to such a task became relatively challenging.
The developed prototype and the proposed method were tested by conducting practical experiments in the scientific laboratories of the Department of Mechatronics, Robotics, and Digital Manufacturing of Vilnius Gediminas Technical University.
2.1. Equipment of Experimental Research
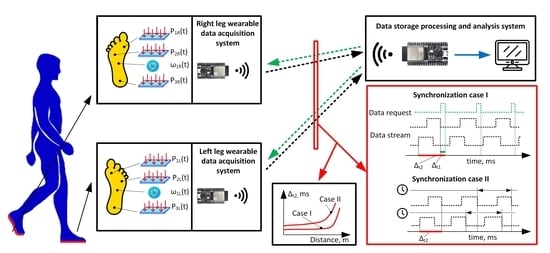
The experimental setup (
Figure 1) comprises a human-body interface and a data-reception unit. The human-body interface includes data module sets for each limb, where a data module set incorporates a slave microcontroller (slave board) and a foot insole with an array of pressure sensors and an accelerometer. The data-reception unit includes the main data master microcontroller (master board) connected to the data storage.
Each foot-mountable module had a set of pressure sensors, which operated as piezoresistive units. To account for the nonlinear relationship between sensor resistance and applied load, calibration factors were calculated by obtaining sensor readings with an array of precise masses. For loads that were not simulated using precise masses, calibration factors were calculated linearly, interpolating experiment-based calibration factors. The sensor load has an indicative value, so the foot load is later presented as a percentage of the full human-body load. The array consists of 3 individual sensors placed in supportive footprint locations (medial plantar, lateral plantar, and tibial), as shown in
Figure 2. Pressure sensors were built by placing conductive pressure-sensitive material between two layers of aluminum foil acting as read-out electrodes. Each sensor was integrated into the circuit by connecting a common lower layer of aluminum foil to the positive potential of a power source and the separate upper layers to the ADC pins of an ESP32 microcontroller through a pull-up 10-Ohm resistor. To prevent direct electrical contact between the lower and upper electrodes, pieces of pressure-sensitive material were cut out to be of a slightly greater area than the upper electrode. The effective area of such a sensor is the intersecting area of aluminum-foil layers and the pressure-sensitive material layer.
The 3-axis accelerometer/gyroscope module MPU 6050 (from TDK InvenSense Company, Sunnyvale, CA, USA) was mounted in the middle of the insole (
Figure 2) and delivered accelerations and angular velocities of foot movement. A combination of pressure-sensor arrays and an accelerometer gyroscope allows for fully defining foot movement in the space in the compressed and free position.
Analog signals from the pressure-sensor array are directly transferred to the ESP32 microcontroller’s (Espressif Systems, Shanghai, China) general purpose input–output pins. Continuous signals are converted into discrete values using one of the two available 12-bit analog–digital converters. The digital signal from the accelerometer/gyroscope module is passed to a microcontroller through one of the two integrated I2C bus interfaces.
ESP32 microcontroller’s 2.4 GHz radio module and an integrated antenna were used for wireless communication. Slave and master microcontrollers employed an ESP-NOW communication protocol for intercommunication; meanwhile, a master microcontroller sent data to a data-storage device through a cable using a UART interface. As ESP32 microcontrollers support WIFI and Bluetooth communication, there was an option for direct communication between slave microcontrollers and the data-storage device.
As the microcontroller only ever stores the most recently received data point in static RAM before sending it to the data-storage device, an extensive amount of volatile memory space was not required. Because permanent data storage is relegated to a dedicated data-storage device, the microcontroller’s nonvolatile flash memory is used only for program memory. For this reason, external memory was not used despite it being an option.
The experiment’s data were obtained from all sensors at a frequency of 24.6 samples per second. Data in the slave microcontrollers were not processed. This data set was transmitted to the master microcontroller through the local ad hoc Wi-Fi network. Each slave device was powered by a 3.6 V Li-Ion battery (Howell Energy Co., Ltd., Shenzhen, China). The supply voltage level was kept constant using an internal microcontroller stabilizer.
Direct raw data from the sensor arrays needed mathematical processing. In this case, the best solution was to normalize the data placed in each slave microcontroller, where the analog signal from the sensors was transformed into a digital one using internal ADC. The median filter with a median width of three samples was implemented for the conditioning of the sensor data values. Therefore, high peaks and nonessential data distortions were filtered out. Implementing advanced filters was unreasonable due to the relatively low frequency of the signal.
The master ESP32 microcontroller, which was connected to cloud storage via another network, served as the central network unit. Its primary function is to serve as the main data-collection point to collect information transmitted from the separate microcontrollers. However, it can only reliably receive data at intervals of approximately 26 ms. While this rate meets the requirements for the data acquisition and transmission process, it does impose a limitation on the overall speed of the data-acquisition system. In addition to cloud storage, there is an alternative option of using local storage on a connected PC. Such an option is helpful in the case of a short series of measurements.
Electronic control measurements of the system latency were performed using a Rigol DS1052E oscilloscope (RIGOL Technologies EU GmbH., Gilching, Germany).
The sensor data from both feet were streamed to the microcontrollers through the network interface, which is a communication protocol designed to handle data transfer between different components on the same board.
Synchronization algorithms were used to solve the problem of proper synchronization of data collected from different sources (
Figure 3). These algorithms help identify and adjust delays between data to achieve a sufficient level of data synchronization.
The microcontrollers, in turn, transmit data wirelessly to the main ESP32 using Wi-Fi protocols. In this case, wireless communication operates at a frequency of 2.4 GHz. The main ESP32 is connected to the cloud storage, serving as the central data repository and analysis hub. The network structural operation algorithm provided in
Figure 1 presents the network members within the local wireless network with two ESP32 slave microcontrollers and the master ESP32 microcontroller acting as an access point (AP). Each slave microcontroller (ESP32-1 and ESP32-2) acquires a pressure-sensor array, gyroscope, and accelerometer sensors. The master microprocessor controls a wireless Wi-Fi network, stores data internally, and transmits it to a PC or cloud, depending upon the request. This structure allowed us to perform the desired data-flow control using network capabilities.
The synchronization method proposed for data collection involves slave boards and a master board operating synchronously. Slave boards remain idle (do not collect or send any data) until a command message is received from the master board instructing it to start acquiring sensor readings. A command message acts as a synchronizing message that is sent once per each data-acquisition cycle, which spans from timestamp generation to data export to cloud storage.
Due to a comprehensive synchronization of the entire system, the master board is authorized to create a timestamp resembling the state of the overall system. Under the generated timestamp, the collected data are exported to cloud storage.
As the system gets synchronized each time command messages are sent out, the synchronization quality does not depend upon the quality of a single synchronization signal. On the other hand, the overall synchronization quality declines as the quality of the wireless connection declines. Since the system was designed to be used in lightly obstructed (no more than one solid concrete wall) and medium distance open (straight corridor up to 100 m in length) propagation environments, connection quality’s effect on synchronization quality was not researched.
A disadvantage of the whole system being synchronized is that the data-acquisition speed of slave boards is limited to the speed of the master board, whereas the master’s speed is limited to the speed of the system to which data are getting exported (in this case, the allowed amount of incoming data of the cloud storage). This drawback could be circumvented by separating the data-acquisition and data-export actions into distinct subroutines and temporarily storing the collected data inside the master board.
An alternative method of synchronization (
Figure 4) involved slave and master boards working asynchronously. The synchronization of slave boards would be ensured, but not the synchronization of the master board with slave boards. The synchronization message is sent by the master board once at the beginning of the data-logging session instead of at the beginning of each data-acquisition cycle. The synchronization message commands both slave boards to reset their internal timers, the values of which are then used to generate timestamps for the collected data.
In this synchronization method, slave boards constantly collect and send data independently from the master board. The master board’s duties are reduced to just processing the incoming data. However, the data processing now also involves the timestamp-based pairing of incoming data, unlike in the proposed synchronization method, where data were paired based on messages arriving during the same data-acquisition cycle. The increased workload of the master does not outweigh the advantage of having slave and master boards operate asynchronously, allowing a more rapid data collection. A comparison of the proposed and the alternative methods of synchronization is provided in
Table 2.
2.2. Methodology of Experimental Research
Experimental research was performed using the original workbench and acquiring real operating data from sensors when a person walks with shoe insoles equipped with sensors in different situations. These situations were used for data-flow management and network functionality assessment.
A series of measurements were performed to evaluate the real system latency from the command to collect data to data arrival in the master microprocessor memory. An oscilloscope was used as a key measurement tool in a study aiming to define the characteristics of data-transmission delay in a system that includes sensors and two ESP32 microcontrollers. The oscilloscope was connected to the power supply and configured with time-scale and trigger-level settings to capture signals. The first probe of the oscilloscope was connected to the pin of the first slave ESP32, which receives data from the sensor. The second probe was connected to the pin that transmits data from the master ESP32 to the cloud storage. After adjusting the equipment, the software was run on the master ESP32, which read the data from the sensor and transferred it to the cloud storage. The oscilloscope successfully captured the signals, allowing you to observe the dynamics of the signals visually. Using the oscilloscope measuring function, the time between the signal change on the first channel (from the sensor to the first ESP32) and the signal change on the second channel (from the main ESP32 to cloud storage) was defined.
The sensors must be individually calibrated for each patient before use. Calibration is carried out by a preprogrammed button when the patient stands still in one position. An additional restart function and clearing the calibration on the programmed buttons were also implemented. Calibration of the sensors takes into account the peculiarities of the human body’s weight distribution and the position of the patient’s feet concerning the sensor’s sensitive area. The calibration procedure defines a baseline for evaluating the human body’s mass distribution and allows for minimizing additive and multiplicative measurement errors. Internal data preprocessing applying compensation coefficients obtained from calibration is a straightforward mathematical procedure, and, compared to data-transfer tasks, it takes a negligible amount of time.
In the practical experiment carried out, a setup with insoles for both the left and right feet, each embedded with three pressure sensors for three main foot pressure points (conditional division into three main areas, the heel and the left and right parts of the ball of the foot), a gyroscope and an accelerometer, was implemented. These components were combined to analyze human gait. A gyroscope and an accelerometer built into each insole allow the comparison of foot orientation and inertia forces during human walking.
The experiment uses special cases of human gait, from a standard walk in a horizontal plane to climbing up a staircase with a damaged knee or hip. The acquired data were used as test data for the performance evaluation of the signal-processing system and the local network.
Additional experiments were performed to determine the wireless communication range between ESP32 microcontrollers in real operating conditions. The main goal was to analyze the quality of communication when devices are placed at different distances and rooms separated by different numbers of walls. The purpose of the experiment was to check how an increase in distance and the appearance of some obstacles, like walls between the transmitter and the receiver, will affect the quality of communication. Five different locations were chosen for the study: a straight long corridor, an open field along the busy road, and adjacent rooms separated by one, two, or three solid 250 mm thick concrete walls. The experimental procedure starts with placing the sensor in one room and the receiver in another and transmitting real-time data to monitor the connection. The experiment used specialized software tools to monitor and measure communication quality, including data transmission delay and packet loss. After placing the transmitter and receiver in the desired locations, the data were transmitted in real time, allowing the researchers to monitor the quality of the communication in different conditions. During these experiments, the total delay and a number of successful communications were noted (communication includes the master microcontroller sending out a control command and a request for data and the slave microcontroller sending out a sensor’s data message). The delay was measured in the master microcontroller from the moment of sending out the first command message up to receiving and reading data messages from both slave microcontrollers. If a data message is not received from a slave microcontroller during an allowed timespan of 30 ms, communication is considered to have failed. In case of communication with one or both slave microcontrollers failing, the delay is not noted, assuming that communication failed; communication is noted as successful only when data are received from both slave microcontrollers.
3. Results
The results of experimental studies prove the comprehensive functionality of the developed human-gait-monitoring system consisting of three independent modules communicating via the local WIFI network. During the experiments, in the beginning, sensor data-acquisition modules (slave devices) were researched to determine whether the developed sensors, their installation, and calibration are suitable and whether the sampling rate is sufficient to notice gait irregularities by analyzing individual steps. Next, the data-transmission latency and the influence of various obstacles on the data-transmission process were defined.
Data from pressure-sensor arrays consisting of three piezoresistive sensors are presented in
Figure 5. There is a very frequent case of human gait, climbing the stairs, where the load of human weight is distributed to the foot sole. Such a case reveals gait defects very fast.
At the beginning of the ascending stairs, the load on the metatarsal bones and the heel increases, after which it gradually begins to decrease. Such variation could suggest that, at the start of the ascent, the maximum portion of the load falls on all pressure sensors, after which the weight is transferred forward. There is an increase in the pressure sensor’s pressure values at the end of the step, indicating that the load increases at the moment of lowering the foot. The values of the sensors that are unloaded have little meaning, while they represent the residual pressure on the insole rather than the partial load on the human body. Technically, unloaded insole data are not taken into account in gait analysis.
The sample rate of the data-gathering equipment is sufficient to see repeating characteristics in step graphs: peaks, slopes, plateaus, etc. Evaluating the characteristics visually, for example, by noting the number of peaks, their size, and their position in relation to each other, is usually enough to determine gait abnormalities. For a more precise evaluation, distinct steps are extracted, and the most representative of them are used to generate an average step graph; when comparing two average step graphs, their same phase data points’ values are compared. Instead of comparing entire average graphs, separately calculated characteristics, such as step length and left and right foot gait phase difference, rate of applying foot pressure, etc., can be compared instead.
The behavior of the foot during flight to the next supportive place requires another type of sensor. In this case, an accelerometer with a gyroscope brings information about the movement of the raised foot. Data from these sensors when the foot is loaded are neglected as well. Acceleration values after filtering are suitable for human-gait analysis, but one must use numerical integration twice. After integration, displacement values are obtained, but, as usual, the integration procedure’s problem is defining proper initial conditions. In this case, zero acceleration and zero displacement values were taken at the moment when the foot was fully pressed. This procedure is typically performed offline after the data from the experiment are collected; online analysis is not practical.
The data from the gyroscope were used to register changes in the orientation of the footwear in space along Cartesian axes (
Figure 6). The values of the X and Y axes are negative at the beginning of the movement, which may suggest that the shoe was tilted forward and to the right. These values quickly return to zero, indicating the shoe’s return to its original position. The
Z-axis values are positive at the beginning of the movement and then increase, which may suggest a shoe rotation around the vertical axis.
The accelerometer data show changes in the shoe’s speed along two axes (X, Y), as is shown in
Figure 7. Based on these data, one can assume that at the beginning of the movement, the shoe’s speed along the
X-axis (forward–backward) increases, which corresponds to the forward movement of the foot when climbing stairs. Then, the speed along the
X-axis decreases, corresponding to a pause on the stairs. The accelerometer data provide foot orientation as well. Spatial orientation and orbit require further signal processing in the form of double integration with respect to time and proper phase angle definition from initial conditions.
Actual latencies of the data-transmission process during experimental research are provided in
Figure 8. As is seen from the graph, the latencies of the data transmission are not equal for each measurement. However, data-transmission latencies generally do not exceed 2 ms; therefore, such a system can run easily at a much higher operational speed. Fluctuations in latencies can be explained by adjustment of the internal slave microprocessor to the data-reading cycle and occupation of the CPU. The transmission of data distance was small, and its influence was neglected. In case of significant distances, they can affect the data-transmission rate. The transmission rate could also be affected by signal disturbance from other electromagnetic sources; therefore, data-transmission latency can be multiplied by several times. The transmission rate is evaluated in an intended practical experiment environment to determine whether the system retains the required transmission rate in its practical application. In case of an insufficient transmission rate, the required conditions of the experiment’s environment are revised (for example, the allowed distance between the human-body interface and the data-reception unit is lowered), or the network configuration and hardware are reassessed (for example, a router can be implemented as an intermediary device for communication).
The data-acquisition cycle consists of a transmission process, as shown in
Figure 9, and of an idle delay, used to meet the requirement of the maximum input speed allowed by the cloud storage. It can be observed that Tx
2 messages are read once the sensors’ reading is over. The measurements of intervals Tx
1L (command-message latency) and Rx
L (data-message latency) were displayed in
Figure 9, as these messages are sent immediately after being queued for sending. The overall cycle takes approximately 26 ms and matches the allowed input rate of the implemented cloud storage. As shown in the graph, data transmission has a longer duration, and there is a reserve to shorten the latency period. A faster network connection (5 GHz) can ensure faster data transmission. The command for ready state and the request for data hardly depend on the network; these issues are related to the microcontroller. Another possibility of minimizing latency duration is data packing. On the one hand, it will squeeze data and save network facilities. But, on the other hand, it can overload the microcontroller CPU, and time-saving can be flawed.
The resulting data-transmission process shows great possibilities for the IoT, when simple devices can be managed using internal network control features. Further network development recently let us implement the hierarchical connection of devices when fast and slow devices can be synchronized into the data flow using smart network facilities.
In an additional experiment determining the delay and stability of communication depending on distance and obstacles, several results were obtained that make it possible to understand how applicable this solution is in real gait analysis. Latency was measured in a long corridor at a distance of up to 90 m (
Figure 10). Each data point in the graph indicates the communication delay, while the master microcontroller and slave microcontrollers were at an indicated distance from each other. We assume that movement was constant, and the displacement during one communication is negligible.
Figure 11 shows that 83.2% of the total transmission latency is less than the average, but increasing the distance leads to increasing latency variation and the appearance of failed attempts to transfer the data. It can also be noted that, even as the average delay increased, the mode of the delay was still around 7 ms, which is a typical delay, as previously shown in
Figure 8. The measured average latency and success rate of transmitting data in a long corridor are shown in
Figure 11, where the success rate represents how many communications out of the attempted communications were successful (communication is held to be successful if both data-gathering modules return data within the allowed timeframe after the master board sends out a request for data).
Figure 11 shows a correlation between increasing delay and decreasing success rate while the distance grows. To obtain a full set of data, the master microcontroller must successfully communicate twice, once with each slave microcontroller. The master microcontroller must successfully send out both its messages (control command and request for data) and receive data messages, and this needs to happen for both slave microcontrollers.
Figure 11b shows an average amount of successful communications during an attempt to obtain a full line of data during each second of the experiment, where time is proportional to the distance between the master and slave devices.
The corridor experiment was repeated using the alternative method of synchronization. Because the alternative method utilized one-way communication, the round-trip delay could not have been calculated. An approximate one-way delay could have been obtained by comparing the timestamp of a message being sent and the timestamp of it being received. Eventually, a more direct characteristic of obtained data points per second was chosen, the values of which are displayed in
Figure 12.
It can be observed that throughout the majority of the experiment, the data-acquisition rate was constant, at around 20 samples per second, except for an increase to around 75 samples per second for a short duration. Having repeated the experiment multiple times, one or two spikes were observed appearing at different times during the experiment. It can thus be assumed that such a pattern is caused not by the environmental conditions of the experiment but by the interplay between the low-level implementation of the ESP-NOW communication protocol and the high-level implementation of the synchronization algorithm. More specifically, the issue is presumed to arise from received data processing and exporting being performed simultaneously with incoming data collection; meanwhile, in the proposed method, these processes are performed sequentially. Not only does the system display instability, but the data-acquisition rate at close range is lower than that of the proposed method (which is, on average, equal to 24.6 samples per second).
An oscilloscope was utilized to determine how well synchronized are the devices of a system. In the proposed method of synchronization, it was determined to only take 1.262 ms on average for a slave board to receive a command message since the master board sent it. Thus, slave boards are considered synchronized to the master board. The time it takes for a command message to be transmitted is not constant; hence, the difference in times that both slave boards receive a command message must also be measured. The oscilloscope experiment revealed an average difference of 0.998 ms, as seen in
Figure 13a. Based on this value, slave boards are considered to be synchronized with each other. Taking the results of both experiments into account, in further research, the whole system (both slave boards and the master board) is denoted as perfectly synchronized.
In the alternative synchronization method, it was determined that the differences in times that both slave boards receive a synchronizing message cluster around the mean of 1.211 ms and 2.130 ms, as seen in
Figure 13b, with a standard deviation of 0.279 and 0.345, respectively. Slave boards thus can be assumed to be synchronized. But, on average, they are more out of sync, and the dispersion is greater than the proposed method of synchronization.
Taking the results of the long-corridor experiment and the oscilloscope experiment into account, the alternative method was declared as inferior to the proposed method, and further experiments were conducted using the proposed synchronization method.
The delay and stability of communication were also evaluated by conducting an experiment in an open field along a busy road. The results of this experiment are presented in
Figure 14. Brief drops in the success rate can be seen throughout the experiment. At an approximately 100 m distance, the connection success rate became equal to 0%, as indicated by a red zone in the average delay graph. The connection resumed shortly after, but the success rate did not rise back to prior values. Presumably, the communication failure and brief drops in signal reliability were caused by passing cars and the close presence of smart devices.
The impact of obstacles on the proposed system’s functionality was tested by separating the master and slave microcontrollers with a varying number of concrete walls. The connection between the slave and master devices through one solid concrete wall was stable and of low latency (
Figure 15). The connection through two solid concrete walls had frequent drops in success rate (as indicated by the red zones in the average delay graph), and the overall latency was higher (
Figure 16). The connection was not possible through three concrete walls. It can be concluded that, with each wall between the communicating devices, latencies increased and the communication success rate decreased.
As seen in
Figure 15 and
Figure 16, it was found that, with each additional wall, the quality of the connection decreased. Through one wall, the connection remained stable. Through two walls, delays and data loss were observed. Through three walls, the connection was completely absent. In comparison, communication remained stable in an open area and a long corridor at a distance smaller than 100 m.
This research allowed us to obtain objective data on the limitations of wireless communication in various building conditions and establish critical points for its effectiveness. After completing the main stages of the experiment, it is seen that real-environment conditions strongly impact the efficiency of the WIFI-based data-acquisition and synchronization systems, and this impact could be even more unpredictable in the open areas. On the other hand, this research validated our hypothesis that such a system is suitable for monitoring human gaits during casual activities at home, where the one wall between the slave and master controller or a distance smaller than 100 m should be acceptable limitations.
4. Conclusions
After performing the experimental research, it was noted that the command and data-transfer delay during the test falls into the desirable range. The latency of commands to collect and transfer sensor data does not exceed 1.33 ms and 1.7 ms, respectively. The total duration of gathering, transmitting, analyzing, and exporting data from three piezoresistive pressure sensors and an accelerometer with a gyroscope module lies in the range of 10.5 ms, with the data-acquisition success rate not falling below 80%. Thus, the research confirms that the use of the MPU6050 module, pressure sensors, and transmitting and receiving ESP32 microcontrollers, together with the developed data-synchronization technique, enables reasonably reliable and fast data acquisition from several different sensors that are located up to 100 m away from the master controller in an open space or separated by a solid concrete wall. The achieved characteristics of such a data-gathering system open wide opportunities for applying this method in the field of gait analysis.
Experimental research revealed that the average desynchronization of data gathered from separate data-module sets did not exceed 1 ms, and the average desynchronization of the data-module sets and the data-reception unit did not exceed 2.5 ms. As tight synchronization was achieved, the proposed method is deemed practical in systems where a data-storage device and data-gathering devices must be accurately synchronized in a wireless system.
The achieved sampling rate of 24.6 samples per second is sufficient for human-gait monitoring and analysis, assuming that humans step at approximately up to 5 Hz frequency. Thus, the device can be used for human-gait monitoring. For other applications with a higher sampling rate, more advanced and sophisticated technical and network solutions may be required.
The alternative method of data-transmission mode has better data-transmission latency but indicates lower stability at higher distances or in the presence of obstacles. The decision to use data synchronization with the first method has a solid reason of having higher stability.
Additional research and development could be directed at improving the filtering and synchronization algorithms, accounting for additional factors, such as noise and temperature variations, and extending this method to other types of sensors and platforms. This will help achieve even greater accuracy and reliability in data synchronization and expand its application to various areas of research and development. The alternative synchronization method could be improved to outperform the proposed synchronization method in terms of lower latency and matching stability. An intermediate device in data transmission could be implemented into the system, overcoming the current distance and obstacle limitations, and allow for a wider application of the system. Currently, relatively simple data-analysis algorithms for human-gait analysis could be developed further to verify whether the sampling rate of the system is sufficient for a more involved analysis.


 ,
, 


