Article

A Mobile-Based System for Detecting Ginger Leaf Disorders Using Deep Learning

1
University Institute of Information Technology, Pir Mehr Ali Shah, Arid Agriculture University—PMAS AAUR, Rawalpindi 46000, Pakistan
2
Khalifa University Center for Autonomous Robotic Systems (KUCARS), Khalifa University, Abu Dhabi 127788, United Arab Emirates
3
Department of Computer Science, Institute of Space Technology, Islamabad 44000, Pakistan
4
Department of Electrical and Computer Engineering, Aarhus University, 8200 Aarhus, Denmark
*
Authors to whom correspondence should be addressed.
Future Internet 2023, 15(3), 86; https://doi.org/10.3390/fi15030086
Submission received: 25 January 2023 / Revised: 14 February 2023 / Accepted: 17 February 2023 / Published: 21 February 2023

Abstract

:
The agriculture sector plays a crucial role in supplying nutritious and high-quality food. Plant disorders significantly impact crop productivity, resulting in an annual loss of 33%. The early and accurate detection of plant disorders is a difficult task for farmers and requires specialized knowledge, significant effort, and labor. In this context, smart devices and advanced artificial intelligence techniques have significant potential to pave the way toward sustainable and smart agriculture. This paper presents a deep learning-based android system that can diagnose ginger plant disorders such as soft rot disease, pest patterns, and nutritional deficiencies. To achieve this, state-of-the-art deep learning models were trained on a real dataset of 4,394 ginger leaf images with diverse backgrounds. The trained models were then integrated into an Android-based mobile application that takes ginger leaf images as input and performs the real-time detection of crop disorders. The proposed system shows promising results in terms of accuracy, precision, recall, confusion matrices, computational cost, Matthews correlation coefficient (MCC), mAP, and F1-score.

1. Introduction

The most significant challenges that any crop faces are diseases [1], pests [2], weeds [3], and nutritional deficiencies [4]. For instance, a 20–40% loss occurs due to plant diseases [5] and plant pests [6] annually. Similarly, nutritional deficiency also influences the productivity of agricultural foods [7]. Farmers and domain experts used manual methods for detecting disorders by visualizing the plant’s leaf with the naked eye. However, this method became infeasible due to the large size of fields, physical conditions, time, and cost [5]. Therefore, automatic, robust, precise, fast, and cost-effective methods and techniques for plant disorder identification have been demanding research in smart agriculture in recent years.
Deep learning has made considerable progress in image-based classification problems [8,9]. A key benefit of deep learning is that it reduces the effort required for feature extraction, which is time-consuming and requires expertise. In this context, convolutional neural networks (CNN) have gained a lot of success in image classification and object recognition. Deep CNN, an extended version of CNN, has been used in detection, classification, and recognition problems. However, training these models requires considerable training data and computing resources.
In the literature, a rise in the use of deep learning-based methods can be noticed in identifying the different diseases associated with crops such as wheat, tomato, cucumber, apple, rice, pearl millet, citrus plants, and cassava. For instance, a [10] study worked on identifying cassava plant disease. In this work, the CNN model was employed on 720 images of the dataset and classified the seven cassava plant diseases and one healthy class. However, they gained a lower classification rate when tested on real-time image classification. The authors in [2] proposed a deep-learning framework for pest and disease identification problems. They employed a CNN model to diagnose 27 plant diseases. The authors conducted a series of tests that revealed an overall detection accuracy of 86.1%. A DL-based CNN model is trained using 2029 images and detects the five apple diseases on leaves. As they trained on a small dataset, this reported a classification accuracy of 78.8%. Using an open source dataset, PlantVillage, the authors in [11] constructed deep CNN models for plant leaf disease detection. This dataset contains 54,306 images showing a total of 26 diseases collected from different plants in a lab environment. The authors [12] worked on numerous disease detections by considering 12 crops using real-field images.
Farmers are also confronted with pest attacks despite plant diseases. Pests are environmental disasters that prevent plants from growing normally or even killing them. When pests attack crops, they leave certain patterns on the leaves. These pest patterns on leaf detection are a very challenging process. Therefore, deep learning is introduced to detect the pest patterns on the leaves of crops [13]. The classification of plant pests using automatic deep learning-based methods have been performed in various studies. The authors in [13] detected the pests of the strawberry plant, which is sown in a greenhouse environment. In this work, a classical machine learning-based support vector machine algorithm is applied to detect the housefly and whitefly pests of the strawberry plant. The authors [14] proposed coffee tree disease identification using different classical and deep learning methods. In this study, InceptionV3 proved challenging for testing the dataset [15]. The study combined saliency techniques and CNNs to build an insect detection system. The system is 92.43% accurate on small datasets and 61.93% accurate on large datasets.
A deficiency will emerge when a plant lacks a necessary nutrient for growth and will indicate various signs of defects. Hence, detecting nutrient deficiencies is critical for early diagnosis to avoid severe losses. Deep learning frameworks show their performance in nutrient deficiency recognition [7]. In recent studies, work on nutrient deficiency classification problems can also be seen. The goal of the work [7] was to provide a thorough review of the methods utilized to identify plant nutrient deficiencies using digital images. The authors in [16] detected nitrogen deficiencies in one variety of rice plant, capturing an image of 5 megapixels and gaining 0.92% accuracy. The authors in [17] detected seven nutrient deficient types with the ResNet-50 model, having 4,088 images of black gram and showing an accuracy of 65.44%. By combining inception-ResNet and the autoencoder, the system accurately identified the three nutritional deficiencies for 571 tomato plant images and obtained a 91% test accuracy. However, the dataset they employed is limited in scope, only covering N, Ca, and K nutrients [18].
The research community has presented extensive work on plant defect identification and recognition problems in recent decades. However, there is still a need for work on ginger plant defect identification, recognition, and classification. To cover the existing issues of the ginger plant, we used various deep-learning models to classify ginger plant-associated disorders such as pest pattern, nutrient deficiency, and soft rot disease. This work is an extension of our previous work on the ginger plant [19]. In the former study, we proposed identifying and classifying ginger plant soft rot disease, nutritional deficiencies, and pest patterns at early as well as multiple stages using different deep learning-based models such as CNN, VGG-16, MobileNetV2, and ANN. The proposed deep learning models were trained and tested on the dataset of ginger plant leaf images consisting of healthy plants, pest patterns, nutrient deficiency, and soft rot disease acquired from an entire field of a standing crop. The study analyzed the performance and capability of the deep learning methods for ginger plant disorder detection. Here, the previous work is extended by considering the identification and classification of ginger plant disorders in real time. We developed an automatic, android-based detection system that takes the leaf images of the crop in the field as input and provides real-time identification results. Moreover, the system also provides a recommendation to the end user based on the detected results. In addition, this study presented an in-depth analysis of the system’s performance in terms of timing complexity and accuracy.
The key contributions of this paper are given as follows:
  • Creating a large dataset of ginger plant leaf images containing patterns of health, pests, nutrient deficiency, and soft rot disease.
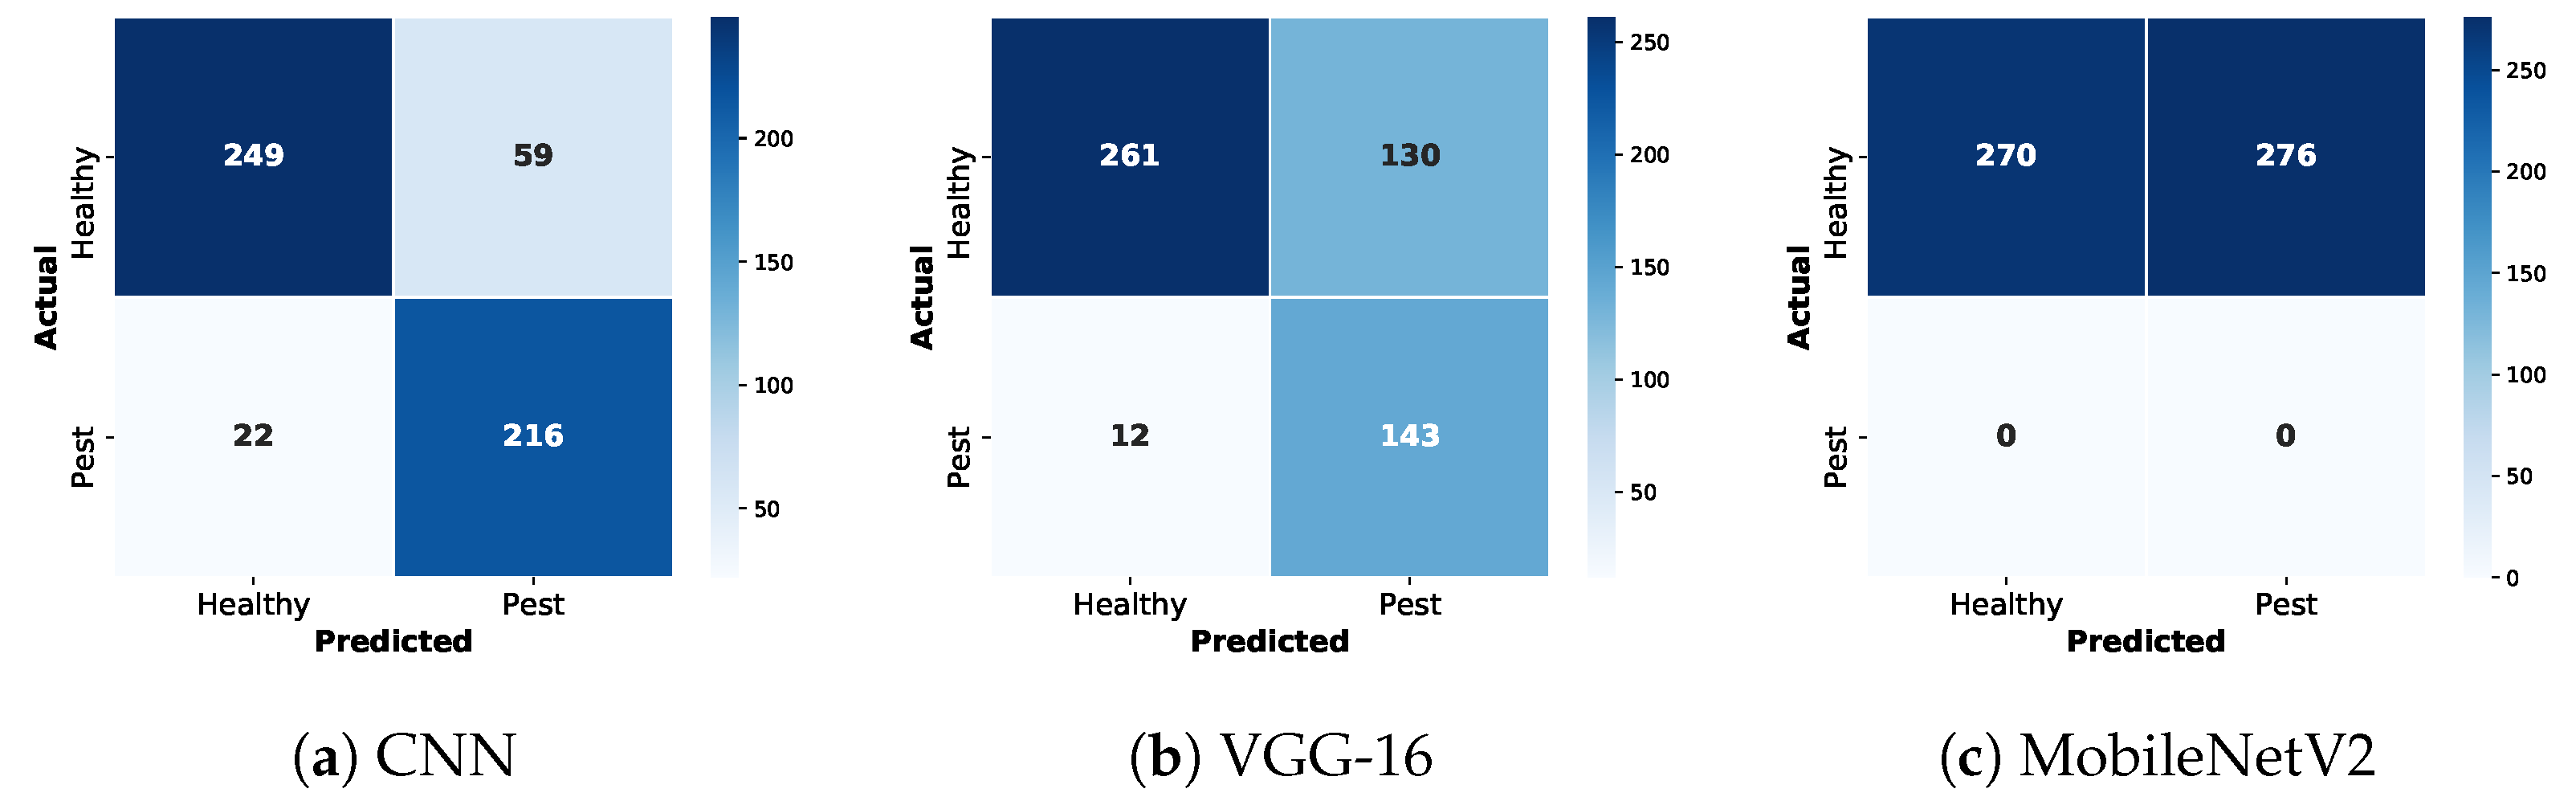
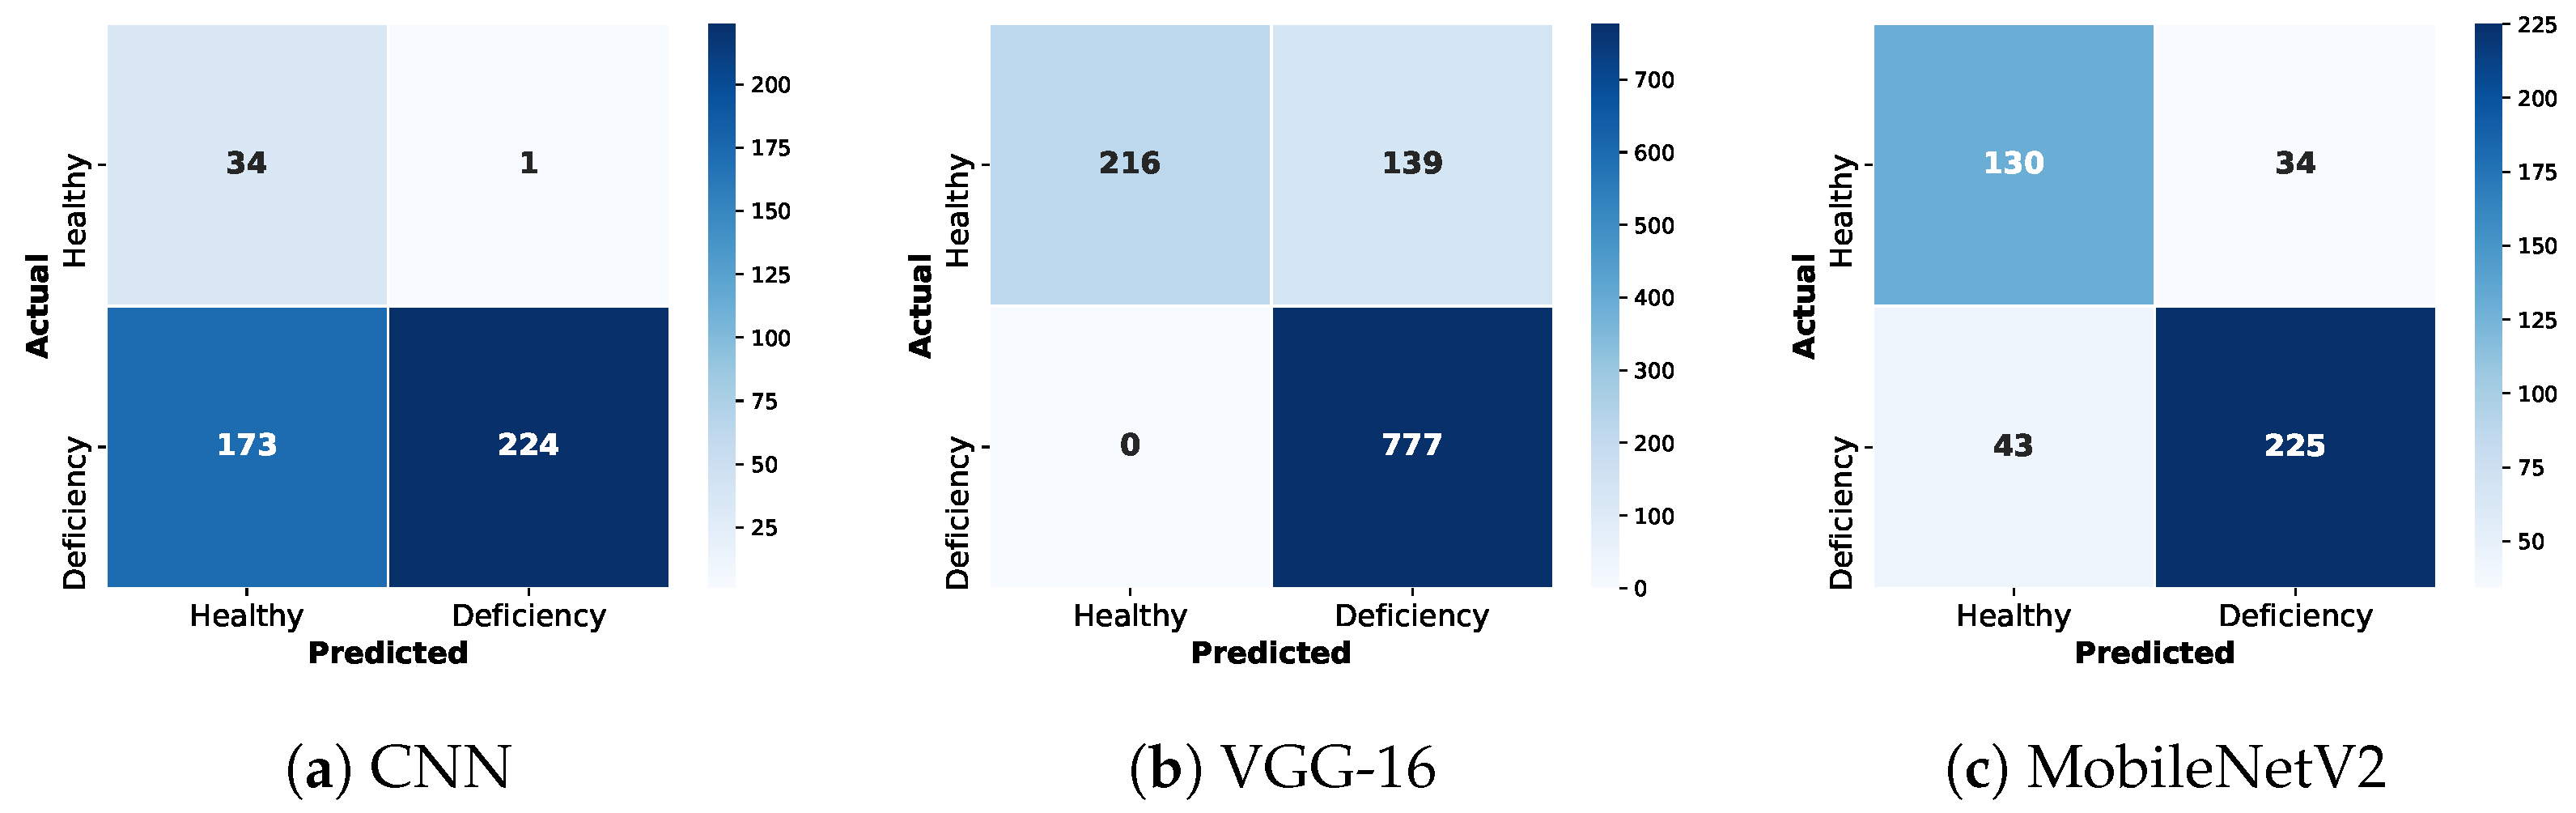
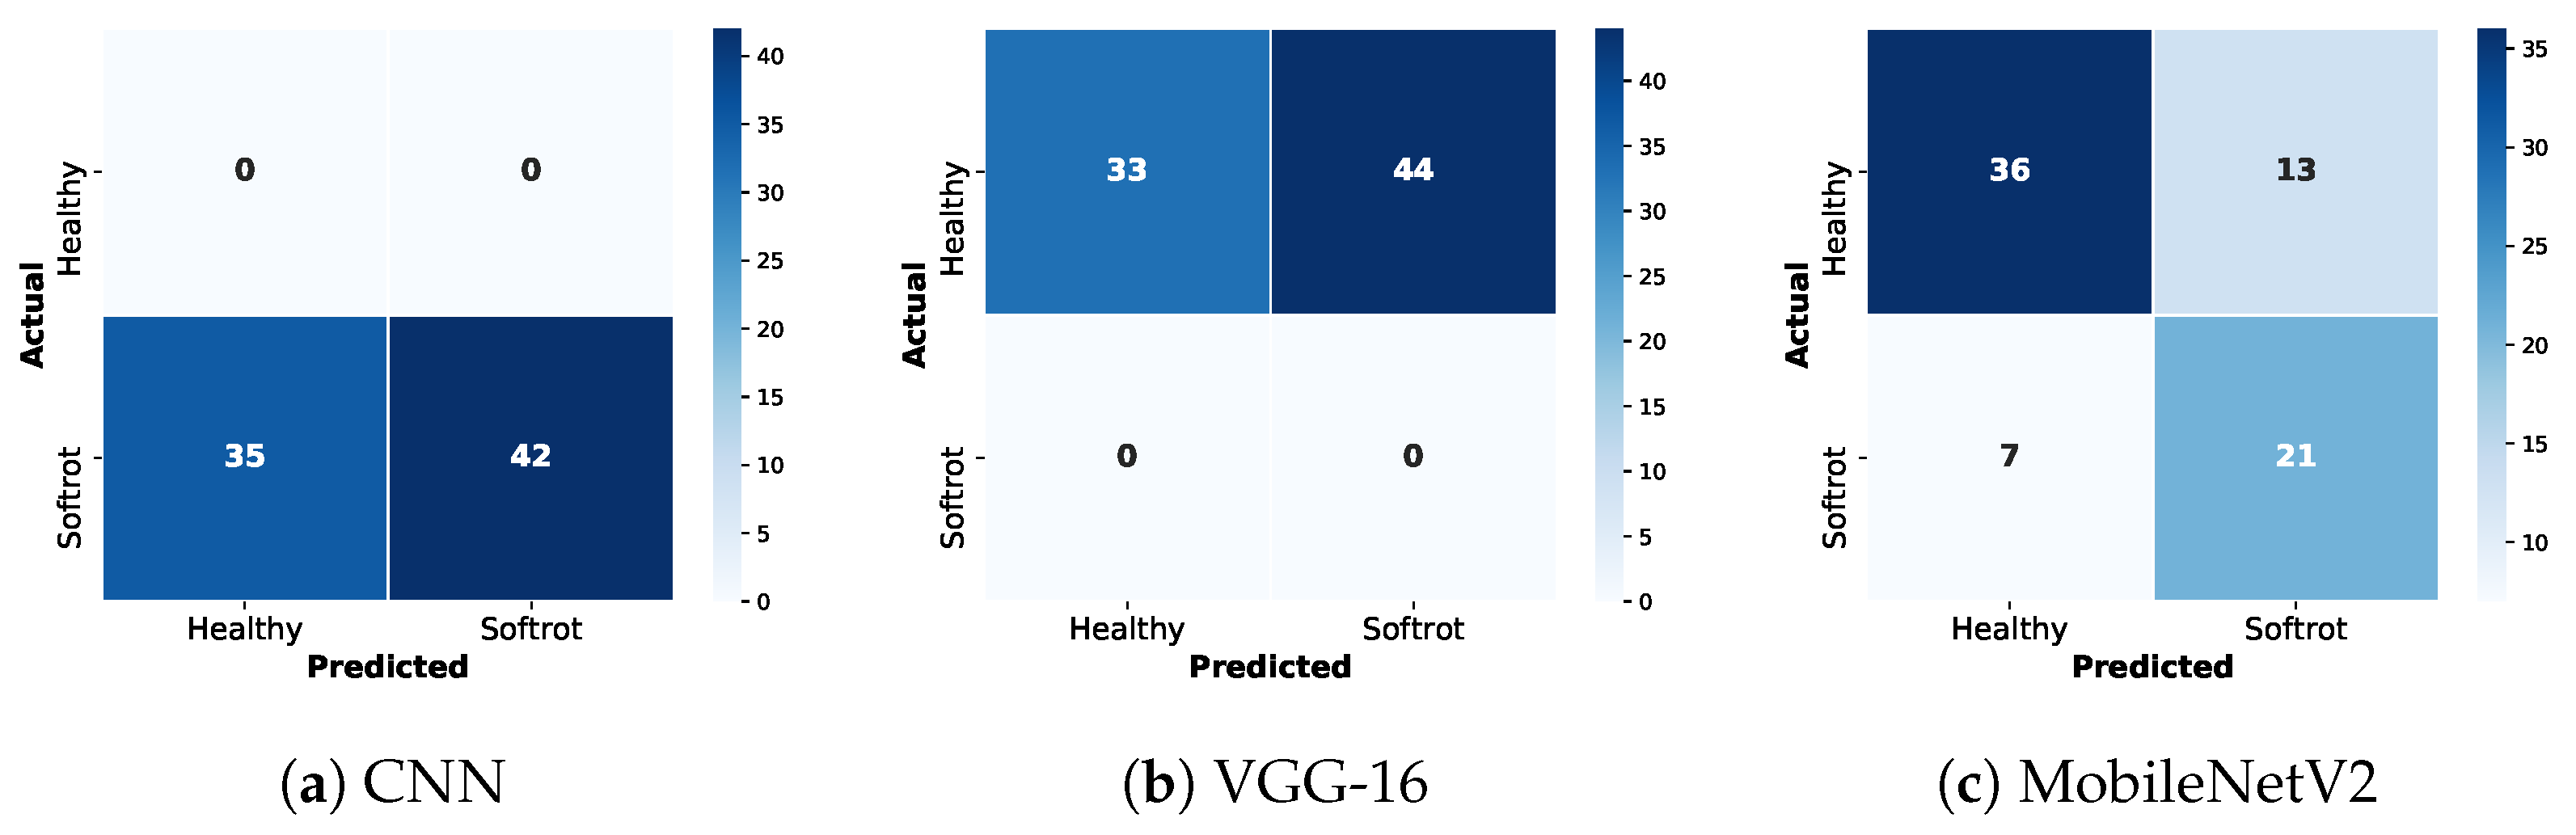
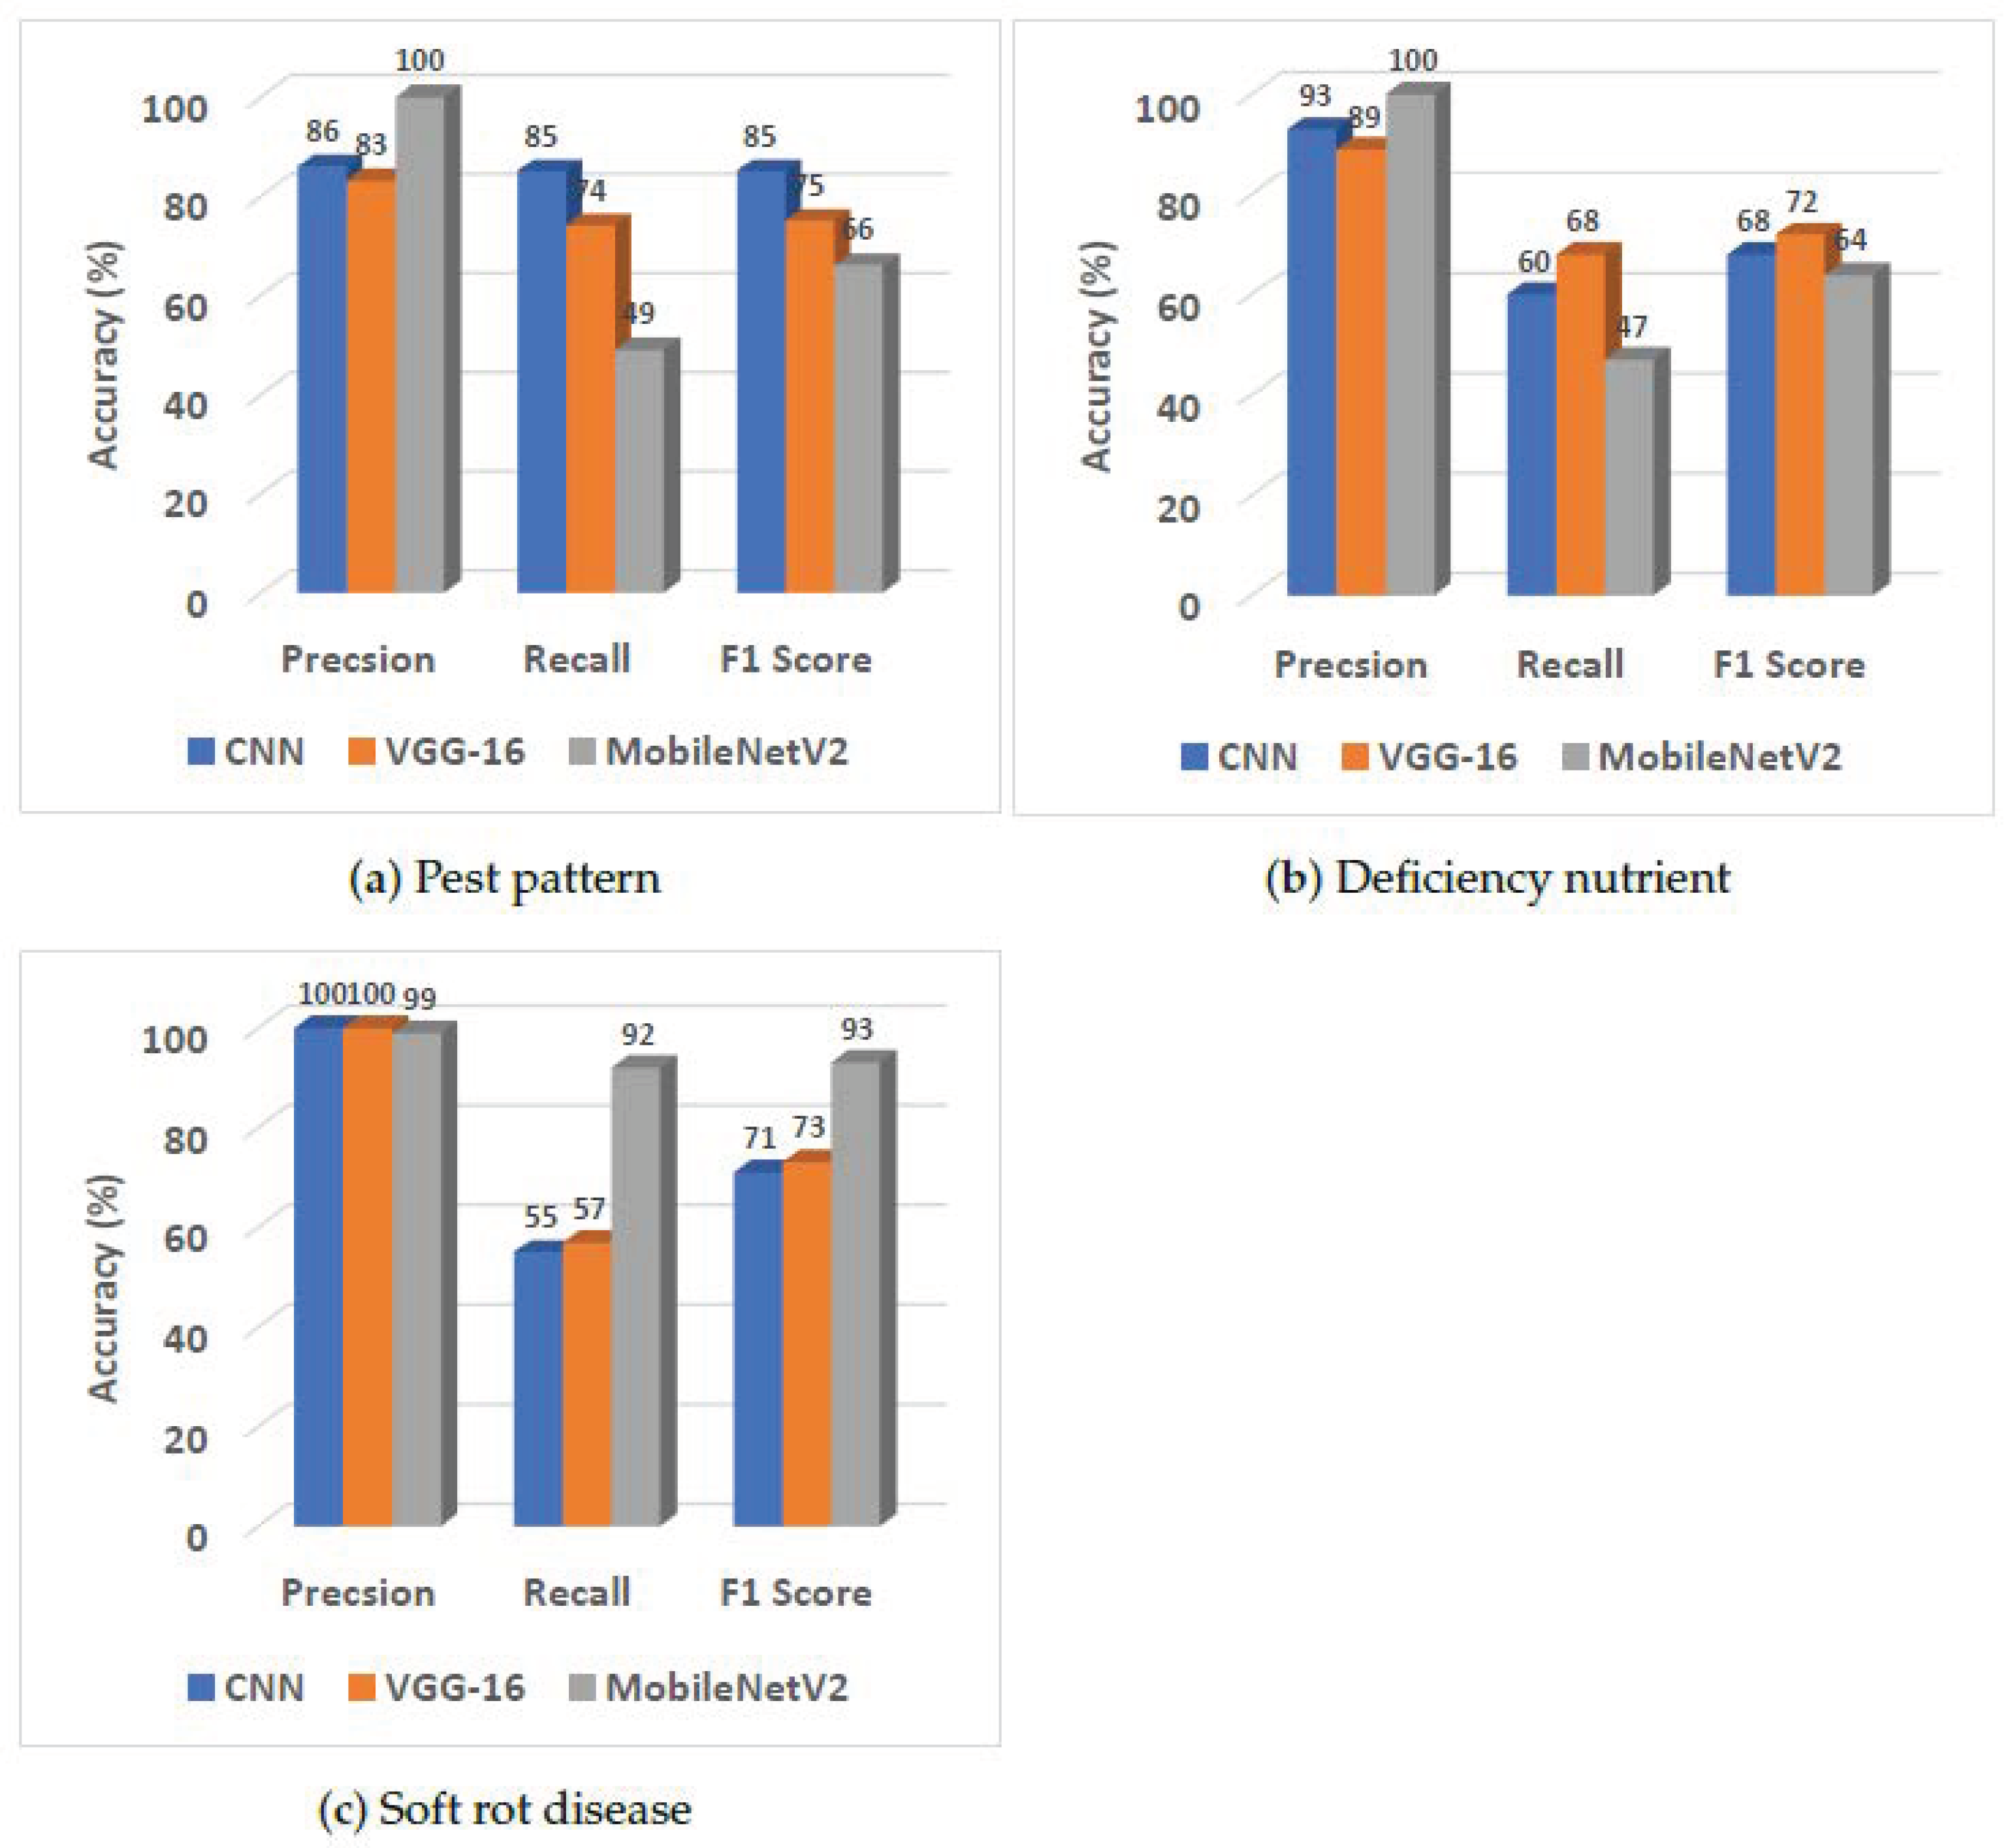
  • Presenting ginger plant pest patterns, nutritional deficiencies, and soft rot disease identification by applying deep learning classification and detection models such as CNN, MobileNetV2, VGG-16, and YOLOv5.
  • Analyzing the performance of the proposed models in terms of time complexity and accuracy under different conditions.
  • Validating a deep learning-based detection platform that executes on smartphones in a real-time environment, generates identification results based on the given input, and recommends appropriate actions to the farmers.
The rest of the paper is organized as follows. Section 2 reviews the related work. Section 3 discusses the proposed methods, followed by obtaining results and discussion in Section 4, and finally, Section 5 concludes the paper.

2. Related Work

This section describes various research studies that were carried out to detect plant leaf disorders using classical and advanced deep learning methods.
The spread of crop diseases might harm the economy. Traditionally, crop disease diagnosis is made manually, which is time-consuming and lacks accuracy. The authors in [20] performed image binarization, contour extraction, and fox fitting techniques using deep learning. This work utilized different deep learning models and achieved 73% accuracy. However, the adopted models showed poor performance on the other datasets. Moreover, the recommended model, however, requires a lot of computation during training to identify various diseases.
Identifying citrus plant diseases was addressed. The authors in [21] employed K-means, classification, and neural network techniques. The study emphasized the traits, advantages, and disadvantages associated with citrus. The study also showed that new technologies would be needed to identify and categorize citrus plants in the future. Additionally, they mentioned that citrus plants’ automatic recognition and classification are still in their early stages.
In [22], the authors developed pipelines based on fuzzy, support vector machine and neural network for plant leaf disease detection. Although the study achieved significant results, the authors highlighted the pros and cons of computer vision-based methods in plant disease detection. This study also suggested exploring new tools and techniques for disease identification at different stages.
For the task of detecting wheat leaf disease from finely grained image categorization in [23], the authors employed improved CNN. The suggested model was implemented with many neurons, data sources, and connecting channels. The findings showed that VGG16 with AlexNet can achieve approximately 90% accuracy. Furthermore, the study highlighted that other models, such as GANs, would produce better results using a large dataset.
In [24], the authors focused on the fusarium head blight disease that affects wheat crops. Images of wheat leaves are processed to identify the damaged area using CNN and image processing techniques. The model correctly identifies the crop’s sick regions in training with a mean average precision of 92%. The outcomes surpass those of k-means and Otsu’s techniques. To more accurately diagnose the unhealthy components, this approach needs vast datasets.
The CNN classification technique was exploited in study [25] to identify the strengths and weaknesses of works that used a CNN to detect crop diseases. The study proposed developing a more balanced and reliable agricultural tool for food production.
In [26], deep learning, machine learning, transfer learning, and deep convolutional neural network were applied. The proposed model successfully classified 38 different diseased classes. The results showed 96.46% accuracy by the proposed model. This accuracy exceeds standard machine learning techniques.
In [27], the diseases and pests of corn crops were captured at early stages from the field. The images were segmented by using image texture-based and iterative clustering methods. Then, the obtained features from the segmented images were used in the classification process. Moreover, the classification was performed via a multi-class support vector machine (SVM). The results showed 52% accuracy for the pest detection problem. However, the most common pest attack on the corn crop is an aphid, which is not considered in this study.
In [28], authors explored the application of deep learning to identify rice plant-associated diseases. This study demonstrated that ResNet-101, VGG-16, and YoloV3 are robust to blurred and irregularly shaped images. However, when creating frames, they cannot extract the right frames because the main features of frames are fewer, while new frames are spectra that result in a waste of computation resources.
In [29], authors worked on identifying the ginger plant diseases at the initial stage. This work adopted traditional computer vision and image-processing techniques for leaf disorder identification. Farmers can capture plant leaves using the deployed system connected to a digital or web camera. Furthermore, image-processing techniques are used to determine the affected part. Farmers are informed of the disease type via a global system for mobile communications (GSM) interface. The relay then activates the device’s pump, releasing the appropriate medication to treat the affected plant’s condition. The implementation results show that SVM and k-means algorithms produce better results than traditional methods. However, the used dataset is insufficient to generalize the technique, and ginger diseases with pest attacks are not considered.

3. Materials and Methods

Figure 1 presents an overview of the research work conducted in this study. First, a dataset of ginger plant leaf images is collected and categorized into healthy, pest patterns, nutrient deficiency, and soft rot diseases. Then, data pre-processing and augmentation are performed to strengthen the dataset. This is followed by implementing various deep-learning models to train the processed dataset. Subsequently, the trained models are integrated into an android application that classifies various ginger plant leaf disorders in real time. In the next section, we discuss the proposed methodology in more detail.

3.1. Ginger Plant Dataset

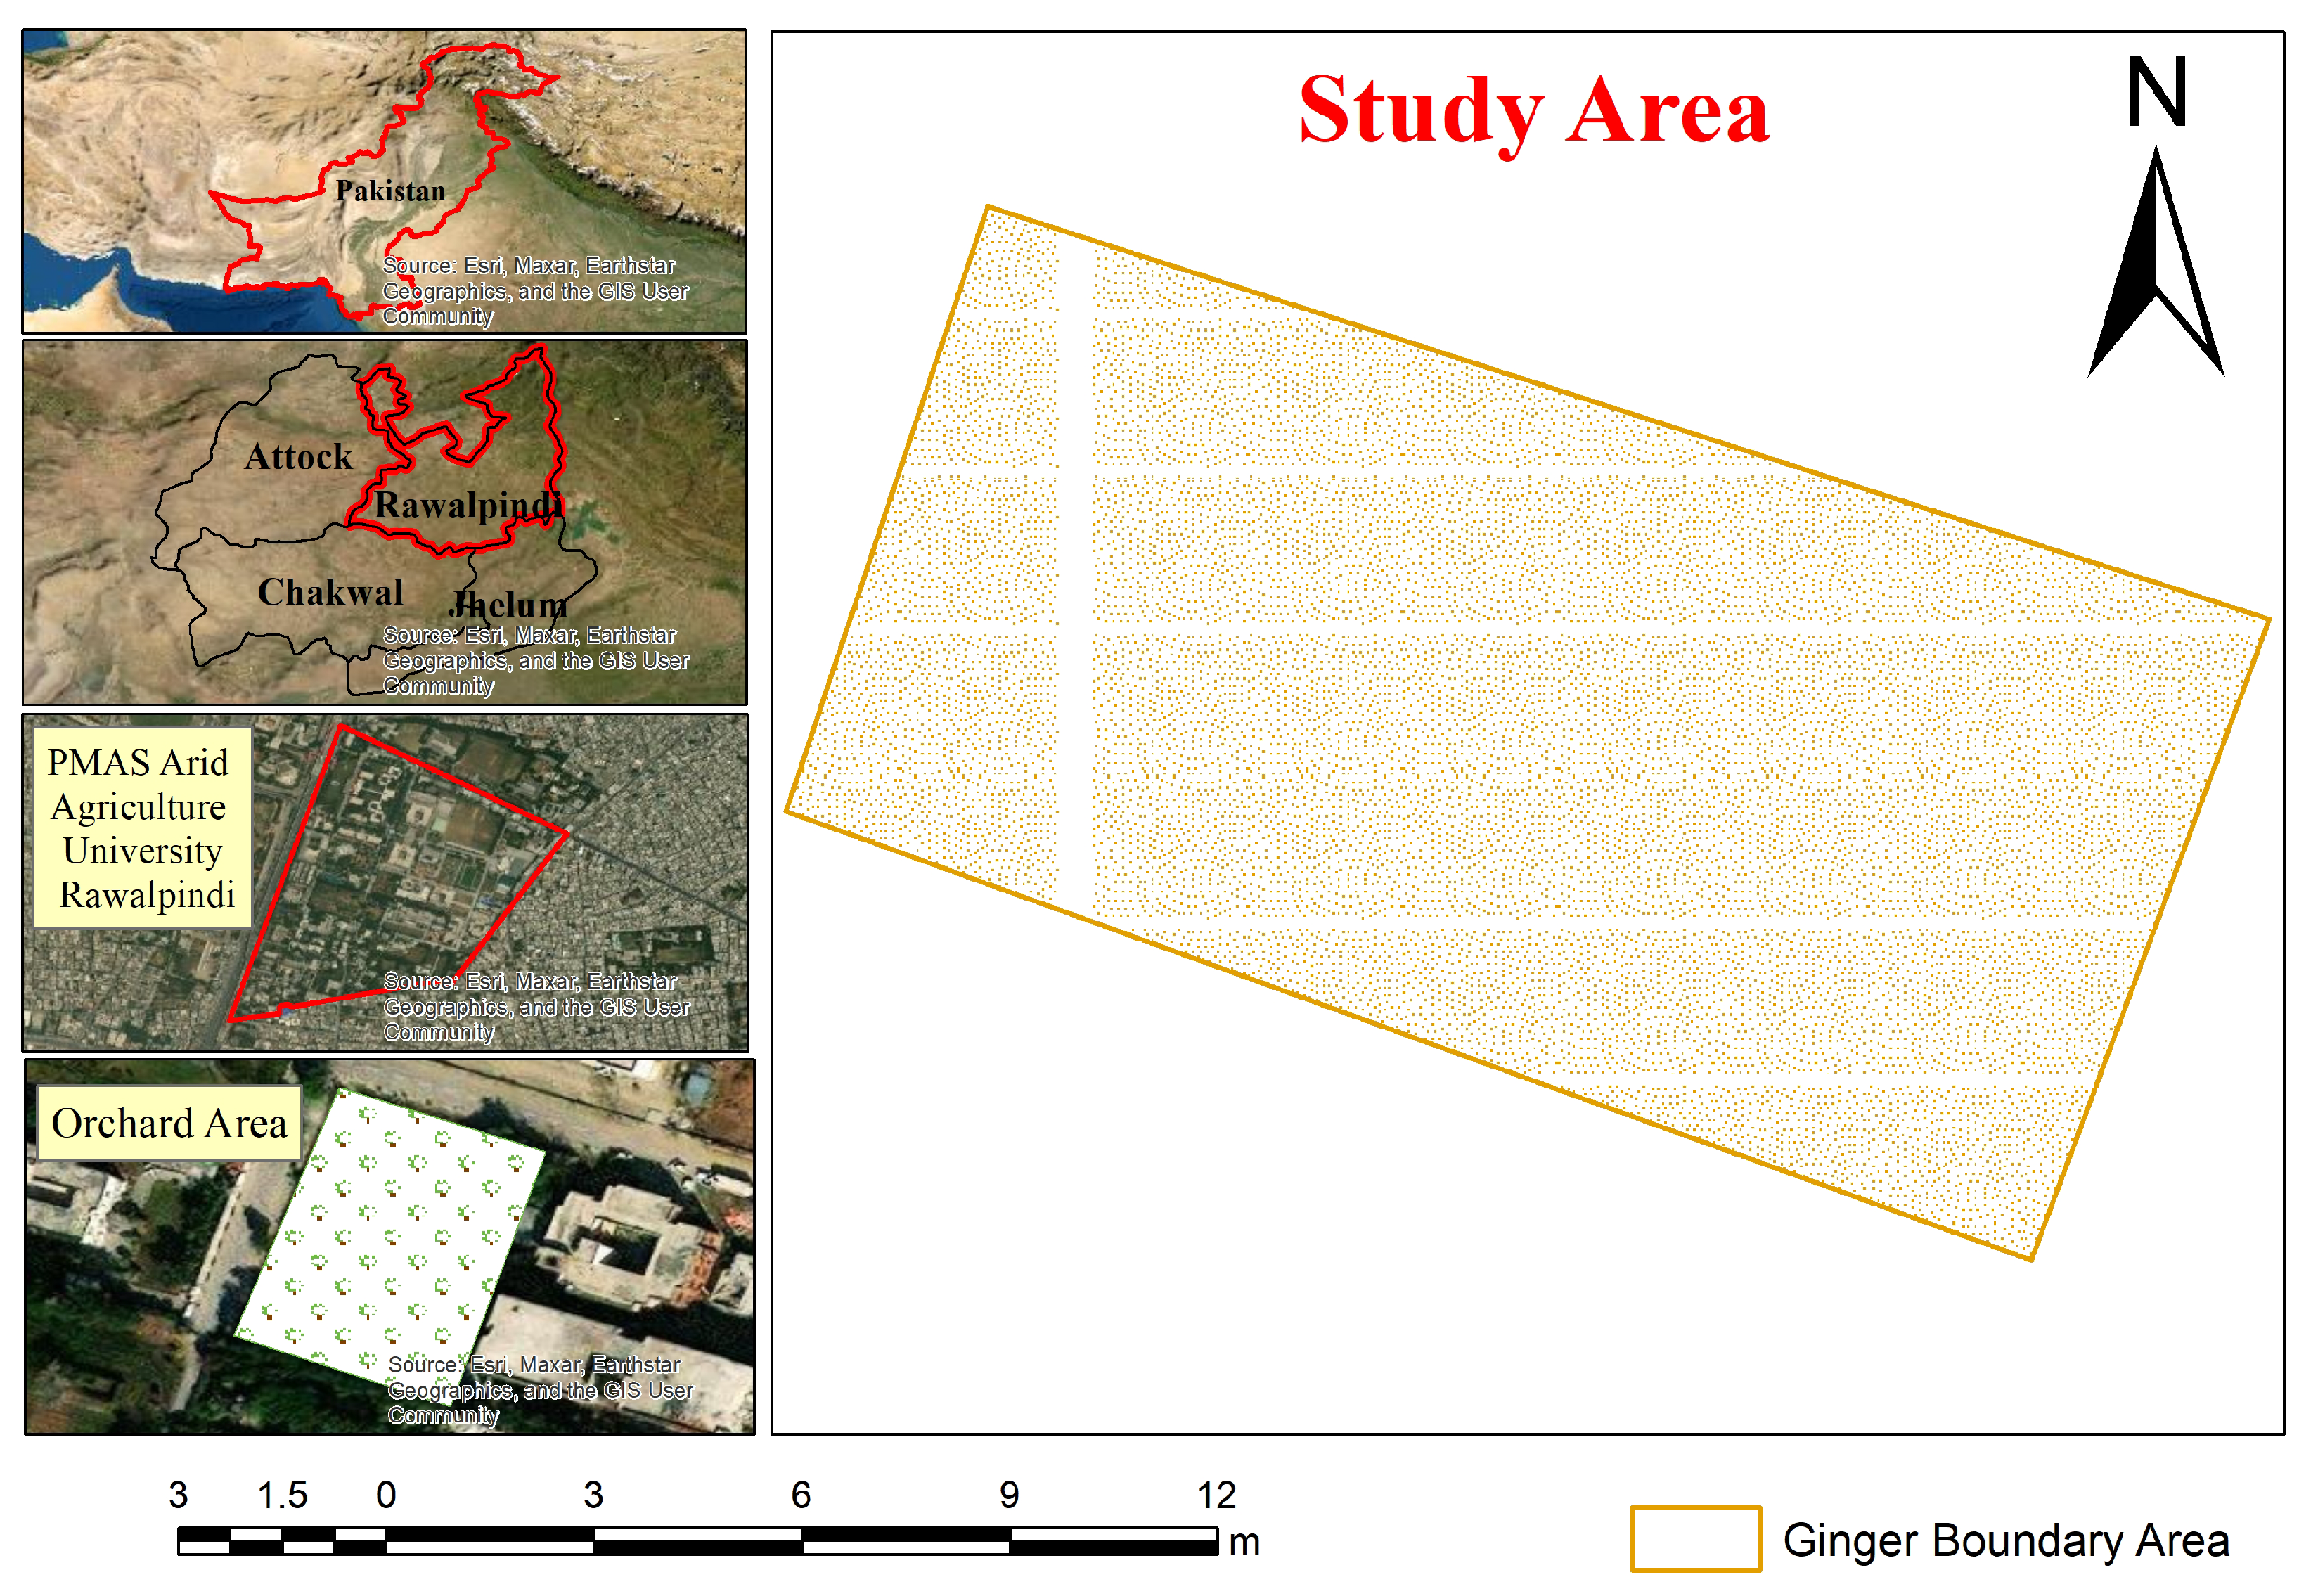
The dataset was collected from a field located at the orchard of PMAS—Arid Agriculture University Rawalpindi, Pakistan. The location of the field is presented in 
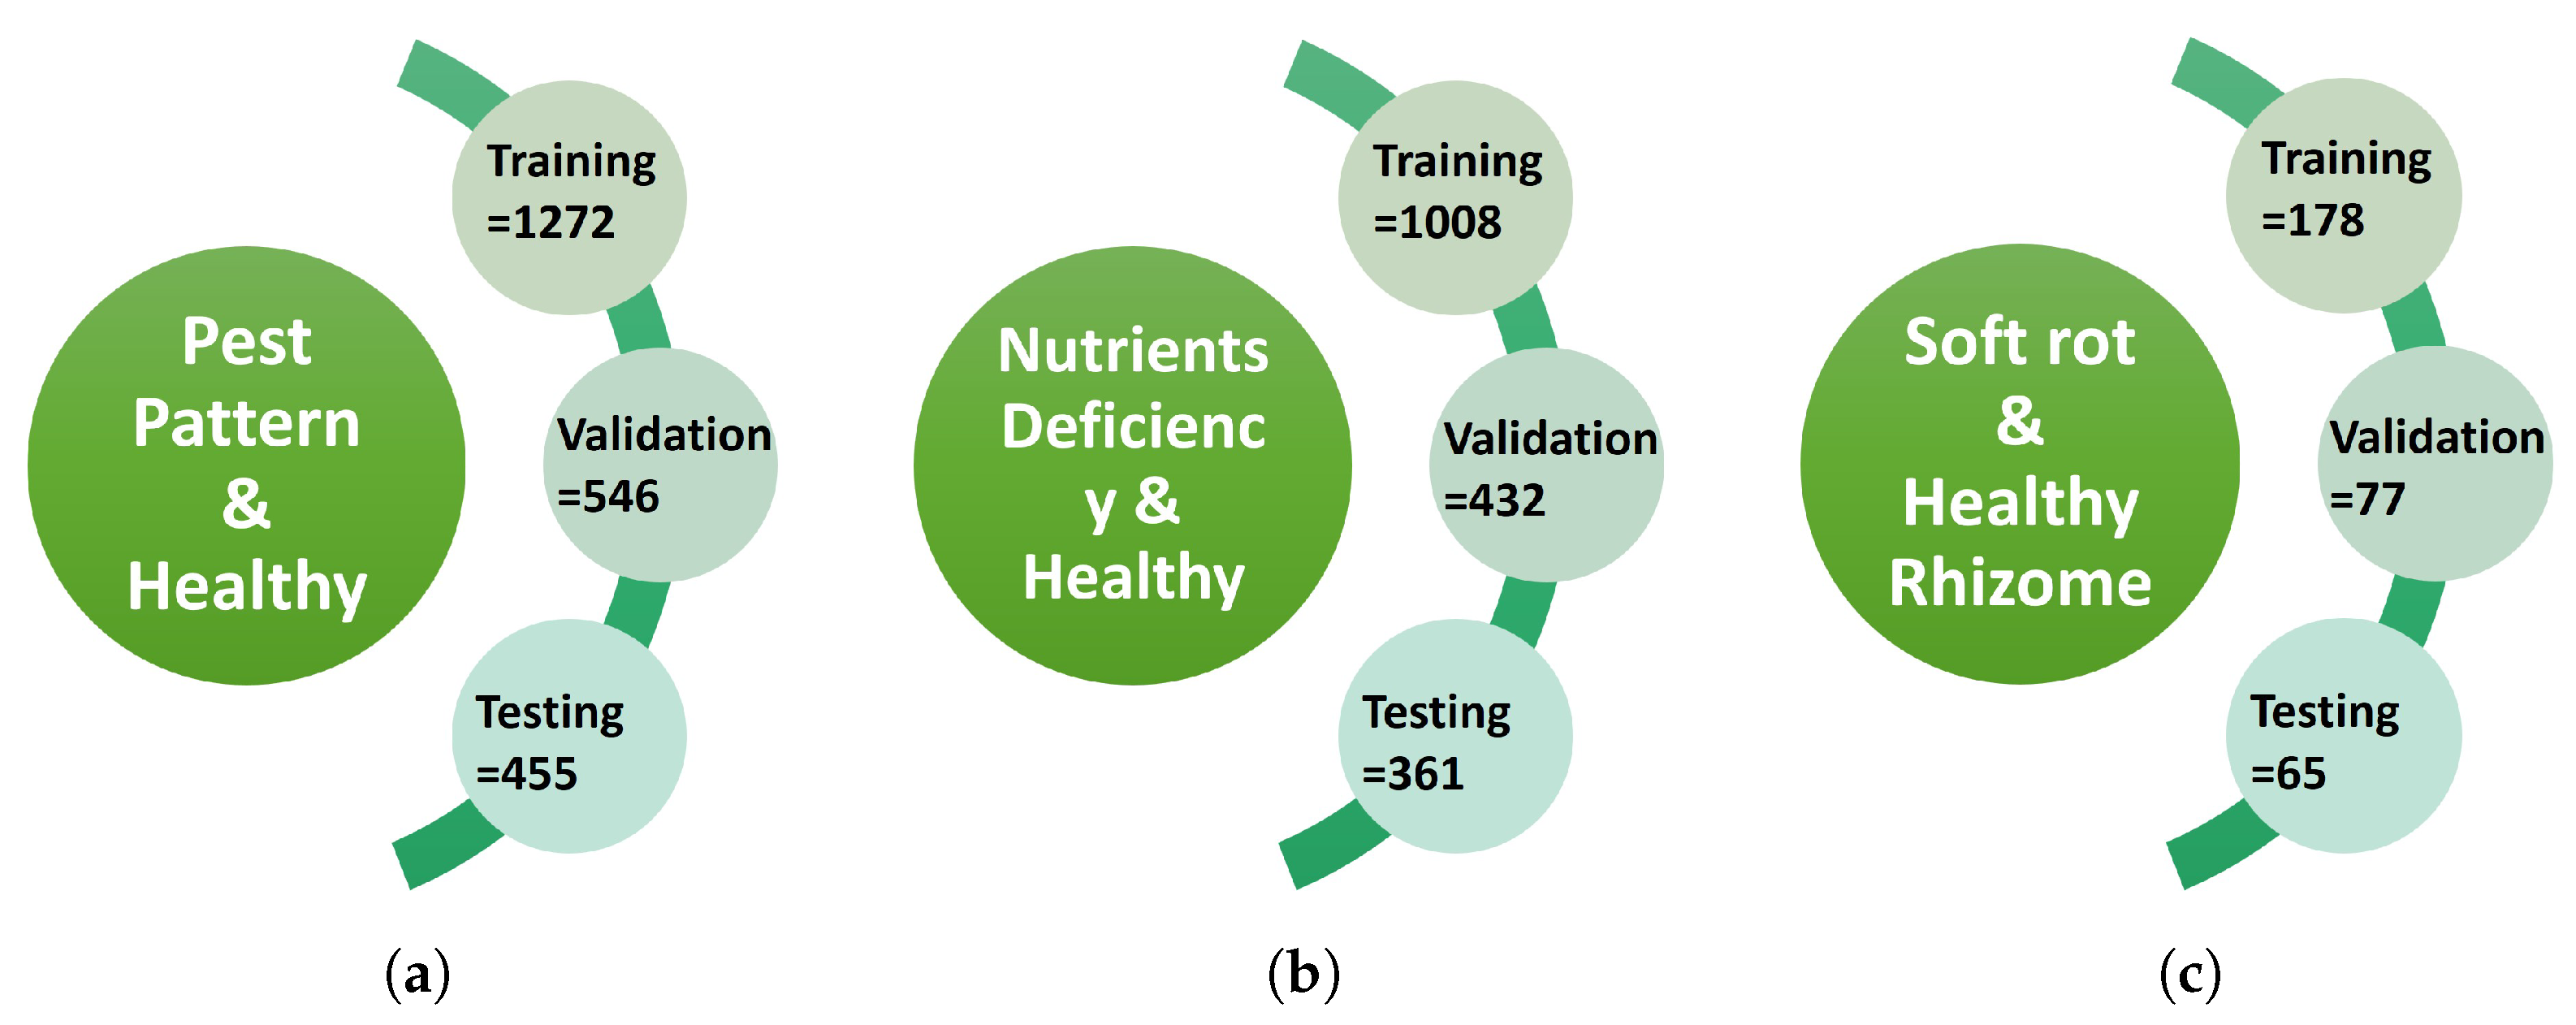
Figure 2. In this experiment, ginger crop digital images were collected with a total of 4394 images of destructive behavior in early and multiple stages. The digital images dataset consists of 3 categories, namely soft rot disease, pest attacks, and deficiency nutrients. A summary of the gathering of the images of the ginger plant is depicted in Figure 3.
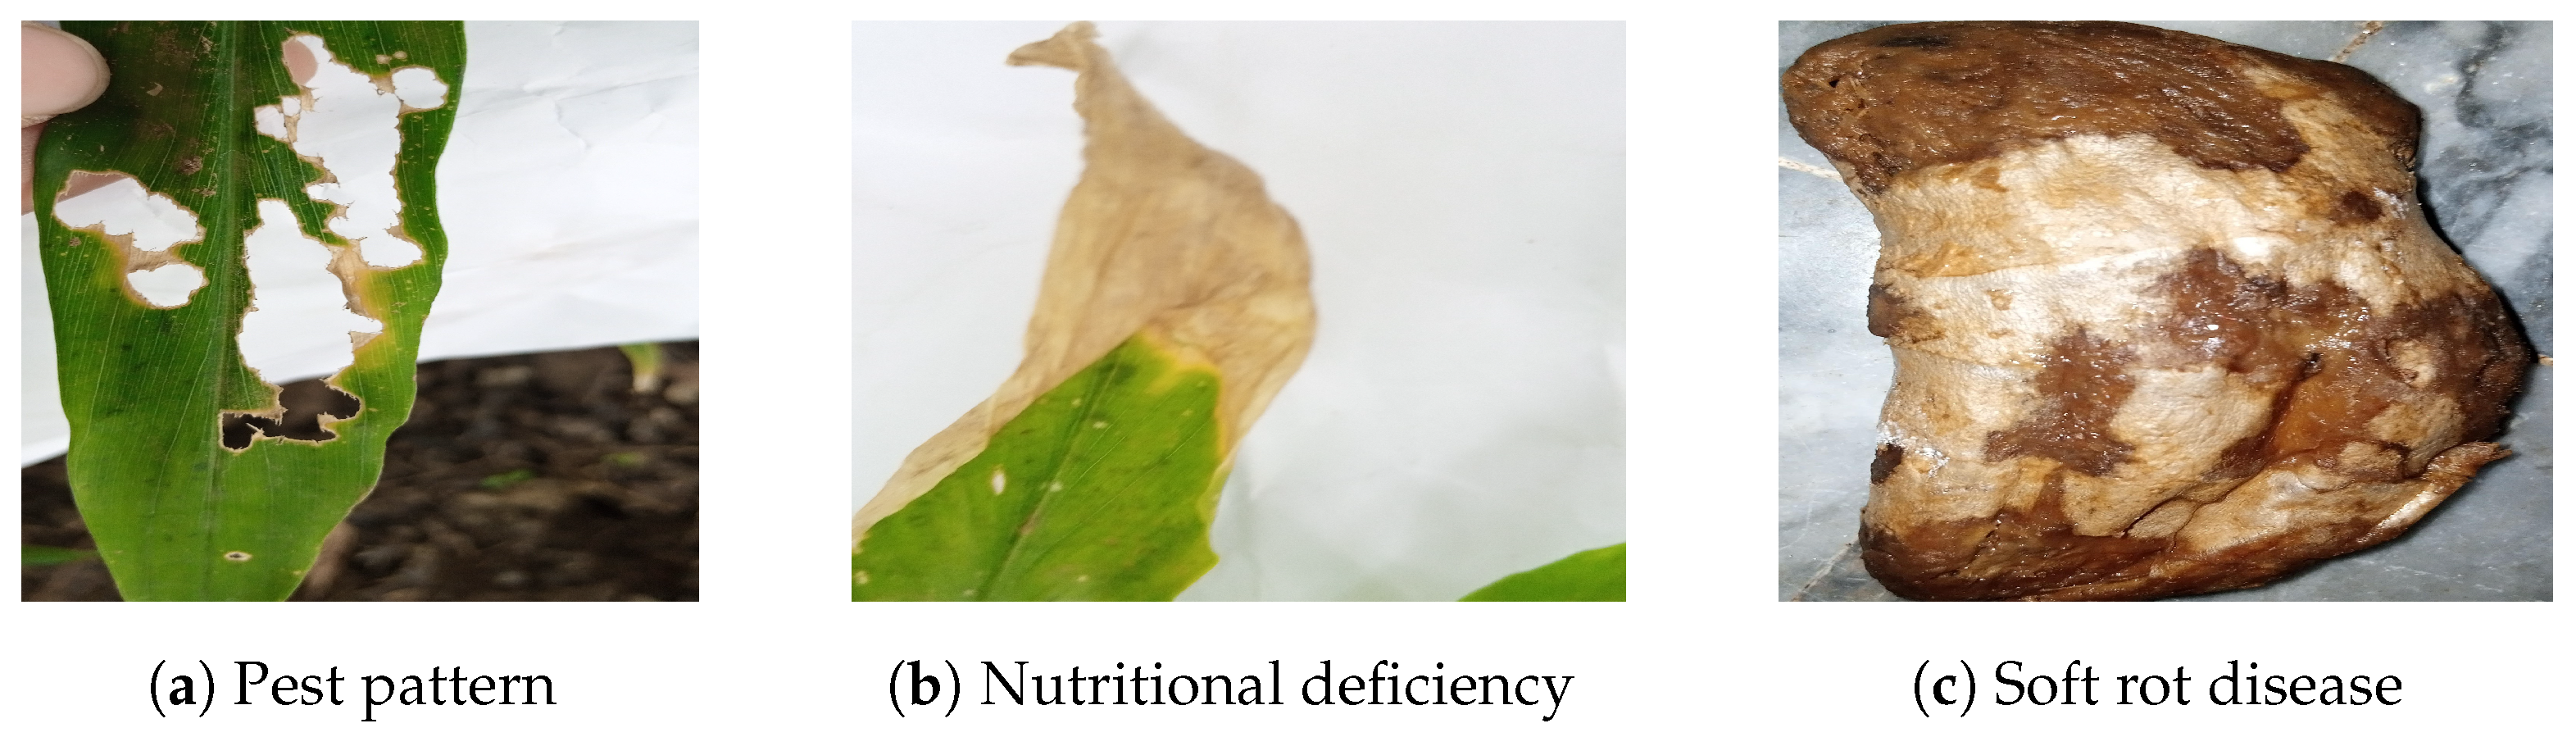
We took the photos 4–5 months after planting the plant (drill sowing at 50 cm). There were two small rows of ginger plant seeds from China and Thailand. The images were captured manually in the presence of pathologists using an Infinix Hot 9 mobile. The sample inputs for each category are depicted in Figure 4.
During image acquisition, the following rules were considered:
  • The camera lens is kept at a distance of 30–45 cm;
  • We only target the affected part of the leaf;
  • We capture the top and back view of the affected part of a leaf.

3.2. Data Preparation

Image pre-processing plays a vital role in ginger plant disorder classification and identification tasks because the images are different in size and contain noise and blur. The images of the ginger plant were taken from one device, but there may be variability in image size (width and height) due to the difference in the camera’s distance from the plant’s leaves. Deep learning requires homogeneous images for better training and testing results. Therefore, pre-processing is necessary to eliminate the noise and other external factors before passing the dataset into the model. All images in this study were resized by the CV2 library and saved in .jpg format. After resizing, all images were renamed using a Python script. Then, images were converted into a NumPy array using the NumPy Python library for normalization. These arrays of size 150 and 150 were used as the input given to the models used for feature extraction and classification.
In the experiments, a data augmentation process is applied to improve the volume and variants of the dataset. In this study, data are augmented by ImageDataGenerator, which performs rotation, flipping, horizontal shift, width shift, and zoom features to increase the dataset size.

3.3. Classification Approaches

Deep learning is widely used in machine vision and pattern recognition domains [30]. In contrast to traditional machine learning techniques, which require a largely manual process, deep learning-based methods can perform latent feature extraction autonomously [31]. This study implemented well-known deep learning models such as CNN and VGG-16 for ginger plant disorder classification.
A widely used model in deep learning is CNN, which has an edge in image identification due to the enormous model capacity and detailed information produced by CNN’s core structure properties. It is a complex network structure that performs convolution operations. Due to CNN’s better feature extraction abilities, CNN-based classification networks have been adopted and are now the most frequently used model in classifying plant diseases and pests. Input, hidden, and output are the three levels of the CNN model. A tumbling convolution layer and a pooling layer in the CNN feature extraction phase typically follow a full connection layer and a sigmoid classification structure [18].
We also implemented the VGG-16 model on ginger plant disease, nutritional deficiency, and pest attack detection. VGG-16 is a CNN architecture, which took place in the ILSVRC 2014, and has over 138 million parameters. The most significant feature of this architecture is that it never varies the convolutional layers, the padding and maximum pooling layers, which always use a 2 × 2 filter with stride 2, and the maximum pooling layer, which uses a 3 × 3 filter with stride 1. The VGG-16 architecture adheres to this design of convolution and maximum pooling layers. The last three fully connected (FC) layers are the last with sigmoid activation function and the first two with ReLu. The 416 × 416 image size is given to the input layer in this 16-layer design [30]. Recent research has demonstrated the efficiency of the VGG-16 network in identifying the images of affected crops [32]. In our experimental study, CNN models also demonstrated substantial results in classifying plant disease detection [33,34]. We selected these models for this experiment in prior investigations. We assessed and compared the model’s behavior to the acquired images in the field dataset of the ginger crop. We adopted the standard training strategy to train our dataset’s model layers. Weights were randomly initialized rather than using pre-trained weights in training the models. The training and validation datasets were trained by models using a 120-batch size with 42 epochs, whilst the “Adam” optimizer was trained with default values parameters using a 0.001 learning rate. The binary cross entropy function was deployed as the loss function throughout the training phase.
In addition, we also implemented a transfer learning approach (pre-trained network). A deep learning-based MobileNetV2 network was used in our images-based ginger crop dataset. Transfer learning is prevalent nowadays, and we used the MobileNetV2 model as a transfer learning approach. It was developed from MobileNetV1 [31], with the addition of inverse residuals and linear bottleneck modules. The basis of the MobileNet architecture was depth-wise convolution [31]. The model takes an input of 150 × 150 pixels image. The pre-trained weights were used in this study, and the other layers were frozen. The model provides the input layer, and the sigmoid function is utilized in the final/output layer. We deployed a pre-trained ImageNet model using the Keras library. The performance of the deployed model is evaluated and compared with the CNN and Vgg-16 models. Table 1 details the hyperparameters used during implementation.

3.4. Detection Approach

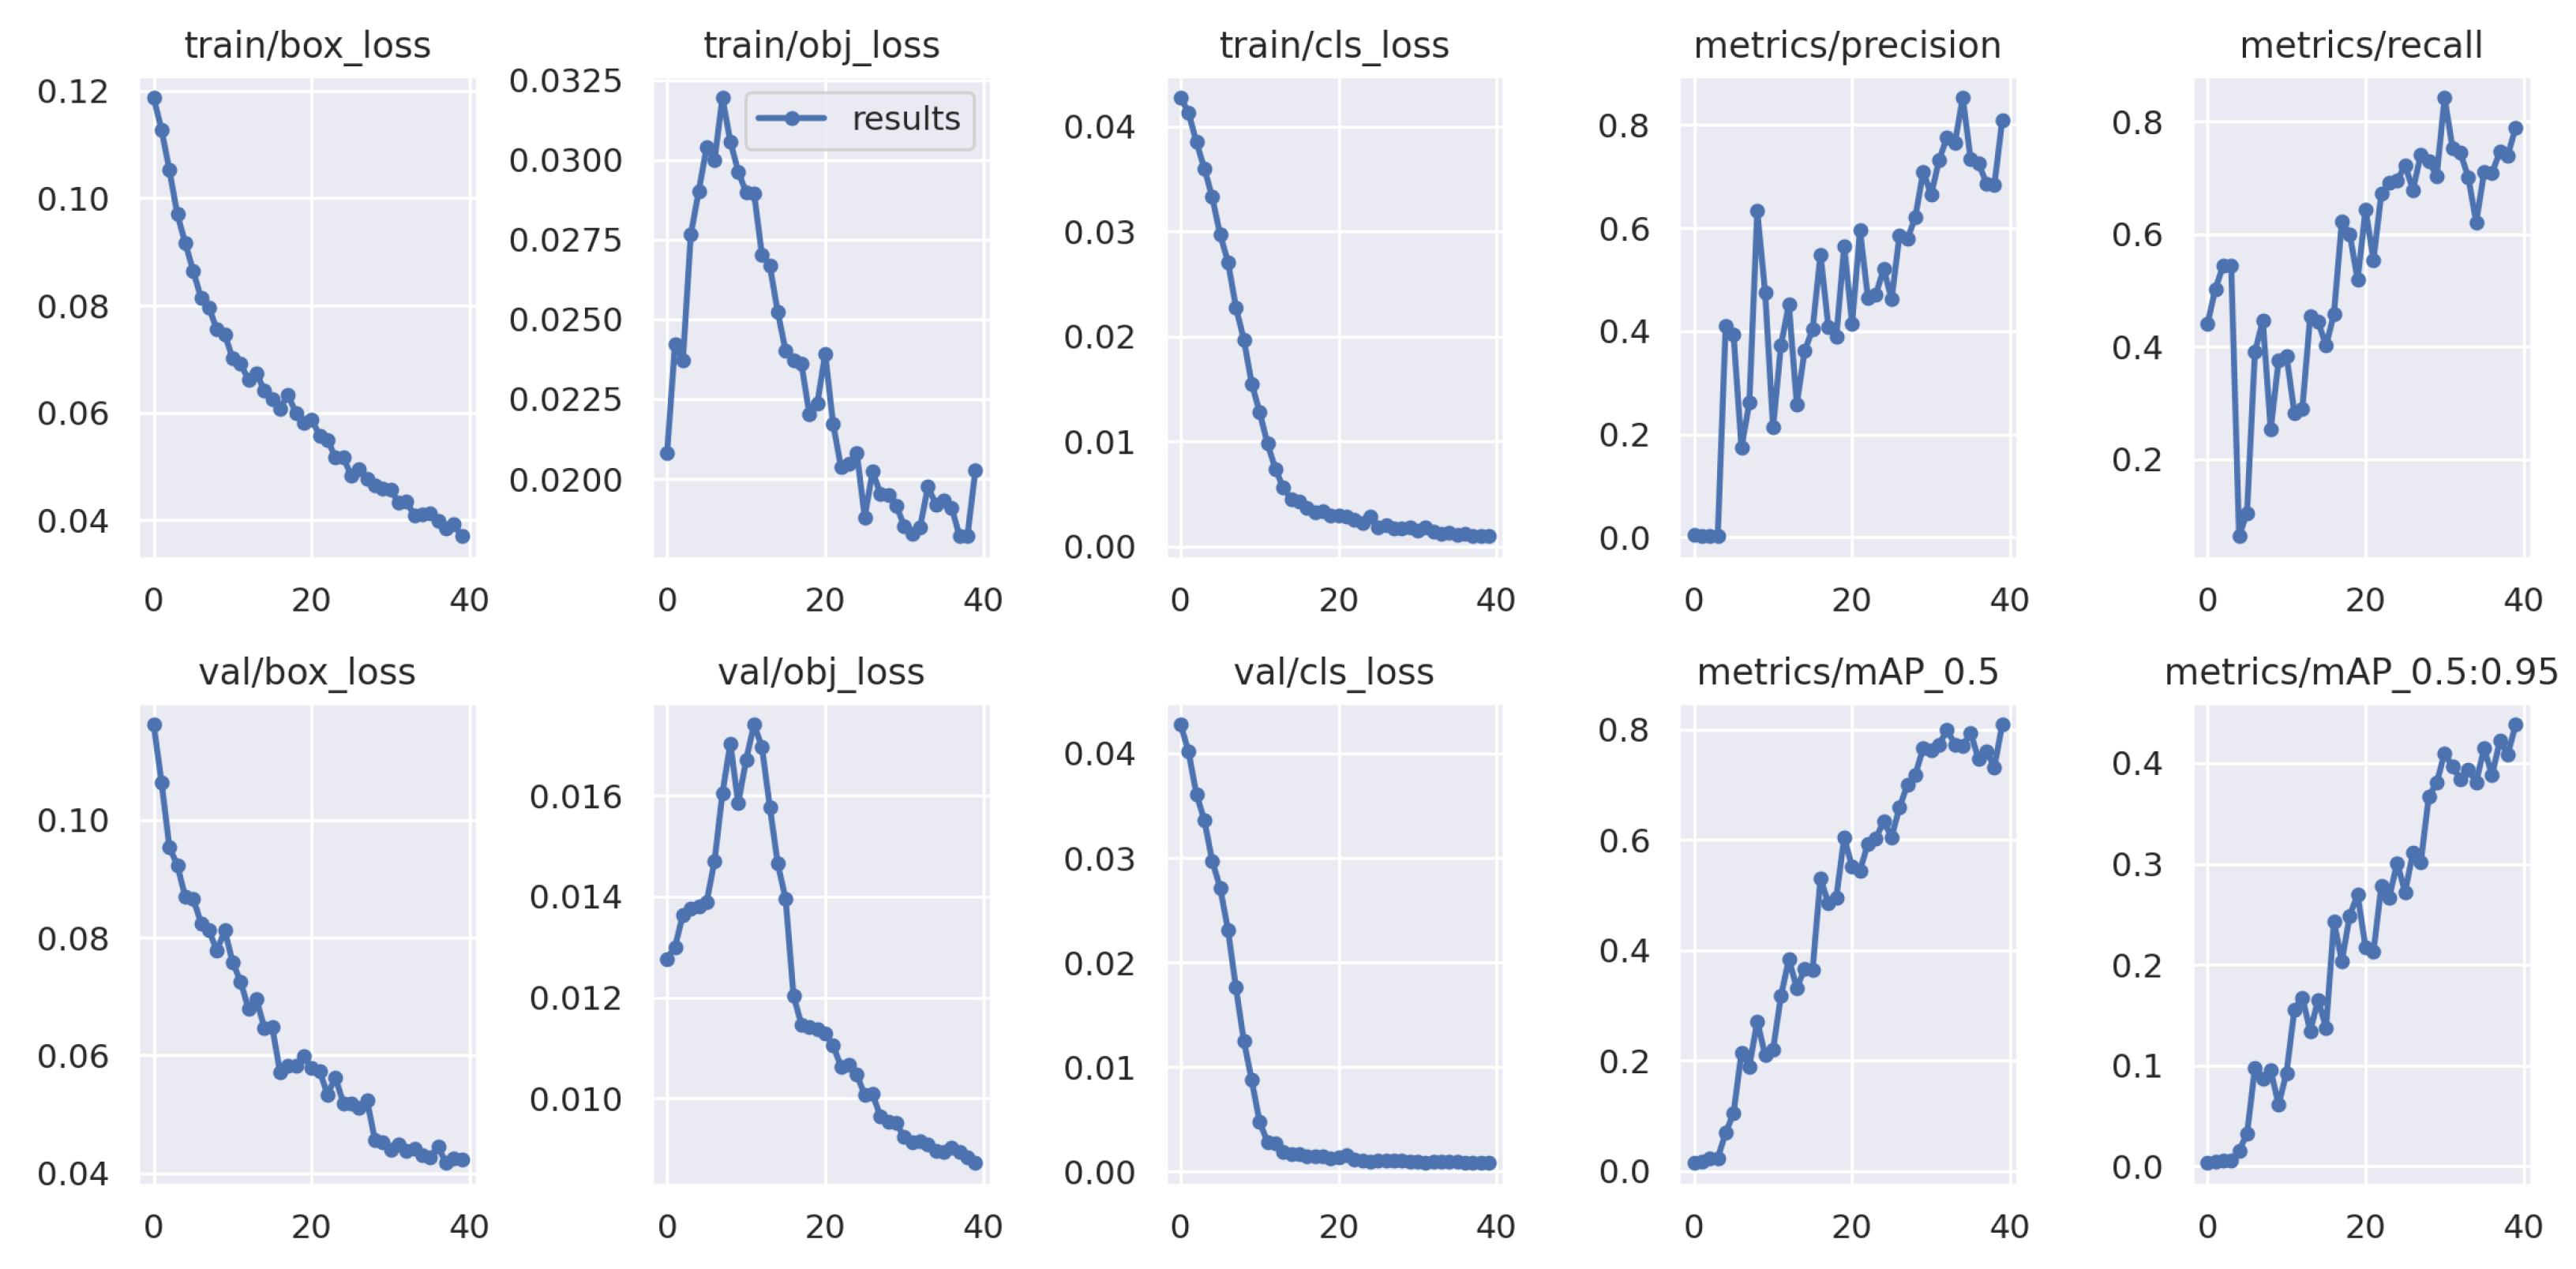
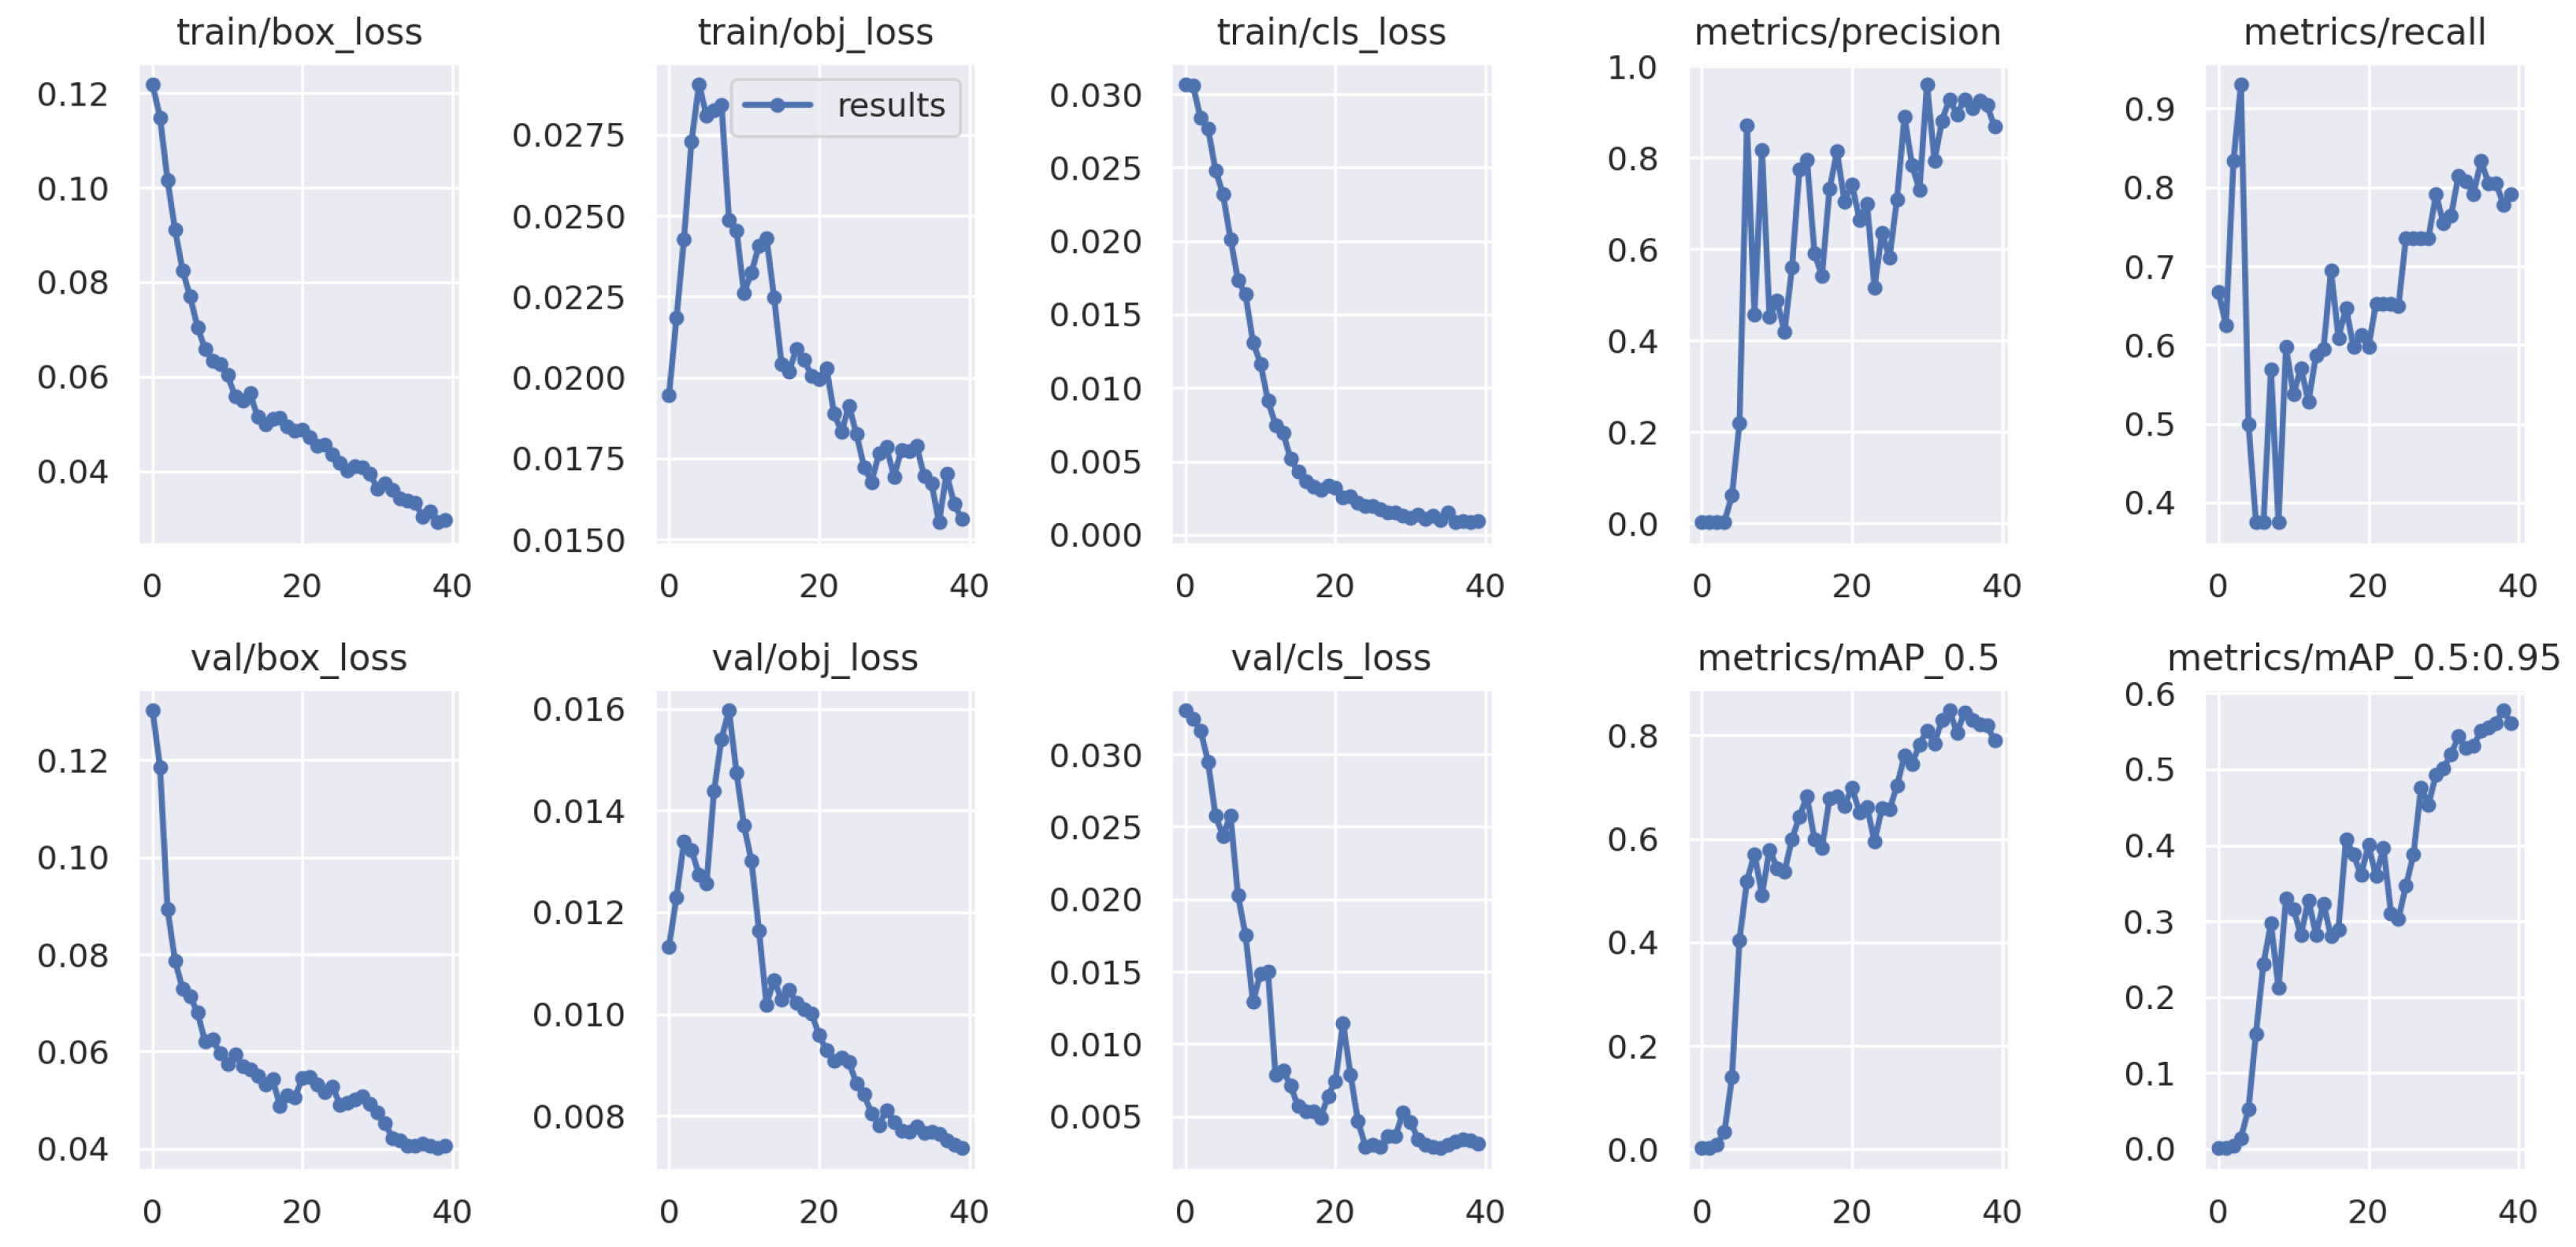
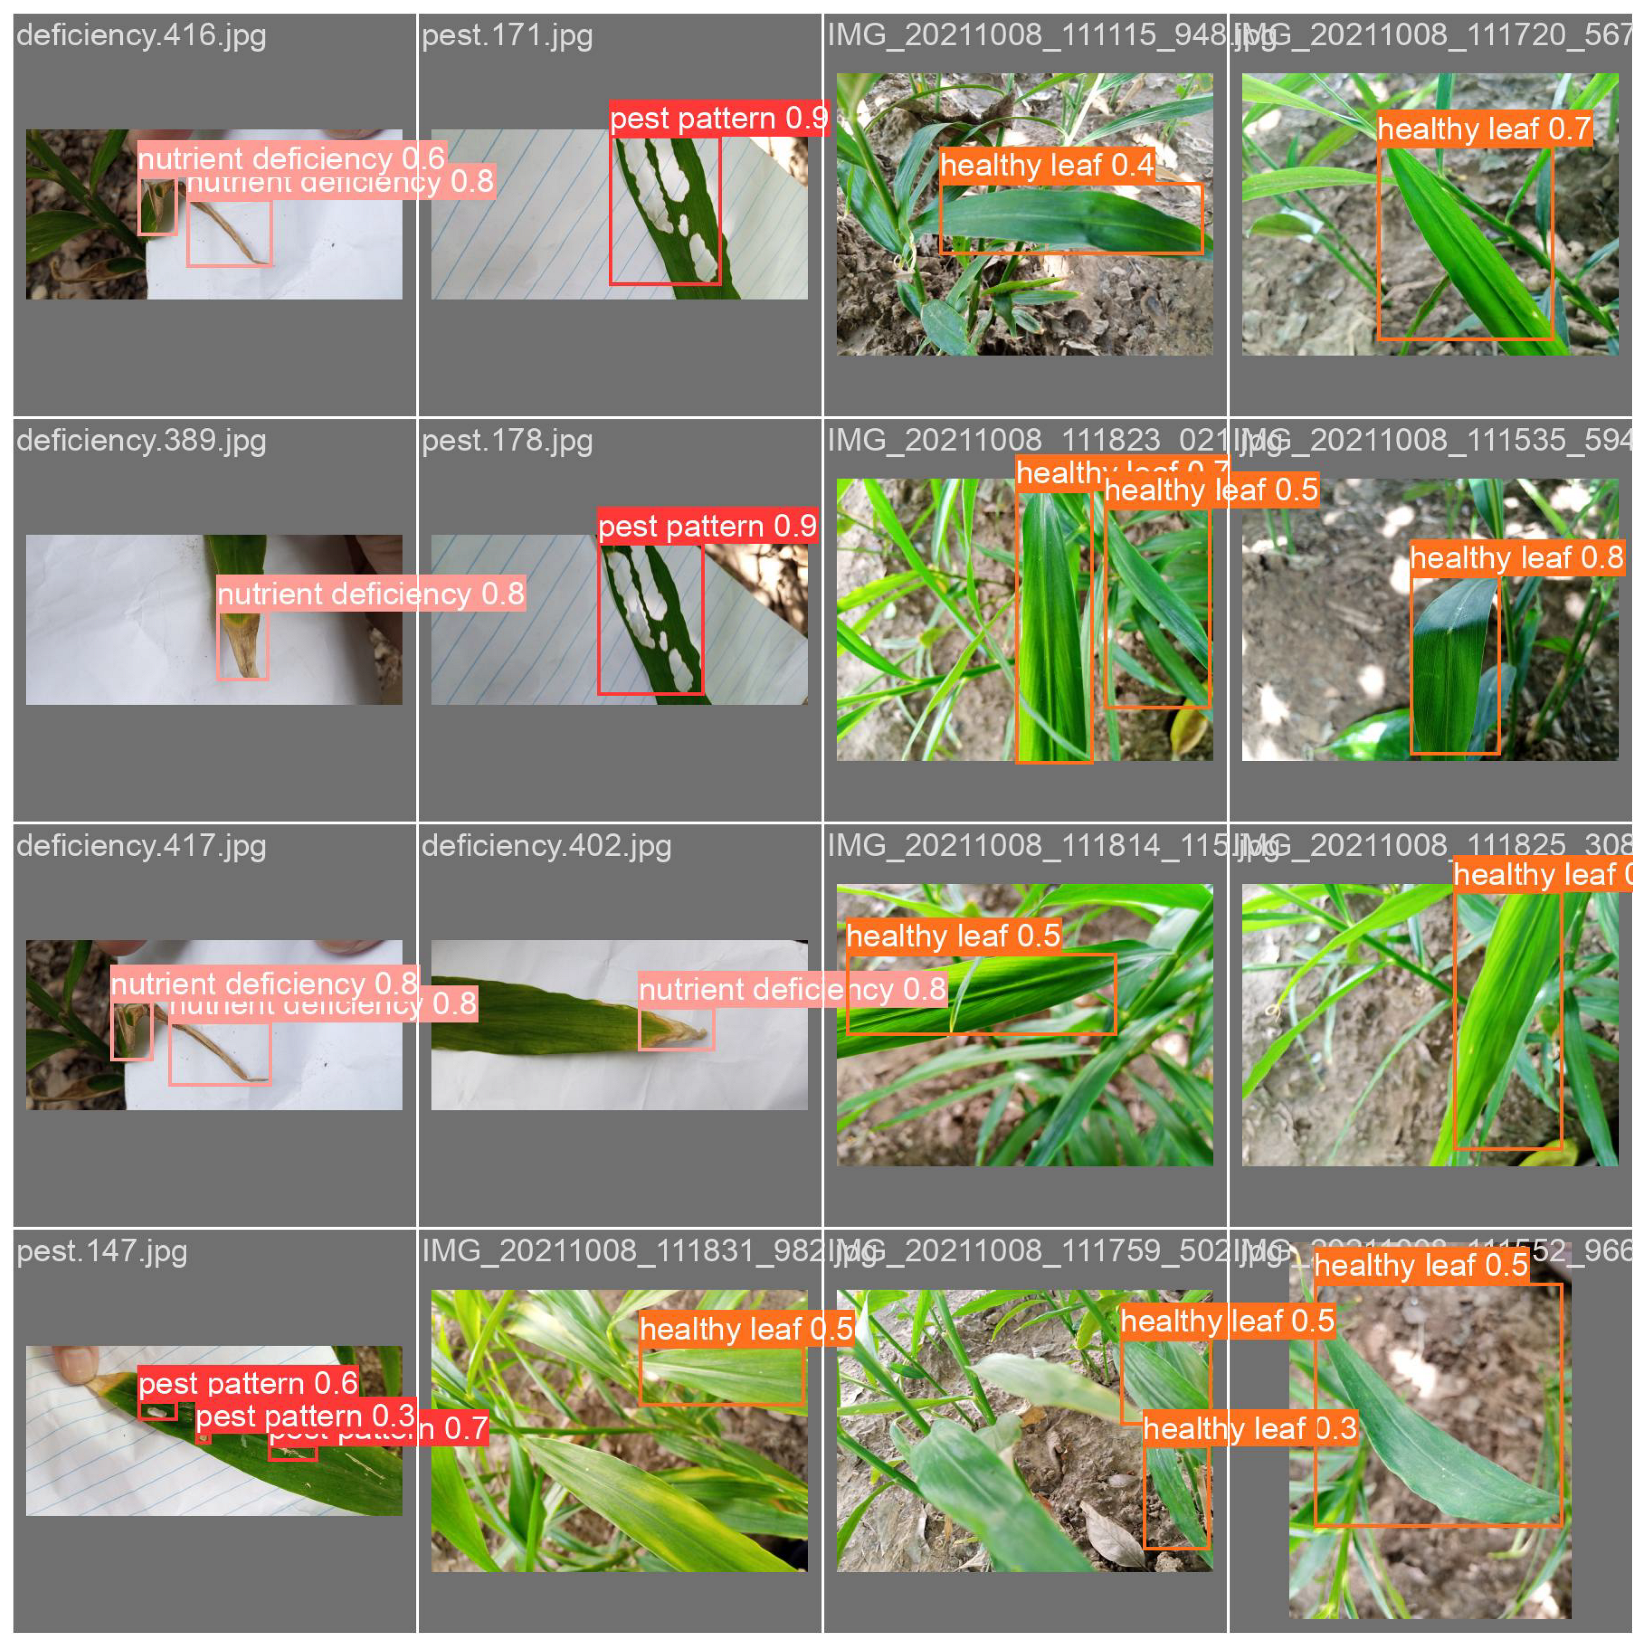
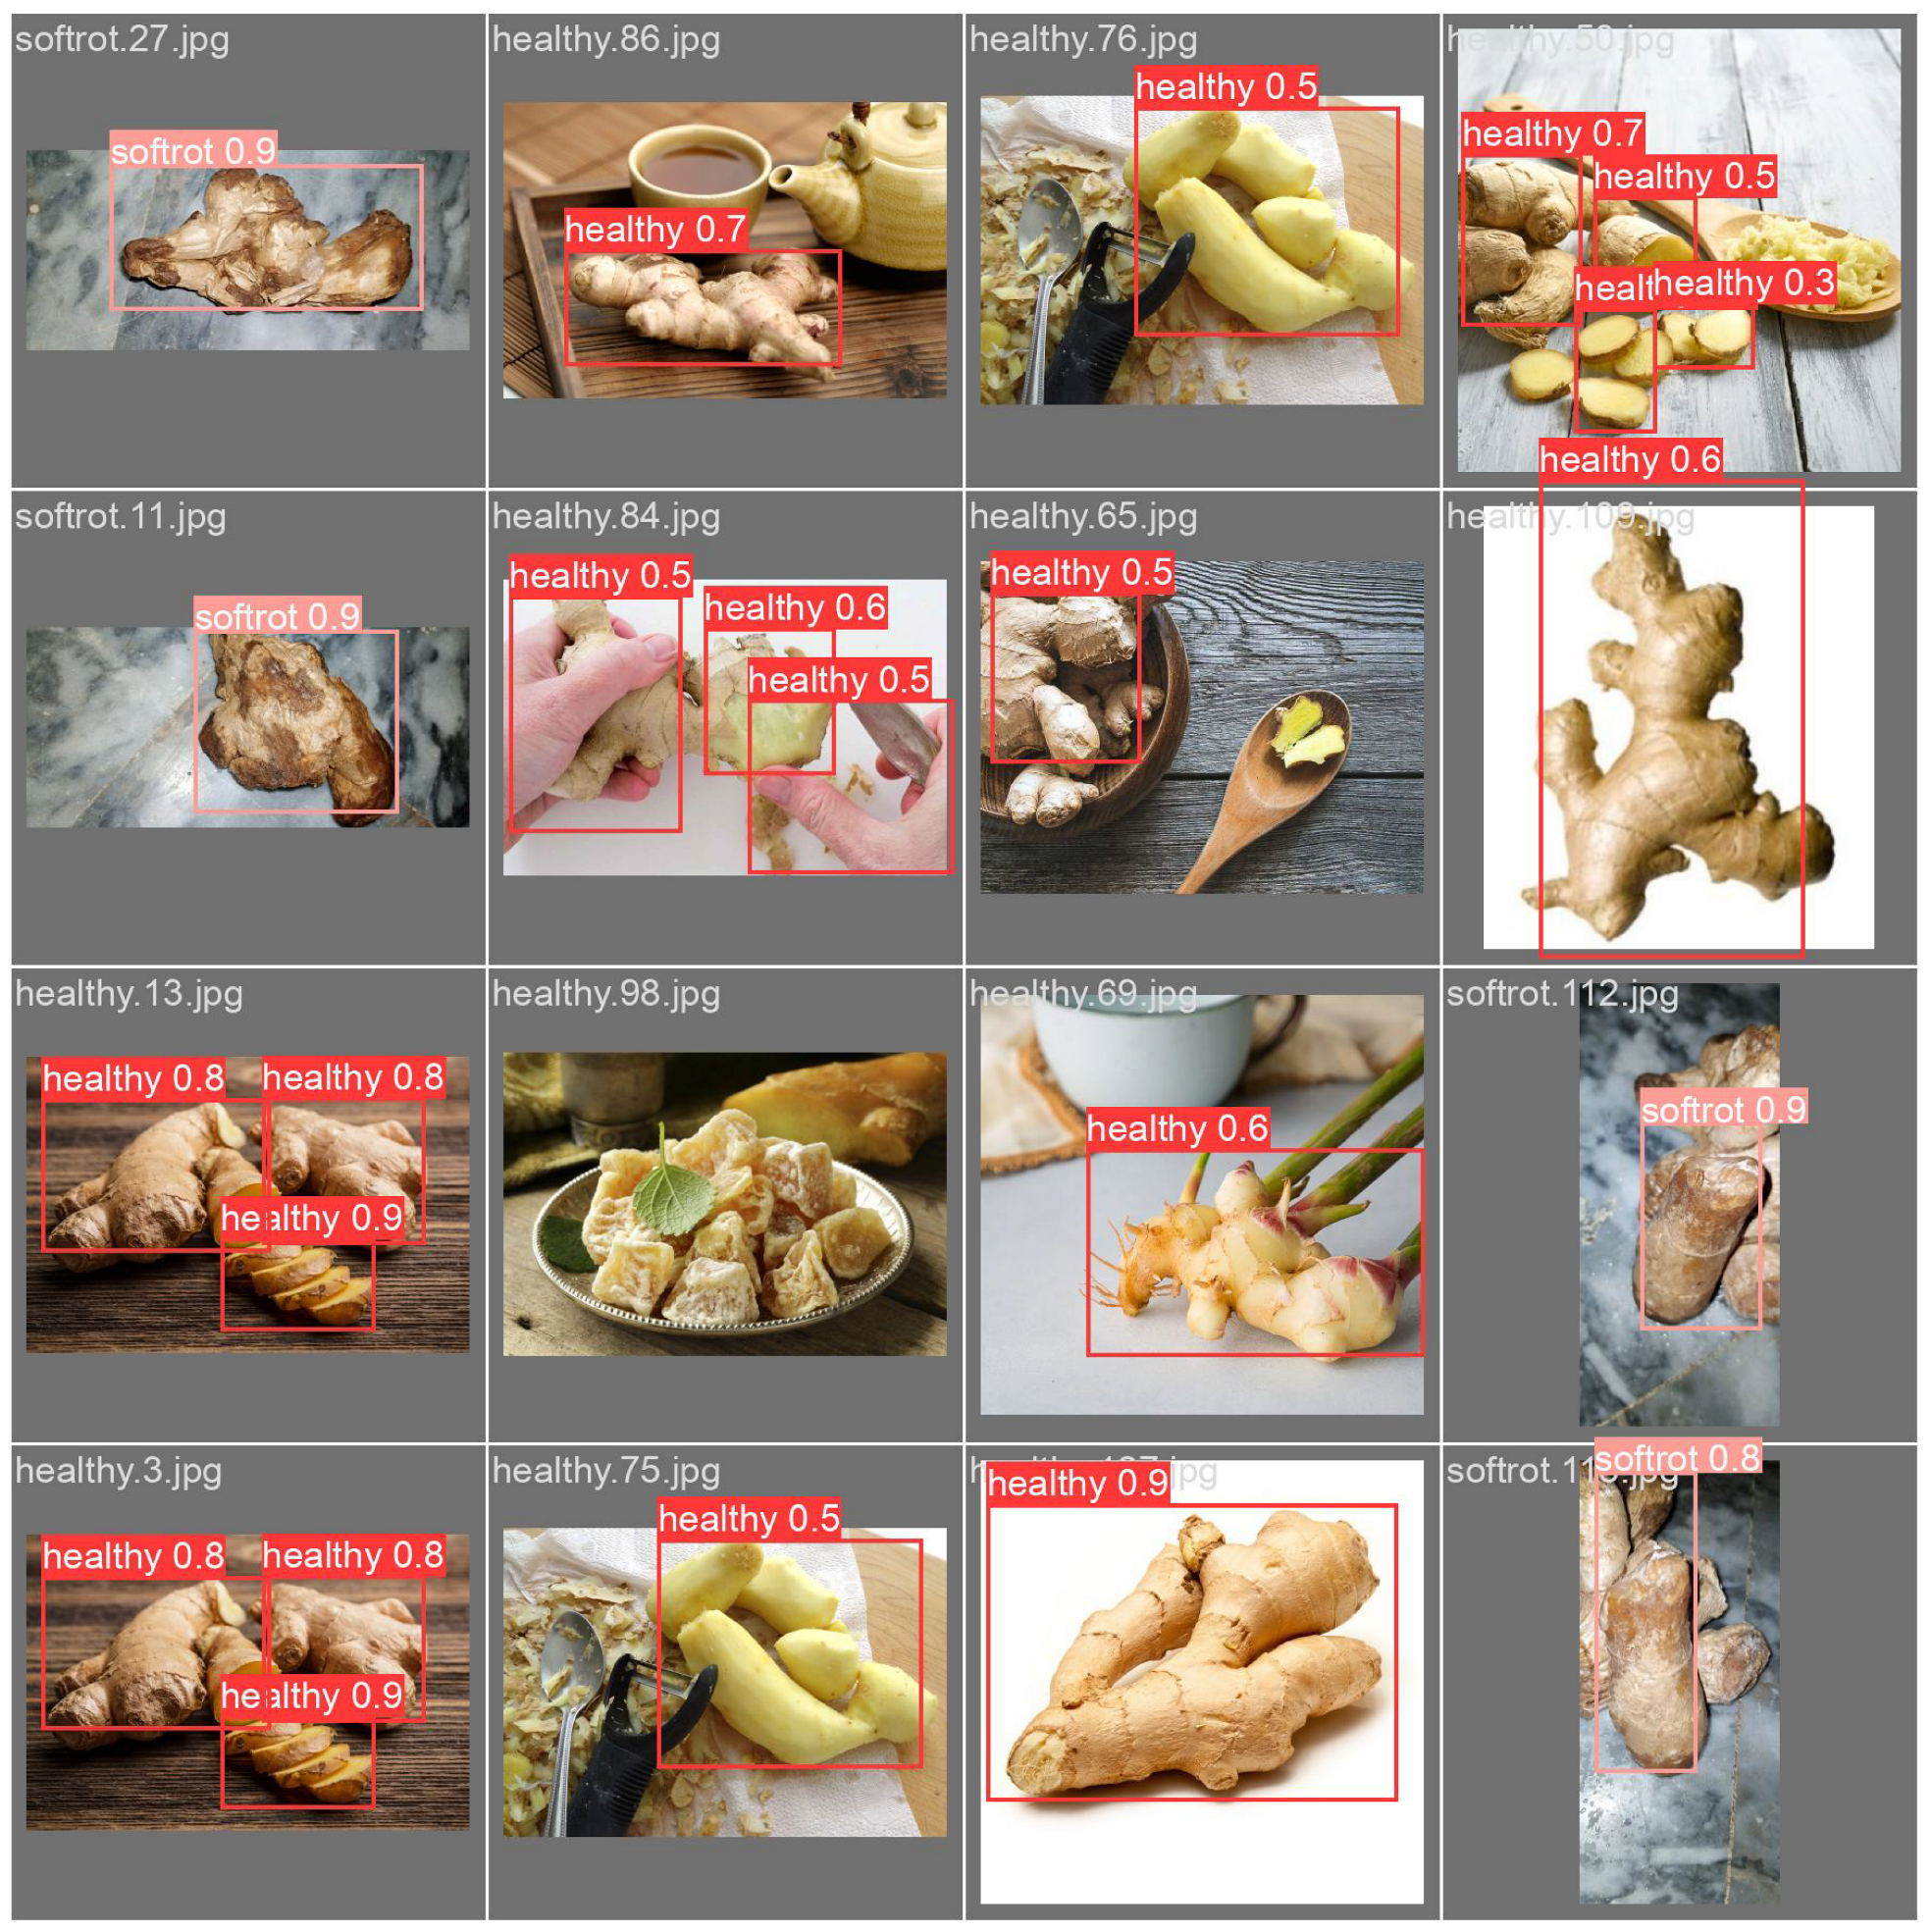
The deep learning models are also very useful in detecting and localizing the affected part of the input image. In this regard, various state-of-the-art models are available in the literature. For instance, in this work, we tested one of the commonly used detection models, YOLOv5, for the pest pattern, nutrient deficiency, and healthy leaf detection. Furthermore, the model is also being tested for detecting soft rot disease and healthy leaves using the seed images collected in the field.
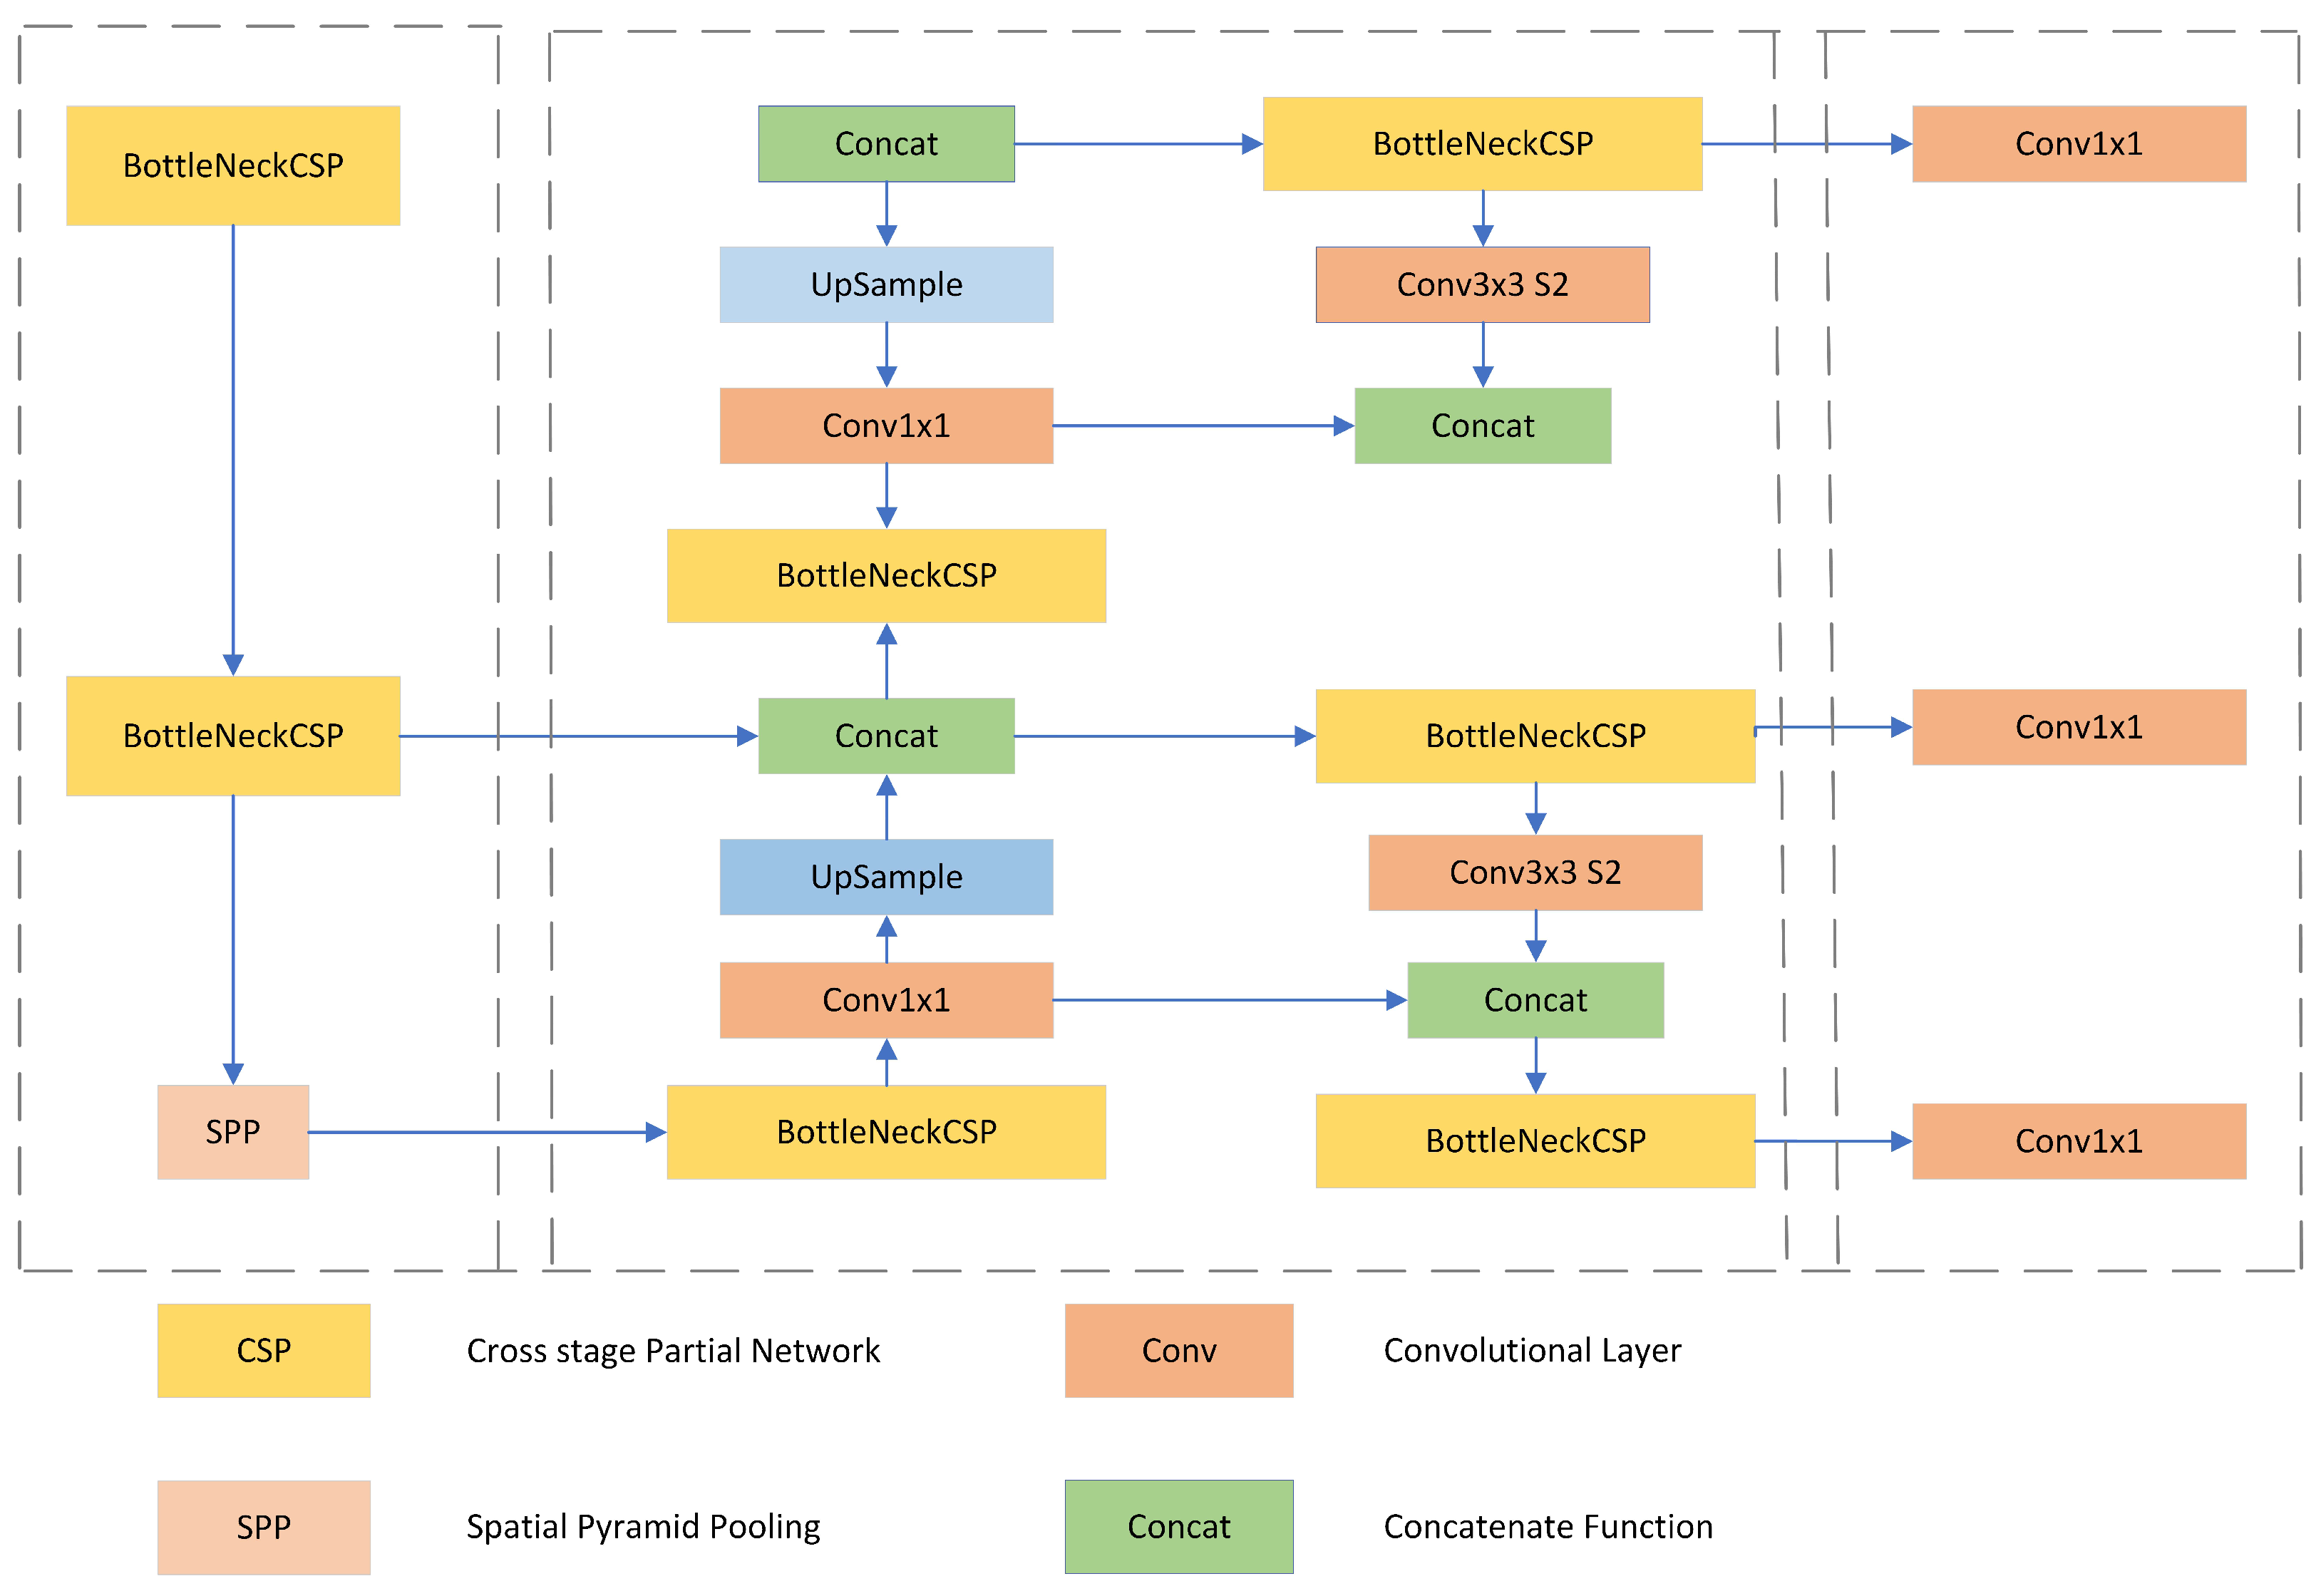
The working of the deployed model YOLOv5n is generally explained in the network architecture (see Figure 5). The model mainly consists of three components, e.g., the backbone, neck, and head. CSPDarknet [35] is used for feature extraction at the backbone. This is responsible for solving the issue related to the repetition of gradient information during the network training by fusing gradient changes with the feature map from start to finish. This resulted in reducing model the parameters while increasing the detection performance. In this part, two CSP structures (one residual and one non-residual) are used. In addition, spatial pyramid pooling (SPP) [36] is also used to solve anchor and feature map alignment issues. The next part of the neck layer is the combination of FPN and PANet [37]. This layer is responsible for feature fusion and performs multi-scale prediction across various layers. This helps in the enhancement of semantic representation and localization at different scales. Moreover, the CBL layers are further concatenated in the last step in order to extract the pixel information for mask formation. In the prediction part, the model uses a joint loss function using bounding box regression, classification, and confidence and is expressed as follows:
L = L c l c + L b o x + L c o n f
where L c l c is used to represent the classification error, L b o x represents the bounding box regression error, and L c o n f shows the confidence error.
The L c l c is computed as follows:
L c l c = i = 0 k 2 l i c = 1 C E ( p ^ i ( c ) , p i ( c ) )
where l i takes either 1 or 0 for class objects and p ^ and p i show predicted and true probability. The L b o x is computed as follows:
L b o x = 1 I o U ( A p , A g ) + A c A p A g + I A c
where it is also known as a generalized intersection over union (GIoU) localization loss. It is useful to locate a closed bounding box bounded by the predicted box A p and the true box A g . Here, A c , C, and I are used for the desired area, the overlapping area, and the real area, respectively. The intersection ratio of the estimated and real area in the image frame is represented by I o U . L c o n f is calculated as follows:
L c o n f = i = 0 k 2 j = 0 M I i , j E ( C ^ i , C i ) λ n o obj i = 0 k 2 j = 0 M I i , j ( 1 . I i , j ) E ( C ^ i , C i )
k 2 depicts image partitioning into k × k grids, yielding m candidate anchors. I i , j = 0 o r 1 denotes negative or positive samples. The confidence levels of the ith predicted bounding box and the true bounding box are represented by C i and C i , respectively. Moreover, E ( . ) indicates a binary cross-entropy loss and is defined by:
E ( X ^ i , X i ) = X ^ i l n ( X i ) + ( 1 X ^ i ) l n ( 1 X i )

3.5. Implementation

All the models were deployed under the framework “Keras”—a high-level Python interface for developing and deploying various neural network models [9]. A high-speed GPU was used for the experiments. Table 2 shows the system specification and configuration during the experiments.
After that, for detection purposes, the YOLOv5 model was deployed on a desktop platform where Ubuntu 20.04, Pytorch, and the YOLOv5 environment were deployed. Furthermore, Cuda 11.3 and Cudnn 8.2.0 are used in conjunction with a GeForce RTX 3080 Ti 32 GB on an Intel Core i7-12700K × 20. During the experiments, the “Adam optimizer” set the rounds of training for 40 epochs, a batch size of 64, and a learning rate of 0.004. In addition, the dataset was split into 90% training and 10% validation. In addition, we used a pre-trained model, the YOLOv5n version.
The adopted model is evaluated on our developed ginger dataset, which consists of leaf images of healthy, pest pattern, and nutrient deficiency, and the rhizome images of healthy and soft rot disease. We performed an experimental study on the ginger dataset in order to verify the applicability of the YOLOv5 models despite the previous classification models that are shown in our study.

4. Results and Discussion

4.1. Performance Metrics

First, the dataset was distributed among the training, validation, and testing to evaluate the adopted models’ performance. At the same time, 70% data were used for training and validation, and the remaining 30% were used for testing. Here, the entire dataset was segregated in Python script in the environment of Spyder. To assess the proposed system’s performance regarding the identification of ginger plant disorders, we used accuracy, confusion metrics, precision, recall, F1-score, computational cost, and the Mathews correlation coefficient (MCC).

4.2. Performance Analysis of the Models

The systematic evaluation accuracy for classifying the images into accurate classes is shown in Figure 6. An accuracy from approximately 90% (MobileNetV2 in pest patterns) to 99% (CNN in soft rot) was observed in ginger plant disorder detection. The proposed models’ testing accuracies were tested for the rise and fall in all ginger disorders’ pest patterns, nutrient deficiency, and soft rot. For training purposes, 70% of the dataset was employed, and the models attained the highest accuracies. It can be observed that VGG demonstrated the highest accuracy during the testing phase as compared to other models. The findings indicate that the proposed methods performed admirably despite the dataset’s varied and heterogeneous background. These results also demonstrated that a significant number of training images are needed for deep-learning models to identify and extract the fundamental characteristics of the studied data.
In Figure 7, Figure 8 and Figure 9, the confusion matrices are presented for the employed models using the 70–30 data configuration. Here, the diagonal values show that the number of accurately predicted results matched with the validation data. The values presented off-diagonal show the inaccurate prediction results on the validation data. The confusion matrix indicates that the proposed models can accurately predict the healthy and affected ginger disorder leaf images.
Moreover, the model performance is also evaluated in terms of precision, recall, and F1-score, as shown in Figure 10. The pest pattern results of the evaluation metrics are shown in Figure 10a. Here, it is demonstrated that CNN remains average in precision, recall, and F1-score, while the recall was not quite promising for the MobileNetV2 model. The deficiency of nutrients reveals that CNN and VGG-16 perform better than the MobileNetV2 model shown in Figure 10b. In Figure 10c, the deep learning models CNN and MobileNetV2 reported that the soft rot prediction in precision is outstanding. Recall and F1-score perform better in CNN and MobileNetV2. The VGG-16 model does not attain the best performance but remains average in detecting the soft rot disease of the ginger plant.
In Table 3, we present the MCC results against each employed algorithm. In Table 4, we investigate the computational cost of the proposed models in terms of trainable parameters and training time per epoch. It is clear from the Table that MobileNetV2 contains a smaller number of parameters in training the model, while CNN includes a larger number of parameters. Figure 11 shows that the models take a maximum training time per epoch for both the pest pattern and nutrient deficiency, while soft rot takes less time in terms of training time/epoch.
Extensible Markup Language (XML) and the Android SDK were used to develop the smartphone application. A smartphone was deployed to accomplish the task of the detection of disease, nutritional deficiency, and pest patterns in a real-time environment. This android application was combined with deep learning models to track the results of classification models. We converted the models of the type .h5 file into type .tflite file for converting and using in the android application.
The interface of the application is shown in Figure 12, where the user can select the detection problem and call the corresponding function by pressing the defined buttons. Once we click on the “Disease Detection”, “Pest Pattern”, or “Deficiency Nutrients” buttons, a new screen appears, as shown in Figure 12b,c. The figures depict the screen view from which farmers either take an image from the affected plant or post a stored image from their smartphone. We conducted an experimental analysis of our prototype implementation’s performance and classification accuracy. We integrated monitoring into the smartphone application to measure the processing time of different operations, such as taking an image, analyzing, and recognizing the image of an affected plant. Regarding the classification accuracy, we determined that our system performs well in a real-time environment, even when images are captured at various positions. Figure 13 demonstrates the interpretation outcomes of the ginger disease outcomes on the smartphone and efficiently identifies the healthy rhizome and the soft rot disease of the ginger crop as shown in Figure 13a and Figure 13b, respectively. Similarly, nutritional deficiency and pest patterns are accurately predicted in the real-time environment at higher confidence values, as depicted in Figure 14a, Figure 14b and Figure 14c, respectively. The developed application also recommends treatments to eliminate these three disorders. According to the overall performance of the study, the VGG-16 approach performs superior to the other two models in classifying ginger plant disorders, including pest pattern, deficiency nutrients, and soft rot disease. Moreover, the CNN and VGG-16 models generated remarkable outcomes in prediction accuracy and computational complexity. Consequently, based on the empirical study, the suggested VGG-16 model efficiently recognizes the images of ginger crop disorders.

4.3. Comparative Analysis with Previous Studies

In Table 5, we compared the effectiveness of our deep learning models and others in the literature for identifying ginger plant disorders. It is noted that in the other studies, the dataset was collected from the PlantVillage dataset, which was developed in a lab environment. Deep learning models were not well trained from these images because they are only effective in detection in the lab. However, our models with heterogeneous backgrounds achieve good results in classifying the images of ginger plant disorders.

Ablation Studies

We investigate the computational cost of deep learning models using the training time per epoch and batch size. Figure 15 shows that the training time per epoch decreases when the batch size increases. We presented the experimental results of the models in disease, pest pattern, and deficiency nutrients trained considering 16, 32, 64, and 128 batch sizes. As the batch sizes increase, the results show that the computational time is reduced and the accuracy increases. During model training, 128 batch sizes were employed with optimal outcomes. Testing accuracies at various model training epochs are shown in Figure 16, Figure 17 and Figure 18. Figure 16 exhibits that, as the batch size increases, the testing accuracy also increases. The VGG-16 model performs better in all batch sizes for pest pattern identification. The CNN and VGG-16 models show the best performances and remain smooth during nutrient deficiency identification, as shown in Figure 17. Similarly, in comparing the testing accuracies with batch sizes in soft rot disease identification, as shown in Figure 18, the MobileNetV2 model shows a lower performance compared to CNN and VGG-16 models. Hence, we conclude that the VGG-16 and CNN models performed better in ginger disorders than the MobileNetV2 model.

4.4. Performance Analysis of the Detection Model

In this section, we present the detection results obtained from the YOLOv5 deployment. After training and validation, the model’s loss function values were computed and plotted in Figure 19 and Figure 20. These curves indicate the bounding box detection loss, object detection loss, and classification loss. The bounding box detection loss is used to show whether the model is capable of identifying the center point of the target object and whether the target object is correctly covered by the predicted bounding box. Similarly, the object loss is used to show the model detection capability in ROI. The classification loss accurately indicates the model’s capability of detecting the class. The smaller values of these curves denote the good performance of the model. Thus, it is evident from the obtained results that the loss functions had a downward trend during the training and validation processes. At each iteration, the loss functions were rapidly changed while the model accuracy increased. After a few iterations, the loss functions slowly decreased towards the minima. Finally, the model stabilized and the best optimal training weights were computed.
The model’s visualization capability is derived in Figure 21 and Figure 22, where different ginger defects are shown. It is noticeable that the model accurately identified the correct classes of each input image. Here, the pest pattern, nutrient deficiency, and soft rot disease are detected and localized by the deployed YOLOv5 model.
The model is also statistically evaluated in terms of precision, recall, and mAP scores. The obtained results against different ginger defect classes are reported in Table 6. It can be noted from the Table that the algorithm has achieved a precision rate of 0.86743, 0.80899, and 0.80569, a recall rate of 0.79167, 0.79028, and 0.78028, and a mAP rate of 0.79004, 0.80931, and 0.80151 on soft rot, pest pattern, and nutrient deficiency, respectively. In short, the deployed YOLOv5 model outperformed the developed ginger dataset and showed its effectiveness and applicability for ginger defect detection.

5. Conclusions

This study captured a unique dataset containing the 4396 digital images of ginger plant disorders at the early and last stages with congested backgrounds, poor contrast, and under various illuminating conditions. We presented the design and deployment of different deep-learning classification and detection models to classify and detect ginger plant disorders. Furthermore, an android application for ginger plant disorders detection was developed. Various experiments were conducted to determine the functionality and classification performance of the system. The following conclusions were made based on the research conducted on the classification and detection of disorders on ginger plant leaves and their implementation in mobile applications:
  • This research was trained on classification models such as CNN, VGG-16, and MobileNetV2 using the digital images of ginger plant disorders such as soft rot disease, pest patterns, nutrient deficiency, and healthy leaves. The VGG-16 model exhibited the best results in classifying the ginger plant’s disorders. The performance metrics prove that the VGG-16 and CNN models showed the highest results.
  • The ginger plant disorders were also trained on the object detection model YOLOv5 and gained an average mAP50 value of 80%, 80%, and 79% for pest pattern, nutrient deficiency, and soft rot disease, respectively. The YOLOv5 model detects and localizes the affected part of the ginger from the digital image in a real-time environment.
  • A deep-learning-enabled mobile-based system for detecting ginger leaf disorders has several benefits over the status quo, including:
    • Higher accuracy: Deep learning models are trained on a significant amount of data, which results in improved accuracy in comparison to the traditional methods.
    • Cost-effectiveness: The application can be used on a smartphone and does not require any expensive equipment for the detection of ginger leaf disorders.
    • Rapid detection: The application facilitates the real-time detection of disorders, which allows farmers to take preventive measures in a timely manner before the spread of disease.
    • Accessibility: The smartphone application facilitates the system’s accessibility so that farmers in remote and underprivileged areas can easily recognize ginger plant disorders without any specialized training or dedicated equipment.
In the future, we aimed to increase the dataset by adding more classes. Moreover, detecting multiple diseases that affect leaves, stems, roots, and rhizomes with the localization of the affected area will be another potential future research direction.

Author Contributions

Conceptualization, N.Z. and H.W.; methodology, H.W., W.A. and A.H.; software, H.W.; validation, N.Z., H.W., A.H., J.B., S.u.I. and W.A.; formal analysis, N.Z., H.W., W.A., A.H. and J.B.; investigation, N.Z., H.W., A.H. and W.A.; resources, N.Z. and H.W.; data curation, N.Z. and H.W.; writing—original draft preparation, N.Z., H.W., W.A. and S.u.I.; writing—review and editing, N.Z., H.W., W.A., A.H., J.B. and S.u.I.; visualization, N.Z., H.W., W.A., A.H., S.u.I. and J.B. All authors have read and agreed to the submitted version of the manuscript.

Funding

This research received no external funding.

Data Availability Statement

The data presented in this study are available upon request from the authors.

Acknowledgments

The authors would like to thank Zainab Haroon and Abdul Basit from Arid Agriculture University, Rawalpindi, Pakistan, for their valuable discussions and assistance.

Conflicts of Interest

The authors declare no conflict of interest.

References

  1. Islam, M.A.; Shuvo, M.N.R.; Shamsojjaman, M.; Hasan, S.; Hossain, M.S.; Khatun, T. An automated convolutional neural network based approach for paddy leaf disease detection. Int. J. Adv. Comput. Sci. Appl. 2021, 12. [Google Scholar] [CrossRef]
  2. Afzaal, U.; Bhattarai, B.; Pandeya, Y.R.; Lee, J. An instance segmentation model for strawberry diseases based on mask R-CNN. Sensors 2021, 21, 6565. [Google Scholar] [CrossRef]
  3. Alibabaei, K.; Assunção, E.; Gaspar, P.D.; Soares, V.N.; Caldeira, J.M. Real-Time Detection of Vine Trunk for Robot Localization Using Deep Learning Models Developed for Edge TPU Devices. Future Internet 2022, 14, 199. [Google Scholar] [CrossRef]
  4. Debauche, O.; Mahmoudi, S.; Manneback, P.; Lebeau, F. Cloud and distributed architectures for data management in agriculture 4.0: Review and future trends. J. King Saud-Univ.-Comput. Inf. Sci. 2021, 34, 7494–7514. [Google Scholar] [CrossRef]
  5. Ganguly, S.; Bhowal, P.; Oliva, D.; Sarkar, R. BLeafNet: A Bonferroni mean operator based fusion of CNN models for plant identification using leaf image classification. Ecol. Inform. 2022, 69, 101585. [Google Scholar] [CrossRef]
  6. Zhang, X.; Han, L.; Dong, Y.; Shi, Y.; Huang, W.; Han, L.; González-Moreno, P.; Ma, H.; Ye, H.; Sobeih, T. A deep learning-based approach for automated yellow rust disease detection from high-resolution hyperspectral UAV images. Remote Sens. 2019, 11, 1554. [Google Scholar] [CrossRef] [Green Version]
  7. Nanehkaran, Y.; Zhang, D.; Chen, J.; Tian, Y.; Al-Nabhan, N. Recognition of plant leaf diseases based on computer vision. J. Ambient Intell. Humaniz. Comput. 2020, 1–18. [Google Scholar] [CrossRef]
  8. Magalhães, S.A.; Castro, L.; Moreira, G.; Dos Santos, F.N.; Cunha, M.; Dias, J.; Moreira, A.P. Evaluating the single-shot multibox detector and YOLO deep learning models for the detection of tomatoes in a greenhouse. Sensors 2021, 21, 3569. [Google Scholar] [CrossRef]
  9. Manzo, M.; Pellino, S. Fighting together against the pandemic: Learning multiple models on tomography images for COVID-19 diagnosis. AI 2021, 2, 261–273. [Google Scholar] [CrossRef]
  10. Ramcharan, A.; McCloskey, P.; Baranowski, K.; Mbilinyi, N.; Mrisho, L.; Ndalahwa, M.; Legg, J.; Hughes, D.P. A mobile-based deep learning model for cassava disease diagnosis. Front. Plant Sci. 2019, 10, 272. [Google Scholar] [CrossRef] [Green Version]
  11. Mohanty, S.P.; Hughes, D.P.; Salathé, M. Using deep learning for image-based plant disease detection. Front. Plant Sci. 2016, 7, 1419. [Google Scholar] [CrossRef] [Green Version]
  12. Barbedo, J.G.A. Plant disease identification from individual lesions and spots using deep learning. Biosyst. Eng. 2019, 180, 96–107. [Google Scholar] [CrossRef]
  13. Ebrahimi, M.; Khoshtaghaza, M.H.; Minaei, S.; Jamshidi, B. Vision-based pest detection based on SVM classification method. Comput. Electron. Agric. 2017, 137, 52–58. [Google Scholar] [CrossRef]
  14. de Oliveira Aparecido, L.E.; de Souza Rolim, G.; da Silva Cabral De Moraes, J.; Costa, C.T.S.; de Souza, P.S. Machine learning algorithms for forecasting the incidence of Coffea arabica pests and diseases. Int. J. Biometeorol. 2020, 64, 671–688. [Google Scholar] [CrossRef]
  15. Nanni, L.; Maguolo, G.; Pancino, F. Insect pest image detection and recognition based on bio-inspired methods. Ecol. Inform. 2020, 57, 101089. [Google Scholar] [CrossRef] [Green Version]
  16. Haque, M.A.; Marwaha, S.; Arora, A.; Paul, R.K.; Hooda, K.S.; Sharma, A.; Grover, M. Image-Based Identification of Maydis Leaf Blight Disease of Maize (Zea Mays) Using Deep Learning. 2021. Available online: http://krishi.icar.gov.in/jspui/handle/123456789/66208 (accessed on 24 January 2023).
  17. Han, K.A.M.; Watchareeruetai, U. Classification of nutrient deficiency in black gram using deep convolutional neural networks. In Proceedings of the 2019 16th International Joint Conference on Computer Science and Software Engineering (JCSSE), Chonburi, Thailand, 10–12 July 2019; pp. 277–282. [Google Scholar]
  18. Tran, T.T.; Choi, J.W.; Le, T.T.H.; Kim, J.W. A comparative study of deep CNN in forecasting and classifying the macronutrient deficiencies on development of tomato plant. Appl. Sci. 2019, 9, 1601. [Google Scholar] [CrossRef] [Green Version]
  19. Waheed, H.; Zafar, N.; Akram, W.; Manzoor, A.; Gani, A.; Islam, S.U. Deep Learning Based Disease, Pest Pattern and Nutritional Deficiency Detection System for “Zingiberaceae” Crop. Agriculture 2022, 12, 742. [Google Scholar] [CrossRef]
  20. Lu, J.; Hu, J.; Zhao, G.; Mei, F.; Zhang, C. An in-field automatic wheat disease diagnosis system. Comput. Electron. Agric. 2017, 142, 369–379. [Google Scholar] [CrossRef] [Green Version]
  21. Iqbal, Z.; Khan, M.A.; Sharif, M.; Shah, J.H.; ur Rehman, M.H.; Javed, K. An automated detection and classification of citrus plant diseases using image processing techniques: A review. Comput. Electron. Agric. 2018, 153, 12–32. [Google Scholar] [CrossRef]
  22. Kaur, S.; Pandey, S.; Goel, S. Plants disease identification and classification through leaf images: A survey. Arch. Comput. Methods Eng. 2019, 26, 507–530. [Google Scholar] [CrossRef]
  23. Lin, Z.; Mu, S.; Huang, F.; Mateen, K.A.; Wang, M.; Gao, W.; Jia, J. A unified matrix-based convolutional neural network for fine-grained image classification of wheat leaf diseases. IEEE Access 2019, 7, 11570–11590. [Google Scholar] [CrossRef]
  24. Qiu, R.; Yang, C.; Moghimi, A.; Zhang, M.; Steffenson, B.J.; Hirsch, C.D. Detection of fusarium head blight in wheat using a deep neural network and color imaging. Remote Sens. 2019, 11, 2658. [Google Scholar] [CrossRef] [Green Version]
  25. Boulent, J.; Foucher, S.; Théau, J.; St-Charles, P.L. Convolutional neural networks for the automatic identification of plant diseases. Front. Plant Sci. 2019, 10, 941. [Google Scholar] [CrossRef] [Green Version]
  26. Geetharamani, G.; Pandian, A. Identification of plant leaf diseases using a nine-layer deep convolutional neural network. Comput. Electr. Eng. 2019, 76, 323–338. [Google Scholar]
  27. Mahalakshmi, S.D.; Vijayalakshmi, K. Agro Suraksha: Pest and disease detection for corn field using image analysis. J. Ambient Intell. Humaniz. Comput. 2021, 12, 7375–7389. [Google Scholar] [CrossRef]
  28. Li, D.; Wang, R.; Xie, C.; Liu, L.; Zhang, J.; Li, R.; Wang, F.; Zhou, M.; Liu, W. A recognition method for rice plant diseases and pests video detection based on deep convolutional neural network. Sensors 2020, 20, 578. [Google Scholar] [CrossRef] [Green Version]
  29. Pesitm, S.; Madhavi, M. Detection of Ginger Plant Leaf Diseases by Image Processing & Medication through Controlled Irrigation. J. Xi’an Univ. Archit. Technol. 2020, 12, 1318–1322. [Google Scholar]
  30. Russakovsky, O.; Deng, J.; Su, H.; Krause, J.; Satheesh, S.; Ma, S.; Huang, Z.; Karpathy, A.; Khosla, A.; Bernstein, M.; et al. Imagenet large scale visual recognition challenge. Int. J. Comput. Vis. 2015, 115, 211–252. [Google Scholar] [CrossRef] [Green Version]
  31. Tugrul, B.; Elfatimi, E.; Eryigit, R. Convolutional Neural Networks in Detection of Plant Leaf Diseases: A Review. Agriculture 2022, 12, 1192. [Google Scholar] [CrossRef]
  32. Johannes, A.; Picon, A.; Alvarez-Gila, A.; Echazarra, J.; Rodriguez-Vaamonde, S.; Navajas, A.D.; Ortiz-Barredo, A. Automatic plant disease diagnosis using mobile capture devices, applied on a wheat use case. Comput. Electron. Agric. 2017, 138, 200–209. [Google Scholar] [CrossRef]
  33. Lu, Y.; Yi, S.; Zeng, N.; Liu, Y.; Zhang, Y. Identification of rice diseases using deep convolutional neural networks. Neurocomputing 2017, 267, 378–384. [Google Scholar] [CrossRef]
  34. Rahman, C.R.; Arko, P.S.; Ali, M.E.; Khan, M.A.I.; Apon, S.H.; Nowrin, F.; Wasif, A. Identification and recognition of rice diseases and pests using convolutional neural networks. Biosyst. Eng. 2020, 194, 112–120. [Google Scholar] [CrossRef] [Green Version]
  35. Wang, C.Y.; Liao, H.Y.M.; Wu, Y.H.; Chen, P.Y.; Hsieh, J.W.; Yeh, I.H. CSPNet: A new backbone that can enhance learning capability of CNN. In Proceedings of the IEEE/CVF Conference on Computer Vision and Pattern Recognition Workshops, Seattle, WA, USA, 14–19 June 2020; pp. 390–391. [Google Scholar]
  36. Li, J.; Qiao, Y.; Liu, S.; Zhang, J.; Yang, Z.; Wang, M. An improved YOLOv5-based vegetable disease detection method. Comput. Electron. Agric. 2022, 202, 107345. [Google Scholar] [CrossRef]
  37. Wang, H.; Shang, S.; Wang, D.; He, X.; Feng, K.; Zhu, H. Plant disease detection and classification method based on the optimized lightweight YOLOv5 model. Agriculture 2022, 12, 931. [Google Scholar] [CrossRef]
  38. Lv, M.; Zhou, G.; He, M.; Chen, A.; Zhang, W.; Hu, Y. Maize leaf disease identification based on feature enhancement and DMS-robust alexnet. IEEE Access 2020, 8, 57952–57966. [Google Scholar] [CrossRef]
  39. Chen, J.; Wang, W.; Zhang, D.; Zeb, A.; Nanehkaran, Y.A. Attention embedded lightweight network for maize disease recognition. Plant Pathol. 2021, 70, 630–642. [Google Scholar] [CrossRef]
  40. Misra, T.; Arora, A.; Marwaha, S.; Chinnusamy, V.; Rao, A.R.; Jain, R.; Sahoo, R.N.; Ray, M.; Kumar, S.; Raju, D.; et al. SpikeSegNet-a deep learning approach utilizing encoder-decoder network with hourglass for spike segmentation and counting in wheat plant from visual imaging. Plant Methods 2020, 16, 1–20. [Google Scholar] [CrossRef] [Green Version]
  41. Kundu, N.; Rani, G.; Dhaka, V.S.; Gupta, K.; Nayak, S.C.; Verma, S.; Ijaz, M.F.; Woźniak, M. IoT and interpretable machine learning based framework for disease prediction in pearl millet. Sensors 2021, 21, 5386. [Google Scholar] [CrossRef]
Figure 1. A general framework of the work: the dataset is collected and pre-processed. Then, deep learning models are used for training and testing and further integrated into an android application to provide a real-time ginger disorder identification mechanism.
Futureinternet 15 00086 g001
Figure 2. The study area of the collected dataset location.
Futureinternet 15 00086 g002
Figure 3. Distribution of the dataset. (a) Data distribution for pest patterns. (b) Data distribution for nutritional deficiency. (c) Data distribution for soft rot disease.
Futureinternet 15 00086 g003
Figure 4. Sample input data of ginger plant disorders.
Futureinternet 15 00086 g004
Figure 5. The architectural diagram of the YOLOv5 model.
Futureinternet 15 00086 g005
Figure 6. Performance of the proposed models in terms of accuracy.
Futureinternet 15 00086 g006
Figure 7. Confusion matrices on a pest pattern based on 546 validation images.
Futureinternet 15 00086 g007
Figure 8. Confusion matrices on the nutrient deficiency based on 432 validation images.
Futureinternet 15 00086 g008
Figure 9. Confusion matrices on soft rot disease based on 77 validation images.
Futureinternet 15 00086 g009
Figure 10. Overall average precision, recall, and F1-score.
Futureinternet 15 00086 g010
Figure 11. Computational cost on different datasets.
Futureinternet 15 00086 g011
Figure 12. Android application user’s pages.
Futureinternet 15 00086 g012
Figure 13. Example 1: Android application results.
Futureinternet 15 00086 g013
Figure 14. Example 2: Android application results.
Futureinternet 15 00086 g014
Figure 15. Computational cost vs. batch size.
Futureinternet 15 00086 g015
Figure 16. Testing accuracies of the pest pattern with variant batch sizes.
Futureinternet 15 00086 g016
Figure 17. Testing accuracies of the deficiency nutrients with variant batch sizes.
Futureinternet 15 00086 g017
Figure 18. Testing accuracies of the soft rot with variant batch sizes.
Futureinternet 15 00086 g018
Figure 19. Model evaluation during training on pest pattern and nutrient deficiency classes.
Futureinternet 15 00086 g019
Figure 20. Model evaluation during training on soft rot disease class.
Futureinternet 15 00086 g020
Figure 21. Set 1 of visual examples showcasing the qualitative evaluation of the YOLOv5 model on ginger dataset.
Futureinternet 15 00086 g021
Figure 22. Set 2 of visual examples showcasing the qualitative evaluation of the YOLOv5 model on the ginger dataset.
Futureinternet 15 00086 g022
Table 1. Training hyper parameters for CNN, MobileNetV2 and VGG-16.
DatasetHealthy and effected class for each pest pattern, nutrient deficiency, and soft rot disease with the ratio of 70% and 30% for training and testing, respectively
Pre-processingData renaming and resizing to 150 × 150
Batch size16, 32, 64, and 128
Epochs42, 50, 64, and 70
Learning rate0.001
Optimization algorithmAdam optimizer
Table 2. Hardware and software configuration.
NameParameters
Operating system64 bit operating system
CPU processorIntel(R) Core(TM) m3-7Y30 CPU @ 1.00 GHz 1.61 GHz
Graphics processing unit (GPU)1820
RAM8.00 GB
FrameworkKeras with tensorflow
EnvironmentGoogle Colab
LanguagePython
Table 3. Model evaluation in terms of the Mathews correlation coefficient (MCC).
AlgorithmPest PatternNutrient DeficiencySoft Rot Disease
CNN0.710.290
VGG-160.530.460
MobileNetV2000
Table 4. Number of trainable parameters.
AlgorithmNumber of Parameters
CNN3,453,121
VGG-1614,716,740
MobileNetV21281
Table 5. A comparison with the previous work. The last column indicates the results of each adopted algorithm on pest pattern, nutrient deficiency, and soft rot disease respectively.
RefDatasetSourceMethodAccuracy (%)
[38]Own collected datasetUnder field conditionsCNN, VGG-16, ResNet-5098.53
[39]PlantVillage, own collected datasetLab environmentVGG-16, ResNet-50, MobileNetv387
[40]PlantVillageLab environmentResnet-50, VGG-16, DenseNet16940
[41]PlantVillageLab environmentDCNN99.31
Our studyOwn datasetIn fieldCNN96, 95, 98
VGG-1697, 96, 99
MobileNetV290, 93, 93
YOLOv580, 80, 79
Table 6. YOLOv5 results on different ginger defects classes.
CategoryPrecisionRecallmAP
Soft rot disease0.867430.791670.79004
Pest pattern0.808990.790280.80931
Nutrient deficiency0.805690.780280.80151
Disclaimer/Publisher’s Note: The statements, opinions and data contained in all publications are solely those of the individual author(s) and contributor(s) and not of MDPI and/or the editor(s). MDPI and/or the editor(s) disclaim responsibility for any injury to people or property resulting from any ideas, methods, instructions or products referred to in the content.

