
A Vulnerability Assessment Approach for Transportation Networks Subjected to Cyber–Physical Attacks
by
 ,
,
Konstantinos Ntafloukas
1,*,
Liliana Pasquale
2,
Beatriz Martinez-Pastor
1 and
Daniel P. McCrum
1 1
School of Civil Engineering, University College Dublin, D07 R2WY Dublin, Ireland
2
School of Computer Science, University College Dublin, D07 R2WY Dublin, Ireland
*
Author to whom correspondence should be addressed.
Future Internet 2023, 15(3), 100; https://doi.org/10.3390/fi15030100
Submission received: 30 January 2023
/
Revised: 23 February 2023
/
Accepted: 27 February 2023
/
Published: 28 February 2023
(This article belongs to the Special Issue Security of IoT-Enabled Infrastructures in Smart Cities and Critical Systems)
Abstract
:Transportation networks are fundamental to the efficient and safe functioning of modern societies. In the past, physical and cyber space were treated as isolated environments, resulting in transportation network being considered vulnerable only to threats from the physical space (e.g., natural hazards). The integration of Internet of Things-based wireless sensor networks into the sensing layer of critical transportation infrastructure has resulted in transportation networks becoming susceptible to cyber–physical attacks due to the inherent vulnerabilities of IoT devices. However, current vulnerability assessment methods lack details related to the integration of the cyber and physical space in transportation networks. In this paper, we propose a new vulnerability assessment approach for transportation networks subjected to cyber–physical attacks at the sensing layer. The novelty of the approach used relies on the combination of the physical and cyber space, using a Bayesian network attack graph that enables the probabilistic modelling of vulnerability states in both spaces. A new probability indicator is proposed to enable the assignment of probability scores to vulnerability states, considering different attacker profile characteristics and control barriers. A probability-based ranking table is developed that details the most vulnerable nodes of the graph. The vulnerability of the transportation network is measured as a drop in network efficiency after the removal of the highest probability-based ranked nodes. We demonstrate the application of the approach by studying the vulnerability of a transportation network case study to a cyber–physical attack at the sensing layer. Monte Carlo simulations and sensitivity analysis are performed as methods to evaluate the results. The results indicate that the vulnerability of the transportation network depends to a large extent on the successful exploitation of vulnerabilities, both in the cyber and physical space. Additionally, we demonstrate the usefulness of the proposed approach by comparing the results with other currently available methods. The approach is of interest to stakeholders who are attempting to incorporate the cyber domain into the vulnerability assessment procedures of their system.
1. Introduction
Transportation networks play a vital role in society’s well-being. Indeed, successful daily activities at societal and business levels are based on the consistent operation of integral parts of a public transportation network (e.g., bridges, roads, etc.) [1]. Therefore, research has been focused on the vulnerability assessment of public transportation networks to different types of threats (e.g., natural hazards) that can result in a considerable reduction in network serviceability level [2]. While in the past transportation network operation was considered fragile only to threats from the physical space, such as natural hazards (e.g., floods, earthquakes) [3,4] or man-made attacks (e.g., bombing) [5], this is no longer the case. Critical transportation infrastructure (e.g., bridges), as an integral part of a transportation network, is relying more and more on advanced technologies (e.g., Internet of Things (IoT)) [6,7]. For example, transportation infrastructure is embedded with IoT devices in the form wireless sensor networks (i.e., IoT-based wireless sensor network (WSN)) that provide data in real time for engineering services. These engineering services are related with, but not limited to. early warning systems against hazards (e.g., foundation scour) [8], wireless structural health monitoring (e.g., monitoring through image processing) [9], or traffic monitoring [10]. Additionally, IoT devices will enable transportation infrastructure to be part of a wider transportation system by providing data to other interacting transportation elements, such as such as smart vehicles [11,12]. This integration of the physical world with computational facilities enables the operation of critical transportation infrastructure as cyber–physical systems [13]. The transition from traditional transportation infrastructure and network to an IoT-enabled transportation infrastructure and cyber–physical network, as shown in Figure 1, relies on a fundamental three-layer IoT architecture, namely sensing, network and application [14]. The sensing layer includes the IoT devices (e.g., sensors, gateways), located in the physical space (e.g., deck of a bridge), that collaboratively detect, collect, and process data to the network layer. The network layer is responsible for wireless transmission, having assisted in recent advances in wireless network protocols (e.g., ZigBee, Bluetooth [15]), until data are sent through base stations to the end-user for data analytics and processing through the application layer.
Despite the benefits of IoT-enabled infrastructure, IoT-based cyber–physical systems suffer from security deficiencies in cyber space that can be exploited by attackers [16]. These attackers typically attempt to breach the confidentiality, integrity and availability of data [14]. Although in the past, cyberattacks were assumed to impact only on cyber space, this is no longer the case. An exploitation of a vulnerability in the cyber space by an attacker can result in physical disruption (e.g., unavailability of services), facilitating cyber–physical attacks against critical transportation infrastructure [17]. Therefore, correctly performing vulnerability assessments of transportation networks, especially ones that rely on the constant operation of their integral parts (i.e., IoT-enabled transportation infrastructure), to cyber–physical attacks is of major concern. The significance of cyber–physical attacks against transportation infrastructure has been highlighted, both by our previous research studies [18,19] and by previous events, such as the two-day denial-of-service attacks (DoS) against the Swedish Transport Administration that led to major delays and degraded services for customers, as reported by European Union Agency for Cybersecurity [20]. However, in our previous research studies related to cyber–physical attacks, the major focus was place on the risk assessment of IoT-enabled transportation infrastructure, rather than the vulnerability assessment. In particular, the risk assessment approach focused on the transportation infrastructure that operates as an individual cyber–physical system. This current study focuses on the vulnerability assessment of an entire transportation network. The entire transportation network in this study operates as a cyber–physical transportation network that is built on different IoT-enabled transportation infrastructure (i.e., see Figure 1).
Indeed, the increasing dependence of transportation networks on IoT devices with inherent deficiencies, especially those that are physically exposed to the sensing area of IoT-enabled transportation infrastructure, jeopardize the operation of a transportation network when subjected to cyber–physical attacks. The deficiencies of IoT devices originate either from technical weaknesses (e.g., limited energy resources and computational capacity) or vulnerabilities in cyber space due to security gaps (e.g., lack of encryption) [21].
Current approaches that target the assessment of the vulnerability of a transportation networks to different types of attacks (e.g., natural hazards, terrorism) overlook the security issues caused by the deficiencies of IoT-enabled transportation infrastructure [22]. Studies related to security issues in transportation networks focus on the identification of threats against specific transportation elements that operate within it, such as smart traffic lights [23] or modern vehicle systems that enables vehicle-to-vehicle or vehicle-to-infrastructure communication [24,25]. Similarly, EU projects have studied or are studying the development of a security framework that protects the information and operational technology departments of stakeholders in the transportation domain (e.g., CIPSEC [26]) or in the enhancement of a transportation network serviceability level against cyberattacks (e.g., RESOLUTE [27], RESIST [28]). Other EU projects, such as PRECINCT [29], focus on the interdependencies between transportation networks and other sectors (e.g., energy).
Other studies that do not consider specific vulnerable elements (e.g., traffic lights), follow a holistic approach by assessing the vulnerability of transportation networks to both random (i.e., day-to-day disturbances) or targeted attacks (i.e., malicious attacks or large-scale natural disasters) [30]. These approaches rely on graph theory, describing the transportation network in the form of a graph with a set of nodes (e.g., stations) and a set of edges (e.g., distances between the nodes) [31]. The recent advances in graph theory, with the use of topological attributes, enable the ranking of important nodes or edges in the graph based on centrality measures (e.g., node degree as the number of edges that are incident to a node) [32]. As a result, the behavior of transportation networks (e.g., efficiency) is studied after node removal [2,33]. Although centrality-based ranking is employed to identify the most important nodes based on physical attributes (i.e., centrality measures), it lacks information related to security weaknesses and cyber space. Therefore, the identification and removal of nodes based on topological attributes, when cyber–physical attacks are considered, is impractical. Therefore, in order to assess the attack paths that the attacker should follow to achieve their goal, studies in the security engineering domain have highlighted the role of probabilistic methods (e.g., Bayesian network attack graphs [34]. Additionally, the role of probabilistic methods is enhanced when knowledge from publicly available databases and industrial frameworks is applied. For example, a widely used public database is the National Vulnerability Database (NVD) [35]. This assigns a common vulnerability and exposure number (CVE-ID) to every reported vulnerability, which is later assessed through Common Vulnerability Scoring System (CVSS) [36]. Similarly, MITRE ATT&CK is an industrial framework, that provides details related to the capabilities of the attacker based on previous cyber intrusions [37]. Despite the beneficial use of probabilistic methods, along with the integration of knowledge from public databases and industrial frameworks, these studies mainly focus on network security breaches (e.g., through the internet). Therefore, the role of physical space is overlooked. Indeed, the role of the physical space is of major importance when traditional cyber–physical attacks against the sensing layer (e.g., eavesdropping, man-in-the middle attack [38]) of an IoT-enabled transportation infrastructure are considered. In this case, the attacker may be required to initially exploit vulnerabilities in the overlooked physical space (e.g., deficient perimeter protection) to gain physical proximity to the IoT-based WSN. Such physical vulnerabilities are not included in public databases related to cybersecurity. Furthermore, the characteristics of attackers (e.g., skills) are mainly derived from the cyber space. Therefore, characteristics derived from the physical space (i.e., terrorism experience), such as those described in our previous work [18], have not been considered.
To bridge the gap, a new vulnerability assessment approach for transportation networks subjected to cyber–physical attacks at the sensing layer is proposed in this paper. In this approach, a transportation network is represented in the form of a graph with a set of nodes that represent the IoT-enabled transportation infrastructure. These IoT-enabled nodes, connected through their edges, are the targets of the cyber–physical attack. The approach relies on a Bayesian network (BN) attack graph [39] that enables us to probabilistically model vulnerabilities as different states of the attack, combining cyber and physical space for the first time. To assist stakeholders (i.e., operators, civil and security engineers) who acts as assessors towards the detailed assignment of probability scores to vulnerability states, a novel probability indicator (PI) is applied. The PI acts as ratio, considering the level of attacker, under certain profile characteristics (e.g., motivation), and the level of control barriers that protect the vulnerability state (e.g., encryption). Following the probabilistic analysis, a new probability-based ranking table is developed that describes the probabilistically most vulnerable nodes to the cyber–physical attack. Finally, the vulnerability of the transportation network is measured as a drop in efficiency after the removal of the highest probability-based ranked nodes. We demonstrate the application of the approach by measuring the vulnerability of an illustrative transportation network as a case study. Monte Carlo simulations and sensitivity analysis are performed, along with the calculation of correlation coefficient, as methods to evaluate the results. The results indicate that the transportation network is probabilistically susceptible to cyber–physical attacks when they take place at the sensing layer of deficient (in terms of physical and cyber control barriers) IoT-enabled transportation infrastructure. We highlight the usefulness of our approach by comparing the results with other existing studies, whose outcomes differ greatly.
This paper contributes to existing knowledge in the following ways. First, we introduce an approach to assess the vulnerability of transportation network to cyber–physical attacks that have been previously overlooked. Furthermore, we combine vulnerabilities of the physical and cyber space for the first time, driven by the new cyber–physical perspective of a transportation network. Third, the assignment of probability scores is performed with the use of a PI that considers a detailed attacker profile and control barriers from both spaces. The remainder of the paper is as follows: Section 2 presents the related work; Section 3 describes the proposed vulnerability assessment approach; Section 4 illustrates the case study and presents the results; Section 5 details the results and limitations of the approach; and Section 6 concludes the paper.
2. Related Work
A review of related work within the area of vulnerability assessment of transportation networks is presented in this section. The current literature reflects a growing interest in the vulnerability assessment of transportation networks in relation to a variety of threats or disturbances (e.g., terrorism, natural hazards, accidents) [40,41,42]. In contrast, studies related to security issues and transportation networks mainly focus on the identification of IoT-enabled types of attacks against transportation systems (e.g., attacks on traffic control infrastructures [43]), or on the security issues of smart vehicles [44], rather than on the task of vulnerability assessment.
Due to the unforeseen nature of attacks against transportation networks, a static analysis requires the removal of nodes and the evaluation of changes in certain transportation indexes (e.g., connectivity), as vulnerability measures, in accordance with a centrality measure-based ranking [43]. For example, Zhang et al. [45] considered the use of a ranking of descending node degree in the Shanghai metro to measure the vulnerability as a drop in network connectivity. However, the authors noted that selection of removed nodes should include additional details beyond topological properties (i.e., centrality measures), such as the external loads of the node (e.g., traffic flow) [45]. Based on this, Cai et al. [46] considered the travel time and passenger flow in a topological vulnerability analysis iun order to measure the vulnerability of the Beijing metro network as a drop in network efficiency. Other studies have considered socio-economic aspects of a transportation network to define the importance of nodes [47]. For example, Taylor et al. [48] analyzed the vulnerability of a rural region in south east Australia under node attacks. They considered accessibility as an index that refines the ease with which services and facilities can be reached while using certain nodes of a transportation network. These works studied the vulnerability of transportation network to random or intentional disruptions, focusing on the importance of nodes under certain criteria that derive from physical space (e.g., topological properties). In contrast, the research in this paper studies the susceptibility of a transportation network to security issues of IoT-enabled transportation infrastructure in the cyber space.
Within the security domain of transportation networks, Ghena et al. [49] succeeded in raising security awareness due to the increasing number of cyber vulnerabilities (e.g., lack of encryption) in transportation systems. Specifically, a case study was used to analyze the security of traffic infrastructure (i.e., traffic signals). Based on the security issues of traffic signals, Laszka et al. [50] studied the vulnerability of a transportation network to traffic signal tampering attacks. The approach relied on an attacker model that builds upon certain characteristics (e.g., goal of the attacker), a traffic model (i.e., Daganzo’s cell transmission model [51]) and an algorithm for computing optimal attacks. Vulnerability is then measured as drop in the total travel time of the network. This approach considers a detailed attacker profile that affects the susceptibility of transportation network. Vivek et al. [52] developed a framework to quantify, detect, and mitigate the cascading consequences of attacks which are related to cybersecurity incidents and that could disrupt a traffic network. In contrast to the approach used in this paper, namely one that identifies the most vulnerable nodes based on their security weaknesses, the identification of the most vulnerable nodes is enabled using certain centrality measures (i.e., betweenness centrality).
Studies in security engineering related to the vulnerability assessment to cyberattacks have highlighted the role of probabilistic methods (e.g., Bayesian network attack graphs). For example, Musa et al. [53] proposed the use of a model based on attack graphs to enable organisations to identify the most vulnerable nodes in their security analysis by reducing their complex use (i.e., attack graphs). The model is based on reported vulnerabilities in NVD and is assigned scores based on CVSS. Despite the consideration of industrial databases and frameworks that reduce the complexity of the attack graph, the method is applicable only when vulnerabilities in the cyber space are considered, such as those included in NVD. In contrast, the study in this paper integrates vulnerabilities into the physical space, considering the cyber–physical perspective of a transportation network. Similarly, Sadlek et al. [54] proposed an approach that merges kill chains as a means to model attacks as sequences of steps [55] and attack graphs. The kill chain attack graph relies on the current knowledge for attacker modelling provided by the MITRE ATT&CK framework [37]. The approach provides information to security administrators, although this is strictly for network intrusions, as the applied attacker modelling is based on previous cyber events. However, the approach used in this paper explicitly considers additional attacker characteristics (i.e., terrorism experience) necessary to exploit vulnerabilities in the physical space.
Probabilistic graphical models based on Bayesian networks have been previously applied in studies related to cybersecurity. Shin et al. [56] highlighted the role of BN in inherently qualitative cybersecurity models. The structure of the BN, as a directed acyclic graph of an arc that represents the dependencies between the nodes and variables, enables the efficient conversion of qualitative metrics (e.g., low) into quantitative values. Specifically, the child node has the cause element, and the parent node has a result element from the child nodes. A probability table then summarizes the occurrence probability between the causal relationship nodes, which can be updated at any time.
The use of BN in studies related to cybersecurity and transportation networks is mainly associated with security issues in advanced vehicles (e.g., connected and autonomous vehicles) [57]. Comert et al. [58] developed belief network-based attack modelling at signalized traffic networks under connected vehicle and intelligent signals frameworks. Vulnerability scores for signal controllers’ equipment (e.g., sensor), as part of the Bayesian network, were based on metrics with certain ranges of assigned scores (i.e., low, medium, etc.), resulting in the quantification of impact (e.g., delays). In this approach, a new PI is applied. This enables stakeholders, who act as assessors, to accurately assign a probability score, based on a detailed attacker profile and the control barriers that protect the system.
Although related studies have succeeded in raising awareness of the susceptibility of transportation networks to traditional threats (e.g., terrorism) or emerged threats (e.g., cyberattacks), they have certain deficiencies. Firstly, they focus on threats which are mainly derived from the physical space, overlooking the increased vulnerability of transportation network due to cyber–physical attacks [41]. Furthermore, studies that follow a static analysis assess the vulnerability of transportation network after the removal of nodes following centrality measure-based ranking [43]. Such an approach is misleading, as topological attributes lack details related to security issues. Other approaches within the domain of security engineering and transportation networks either focus on attacker profiles with limited characteristics [50], or on exploitable vulnerabilities of advanced vehicles [58], overlooking the security weaknesses of IoT-enabled transportation infrastructure at the sensing layer. The approach used in this paper considers the vulnerability of an entire transportation network against cyber–physical attacks by integrating a detailed attacker profile to accurately identify the most vulnerable nodes.
3. Vulnerability Assessment Approach
3.1. Overview of Vulnerability Assessment Approach
The proposed vulnerability assessment approach in this paper assesses the vulnerability of an IoT-enabled transportation network which is subjected to cyber–physical attacks on the sensing layer. The sensing layer includes both the physical infrastructure and the embedded IoT-based WSN. The novel approach relies on a topological vulnerability assessment method in the form of a graph [59]. Specifically, the graph is an ordered pair G(N, E), including a set N of nodes and a set E of edges. Depending on the evaluated transportation network, these can be undirected (i.e., no order is assumed between the nodes linked by an edge) or directed (i.e., a start and end node of each edge is assumed) and unweighted (i.e., all edges have the same weight) or weighted (i.e., the edges may have different weights). In this approach, the set of N nodes (i.e., ni) represents the IoT-enabled transportation infrastructure of the transportation network that is subjected to the cyber–physical attack, and the set of E edges (i.e., ei) represents the distance between them.
As shown in Figure 2, the approach includes five activities. The first activity (i.e., selection of a sensing area cyber–physical attack scenario) includes the selection of a cyber–physical attack scenario that takes place at the sensing area. The activity is facilitated by using either individual or combined publicly available catalogues of common attack patterns (e.g., CAPEC [60]) and current theoretical [61] or experimental studies [62], all based on IoT devices. The second activity (i.e., Division of cyber-physical attack scenario into vulnerability states in physical and cyber space) is based on the BN attack graph that details the vulnerability states, in both the physical and cyber space, that the attacker needs to exploit in order to succeed in the selected cyber–physical attack scenario (i.e., first activity). This approach goes beyond previous works, as it integrates the cyber and physical space for the first time. For example, in a network attack, the attacker should gain physical proximity to the IoT-based WSN by overcoming the physical security of the IoT-enabled transportation infrastructure. The third activity in Figure 2 (i.e., development of conditional probability table for every node i) necessitates the development of a conditional probability table (CPT), as part of the BN [63], that will enable the calculation of the probability of the successful exploitation of vulnerability states for the selected attack scenario (i.e., refer to the first and second activity) for every node, i. The first, second and third activities are described in more detail in Section 3.2. The fourth activity (i.e., calculation of probability indicator (PI)) includes the calculation of the proposed PI that will enable assessors to assign a probability score to every vulnerability state, i. The ratio considers both a detailed attacker profile and the physical and cyber control barriers that protect every vulnerability state. The fifth activity (i.e., removal of nodes based on probability-based rank and vulnerability assessment as drop in efficiency) describes the measurement of vulnerability of the transportation network as a loss of efficiency [64] after the removal of the highest probability-based ranked nodes. The fifth activity is further described in Section 3.3.
3.2. Cyber–Physical Attack Scenarios and Vulnerability States
The vulnerability assessment approach commences with Activity 1 and 2 (refer to Figure 2). It includes the selection of a sensing area cyber–physical attack scenario (i.e., Activity 1) and its division into vulnerability states in physical and cyber space (i.e., Activity 2). The selection of cyber–physical attack scenarios necessitates the role of stakeholders who should have a bespoke knowledge of their system deficiencies [65], held on account of either their existing knowledge from previous cyberattacks [66] or by availing themselves of the use of public databases. Specifically, existing public catalogues, databases and studies that detail attack scenarios are commonly used and can be applied in this approach. For example, public catalogues (e.g., CAPEC catalogue [60]) and databases (e.g., Common Vulnerabilities and Exposures database [67]) detail the exploitation of vulnerabilities based on real-world events. In addition to these databases and catalogues, both theoretical [68] and experimental studies [57] detail attack scenarios against IoT devices.
The division of the cyber–physical attack scenarios into vulnerability states in the physical and cyber spaces (i.e., Activity 2) relies on a BN attack graph. The BN attack graph models the vulnerability states that the attacker should exploit to succeed in the selected cyber–physical attack scenario (i.e., Activity 1) in a probabilistic manner. The BN attack graph is represented by a set of vertices that describe the vulnerability states, arcs that describe the conditional relationships (i.e., OR, AND) between the vertices and conditional probability tables that includes the probability score of every vertex. The use of BN attack graph enables us to model the probability of a vulnerability state based on vulnerability states that have occurred and thus update the posterior probabilities. The application of the chain rule of probability theory allows to factorize joint probabilities for a set of v vertexes, ranging from X1 to Xv, by using Equation (1),
where Pa(Xi) is the collection of all parent vertexes of the vertex, Xi. A numerical example of a BN attack graph is shown in Figure 3 to demonstrate the application of a BN attack graph. In this abstract example, in order the attacker to succeed in the goal of the attack, the attacker should exploit Vulnerability C (i.e., VC) given the prior exploitation of either Vulnerability A (i.e., VA) OR Vulnerability B (i.e., VB). For the purposes of this example, abstract numerical values are used. To simplify the generation of CPTs, an assumption of probability scores is made, namely, that VA is equal to 0.3, VB is equal to 0.4 and VC is equal to 0.5. The True (T) and False (F) statements are used to indicate the condition of vulnerability state.
Based on Equation (1), the calculation of the successful exploitation of VC given that VA OR VB has been exploited is shown below:
To highlight the significance of a BN attack graph, the possibility of exploitation of VC given the initial exploitation of VA OR VB is lower (i.e., 0.29) than the initial belief of individual exploitation of VC (i.e., 0.50).
3.3. Calculation of PI Ratio
For reasons of simplicity, we performed in the example detailed in Section 3.2, the assignment of probability scores in an arbitrary way. Traditionally, it is common practice for expert(s) who have bespoke knowledge of their system to determine the probability scores [69]. To enable a more detailed assessment, we propose the integration of a PI in order to assign probabilities scores in every vulnerability state in the BN attack graph. The PI, as shown in Equation (2), requires stakeholders who act as assessors, to consider not only the condition of the IoT-enabled transportation infrastructure but also the attacker profile. The numerator of PI is equal to the weighted average of the level of attacker who attempts to exploit the vulnerability state. The denominator of PI is equal to the level of control barriers that exist to protect the vulnerability state from being exploited in physical and cyber space (see Section 3.3.1). The proposed attacker profile characteristics, for cyber–physical attacks against a sensing layer of IoT-based WSN, has been detailed in our previous work [18]. In summary, it builds on the level (i.e., Xi) and the importance index (i.e., Wi) of the following characteristics, namely knowledge (i.e., XKN, WKN) (i.e., describes cyber skills, attack methods, etc.), resources (i.e., XRE, WRE) (i.e., describes budget, manpower, etc.), Psychology (i.e., XPS, WPS) (i.e., describes the motives), and terrorism experience (i.e., XTe, WTe) (i.e., describes the ability of attacker to remain undetected in public areas and the ability of gaining access to sensitive critical information infrastructure). These characteristics enable the assessment of classified attacker profiles that act against critical infrastructure such as basic users, cybercriminals, nation states, and hostile organizations [70]. For example, if the attacker is considered to be a nation state, then the knowledge (i.e., XKN), resources (i.e., XRE), psychology (i.e., XPS), and terrorism experience (i.e., XTe) should be in the high level (see Table 1).
The level of control barriers (i.e., Xcb) refers to the level of protection for the vulnerability state, whether in the physical space (i.e., technological means such as motion detectors and human or non-technological means such as perimeter protection, for example) or in the cyber space (e.g., advanced encryption). For example, physical proximity to an IoT-enabled transportation infrastructure may be restricted due to motion detectors that indicate a greater Xcb in the physical space, but IoT devices may lack encryption when transmitting data that indicate a lower Xcb in the cyber space. The rating scale of characteristics level (i.e., Xi) and importance index (i.e., Wi) is shown in Table 1, and has been detailed in our previous work [18]. For a specific cyber–physical attack scenario, Xi represents the level of the characteristics and Wi represents the importance of the characteristic to the successful completion of the attack. For example, if the attacker has access to a large budget (i.e., XRE is assigned to a High level), they still must access traditional hardware devices (e.g., laptops) in order for the attack to be successful. Subsequently, the specific characteristic is of lower importance (i.e., WRE is assigned to a Low level). The assessment of the level of attacker profile characteristics and control barriers, which enables the calculation of PI, follows the rationale of the widely used cybersecurity industrial standards released by the National Institute of Standards and Technology (NIST), such as NIST SP800–30 [71]. According to this standard, assessment can be further facilitated by several organizational factors such the use of stakeholders’ expertise, previous incident reports or the monitoring of public available catalogues (e.g., CAPEC [60]).
As in several cybersecurity studies, the role of stakeholders in this approach that considers cyber–physical transportation networks is of major importance. Indeed, the role of stakeholders as experts combines the logical and mathematical procedures to elaborate their assessment for the considered system [72]. Their involvement is mainly necessitated due to the lack of statistical data for cyberattacks and in order to understand the characteristics of recent attacks and their patterns of occurrence [73]. These reasons are amplified due to the premature level of development IoT-enabled transportation networks. Currently, no validated procedure exists that enables the assessment of values related to cybersecurity issues, such as the probability of a successful exploitation. Therefore, the assessment of different metrics, such as assignment of probability scores, highly depends on the judgement of experts with a bespoke knowledge of their system [69]. However, recent studies in cybersecurity have highlighted that attacker characteristics (e.g., skills) should be additionally integrated into the assessment procedures [74]. Therefore, we propose the integration of a PI to drive that a more detailed assessment process (i.e., assignment or probability scores). The PI acts as a ratio that considers both the bespoke knowledge of the system through control barriers and the attackers characteristics. Therefore, based on the calculation of PI for very vulnerability state, the probability scores should range within the values shown in Table 2. Due to the abovementioned lack of validated procedures, the ratio builds on a linear relationship between the attacker characteristics and control barriers. Specifically, Xi (see Table 1) ranges from one (i.e., low level) to three (i.e., high level). Therefore, the PI is linearly distributed to five scales that consider the upper and the lower boundaries of Xi, as shown in Equation (2). For example, if the assessment of the numerator (i.e., attacker assessment) ranges in high-level values (i.e., 2–3) and the assessment of denominator (i.e., control barriers) ranges in low level values (0.01–1), then PI ranges from two to three. Stakeholders can determine their own probability boundaries, availing themselves of the use of attacker characteristics. For the purposes of this approach, we evenly distribute the range of probability scores to five scales in order to match them with the range of PI, as shown in Table 2.
It is evident that a greater attacker level with a lower control barrier level will result in higher values of PI (i.e., values ranging from two to three) and subsequently in a higher range of probability scores for a vulnerability state, i (i.e., P(i)). For example, in a vulnerability state i, if the level of attacker is equal to 2.5 (i.e., a high level of attacker) while the control barrier level is equal to 1 (i.e., a low level of protection), then, based on PI, the probability score of successful exploitation ranges from 0.75 to 1.
3.3.1. Control Barriers
Control barriers operate as measures that can detect or prevent a cyber–physical attack, either in the physical or cyber space. Physical control barriers describe traditional protection measures (e.g., perimeter protection) that have been applied in the past, or advanced protection measures (e.g., smart video-surveillance) that have been designed for cyber–physical system protection. Cyber control barriers describe current protection measures (e.g., advanced encryption) that are designed to shield IoT devices from being exploited. In particular, this research considers thw potential types of cyberattacks at the sensing layer. Table 3 presents the described control barriers (i.e., at the physical and cyber space.
We divided physical control barriers into those based on; (i) technological operation and (ii) non-technological or human operation. Physical control barriers that are based on technological operation include for example CCTV systems, motion detectors, line crossing, and smart video-surveillance capacity. Physical control barriers, based on non-technological or human operation, include perimeter protection (e.g., fence) or continual inspection from trained personnel [75].
In addition to physical control barriers for IoT devices, the vulnerabilities of IoT devices are protected by various cyber control barriers also (i.e., Xcb). The main cyber control barriers aim to protect the various dimensions of the vulnerabilities of IoT devices, as presented in [76]. Specifically, Neshenko et al. [76] provide a unique taxonomy that classifies the vulnerabilities of IoT devices that should be addressed by administrators. The study [76] boosts the theoretical and empirical aspect of the premature IoT technology by classifying the state-of-the-art surveys. These are related to the: (i) level of authentication that would prevent an attacker from appending spoofed malicious nodes or violating data integrity; (ii) level of encryption required as a protective mechanism (e.g., algorithms) to store and transit data in such a manner that only authorized users can utilize it and prevent an attacker from violating data confidentiality and control IoT devices; (iii) level of access control that describe the level of credential management (e.g., passwords) required to protect IoT devices and data from unauthorized access; (iv) level of energy resources that describes whether the IoT devices possess the technology required (e.g., solar systems) to renew energy production automatically; (v) level of proper patch management that describes whether the IoT devices have in place automated patch–update mechanisms or a sufficient routine patching schedule by the manufacturers that would (i.e., IoT devices) mitigate the risk from zero-day vulnerabilities; (vi) level of audit mechanisms required to provide transparency about actions that have previously occurred in the past (e.g., logging record), are occurring in the present (e.g., health record) and will occur the future state (e.g., access record) of the IoT device; (vii) level of IoT device port scanning that describes the level of investigation and detectability of unnecessarily open ports connected to the IoT device, which is addressed by a risk level (e.g., “Safe ”) from the inspection team [77], that would allow an attacker to connect through them (i.e., open ports) and exploit a vulnerability.
3.4. Efficiency of Transportation Network
The performance level of a transportation network has been previously related to the established and widely adopted efficiency measure (E) [64] that satisfies different perspectives of a transportation network flow (e.g., traffic flow) [78]. The efficiency of a transportation network in the form of a graph (i.e., E(G)) considers the distance between node pairs and is mathematically computed, as shown in Equation (3).
where N represents the number of nodes in the network graph, and G and dij represent the shortest distance between node pairs. E(G) varies in the range [0–1], with values closer to 1 representing more efficient transportation networks. After the removal of the highest probability-based ranked nodes, vulnerability (i.e., V(G)) is measured as the loss in efficiency as per Equation (4). E(G) and E′(G) represent the initial efficiency and the efficiency of the transportation network after the removal of a node. The probability threshold (e.g., probability score greater than 0.5) that defines whether a node should be removed or not, is designed based on stakeholders’ decision.
where E(G) and E′(G) represent the initial efficiency and the efficiency of the transportation network after the removal of a node i, respectively.
4. Case Study of a Cyber–Physical Transportation Network
A case study of a cyber–physical transportation network, subjected to cyber–physical attacks, is presented in order to demonstrate the application of the proposed vulnerability assessment approach. The case study also highlights the usefulness of the approach by comparing the results with other approaches that adopt a centrality-based ranking (e.g., node degree), as described in Section 2. The topology of the transportation network adopted in this case study takes the form of an undirected graph G with a set of eight nodes (i.e., N = 8) that represent the IoT-enabled transportation infrastructure (e.g., Node 3 represents an IoT-enabled bridge) which was subjected to cyber–physical attack. A set of 14 weighted edges (i.e., E = 14) exist that represent the distances (i.e., dij) between the interconnected nodes N, as shown in Figure 4. For the purposes of this case study, we consider that the ZigBee devices form the IoT-based WSN [79]. ZigBee technology is a wireless technology, offering many advantages to users (e.g., low cost, flexible deployment) embedded in IoT devices as a communication protocol. It builds on the IEEE 802.15.4 standard [80], and has been identified through experimental studies as a reliable technology for various civil engineering digital services (e.g., wireless structural monitoring, traffic monitoring, etc.) [81]. The ZigBee protocol stack operates under the following layers, namely: application (i.e., data transmission and security services); network (i.e., routing, security, and configuration of new devices); MAC (i.e., interface between physical and network layer); and physical (i.e., functions related to ZigBee hardware). Every individual protocol stack layer suffers from inherent vulnerabilities (e.g., insecure key transport) that threaten the operation of the IoT-based WSN [82].
4.1. Case Study Application of Vulnerability Assessment Approach
Experimental and theoretical studies have highlighted the security issues of Zigbee [83,84]. One of the main security issues of ZigBee technology relies on key management, enabling the sniffing of security keys and the conduction of denial-of-services attacks (DoS) [62,82]. This will be considered in this case study as Activity 1 (i.e., see Figure 2, Selection of a sensing area cyber–physical attack scenario).The selected attack has been experimentally tested with success [62,82]. Key management is of vital importance for the security specifications of ZigBee devices. One of the ZigBee devices (i.e., Trust Center) is responsible for the security key management, providing the network key as a security key. The network key acts as a security mechanism which enables secure communication within the devices of the ZigBee network. The Trust Center is also responsible for the selection of the security level that determines whether the network key is transmitted encrypted over the air (i.e., high security level) or is transmitted unencrypted over the air (i.e., standard security level). When the latter security level is used (i.e., standard security level), the network key is not pre-installed to all legitimate devices of the ZigBee network by the administrator and is transmitted unencrypted over the air. In this case, the administrator has opted for a less secure but more usable option, which is typical for large-scale networks. By capturing the over-the-air transmitted packets, the attacker can legitimately communicate with the victim ZigBee network and exploit additional vulnerabilities, such as limited energy resources, resulting in an unavailability of data (e.g., Denial-of-Service attack (DoS)).
Following Activity 2 (i.e., see Figure 2, Division of cyber–physical attack scenario into vulnerability states in physical and cyber space), the cyber–physical attack scenario can be divided into the following vulnerability states. Initially, the attacker needs to infiltrate the physical sensing area of the critical transportation infrastructure where the ZigBee enabled network is located. In order to accomplish this, the attacker should overcome the physical control barriers (i.e., physical space) that rely on non-technological or human operation (i.e., State A, VA) and technological operation (i.e., State B, VB). The specific physical control barriers operate individually and therefore the attacker should overcome both, where those are applicable. Then, the attacker should capture the over-the-air traffic and parse the network key by using packet sniffers (e.g., KillerBee [85]) and legitimately communicate with other ZigBee devices. The attacker should overcome the cyber control barriers (i.e., cyber space) that rely on the security level used (e.g., standard) and the subsequent level of encryption (i.e., State C, VC) and flood the other ZigBee devices with bogus messages. Bogus messages will result in transmission failure and the denial of services by overcoming the cyber control barriers that rely on the energy resources level and audit mechanisms (i.e., State D, VD).
In order to compute the probability score of a successful attack given the previous exploitation of vulnerability states in the physical and cyber space, the completion of Activity 3 (i.e., see Figure 2, Development of conditional probability table for every node i) and Activity 4 (i.e., see Figure 2, Calculation of probability indicator (PI)) is necessary. An example of the BN attack graph and CPT structure is provided by considering Node 6 in the graph (i.e., see Figure 4), as shown in Figure 5. We assume that. for the considered node (i.e., Node 6), the successful exploitation (i.e., True as T, False as F) of State A (i.e., VA) and B (i.e., VB), C (i.e., VC), D (i.e., VD) is required.
To compute the total probability of success for every node, i (i.e., see Equation (1)), we must to assign the probability score to every vulnerability state (e.g., P(VA = T)) based on PI (i.e., see Equation (2)). For the purposes of this case study, an assumption of the type of attacker profile with the corresponding levels of profile characteristics (i.e., see Section 3.3) is made. Every node that describes IoT-enabled transportation infrastructure of a network was subjected to the cyber–physical attack scenario by the same type of attacker. Therefore, for reasons of simplicity, the level of attacker characteristics were constant. Specifically, a nation state was identified as the attacker, as in many previous cyberattacks against critical infrastructure [86]. A nation state is generally characterized as an attacker with high levels of access to sensitive information, command of resources in terms of budget or manpower (e.g., with the capacity to employ cyberterrorists with exceptional cyber skills), in addition to strong motives (e.g., political or ideological) and cyber skills [87]. Table 4 presents the levels of attacker characteristics for the selected type of attacker profile per vulnerability state. For State A and State B (i.e., physical space), when both or one of them exist (i.e., physical space), joined by State C and State D (i.e., cyber space), the level of profile characteristics of terrorism experience (i.e., XTe) and psychology (i.e., XPS) are high (i.e., 2–3) in the rating scale (i.e., see Table 1). As shown in Table 4, terrorism experience (i.e., attacker should remain undetected) is of very high importance (i.e., WTe varies to 0.81–1.0). Psychology (i.e., motives of the attacker) is of high importance (i.e.,WPS varies to 0.61–0.80) considering the attainment of the successful exploitation of every state. For State C and State D (i.e., cyber space), the associated levels of knowledge (i.e., XKN) and resources (i.e., XRE) are high (i.e., 2–3). The possession of cyber skills (i.e., Knowledge) through the exploitation of vulnerability State C and D is of very high importance (i.e., WKN varies to 0.81–1.0). However, the possession of a budget is of very low importance (i.e., WRE varies to 0.01–0.20) as the execution of such operations only requires access to commercial products (e.g., KillerBee [85]).
The level of control barriers (i.e., Xcb), with respect to every vulnerability state in the physical or cyber space, is described in Table 5 and should be assigned by stakeholders who have bespoke knowledge of their system. For example, Node 6 is protected by physical control barriers that rely on (i) advanced non-technological or human operation barriers, including perimeter protection and continual inspection from trained personnel, and (ii) advanced technological operation barriers, including smart video-surveillance and motion detectors. Therefore, Xcb for the vulnerability States A and B is at a high level (i.e., 2–3). Additionally, Node 6 is protected by cyber control barriers that rely on (i) high levels of security (i.e., network key is transmitted encrypted over-the-air) and (ii) critical audit mechanisms that ensure the inspection and maintenance level of energy resources. Therefore, Xcb for the vulnerability States C and D is high (i.e., 2–3). Table 5 details the attributes and levels (i.e., Xcb) of control barriers for every node per vulnerability state.
Based on Table 4 and Table 5, we calculated the PI for every vulnerability state (i.e., PIA as for probability indicator for vulnerability state A, PIB, PIC, PID) in order to assign a detailed probability score. For example, for Node 4 we calculated PI for every vulnerability state (i.e., PIA, PIC, PID) in which the determination of the probability score is based on the associated probability range of PI, a factor which stems from the Monte Carlo simulations performed as described in Table 6. Detailed results can be seen in Section 4.2.
4.2. Case Study Analysis and Results
This section provides the results of the analysis obtained by performing five thousand Monte Carlo simulations using uniformly distributed random number generators and considering mean values as the basic statistical measure [88]. Specifically, based on the constructed BN attack graph (i.e., see example of Figure 5) and the assigned values presented in Table 4 and Table 5, Monte Carlo simulations were performed to calculate the PI (i.e., see Equation (2)) and calculate the total probability score of a successful attack for every node. Table 7 presents the results of the overall process and the total probability score for every node (see Equation (1)) in a descending probability-based ranking. The probabilistic ranking indicates which nodes are most vulnerable, an assessment based on the considered level of attacker characteristics and the level of control barriers. Table 7 demonstrates that the existence of higher-level control barriers, both in the physical and cyber space, results in a low probability of success (i.e., see Node 6, P(6) = 0.06). However, deficient control barriers in the physical and cyber space result in a high probability of success (i.e., see Node 8, P(8) = 0.60). Indeed, the significant statistical relationship between the level of control barriers and the probability of a node being successfully attacked can be indicated using the correlation coefficient r (i.e., Pearson correlation coefficient [89]). Specifically, r is equal to −0.63 when we consider nodes that integrate at least one high-level control barrier, either in physical or cyber space, indicating that nodes with a higher level of protection are probabilistically less vulnerable.
A sensitivity analysis was undertaken to demonstrate the importance of level of attacker characteristics in the vulnerability assessment approach, as shown in Table 8. We considered Node 8, which was probabilistically the most vulnerable node, according to Table 7. Specifically, all the inputs of the level of attacker characteristics remain constant, excluding the level of knowledge (i.e., XKN, set as low level (1) in contrast to high level (2–3) in our case study). The attacker profile has a low level of knowledge (i.e., XKN is equal to one), which could potentially indicate a basic user. Results taken from performed Monte Carlo simulations indicated a decrease in 50.0% (i.e., from 0.60 to 0.30) in the total probability score when the attacker had a low level of knowledge. These results indicate the importance of including attacker profile, but also of making accurate assessments of potential attackers’ knowledge.
The vulnerability assessment of the transportation network to the considered cyber–physical attack is measured as a drop in efficiency after the removal of the highest probability ranked nodes (see Table 7). While certain thresholds (e.g., removal of node when probability of success is greater than 0.50) could be determined based on stakeholders’ judgment, for this case study all nodes were removed, one by one, in a probabilistically descending order. The results showcase the relationship between their probability scores based on an attack in cyber space and the susceptibility of the transportation network in the physical space using the measure of efficiency [64]. The vulnerability assessment was performed as drop in efficiency based on Equation (4). To calculate initial efficiency and efficiency after the removal of a selected node, the shortest path distances (i.e., dij) between all set of nodes was applied. This method considers that every edge has a weight equal to one, as presented in Table 9. For example, the shortest path distance between Node 1 and Node 5 was equal to two, as Node 3 acts as a bridge between them (i.e., d15 = 2).
Initial efficiency of transportation network (i.e., E(G)) was calculated based on Equation (3).
Using the same method as shown the example in Equation (3), the efficiency of the transportation network for a removed Node i (i.e., E′(i)) was calculated considering the probability-based ranking. The vulnerability assessment was calculated as a drop in efficiency. Table 10 presents the vulnerability assessment of the network after the removal of nodes in a probabilistically descending order. The results indicate that the case study transportation network is more vulnerable to the example sensing layer attack when Node 6 is successfully attacked (i.e., drop in network efficiency by 30.6%) even though it ranked as the probabilistically less vulnerable node (i.e., P(6) = 0.06, see Table 7). In contrast, the case study transportation network is less vulnerable to the example sensing layer attack when Node 1 is successfully attacked (i.e., drop in network efficiency by 20.1%), even though it is probabilistically ranked as the second most vulnerable node (i.e., P(1) = 0.57, see Table 7). This aligns with the notion of a cyber–physical attack that can result in unforeseen degradation of serviceability level of victimized cyber–physical system [90].
5. Discussion
The results indicate that the case study transportation network is vulnerable to sensing layer attacks on the IoT-enabled network. The proposed vulnerability assessment approach enables stakeholders, who acts as assessors, to measure the vulnerability of a transportation network to cyber–physical attacks.
The results indicate that IoT-enabled transportation networks which lack physical and cyber control barriers are probabilistically more vulnerable to sensing layer attacks. Although only one cyber–physical attack was considered (i.e., DoS attack), the notion of other well-established sensing layer attacks is based on similar attributes as they require a sufficient physical proximity and interference with the IoT-based WSN (e.g., man-in-the-middle attack [38]). The case study IoT-enabled transportation infrastructure, in the form of a node in this approach, embedded with deficient control barriers (i.e., low level) both in the physical and cyber space (i.e., node 8 in the case study), is probabilistically more vulnerable (i.e., P(8) = 0.60, see Table 7) than an IoT-enabled transportation infrastructure that is protected by a high-level control barriers (i.e., P(6) = 0.06, see Table 7). The correlation coefficient, r, for this case study (i.e., r = −0.63) indicates that the existence of at least one high-level control barrier (i.e., Xcb) can result in a significant lowering of the probability of exploitation. This enhances the applicability of the proposed approach in relation to the implementation of security measures in a transportation network. For example, it should be considered that high-level security (i.e., encryption over-the-air of network key transmission) is implemented in the IoT-based WSN of node 8, and that this results in it being probabilistically the most vulnerable node of the transportation network (i.e., P(8) = 0.6, refer to Table 7). Implementing such a high security level intervention results in a new probability score that is significantly reduced (i.e., P’(8)= 0.34).
The structure of the proposed vulnerability assessment approach (refer to Figure 2) necessitates the role of stakeholders (i.e., civil and security engineers, operators), to assess rating scales, control barriers, etc. Expert opinion is required as there is still significant underreporting of cyberattacks, leading to a lack of statistical data [91]. Additionally, experts have developed bespoke knowledge of their system and previous attempts of exploitation. For example, the impact of the assessed attacker profile characteristics (i.e., Xi) can affect the calculated total probability score, as shown in the sensitivity analysis in Table 8 (i.e., a 50.0% percentage change). The new probability-based ranking enables the measurement of vulnerability of a transportation network to cyber–physical attacks. The ranking probabilistically allows the identification of vulnerable nodes and can result in a great reduction in network efficiency, as shown in Table 10 (i.e., reduction of 23.2% after removal of Node 8).
It is acknowledged that, due to the premature level of IoT-enabled transportation infrastructure and the integration of the physical and cyber space, the assessment of vulnerability states can be challenging. The PI aims to drive a detailed assessment, benefiting from previously overlooked data (e.g., attacker characteristics) and stakeholders’ bespoke knowledge of their system. The disclosure of statistical data related to cyberattacks will enhance the effort towards a more detailed assessment procedure.
Comparison of Results with Existing Studies in the Transportation Domain
The results of the proposed probability-based ranking approach (see Section 4.2) should be compared with existing studies in the transportation domain, as discussed in Section 2. The existing studies follow a centrality measure-based ranking in order to determine the nodes that should be removed in the transportation network. Therefore, considering the case study (see Section 4), we compare the results of the probability-based ranking with the centrality measure-based ranking.
The results of the proposed approach (i.e., probability-based ranking table) differ from existing studies in the transportation domain (i.e., [32]). Table 11 presents the differences in the results between the proposed ranking table and the two other centrality-based ranking approaches. The two basic centrality measures are compared, namely node degree (i.e., k(i) and betweenness centrality (i.e., B(i)), as described in previous sections [32]). Specifically, node degree considers the number of edges connected to the node, as shown in Equation (5), and betweenness centrality measures the extent to which a node lies on paths between other nodes acting as a bridge, as shown in Equation (5).
where aij represents the existence of connection between node i–j in an adjacency matrix A.
where σjk represents the number of shortest paths between nodes j and k, and σjk(i) denotes the number of shortest paths between nodes j and k that are passing through node i.
6. Conclusions
Transportation networks are of vital importance for societies’ functioning and well-being. Transportation networks are gradually being transformed into cyber–physical systems due to the merging of IoT-enabled devices. IoT devices improve the operation of transport networks but also increase their susceptibility to cyber–physical attacks. However, there is a lack of studies on integrated physical and cyber systems, especially when assessing the combined vulnerabilities of these systems. To address this gap, in this paper a novel vulnerability risk assessment approach was proposed. The approach was based on a BN attack graph that enables the modelling of vulnerability states in both the physical and cyber space. To enable accurate assessment of vulnerability states, the ratio PI was proposed. This ratio incorporates a detailed attacker profile and control barriers, and may do so in either the physical or cyber space. The development of probabilistic-based ranking assists in the identification of most vulnerable nodes and the measurement of transportation network vulnerability as a drop in efficiency due to a ranking removal. A case study of a transportation network subjected to a cyber–physical attack demonstrates the usefulness of the approach. Results from Monte Carlo simulations and correlation coefficient analysis indicate that IoT-enabled transportation that lacks control barriers in the physical and cyber space are probabilistically more vulnerable. Based on the developed probability-based ranking table, vulnerability was measured as drop in efficiency. Additionally, sensitivity analysis showcased the impact of the considered attacker profile characteristics in the approach. The comparison with ranking tables of other studies highlighted the usefulness of the proposed approach towards the selection of the removed nodes. Overall, it has been demonstrated that the proposed vulnerability assessment approach for transportation networks subjected to cyber–physical attacks can constitute a valuable method for stakeholders who want to integrate the cyber domain into the assessment process of their transportation network.
Author Contributions
All the researchers collaborated for the main activities of the study, main contributions may be identified as follows: Conceptualization, K.N., D.P.M., L.P. and B.M.-P.; methodology, K.N., D.P.M., L.P. and B.M.-P.; software, K.N.; validation, K.N., D.P.M., L.P. and B.M.-P.; formal analysis, K.N., D.P.M., L.P. and B.M.-P.; investigation, K.N., D.P.M., L.P. and B.M.-P.; resources, D.P.M. and L.P.; data curation, K.N.; writing—original draft preparation, K.N.; writing—review and editing, K.N., D.P.M., L.P. and B.M.-P.; visualization, K.N.; supervision, K.N., D.P.M., L.P. and B.M.-P.; project administration, K.N., D.P.M., L.P. and B.M.-P.; funding acquisition, D.P.M. and L.P. All authors have read and agreed to the published version of the manuscript.
Funding
This research was funded by the University College of Dublin Advanced Ph.D. Scholarship Scheme 41063.
Institutional Review Board Statement
Not applicable.
Data Availability Statement
Data are contained within the article.
Acknowledgments
This work is financially supported by a University College of Dublin Advanced Ph.D. Scholarship Scheme.
Conflicts of Interest
The authors declare no conflict of interest.
References
- Ding, R.; Ujang, N.; bin Hamid, H.; Abd Manan, M.S.; Li, R.; Wu, J. Heuristic urban transportation network design method, a multilayer coevolution approach. Phys. A Stat. Mech. Its Appl. 2017, 479, 71–83. [Google Scholar] [CrossRef]
- Mattsson, L.-G.; Jenelius, E. Vulnerability and resilience of transport systems–A discussion of recent research. Transp. Res. Part A Policy Pract. 2015, 81, 16–34. [Google Scholar] [CrossRef]
- Rebally, A.; Valeo, C.; He, J.; Saidi, S. Flood Impact Assessments on Transportation Networks: A Review of Methods and Associated Temporal and Spatial Scales. Front. Sustain. Cities 2021, 3, 732181. [Google Scholar] [CrossRef]
- Chen, M.; Mangalathu, S.; Jeon, J.-S. Bridge fragilities to network fragilities in seismic scenarios: An integrated approach. Eng. Struct. 2021, 237, 112212. [Google Scholar] [CrossRef]
- Murray-Tuite, P.M.; Fei, X. A methodology for assessing transportation network terrorism risk with attacker and defender interactions. Comput. Aided Civ. Infrastruct. Eng. 2010, 25, 396–410. [Google Scholar] [CrossRef]
- Zantalis, F.; Koulouras, G.; Karabetsos, S.; Kandris, D. A review of machine learning and IoT in smart transportation. Future Internet 2019, 11, 94. [Google Scholar] [CrossRef] [Green Version]
- Gupta, M.; Sandhu, R. Authorization Framework for Secure Cloud Assisted Connected Cars and Vehicular Internet of Things. In Proceedings of the 23nd ACM on Symposium on Access Control Models and Technologies, Indianapolis, IN, USA, 13–15 June 2018; Association for Computing Machinery: New York, NY, USA, 2018; pp. 193–204. [Google Scholar]
- Koursari, E.; Wallace, S.; Xu, Y.; Michalis, P.; Valyrakis, M. Smart bridge: Towards robust monitoring of environmental hazards. In River Flow 2020; CRC Press: Boca Raton, FL, USA, 2020; pp. 886–890. [Google Scholar]
- Mishra, M.; Lourenço, P.B.; Ramana, G.V. Structural health monitoring of civil engineering structures by using the internet of things: A review. J. Build. Eng. 2022, 48, 103954. [Google Scholar] [CrossRef]
- Putra, A.S.; Warnars, H.L.H.S. Intelligent Traffic Monitoring System (ITMS) for Smart City Based on IoT Monitoring. In Proceedings of the 2018 Indonesian Association for Pattern Recognition International Conference (INAPR), Jakarta, Indonesia, 7–8 September 2018; IEEE: Piscataway, NJ, USA, 2018; pp. 161–165. [Google Scholar]
- Gupta, M.; Sandhu, R. Towards Activity-Centric Access Control for Smart Collaborative Ecosystems. In Proceedings of the 26th ACM Symposium on Access Control Models and Technologies, Virtual Event, Spain, 16–18 June 2021; Association for Computing Machinery: New York, NY, USA; pp. 155–164.
- Gupta, M.; Awaysheh, F.M.; Benson, J.; Alazab, M.; Patwa, F.; Sandhu, R. An attribute-based access control for cloud enabled industrial smart vehicles. IEEE Trans. Ind. Inform. 2020, 17, 4288–4297. [Google Scholar] [CrossRef]
- Singh, S.K.; Jeong, Y.-S.; Park, J.H. A deep learning-based IoT-oriented infrastructure for secure smart city. Sustain. Cities Soc. 2020, 60, 102252. [Google Scholar] [CrossRef]
- Mahmoud, R.; Yousuf, T.; Aloul, F.; Zualkernan, I. Internet of Things (IoT) Security: Current Status, Challenges and Prospective Measures. In Proceedings of the 2015 10th International Conference for Internet Technology and Secured Transactions (ICITST), London, UK, 14–16 December 2015; IEEE: Piscataway, NJ, USA, 2015; pp. 336–341. [Google Scholar]
- Landaluce, H.; Arjona, L.; Perallos, A.; Falcone, F.; Angulo, I.; Muralter, F. A review of IoT sensing applications and challenges using RFID and wireless sensor networks. Sensors 2020, 20, 2495. [Google Scholar] [CrossRef]
- Kouicem, D.E.; Bouabdallah, A.; Lakhlef, H. Internet of things security: A top-down survey. Comput. Netw. 2018, 141, 199–221. [Google Scholar] [CrossRef] [Green Version]
- Loukas, G. Cyber-Physical Attacks: A Growing Invisible Threat; Butterworth-Heinemann: Oxford, UK, 2015. [Google Scholar]
- Ntafloukas, K.; McCrum, D.P.; Pasquale, L. A Cyber-Physical Risk Assessment Approach for Internet of Things Enabled Transportation Infrastructure. Appl. Sci. 2022, 12, 9241. [Google Scholar] [CrossRef]
- Ntafloukas, K.; McCrum, D.P.; Pasquale, L. A Risk Assessment Approach for IoT Enabled Transportation Infrastructure Subjected to Cyber-Physical Attacks. In Proceedings of the 32nd European Safety and Reliability Conference, Dublin, Ireland, 28 August–1 September 2022; Research Publishing: Singapore, 2022. [Google Scholar]
- Liveri, D.; Theocharidou, M.; Naydenov, R. Railway Cybersecurity: Security Measures in the Railway Transport Sector; ENISA: Athens, Greece, 2020.
- Perti, A.; Singh, A.; Sinha, A.; Srivastava, P.K. Security Risks and Challenges in IoT-Based Applications. In Proceedings of the International Conference on Big Data, Machine Learning and Their Applications: ICBMA 2019, Prayagraj, India, 29–31 May 2020; Springer: Singapore, 2021; pp. 99–111. [Google Scholar]
- Gu, Y.; Fu, X.; Liu, Z.; Xu, X.; Chen, A. Performance of transportation network under perturbations: Reliability, vulnerability, and resilience. Transp. Res. Part E Logist. Transp. Rev. 2020, 133, 101809. [Google Scholar] [CrossRef]
- Li, Z.; Jin, D.; Hannon, C.; Shahidehpour, M.; Wang, J. Assessing and mitigating cybersecurity risks of traffic light systems in smart cities. IET Cyber-Phys. Syst. Theory Appl. 2016, 1, 60–69. [Google Scholar] [CrossRef] [Green Version]
- Zheng, X.; Pan, L.; Chen, H.; Wang, P. Investigating Security Vulnerabilities in Modern Vehicle Systems. In Proceedings of the International Conference on Applications and Techniques in Information Security, Cairns, Australia, 26–28 October 2016; Springer: Berlin/Heidelberg, Germany, 2016; pp. 29–40. [Google Scholar]
- Gupta, M.; Benson, J.; Patwa, F.; Sandhu, R. Secure V2V and V2I communication in intelligent transportation using cloudlets. IEEE Trans. Serv. Comput. 2020, 15, 1912–1925. [Google Scholar] [CrossRef]
- CIPSEC Enhancing Critical Infrastructure Protection with Innovative SECurity Framework. Available online: https://www.cipsec.eu/ (accessed on 9 February 2023).
- RESOLUTE RESilience Management Guidelines and Operationalization Applied to Urban Transport Environment. Available online: https://www.resolute-project.eu/ (accessed on 9 February 2023).
- RESIST RESilient Transport InfraSTructure to Extreme Events. Available online: https://www.resistproject.eu/ (accessed on 9 February 2023).
- PRECINCT. Preparedness and Resilience Enforcement for Critical INfrastructure Cascading Cyberphysical Threats and Effects with Focus on District or Regional Protection. Available online: https://www.precinct.info/en/publications/ (accessed on 9 February 2023).
- Lou, Y.; Zhang, L. Defending transportation networks against random and targeted attacks. Transp. Res. Rec. 2011, 2234, 31–40. [Google Scholar] [CrossRef]
- Zhang, X.; Miller-Hooks, E.; Denny, K. Assessing the role of network topology in transportation network resilience. J. Transp. Geogr. 2015, 46, 35–45. [Google Scholar] [CrossRef] [Green Version]
- López, F.A.; Páez, A.; Carrasco, J.A.; Ruminot, N.A. Vulnerability of nodes under controlled network topology and flow autocorrelation conditions. J. Transp. Geogr. 2017, 59, 77–87. [Google Scholar] [CrossRef]
- Candelieri, A.; Galuzzi, B.G.; Giordani, I.; Archetti, F. Vulnerability of public transportation networks against directed attacks and cascading failures. Public Transp. 2019, 11, 27–49. [Google Scholar] [CrossRef] [Green Version]
- Husák, M.; Komárková, J.; Bou-Harb, E.; Čeleda, P. Survey of attack projection, prediction, and forecasting in cyber security. IEEE Commun. Surv. Tutor. 2018, 21, 640–660. [Google Scholar] [CrossRef] [Green Version]
- Nist, National Vulnerability Database. Available online: https://nvd.nist.gov/ (accessed on 9 February 2023).
- Common Vulnerability Scoring System Version 3.1. Available online: https://www.first.org/cvss/specification-document (accessed on 9 February 2023).
- MITRE ATT&CK. Available online: https://attack.mitre.org/ (accessed on 9 February 2023).
- Melamed, T. An active man-in-the-middle attack on bluetooth smart devices. Saf. Secur. Stud. 2018, 15, 2018. [Google Scholar] [CrossRef] [Green Version]
- Liu, Y.; Man, H. Network Vulnerability Assessment Using Bayesian Networks. In Proceedings of theData Mining, Intrusion Detection, Information Assurance, and Data Networks Security 2005, Orlando, FL, USA, 28–29 March 2005; SPIE: Bellingham, WA, USA, 2005; pp. 61–71. [Google Scholar]
- Avci, O.; Ozbulut, O. Threat and vulnerability risk assessment for existing subway stations: A simplified approach. Case Stud. Transp. Policy 2018, 6, 663–673. [Google Scholar] [CrossRef]
- Taylor, M. Vulnerability Analysis for Transportation Networks; Elsevier: Amsterdam, The Netherlands, 2017. [Google Scholar]
- Martinez-Pastor, B.; Nogal, M.; O’Connor, A.; Teixeira, R. Identifying critical and vulnerable links: A new approach using the Fisher information matrix. Int. J. Crit. Infrastruct. Prot. 2022, 39, 100570. [Google Scholar] [CrossRef]
- von Ferber, C.; Holovatch, T.; Holovatch, Y. Attack vulnerability of public transport networks. In Traffic and Granular Flow’07; Springer: Berlin/Heidelberg, Germany, 2009; pp. 721–731. [Google Scholar]
- Gupta, M.; Benson, J.; Patwa, F.; Sandhu, R. Dynamic Groups and Attribute-Based Access Control for Next-Generation Smart Cars. In Proceedings of the Ninth ACM Conference on Data and Application Security and Privacy, Dallas, TX, USA, 25–27 March 2019; Association for Computing Machinery: New York, NY, USA, 2019; pp. 61–72. [Google Scholar]
- Zhang, D.-m.; Du, F.; Huang, H.; Zhang, F.; Ayyub, B.M.; Beer, M. Resiliency assessment of urban rail transit networks: Shanghai metro as an example. Saf. Sci. 2018, 106, 230–243. [Google Scholar] [CrossRef]
- Cai, H.; Zhu, J.; Yang, C.; Fan, W.; Xu, T. Vulnerability analysis of metro network incorporating flow impact and capacity constraint after a disaster. J. Urban Plan. Dev. 2017, 143, 04016031. [Google Scholar] [CrossRef]
- Liu, J.; Lu, H.; Chen, M.; Wang, J.; Zhang, Y. Macro perspective research on transportation safety: An empirical analysis of network characteristics and vulnerability. Sustainability 2020, 12, 6267. [Google Scholar] [CrossRef]
- Taylor, M.A. Remoteness and accessibility in the vulnerability analysis of regional road networks. Transp. Res. Part A Policy Pract. 2012, 46, 761–771. [Google Scholar] [CrossRef]
- Ghena, B.; Beyer, W.; Hillaker, A.; Pevarnek, J.; Halderman, J.A. Green Lights Forever: Analyzing the Security of Traffic Infrastructure. In Proceedings of the 8th USENIX Workshop on Offensive Technologies (WOOT 14), San Diego, CA, USA, 19 August 2014; USENIX Association: Berkeley, CA, USA, 2014. [Google Scholar]
- Laszka, A.; Potteiger, B.; Vorobeychik, Y.; Amin, S.; Koutsoukos, X. Vulnerability of Transportation Networks to Traffic-Signal Tampering. In Proceedings of the 2016 ACM/IEEE 7th International Conference on Cyber-Physical Systems (ICCPS), Vienna, Austria, 11–14 April 2016; IEEE: Piscataway, NJ, USA, 2016; pp. 1–10. [Google Scholar]
- Daganzo, C.F. The cell transmission model: A dynamic representation of highway traffic consistent with the hydrodynamic theory. Transp. Res. Part B Methodol. 1994, 28, 269–287. [Google Scholar] [CrossRef]
- Vivek, S.; Conner, H. Urban road network vulnerability and resilience to large-scale attacks. Saf. Sci. 2022, 147, 105575. [Google Scholar] [CrossRef]
- Musa, T.; Yeo, K.C.; Azam, S.; Shanmugam, B.; Karim, A.; De Boer, F.; Nur, F.N.; Faisal, F. Analysis of Complex Networks for Security Issues Using Attack Graph. In Proceedings of the 2019 International Conference on Computer Communication and Informatics (ICCCI), Coimbatore, India, 25–27 January 2022; IEEE: Piscataway, NJ, USA, 2019; pp. 1–6. [Google Scholar]
- Sadlek, L.; Čeleda, P.; Tovarňák, D. Identification of Attack Paths Using Kill Chain and Attack Graphs. In Proceedings of the NOMS 2022–2022 IEEE/IFIP Network Operations and Management Symposium, Budapest, Hungary, 25–29 April 2022; IEEE: Piscataway, NJ, USA, 2022; pp. 1–6. [Google Scholar]
- Hutchins, E.M.; Amin, R.M.; Cloppert, M.J. Intelligence-driven computer network defense informed by analysis of adversary campaigns and intrusion kill chains. Lead. Issues Inf. Warf. Secur. Res. 2011, 1, 80. [Google Scholar]
- Shin, J.; Son, H.; Heo, G. Development of a cyber security risk model using Bayesian networks. Reliab. Eng. Syst. Saf. 2015, 134, 208–217. [Google Scholar] [CrossRef]
- Sheehan, B.; Murphy, F.; Mullins, M.; Ryan, C. Connected and autonomous vehicles: A cyber-risk classification framework. Transp. Res. Part A Policy Pract. 2019, 124, 523–536. [Google Scholar] [CrossRef]
- Comert, G.; Pollard, J.; Nicol, D.M.; Palani, K.; Vignesh, B. Modeling cyber attacks at intelligent traffic signals. Transp. Res. Rec. 2018, 2672, 76–89. [Google Scholar] [CrossRef] [Green Version]
- Derrible, S.; Kennedy, C. Applications of graph theory and network science to transit network design. Transp. Rev. 2011, 31, 495–519. [Google Scholar] [CrossRef]
- CAPEC Common Attack Pattern Enumeration and Classification. Available online: https://capec.mitre.org/ (accessed on 9 February 2023).
- Burhan, M.; Rehman, R.A.; Khan, B.; Kim, B.-S. IoT elements, layered architectures and security issues: A comprehensive survey. Sensors 2018, 18, 2796. [Google Scholar] [CrossRef] [Green Version]
- Olawumi, O.; Haataja, K.; Asikainen, M.; Vidgren, N.; Toivanen, P. Three practical attacks against ZigBee security: Attack scenario definitions, practical experiments, countermeasures, and lessons learned. In Proceedings of the 2014 14th International Conference on Hybrid Intelligent Systems, Hawally, Kuwait, 14–16 December 2014; IEEE: Piscataway, NJ, USA, 2014; pp. 199–206. [Google Scholar]
- Neapolitan, R.E. Learning Bayesian Networks; Pearson Prentice Hall: Upper Saddle River, NI, USA, 2004; Volume 38. [Google Scholar]
- Latora, V.; Marchiori, M. Efficient behavior of small-world networks. Phys. Rev. Lett. 2001, 87, 198701. [Google Scholar] [CrossRef] [Green Version]
- Kure, H.I.; Islam, S.; Razzaque, M.A. An integrated cyber security risk management approach for a cyber-physical system. Appl. Sci. 2018, 8, 898. [Google Scholar] [CrossRef] [Green Version]
- Ben-Asher, N.; Gonzalez, C. Effects of cyber security knowledge on attack detection. Comput. Hum. Behav. 2015, 48, 51–61. [Google Scholar] [CrossRef]
- CVE Common Vulnerabilities and Exposures. Available online: https://cve.mitre.org/cve/search_cve_list.html (accessed on 9 February 2022).
- Krishna, R.R.; Priyadarshini, A.; Jha, A.V.; Appasani, B.; Srinivasulu, A.; Bizon, N. State-of-the-art review on IoT threats and attacks: Taxonomy, challenges and solutions. Sustainability 2021, 13, 9463. [Google Scholar] [CrossRef]
- Zeng, J.; Wu, S.; Chen, Y.; Zeng, R.; Wu, C. Survey of attack graph analysis methods from the perspective of data and knowledge processing. Secur. Commun. Netw. 2019, 2019, 2031063. [Google Scholar] [CrossRef] [Green Version]
- Rocchetto, M.; Tippenhauer, N.O. On Attacker Models and Profiles for Cyber-Physical Systems. In Proceedings of the European Symposium on Research in Computer Security, Heraklion, Greece, 26–30 September 2016; Springer: Berlin/Heidelberg, Germany, 2016; pp. 427–449. [Google Scholar]
- NIST. Guide for Conducting Risk Assessments; NIST: Gaithersburg, MD, USA, 2012.
- Zhang, R.; Li, D. Development of Risk Assessment Model in Construction Project Using Fuzzy Expert System. In Proceedings of the 2011 2nd IEEE International Conference on Emergency Management and Management Sciences, Beijing, China, 8–10 August 2011; IEEE: Piscataway, NJ, USA, 2011; pp. 866–869. [Google Scholar]
- Sarker, I.H.; Kayes, A.; Badsha, S.; Alqahtani, H.; Watters, P.; Ng, A. Cybersecurity data science: An overview from machine learning perspective. J. Big Data 2020, 7, 1–29. [Google Scholar] [CrossRef]
- Ben Othmane, L.; Ranchal, R.; Fernando, R.; Bhargava, B.; Bodden, E. Incorporating attacker capabilities in risk estimation and mitigation. Comput. Secur. 2015, 51, 41–61. [Google Scholar] [CrossRef]
- Loveček, T.; Veľas, A.; Ďurovec, M. Level of Protection of Critical Infrastructure in the Slovak Republic. In Proceedings of the International Conference on Engineering Science and Production Management, Tatranská Štrba, Slovakia, 16–17 April 2015; CRC Press: Boca Raton, FL, USA, 2015; pp. 163–168. [Google Scholar]
- Neshenko, N.; Bou-Harb, E.; Crichigno, J.; Kaddoum, G.; Ghani, N. Demystifying IoT security: An exhaustive survey on IoT vulnerabilities and a first empirical look on Internet-scale IoT exploitations. IEEE Commun. Surv. Tutor. 2019, 21, 2702–2733. [Google Scholar] [CrossRef]
- Sachidananda, V.; Siboni, S.; Shabtai, A.; Toh, J.; Bhairav, S.; Elovici, Y. Let the Cat out of the Bag: A Holistic Approach Towards Security Analysis of the Internet of Things. In Proceedings of the 3rd ACM International Workshop on IoT Privacy, Trust, and Security, Abu Dhabi, United Arab Emirates, 2 April 2017; Association for Computing Machinery: New York, NY, USA, 2017; pp. 3–10. [Google Scholar]
- Osei-Asamoah, A.; Lownes, N.E. Complex network method of evaluating resilience in surface transportation networks. Transp. Res. Rec. 2014, 2467, 120–128. [Google Scholar] [CrossRef]
- Ali, A.I.; Partal, S.Z.; Kepke, S.; Partal, H.P. ZigBee and LoRa Based Wireless Sensors for Smart Environment and IoT Applications. In Proceedings of the 2019 1st Global Power, Energy and Communication Conference (GPECOM), Urgup, Turkey, 12–15 June 2019; IEEE: Piscataway, NJ, USA, 2019; pp. 19–23. [Google Scholar]
- Meneghello, F.; Calore, M.; Zucchetto, D.; Polese, M.; Zanella, A. IoT: Internet of threats? A survey of practical security vulnerabilities in real IoT devices. IEEE Internet Things J. 2019, 6, 8182–8201. [Google Scholar] [CrossRef]
- Chae, M.; Yoo, H.; Kim, J.; Cho, M.-Y. Development of a wireless sensor network system for suspension bridge health monitoring. Autom. Constr. 2012, 21, 237–252. [Google Scholar] [CrossRef]
- Vidgren, N.; Haataja, K.; Patino-Andres, J.L.; Ramirez-Sanchis, J.J.; Toivanen, P. Security Threats in ZigBee-Enabled Systems: Vulnerability Evaluation, Practical Experiments, Countermeasures, and Lessons Learned. In Proceedings of the 2013 46th Hawaii International Conference on System Sciences, Wailea, HI, USA, 7–10 January 2013; IEEE: Piscataway, NJ, USA, 2013; pp. 5132–5138. [Google Scholar]
- Khanji, S.; Iqbal, F.; Hung, P. ZigBee Security Vulnerabilities: Exploration and Evaluating. In Proceedings of the 2019 10th International Conference on Information and Communication Systems (ICICS), Irbid, Jordan, 11–13 June 2019; IEEE: Piscataway, NJ, USA, 2019; pp. 52–57. [Google Scholar]
- Cao, X.; Shila, D.M.; Cheng, Y.; Yang, Z.; Zhou, Y.; Chen, J. Ghost-in-zigbee: Energy depletion attack on zigbee-based wireless networks. IEEE Internet Things J. 2016, 3, 816–829. [Google Scholar] [CrossRef]
- Razouk, W.; Crosby, G.V.; Sekkaki, A. New security approach for ZigBee weaknesses. Procedia Comput. Sci. 2014, 37, 376–381. [Google Scholar] [CrossRef] [Green Version]
- Collins, S.; McCombie, S. Stuxnet: The emergence of a new cyber weapon and its implications. J. Polic. Intell. Count. Terror. 2012, 7, 80–91. [Google Scholar] [CrossRef]
- Kilger, M. Integrating Human Behavior into the Development of Future Cyberterrorism Scenarios. In Proceedings of the 2015 10th International Conference on Availability, Reliability and Security, Toulouse, France, 24–27 August 2015; IEEE: Piscataway, NJ, USA, 2015; pp. 693–700. [Google Scholar]
- Raychaudhuri, S. Introduction to Monte Carlo Simulation. In Proceedings of the 2008 Winter Simulation Conference, Miami, FL, USA, 7–10 December 2008; IEEE: Piscataway, NJ, USA, 2008; pp. 91–100. [Google Scholar]
- Benesty, J.; Chen, J.; Huang, Y.; Cohen, I. Pearson correlation coefficient. In Noise Reduction in Speech Processing; Springer: Berlin/Heidelberg, Germany, 2009; pp. 1–4. [Google Scholar]
- Foglietta, C.; Palazzo, C.; Santini, R.; Panzieri, S. Assessing Cyber risk Using the CISIApro Simulator. In Proceedings of the International Conference on Critical Infrastructure Protection, Arlington, VA, USA, 16–18 March 2015; Springer: Berlin/Heidelberg, Germany, 2015; pp. 315–331. [Google Scholar]
- Maschmeyer, L.; Deibert, R.J.; Lindsay, J.R. A tale of two cybers-how threat reporting by cybersecurity firms systematically underrepresents threats to civil society. J. Inf. Technol. Politics 2021, 18, 1–20. [Google Scholar] [CrossRef]
Figure 1.
An abstract cyber–physical transportation network example.

Figure 2.
Process diagram of vulnerability assessment approach.

Figure 3.
A Bayesian network attack graph example.

Figure 4.
Case study of a cyber–physical transportation network.

Figure 5.
Bayesian network attack graph and conditional probability table structure of Node 6.


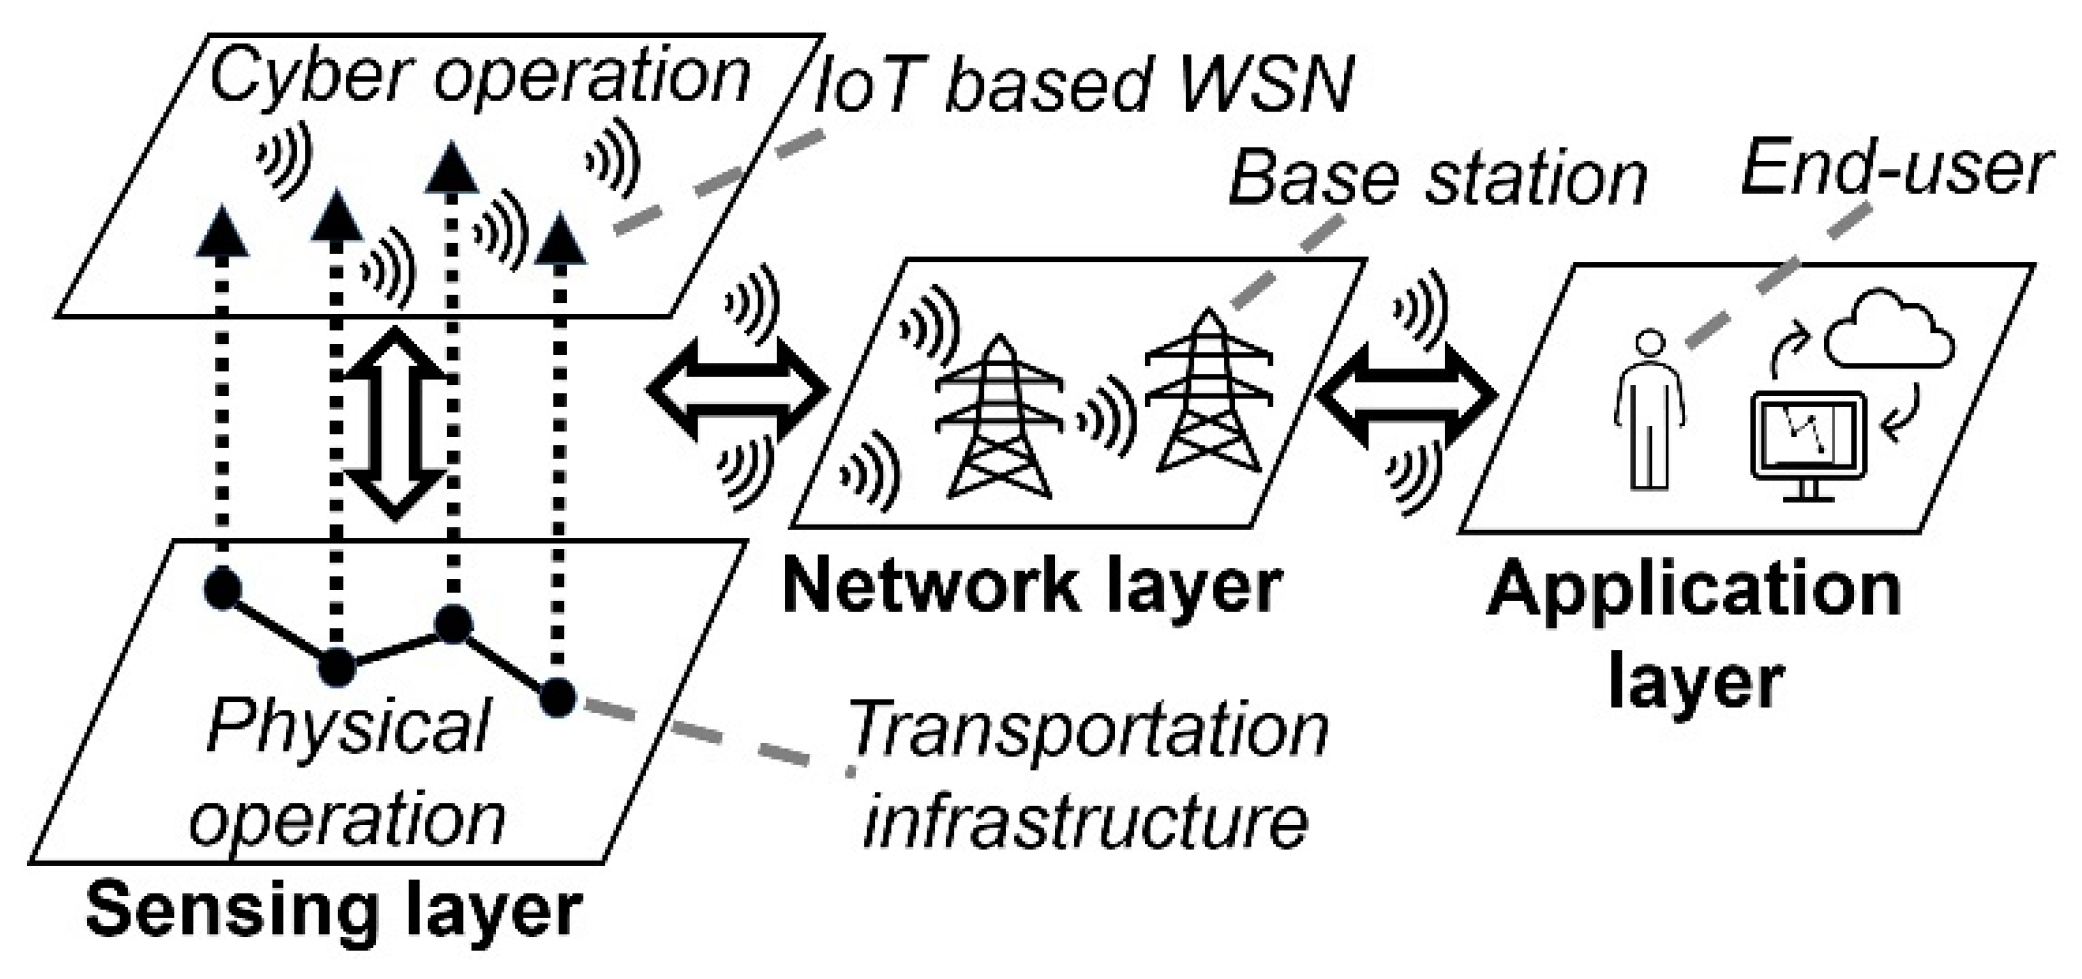
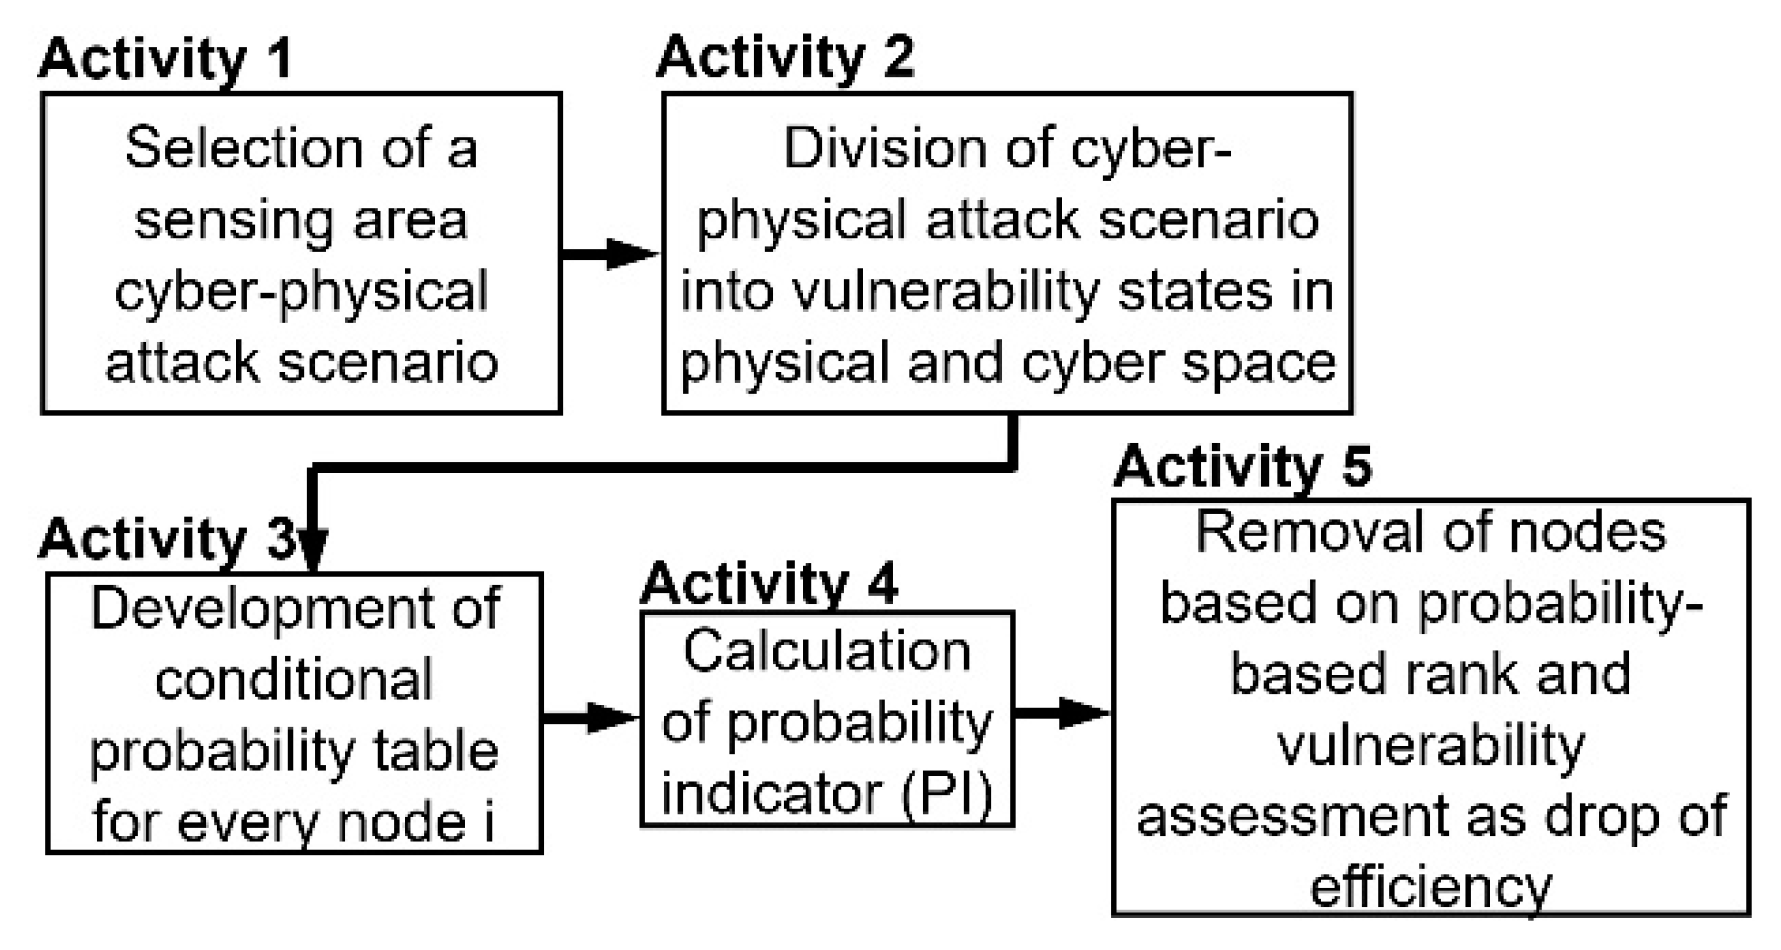
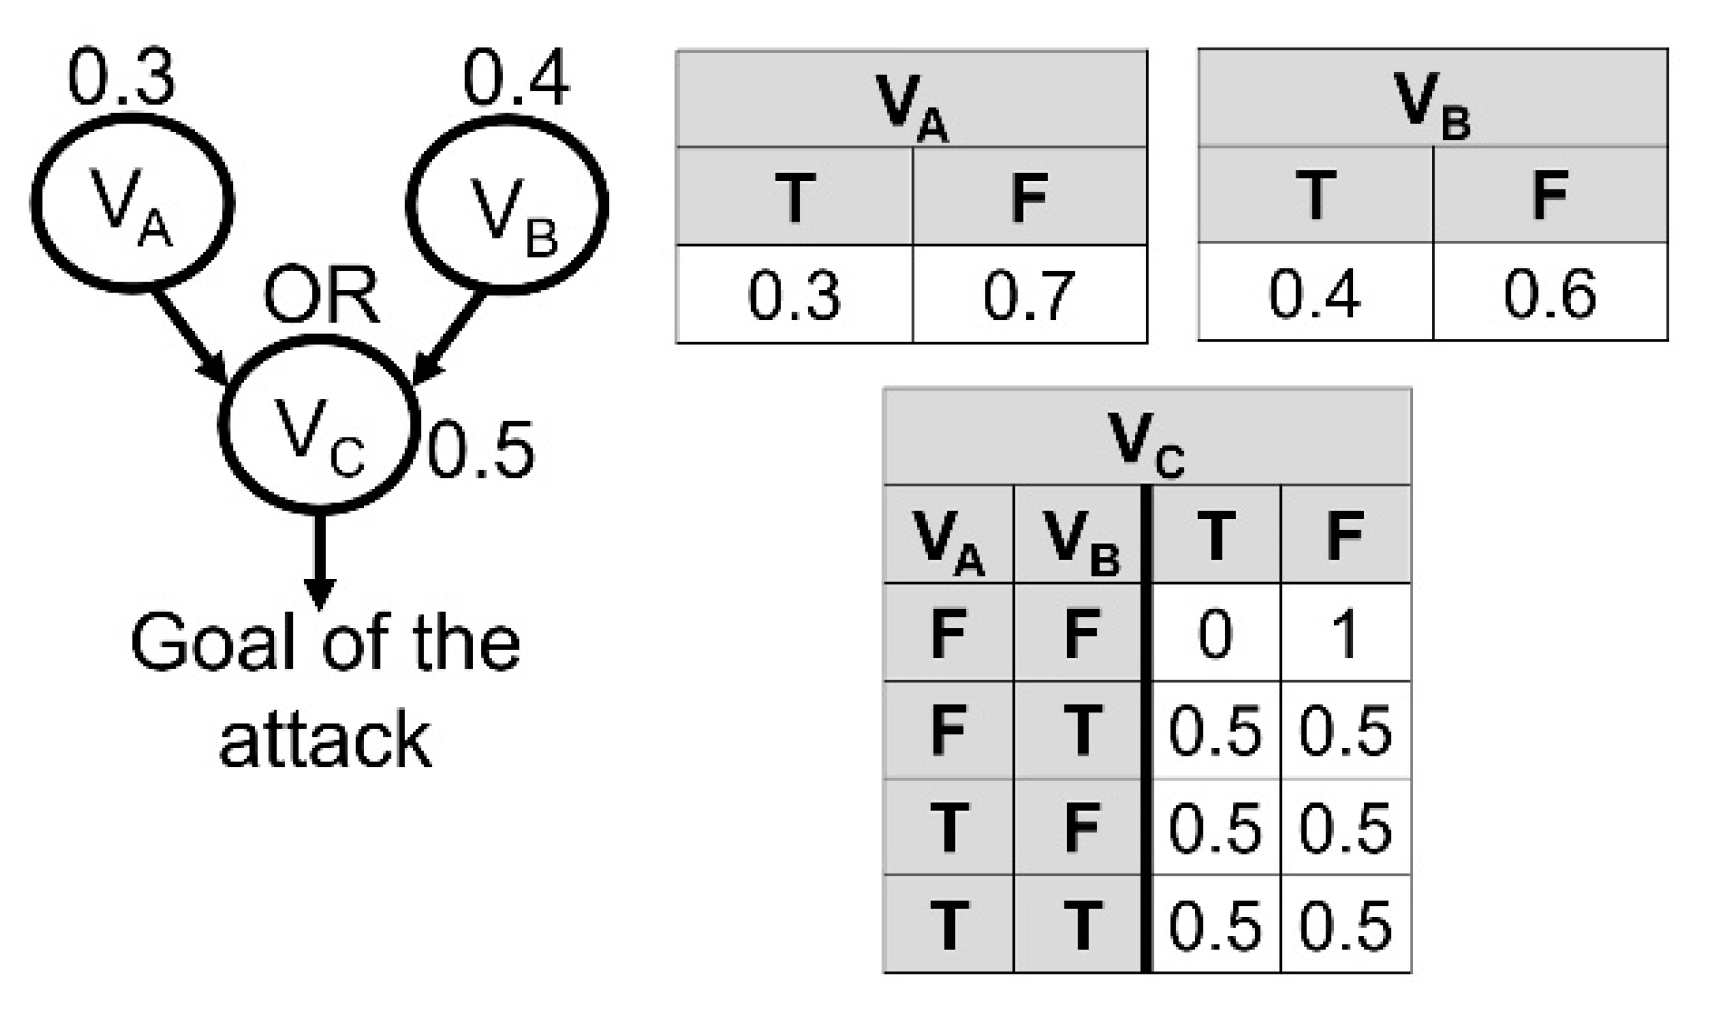
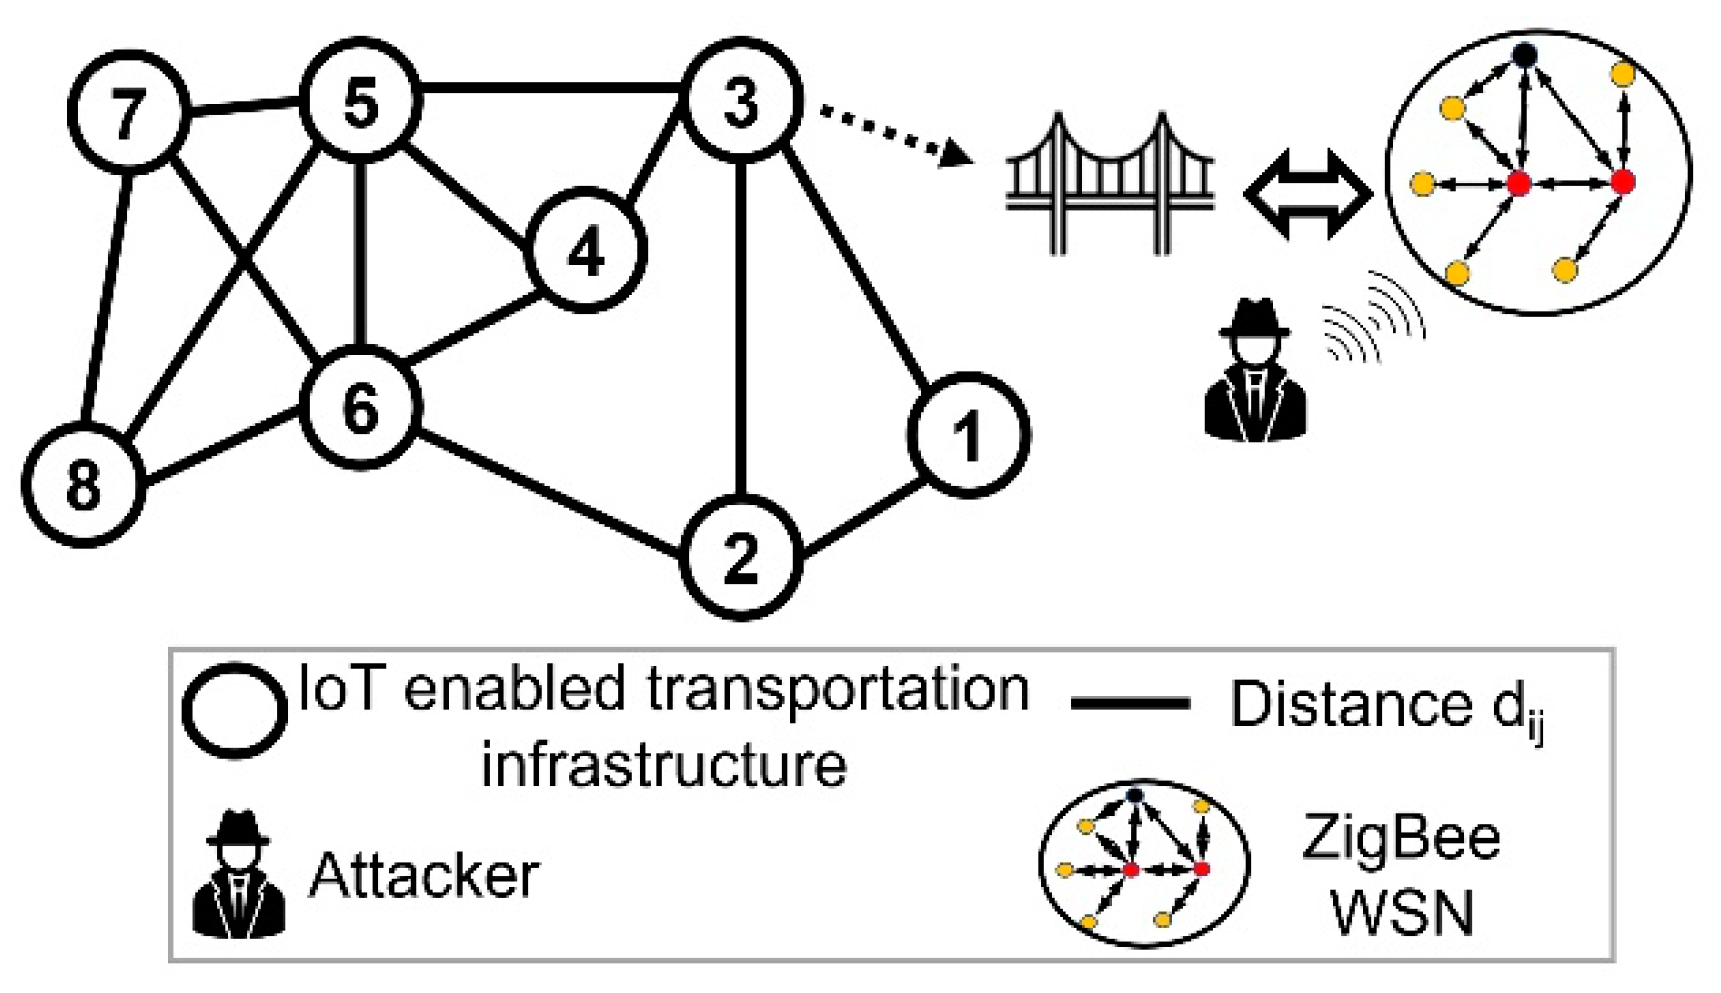
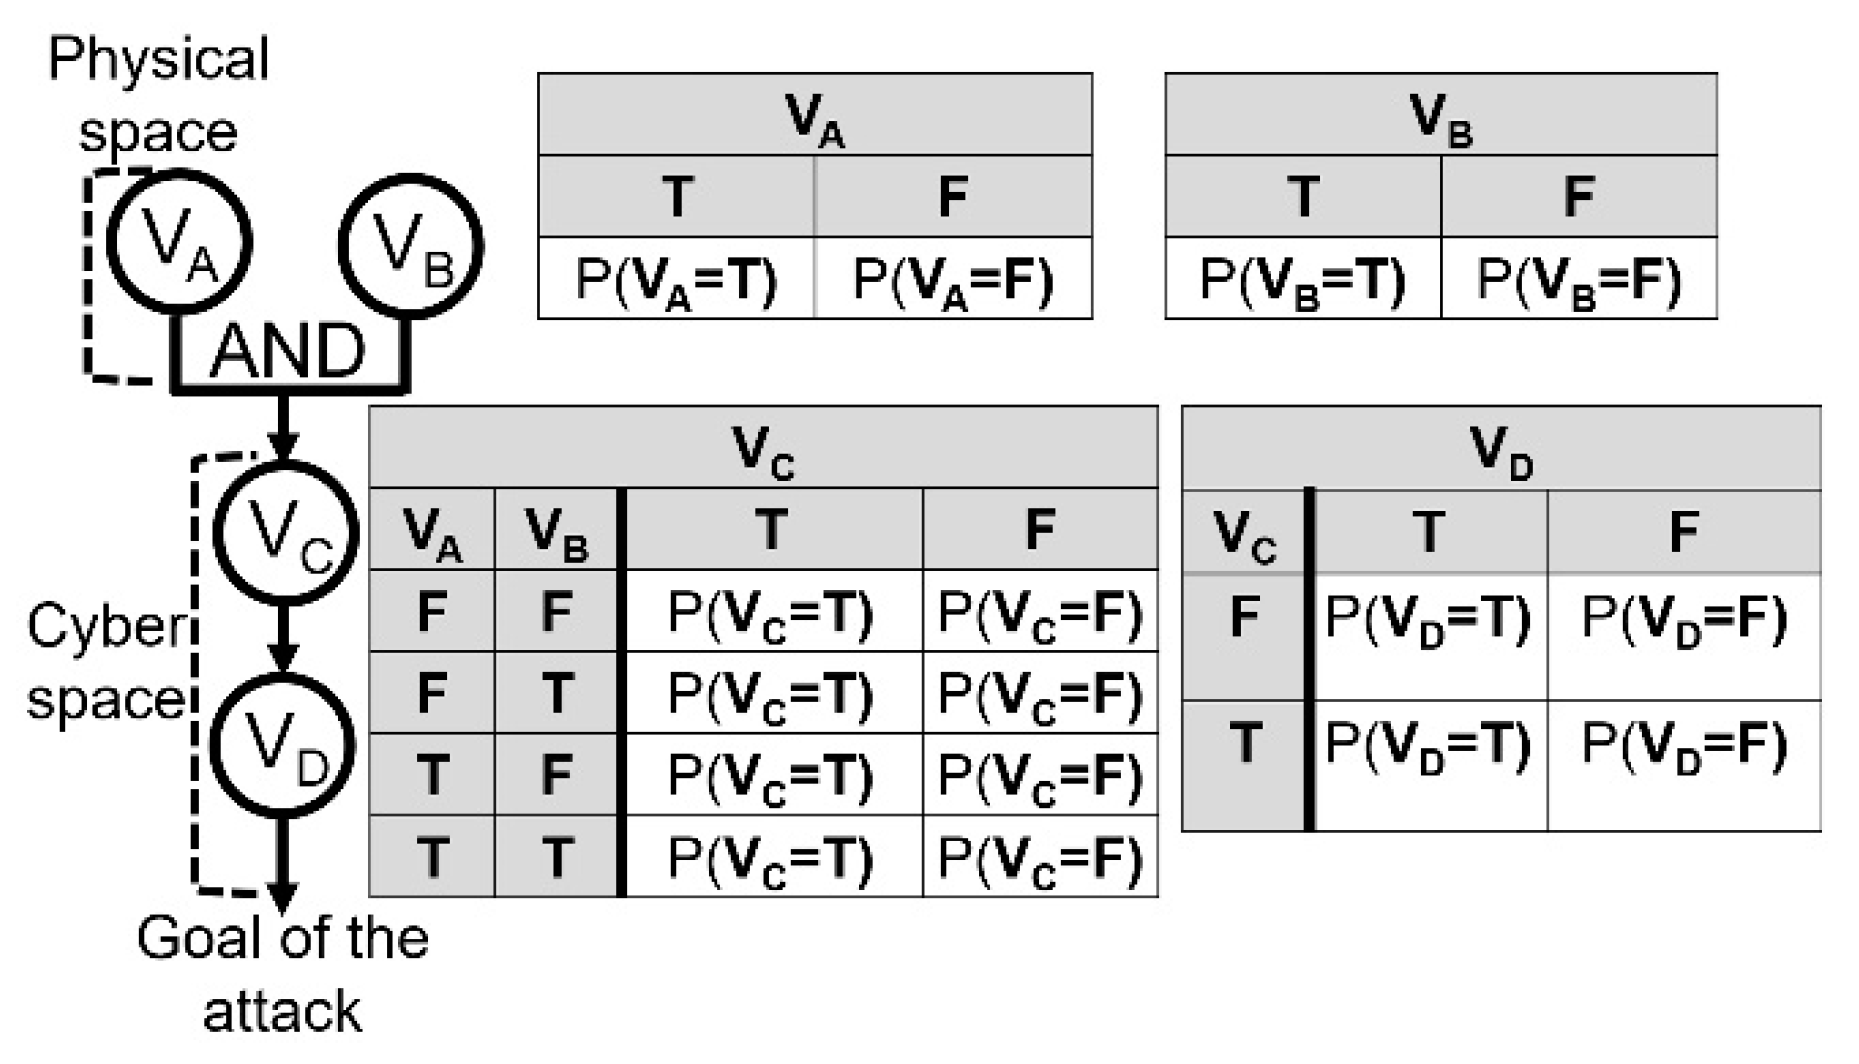
Table 1.
Rating scale per level Xi, and importance index Wi.
| Qualitative Rating Scale/Level Xi | Qualitative Rating Scale/Importance Index Wi |
|---|---|
| Low/0.01–1 | Very Low/0.00–0.20 |
| Low/0.21–0.40 | |
| Medium/1–2 | Medium/0.41–0.60 |
| High/0.61–0.80 | |
| High/2–3 | Very High/0.81–1.0 |
Table 2.
Range of PI and probability scores.
| Range of PI | Range of Probability Scores |
|---|---|
| 0 ≤ PI ≤ 0.33 | 0 ≤ P(i) ≤ 0.25 |
| 0.33 ≤ PI ≤ 1 | 0.25 ≤ P(i) ≤ 0.50 |
| PI = 1 | P(i) = 0.50 |
| 1 ≤ PI ≤ 2 | 0.50 ≤ P(i) ≤ 0.75 |
| 2 ≤ PI < 3 | 0.75 ≤ P(i) ≤ 1.0 |
Table 3.
Operation of control barriers in physical and cyber space.
| Space | Operation |
|---|---|
| Physical | Technological operation (CCTV, motion detectors, line crossing, smart video-surveillance) |
| Non-technological or human operation (perimeter protection, continual inspection from trained personnel) | |
| Cyber | Authentication, encryption |
| Access control, energy resources | |
| Proper patch management, audit mechanisms |
Table 4.
Case study attacker characteristics level per vulnerability state.
| Vulnerability State | Characteristic/Level |
|---|---|
| A-B-C-D | Terrorism experience/(XTe = 2–3, WTe = 0.81–1.0), Psychology/(XPS = 2–3, WPS = 0.61–0.80) |
| C-D | Knowledge/(XKN = 2–3, WKN = 0.81–1.0) Resources/(XRE = 2–3, WRE = 0.01–0.20) |
Table 5.
Case study description and level of control barriers per vulnerability state for every node.
Table 5.
Case study description and level of control barriers per vulnerability state for every node.
| Number of Node | Vulnerability State | Control Barriers/Level (Xcb) |
|---|---|---|
| 1,8 | A AND B | Rare inspection from trained personnel/(Low, 1), Line crossing (Low, 1) |
| C, D | Standard security level/(Low, 1), Poor audit mechanisms/(Low, 1) | |
| 2,3 | A AND B | Frequent inspection from trained personnel/(Medium, 1–2), Motion detector, CCTV systems (Medium, 1–2) |
| C, D | Standard security level/(Low, 1), Frequent audit mechanisms/(Medium, 1–2) | |
| 4 | A | Continual inspection from trained personnel and perimeter protection/(High, 2–3), Lack of technological operation barriers—State B does not exist |
| C, D | High security level/(High, 2–3), Poor audit mechanisms/(Low, 1) | |
| 5 | A AND B | Frequent inspection from trained personnel/(Medium, 1–2), Motion detector, CCTV systems (Medium, 1–2) |
| C, D | High security level/(High, 2–3), Frequent audit mechanisms/(Medium, 1–2) | |
| 6 | A AND B | Continual inspection from trained personnel and perimeter protection/(High, 2–3), Smart video surveillance/(High, 2–3) |
| C, D | High security level/(High, 2–3), Continual audit mechanisms (High, 2–3) | |
| 7 | B | Lack of non-technological or human operation barriers—State A does not exist, Motion detector, CCTV systems (Medium, 1–2) |
| C, D | High security level/(High, 2–3), Poor audit mechanisms/(Low, 1) |
Table 6.
Example of calculation of PI and total probability score, for Node 4.
| Node | Vulnerability State | PI/Probability Range | Total Probability Score Based on Equation (1) |
|---|---|---|---|
| 4 | A | PIA = 1/P(A) = 0.50 | |
| C | PIC = 1/P(C) = 0.50 | ||
| D | 2 ≤ PID ≤ 3/P(D) = 0.875 |
Table 7.
Case study probability-based ranking of successful attack in a descending order.
| Node | Probability of Successful Attack for Node i, P(i) |
|---|---|
| 8 | P(8) = 0.60 |
| 1 | P(1) = 0.57 |
| 7 | P(7) = 0.27 |
| 3 | P(3) = 0.22 |
| 4 | P(4) = 0.22 |
| 2 | P(2) = 0.21 |
| 5 | P(5) = 0.12 |
| 6 | P(6) = 0.06 |
Table 8.
Case study sensitivity analysis results for Node 8, considering level of Knowledge.
| Node 8: Probability of Successful Attack/High Level of Knowledge | Node 8: Probability of Successful Attack/Low Level of Knowledge | Percentage Change |
|---|---|---|
| P(8) = 0.60 | P(8) = 0.30 | −50.0% |
Table 9.
Shortest path distances dij, for every pair of nodes.
| dij | Node 1 | Node 2 | Node 3 | Node 4 | Node 5 | Node 6 | Node 7 | Node 8 |
|---|---|---|---|---|---|---|---|---|
| Node 1 | d11 = 0 | d12 = 1 | 1 | 2 | 2 | 2 | 3 | d18 = 3 |
| Node 2 | 1 | 0 | 1 | 2 | 2 | 1 | 3 | 2 |
| Node 3 | 1 | 1 | 0 | 1 | 1 | 2 | 2 | 3 |
| Node 4 | 2 | 2 | 1 | 0 | 1 | 1 | 2 | 2 |
| Node 5 | 2 | 2 | 1 | 1 | 0 | 1 | 1 | 2 |
| Node 6 | 2 | 1 | 2 | 1 | 1 | 0 | 1 | 1 |
| Node 7 | 3 | 3 | 2 | 2 | 1 | 1 | 0 | 1 |
| Node 8 | 3 | 2 | 3 | 2 | 2 | 1 | 1 | 0 |
Table 10.
Case study vulnerability assessment as drop in efficiency for every Node i.
| Initial Efficiency E(G) | Efficiency E′(i) after Node Removal | Vulnerability Assessment as Drop in Efficiency (%) |
|---|---|---|
| 0.369 | E′(8) = 0.283 | |
| E′(1) = 0.295 | 20.1% | |
| E′(7) = 0.283 | 23.4% | |
| E′(3) = 0.265 | 28.2% | |
| E′(4) = 0.279 | 24.2% | |
| E′(2) = 0.283 | 23.3% | |
| E′(5) = 0.256 | 30.6% | |
| E′(6) = 0.256 | 30.6% |
Table 11.
Comparison of the results of the proposed approach with other studies in the transportation domain (i.e., [32,45]).
| Removal of Nodes Based on the Proposed Approach (i.e., Probability-Based Ranking) | Removal of Nodes Based on Centrality Measure-Based Ranking (Node Degree k(i)) | Removal of Nodes Based on Centrality Measure-Based Ranking (Betweenness Centrality b(i)) |
|---|---|---|
| 8: P(8) = 0.60 | 5: k(5) = 5 | 6: B(6) = 10.0 |
| 1: P(1) = 0.57 | 6: k(6) = 5 | 5: B(5) = 8.67 |
| 7: P(7) = 0.27 | 3: k(3) = 4 | 3: B(3) = 8.0 |
| 3: P(3) = 0.22 | 2: k(2) = 3 | 2: B(2) = 4.67 |
| 4: P(4) = 0.22 | 4: k(4) = 3 | 4: B(4) = 0.67 |
| 2: P(2) = 0.21 | 7: k(7) = 3 | 1: B(1) = 0.0 |
| 5: P(5) = 0.12 | 8: k(8) = 3 | 7: B(7) = 0.0 |
| 6: P(6) = 0.06 | 1: k(1) = 2 | 1: B(8) = 0.0 |
Disclaimer/Publisher’s Note: The statements, opinions and data contained in all publications are solely those of the individual author(s) and contributor(s) and not of MDPI and/or the editor(s). MDPI and/or the editor(s) disclaim responsibility for any injury to people or property resulting from any ideas, methods, instructions or products referred to in the content. |
© 2023 by the authors. Licensee MDPI, Basel, Switzerland. This article is an open access article distributed under the terms and conditions of the Creative Commons Attribution (CC BY) license (https://creativecommons.org/licenses/by/4.0/).
Share and Cite
MDPI and ACS Style
Ntafloukas, K.; Pasquale, L.; Martinez-Pastor, B.; McCrum, D.P. A Vulnerability Assessment Approach for Transportation Networks Subjected to Cyber–Physical Attacks. Future Internet 2023, 15, 100. https://doi.org/10.3390/fi15030100
AMA Style
Ntafloukas K, Pasquale L, Martinez-Pastor B, McCrum DP. A Vulnerability Assessment Approach for Transportation Networks Subjected to Cyber–Physical Attacks. Future Internet. 2023; 15(3):100. https://doi.org/10.3390/fi15030100
Chicago/Turabian StyleNtafloukas, Konstantinos, Liliana Pasquale, Beatriz Martinez-Pastor, and Daniel P. McCrum. 2023. "A Vulnerability Assessment Approach for Transportation Networks Subjected to Cyber–Physical Attacks" Future Internet 15, no. 3: 100. https://doi.org/10.3390/fi15030100
Note that from the first issue of 2016, this journal uses article numbers instead of page numbers. See further details here.