Article

Im2Graph: A Weakly Supervised Approach for Generating Holistic Scene Graphs from Regional Dependencies

1
Department of CSE (AIML), Institute of Engineering and Management, Kolkata 700091, WB, India
2
Department of CSE, Jadavpur University, Kolkata 700032, WB, India
3
Department of Informatics, University of Évora, 7000-671 Évora, Portugal
*
Authors to whom correspondence should be addressed.
Future Internet 2023, 15(2), 70; https://doi.org/10.3390/fi15020070
Submission received: 26 December 2022 / Revised: 26 January 2023 / Accepted: 5 February 2023 / Published: 10 February 2023
(This article belongs to the Special Issue Deep Learning and Natural Language Processing)

Abstract

:
Conceptual representations of images involving descriptions of entities and their relations are often represented using scene graphs. Such scene graphs can express relational concepts by using sets of triplets s u b j e c t p r e d i c a t e o b j e c t . Instead of building dedicated models for scene graph generation, our model tends to extract the latent relational information implicitly encoded in image captioning models. We explored dependency parsing to build grammatically sound parse trees from captions. We used detection algorithms for the region propositions to generate dense region-based concept graphs. These were optimally combined using the approximate sub-graph isomorphism to create holistic concept graphs for images. The major advantages of this approach are threefold. Firstly, the proposed graph generation module is completely rule-based and, hence, adheres to the principles of explainable artificial intelligence. Secondly, graph generation can be used as plug-and-play along with any region proposition and caption generation framework. Finally, our results showed that we could generate rich concept graphs without explicit graph-based supervision.

1. Introduction

Human beings are equipped with an amazing neurological system to process visual stimuli. It takes just a fraction of a second for us to focus on the scene, locate the object of interest, analyze the interaction between the various objects, infer the concept encoded in the scene, and take the necessary action as per a certain objective. However, if we take a moment to slow down and break down this process, we shall notice that every scene that we see is intrinsically a complex network of entities with various attributes and associated actions. These entities, attributes, and actions do not just exist in space, but also interact with each other to create a conceptual web. We can independently describe various parts of a scene and also combine these descriptions to form a holistic representation consisting of a dense network of entities, actions, attributes, and relations. While understanding any scene, we have an innate ability to break it down into smaller chunks. We can easily detect the different objects that are present. We can identify the various features that describe these objects. We can identify spatial relations among them and the various actions along with the entities that are responsible for these actions and the ones that are affected by the same. This hierarchical information consisting of entities, attributes, actions, and their relations creates a holistic concept of the scene that allows us to interpret and react accordingly. Typical deep learning approaches for classification, localization, or segmentation fail to capture this holistic information. We need a graph consisting of nodes to represent these entities, attributes, and actions and edges to plot the relations among them. This relational mapping can reflect several important concepts such as spatial relations, part–whole relations, and subjects or objects corresponding to actions. In our approach, we attempted to extract such relational information from images, as shown in Figure 1.

1.1. Objective

In this paper, we propose a novel approach for scene graph generation. Our process consists of two main phases. Firstly, we extracted image captions from local regions of images using commonly used object localization [1] and image captioning techniques [2]. Secondly, we created a conceptual graph generation algorithm from the image captions, which can demonstrate the visual aspects of the image region. Thirdly, we implemented a two-phase approximate maximum common subgraph algorithm [3] for combining the local concept graphs to create a holistic scene graph. The objectives can be listed as follows:
1.
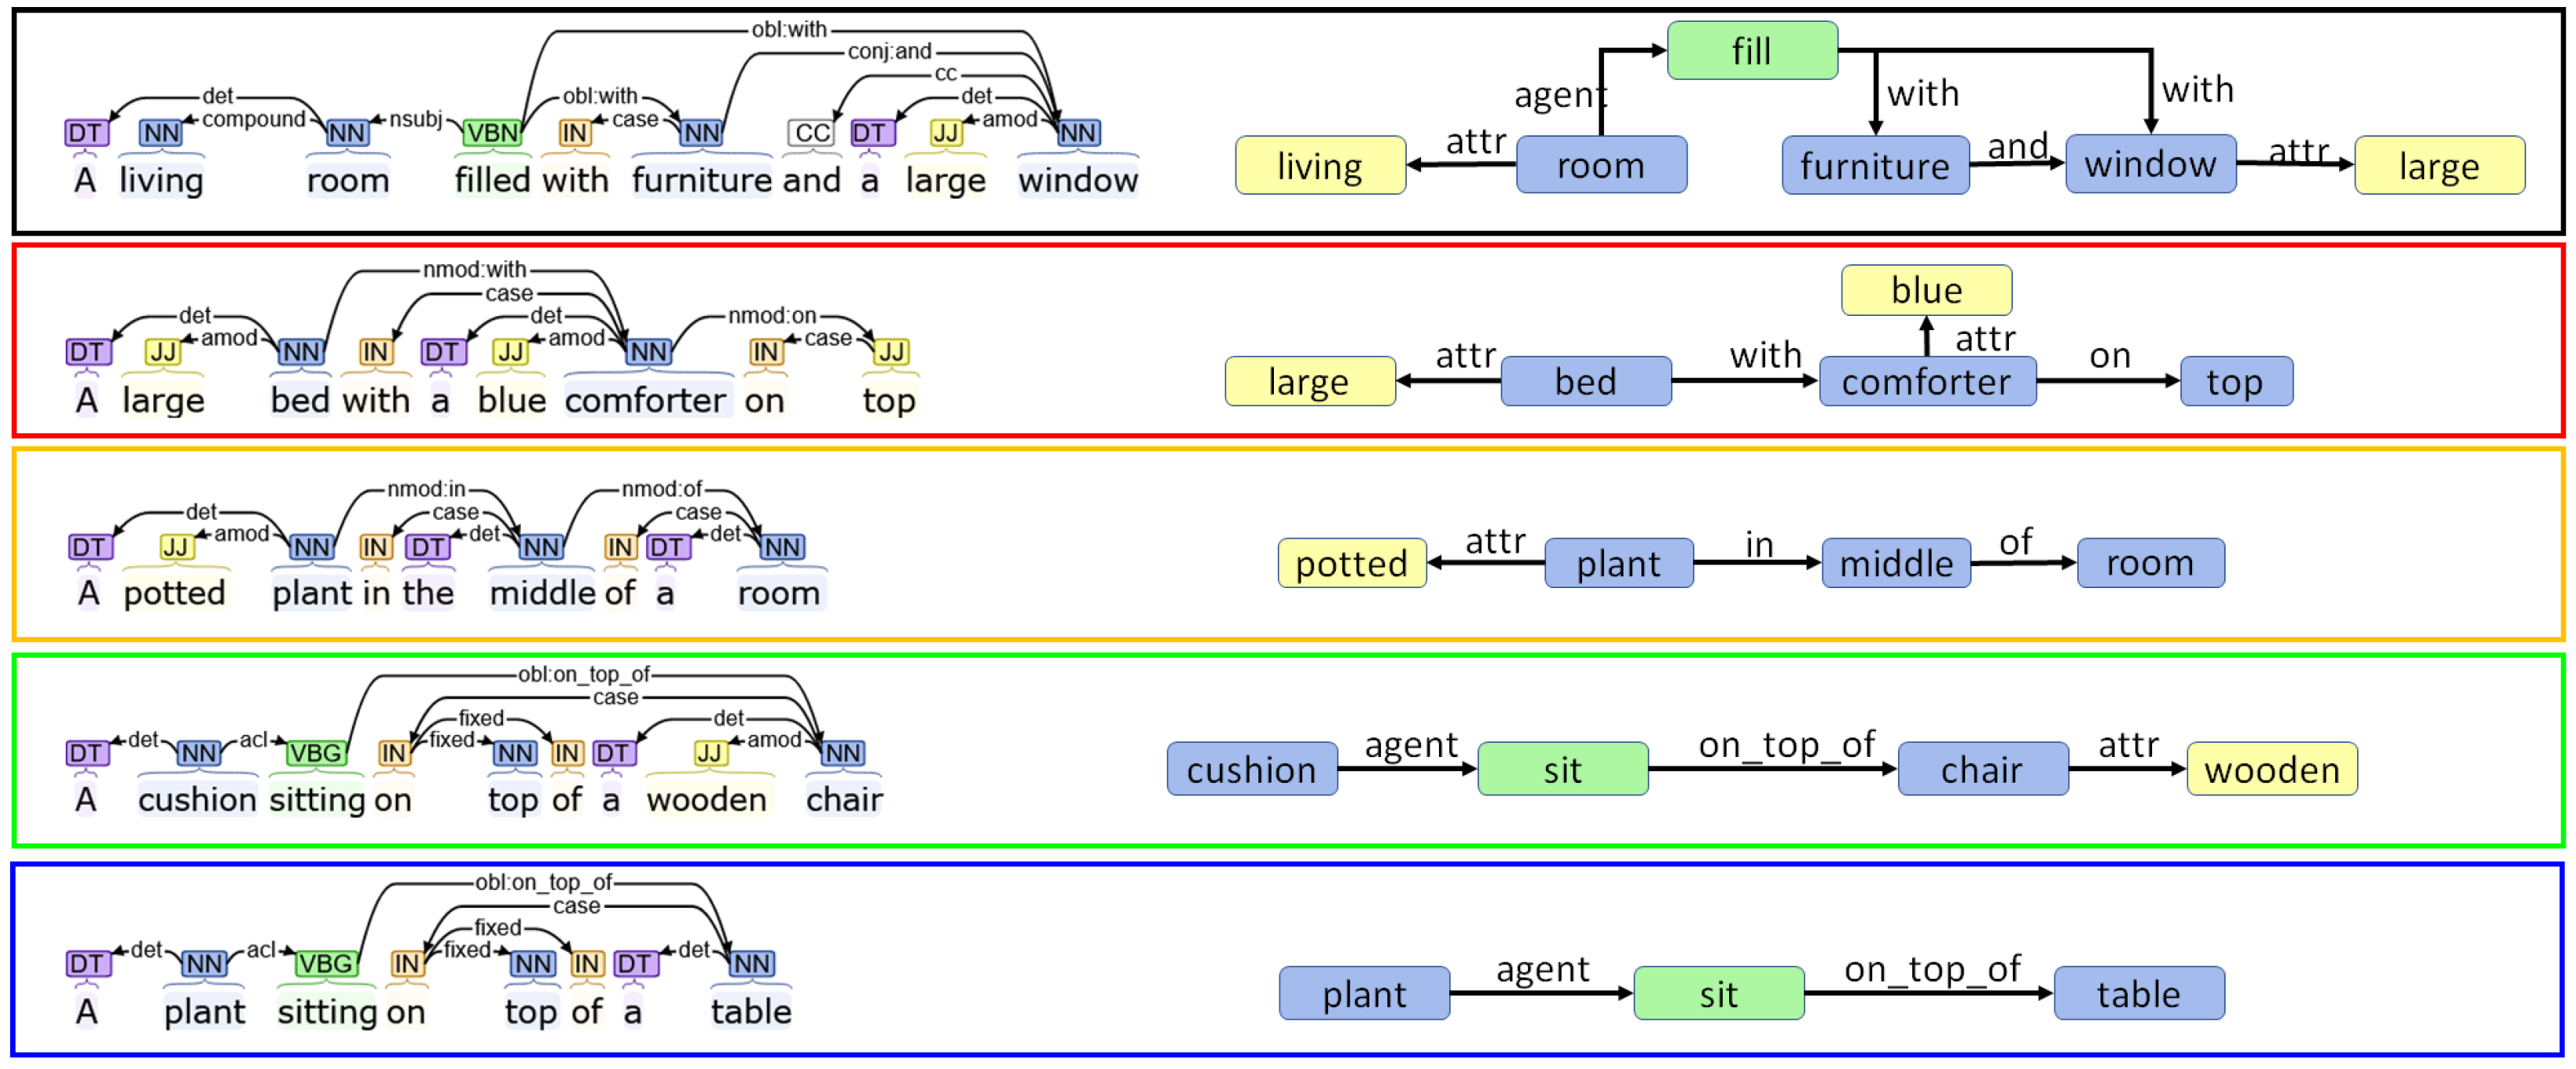
Proposing an explainable rule-based graph generation algorithm from image captions using dependency parsing;
2.
Proposing an efficient graph merging technique based on the approximate maximum common subgraph based on visual features without using any graph-based supervision;
3.
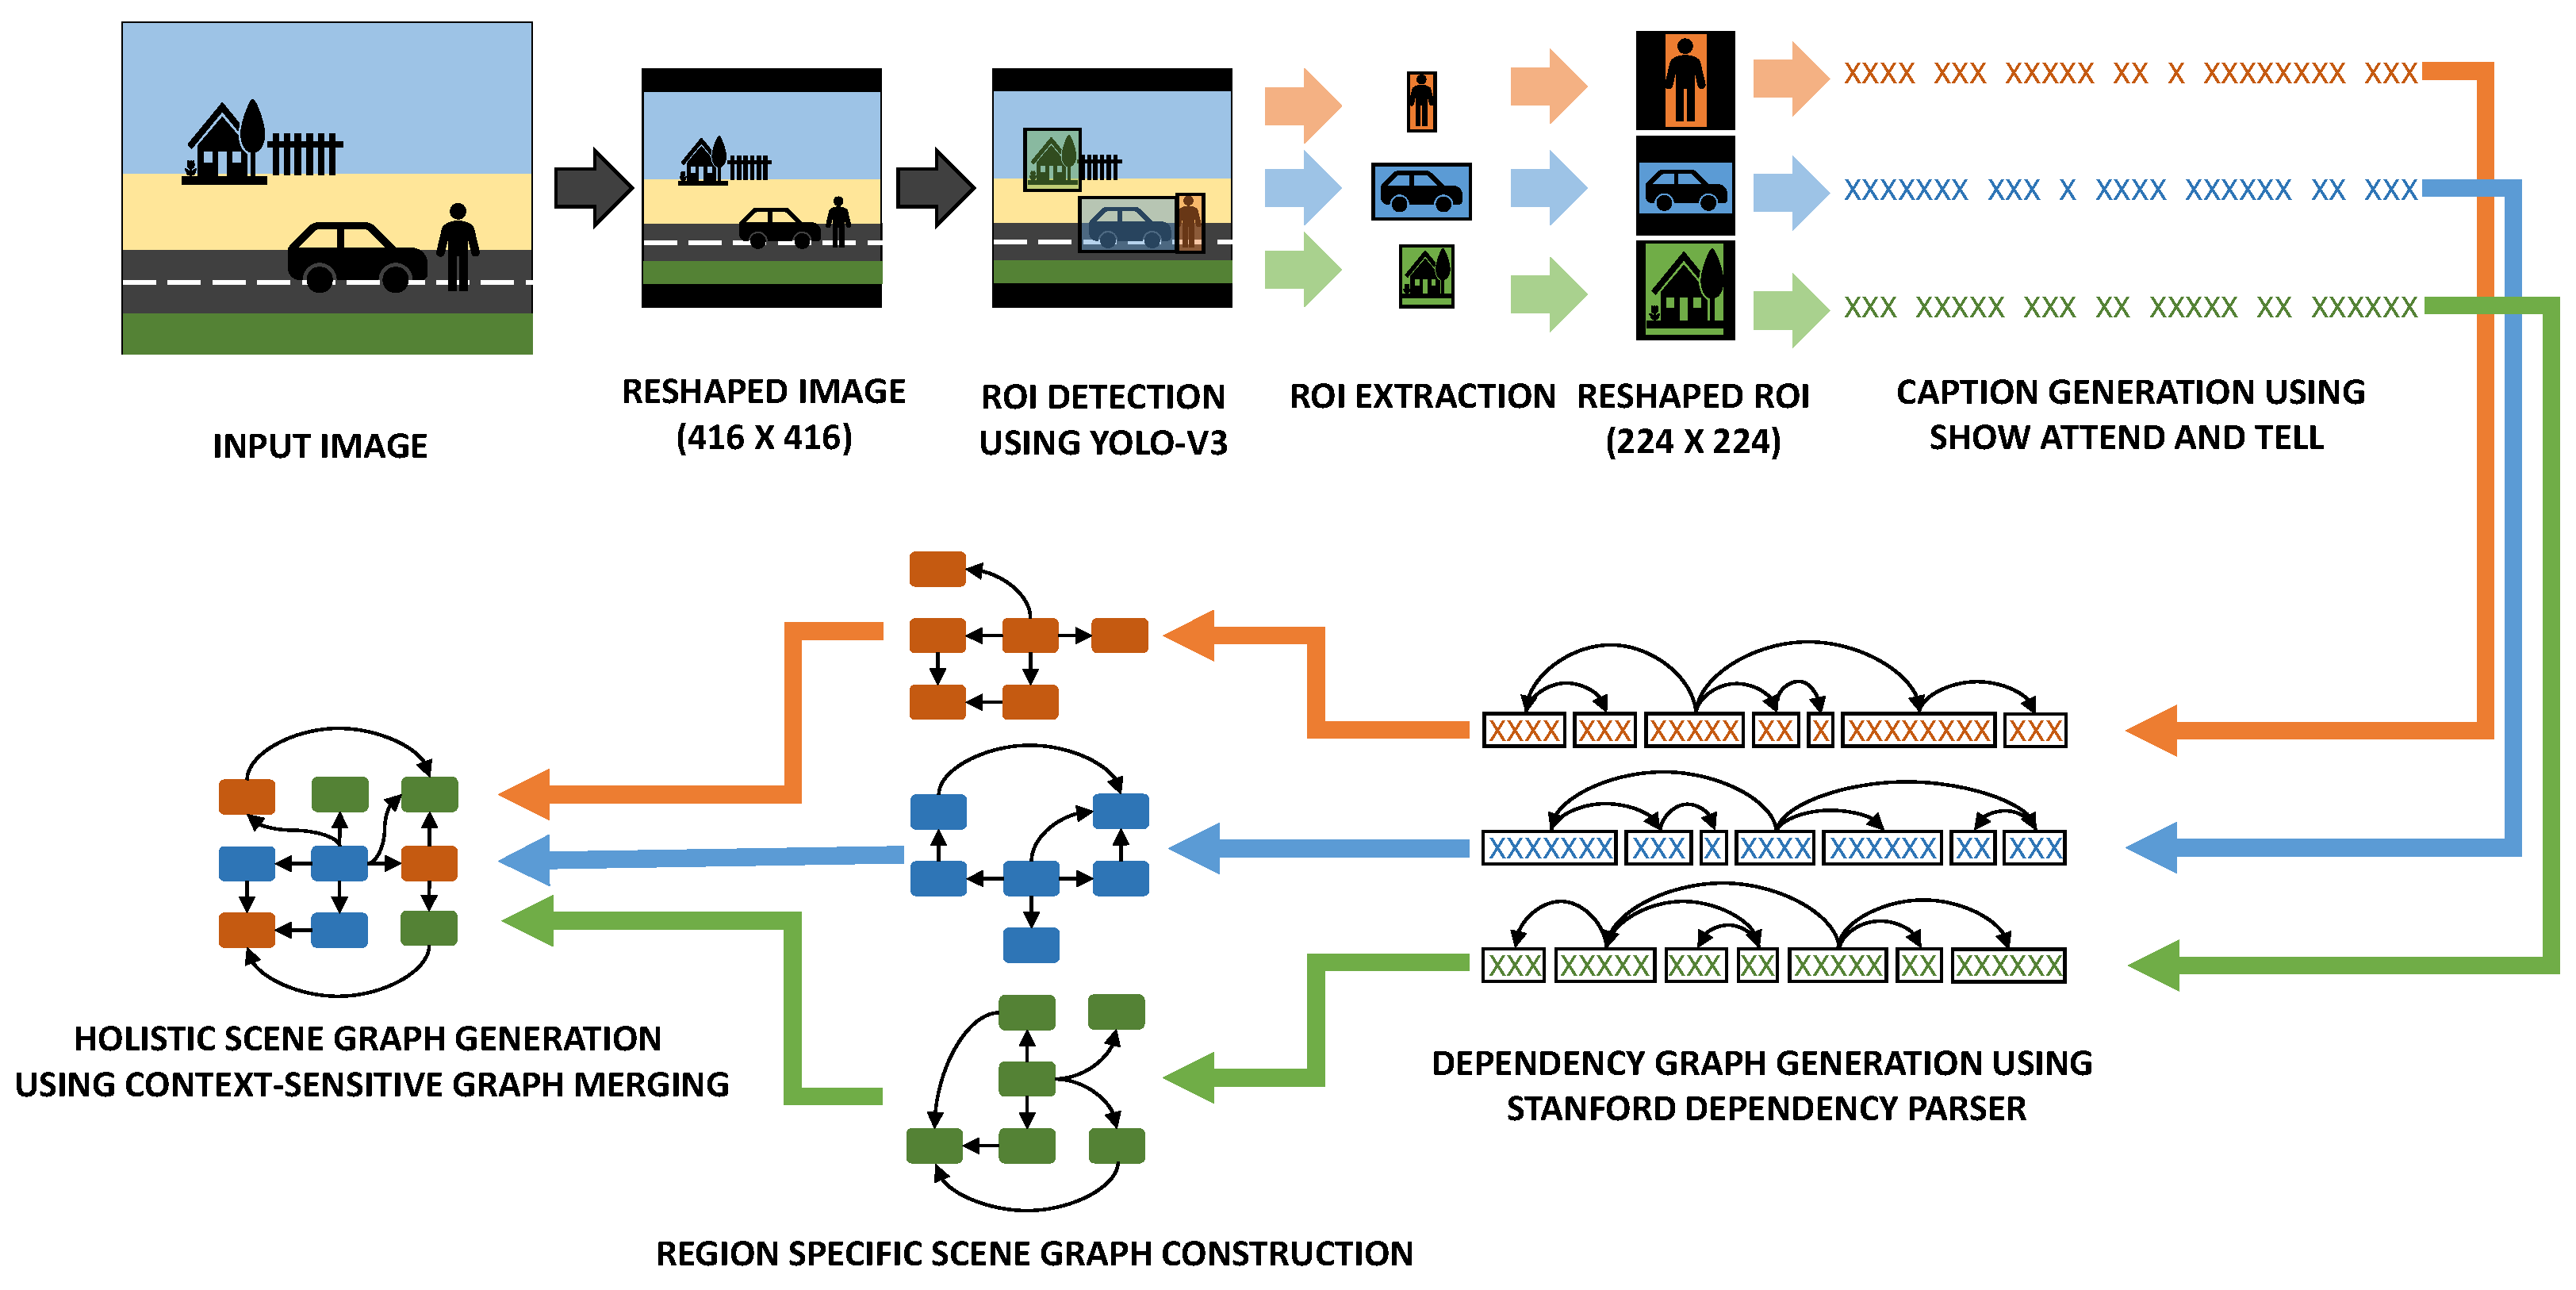
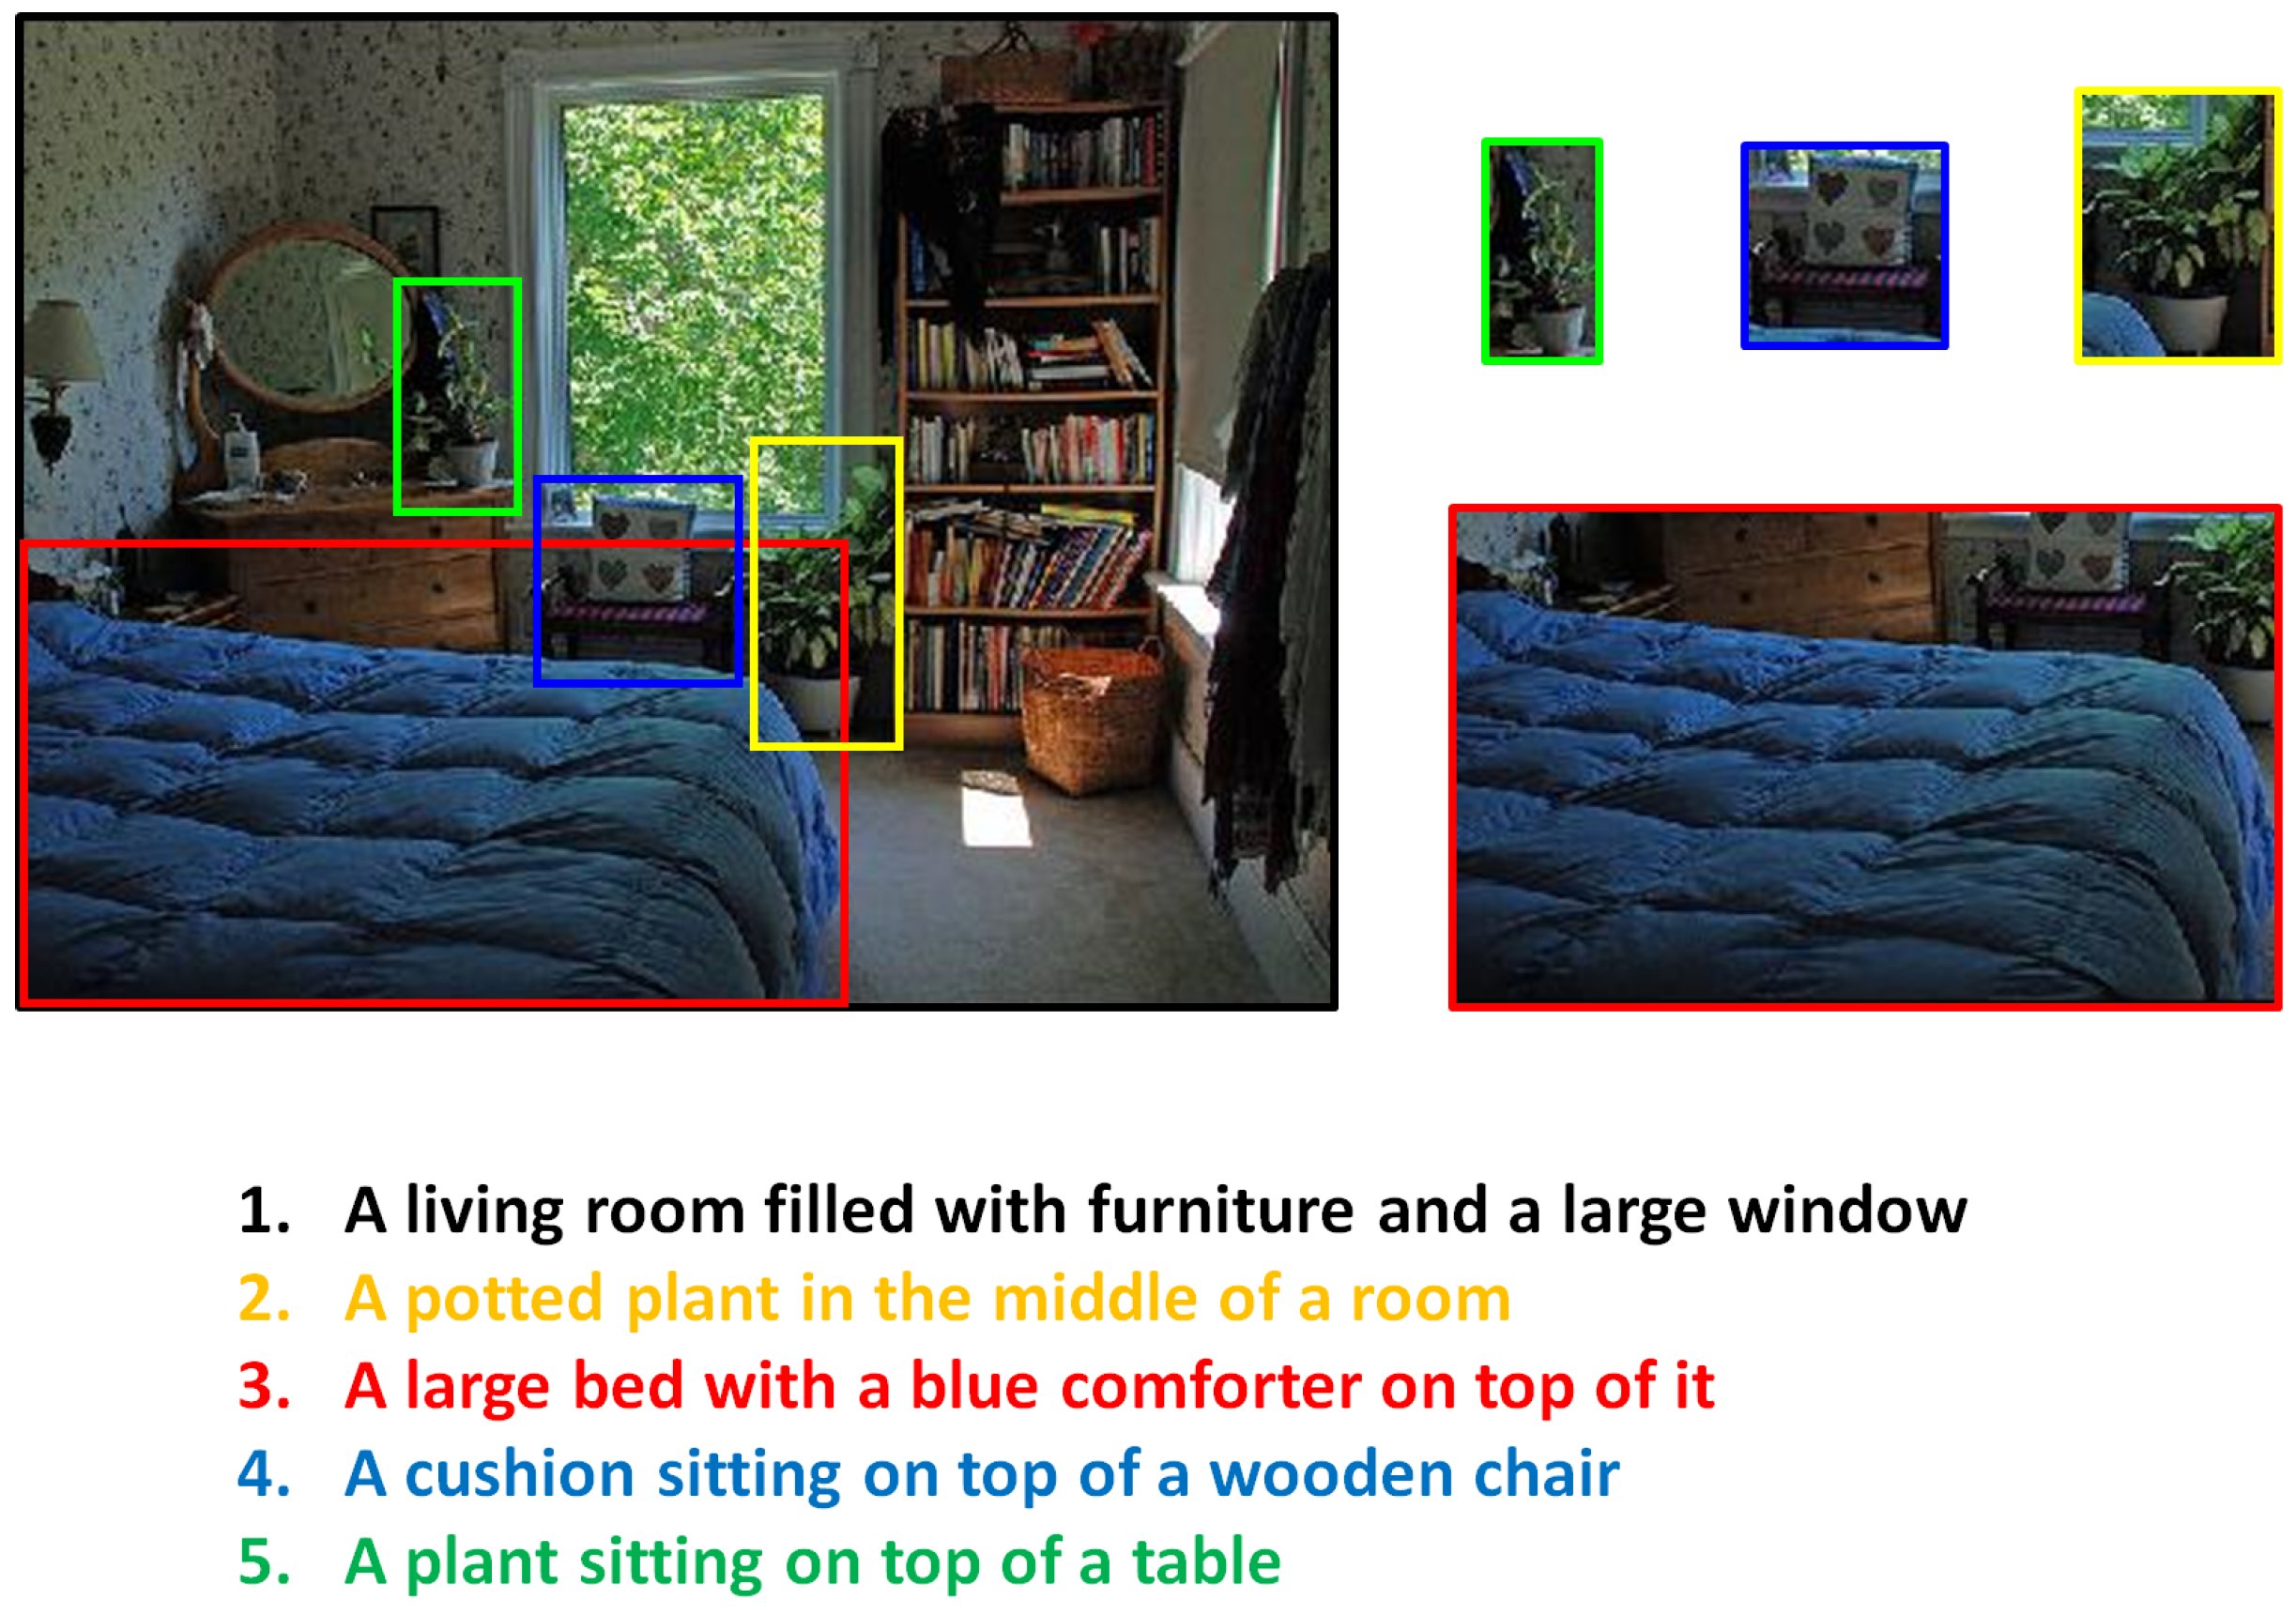
An end-to-end framework that uses a third-party detection and caption generation framework to create holistic scene graphs by combining graphs generated from captions corresponding to various regions of interest extracted from images.

1.2. Motivation

Learning relations between entities is a complex problem given the large number of entity relationship combinations possible. The long-tailed distribution of such triplets makes straightforward classifications extremely difficult. Furthermore, the creation of supervised models for these kinds of problems requires datasets containing millions of images that have graph-based annotations. Graph convolutional networks [4] have been implemented before, but they operate best on a very restricted set of nodes and edges and tend to fall apart for larger class problems such as natural language representation, which can possess large vocabularies and corpora defining the problem space. Throughout the last decade, we have seen the tremendous performance of deep learning approaches in several sectors of computer vision that require rich feature extraction. Scene graph generation also uses this ability of CNNs for building descriptive visual features that can be used for the prediction of several objects and actions. However, most of the time, relation detection depends on other techniques such as message passing [5], probabilistic graphical models [6] or statistical correlations [7] within the datasets. One major issue is that these approaches are not completely explainable. However, our approach is based on the hypothesis that the relational representation is already encoded inside CNNs and can be extracted without other learning techniques. We have already seen how CNNs can be used for generating image captions, and we know for a fact that natural language captions demonstrate relational aspects of an image. Thus, CNNs are capable of encoding relational information in some way that may not be directly represented as graphs, but can be expressed through sequential outputs such as natural language texts. Our approach aims to extract relational information from such image captions instead of directly extracting it from the image. Though the caption generation may not be completely explainable, the proposed graph generation from image captions is completely rule-based, hence explainable. As the image becomes more and more complex, automatically generated image captions fail to capture all the concepts hidden within the image. In the work of Johnson et al. [8], it was shown that dense captioning can yield much more extensive information as compared to standard captions. As compared to normal captions, dense captions are much more localized in nature. This approach tends to generate several simple captions for different regions of the image. Finally, for the extraction of relational information from natural language captions, we used natural language processing concepts such as dependency graphs. To summarize, instead of building dedicated models for scene graph generation, our model tends to extract the latent relational information that is inherently encoded in image captioning models and uses detection techniques for region propositions for creating dense concept graphs for images. A block diagram of the proposed approach is given in Figure 2.
The paper is organized into seven sections. In Section 1, we define the objective of the work and the motivation that guided the proposed approaches. Following that, in Section 2, we talk about the various literature that already exists in the domain of scene graph generation and the respective methodologies and shortcomings. In Section 3, we define the desired characteristics of the holistic scene graph. In Section 4, we introduce the first phase of our approach, which is the generation of graphs from image captions. In Section 5, we discuss the graph merging technique that results in the holistic scene graph. In Section 6, we provide the statistical characteristics of the generated graphs along with the qualitative analysis. Finally, we conclude our findings in Section 7 and provide avenues for future researchers to extend this work.

2. Literature Survey

The first notable data structure proposed to express visual relations was the concept of scene graphs [9]. Scene graphs are powerful enough to capture the entities present in a scene [10,11], their attributes, as well as the relations among them that justify the context of the entities. The task of Scene Graph Generation (SGG) involves the construction of a graph data structure that maps its nodes and edges with the entities and their relations in the image. The scene graph, which was proposed by Johnson in [8], was manually established on the Real-World Scene Graphs Dataset (RW-SGD). However, such manual generation is very costly. Therein lies the necessity of automatic scene graph generation techniques. Visual relationships, often expressed as a triplet s u b j e c t p r e d i c a t e o b j e c t , tend to demonstrate a strong statistical correlation between the subject–object pair and the predicate. Conditional Random Fields (CRFs) [6,12] are inherently capable of incorporating such correlations into the discrimination task. CRFs have been used for several graph-based inference tasks such as image segmentation, Named Entity Recognition (NER), and Content-Based Image Retrieval (CBIR).
Translation embedding or TransE [13,14,15,16,17] has a different perspective as compared to other knowledge graph-based approaches. While other methods view relations as a function of the joint distribution of the the subject and object, TransE defines the object as the vector sum of the subject and the relation. CNN-based SGG approaches use convolutional neural networks to extract the image’s local and global visual information, then use classification to predict the relationships between the subjects and objects. The final characteristics employed for relationship identification in these methods are derived by examining the local visual features of many objects simultaneously [18] or by performing feature interactions between local features [19].
A scene graph is typically represented using a graph data structure. Some approaches involving CNNs [20] focus on generating phrase-level graphs [19] as motifs, while others consider relationships [21] and feature extractions from multiple levels of images [22]. The stacked Motif Network (MotifNet) [7] assumes that the strong independence assumption in the local predictor [5,19,23] actually limits the quality of global prediction. For this goal, MotifNet uses the recurrent sequential architecture of Long Short-Term Memory networks (LSTMs) to encode global context information [24].
An intuitive strategy would be to use graph theory to optimize the production of scene graphs. By transmitting local information [25,26], the Graph Convolutional Network (GCN) [27,28,29] can operate on graph structure data. Relational reasoning [30], graph classification [31,32,33,34], node classification in big graphs [4,35], and visual understanding [36,37,38] have all been shown to be highly effective using the GCN. As a result, numerous academics have looked at the GCN-based scene graph generating method [39,40,41,42,43,44,45,46].
Relationships are combinations of items for SGG, and their semantic space is larger than the objects. Furthermore, exhausting all associations from the SGG training data is extremely tough. As a result, learning relationship representations from a minimal amount of training data is especially important. As a result, the use of past information could considerably aid in the detection and recognition of visual links. Common variations in this regard include language-based priors [47,48,49] and statistical priors [7,50,51,52] or large databases stored as knowledge graphs [38,53,54,55,56].

3. Holistic Scene Graphs

We have used the term holistic scene graphs to describe the output of the proposed approach. Just like other graphs, holistic scene graphs are composed of nodes and edges, which are described below.

3.1. Nodes

The nodes primarily refer to visible aspects of the image in terms of the entities, actions, or their attributes:
  • Entity node: Entities refer to subjects of interests in the scene. An entity in the scene can be any tangible living or non-living matter that contributes to the overall concept of the scene. For example, entities in a street scene can be “building”, “car”, “person”, “traffic light”, “sidewalk”, “road”, and so on.
  • Action node: Actions refer to the activities related to the entities. An action can either be performed by an entity or it can be performed on an entity. Depending on that, the entity would be the agent or patient of the scene. Some common actions of a street scene would be “walking”, “parked”, “driving”, or “standing”.
  • Attribute node: The third type of node is the attribute node, which acts as a modifier for the entities or actions. Attributes can refer to any qualitative or quantitative measure for entities or actions that further adds conceptual value to the scene. Examples of attributes in a street scene can be “red”, “tall”, “leafy”, “dry”, “slowly”, “two”, and so on.

3.2. Edges

Edges of the graph refer to a relation that exists between nodes. This dependence among entities, actions, and attributes is what gives conceptual value to a scene. The edges can be used to demonstrate different types of relations as described below:
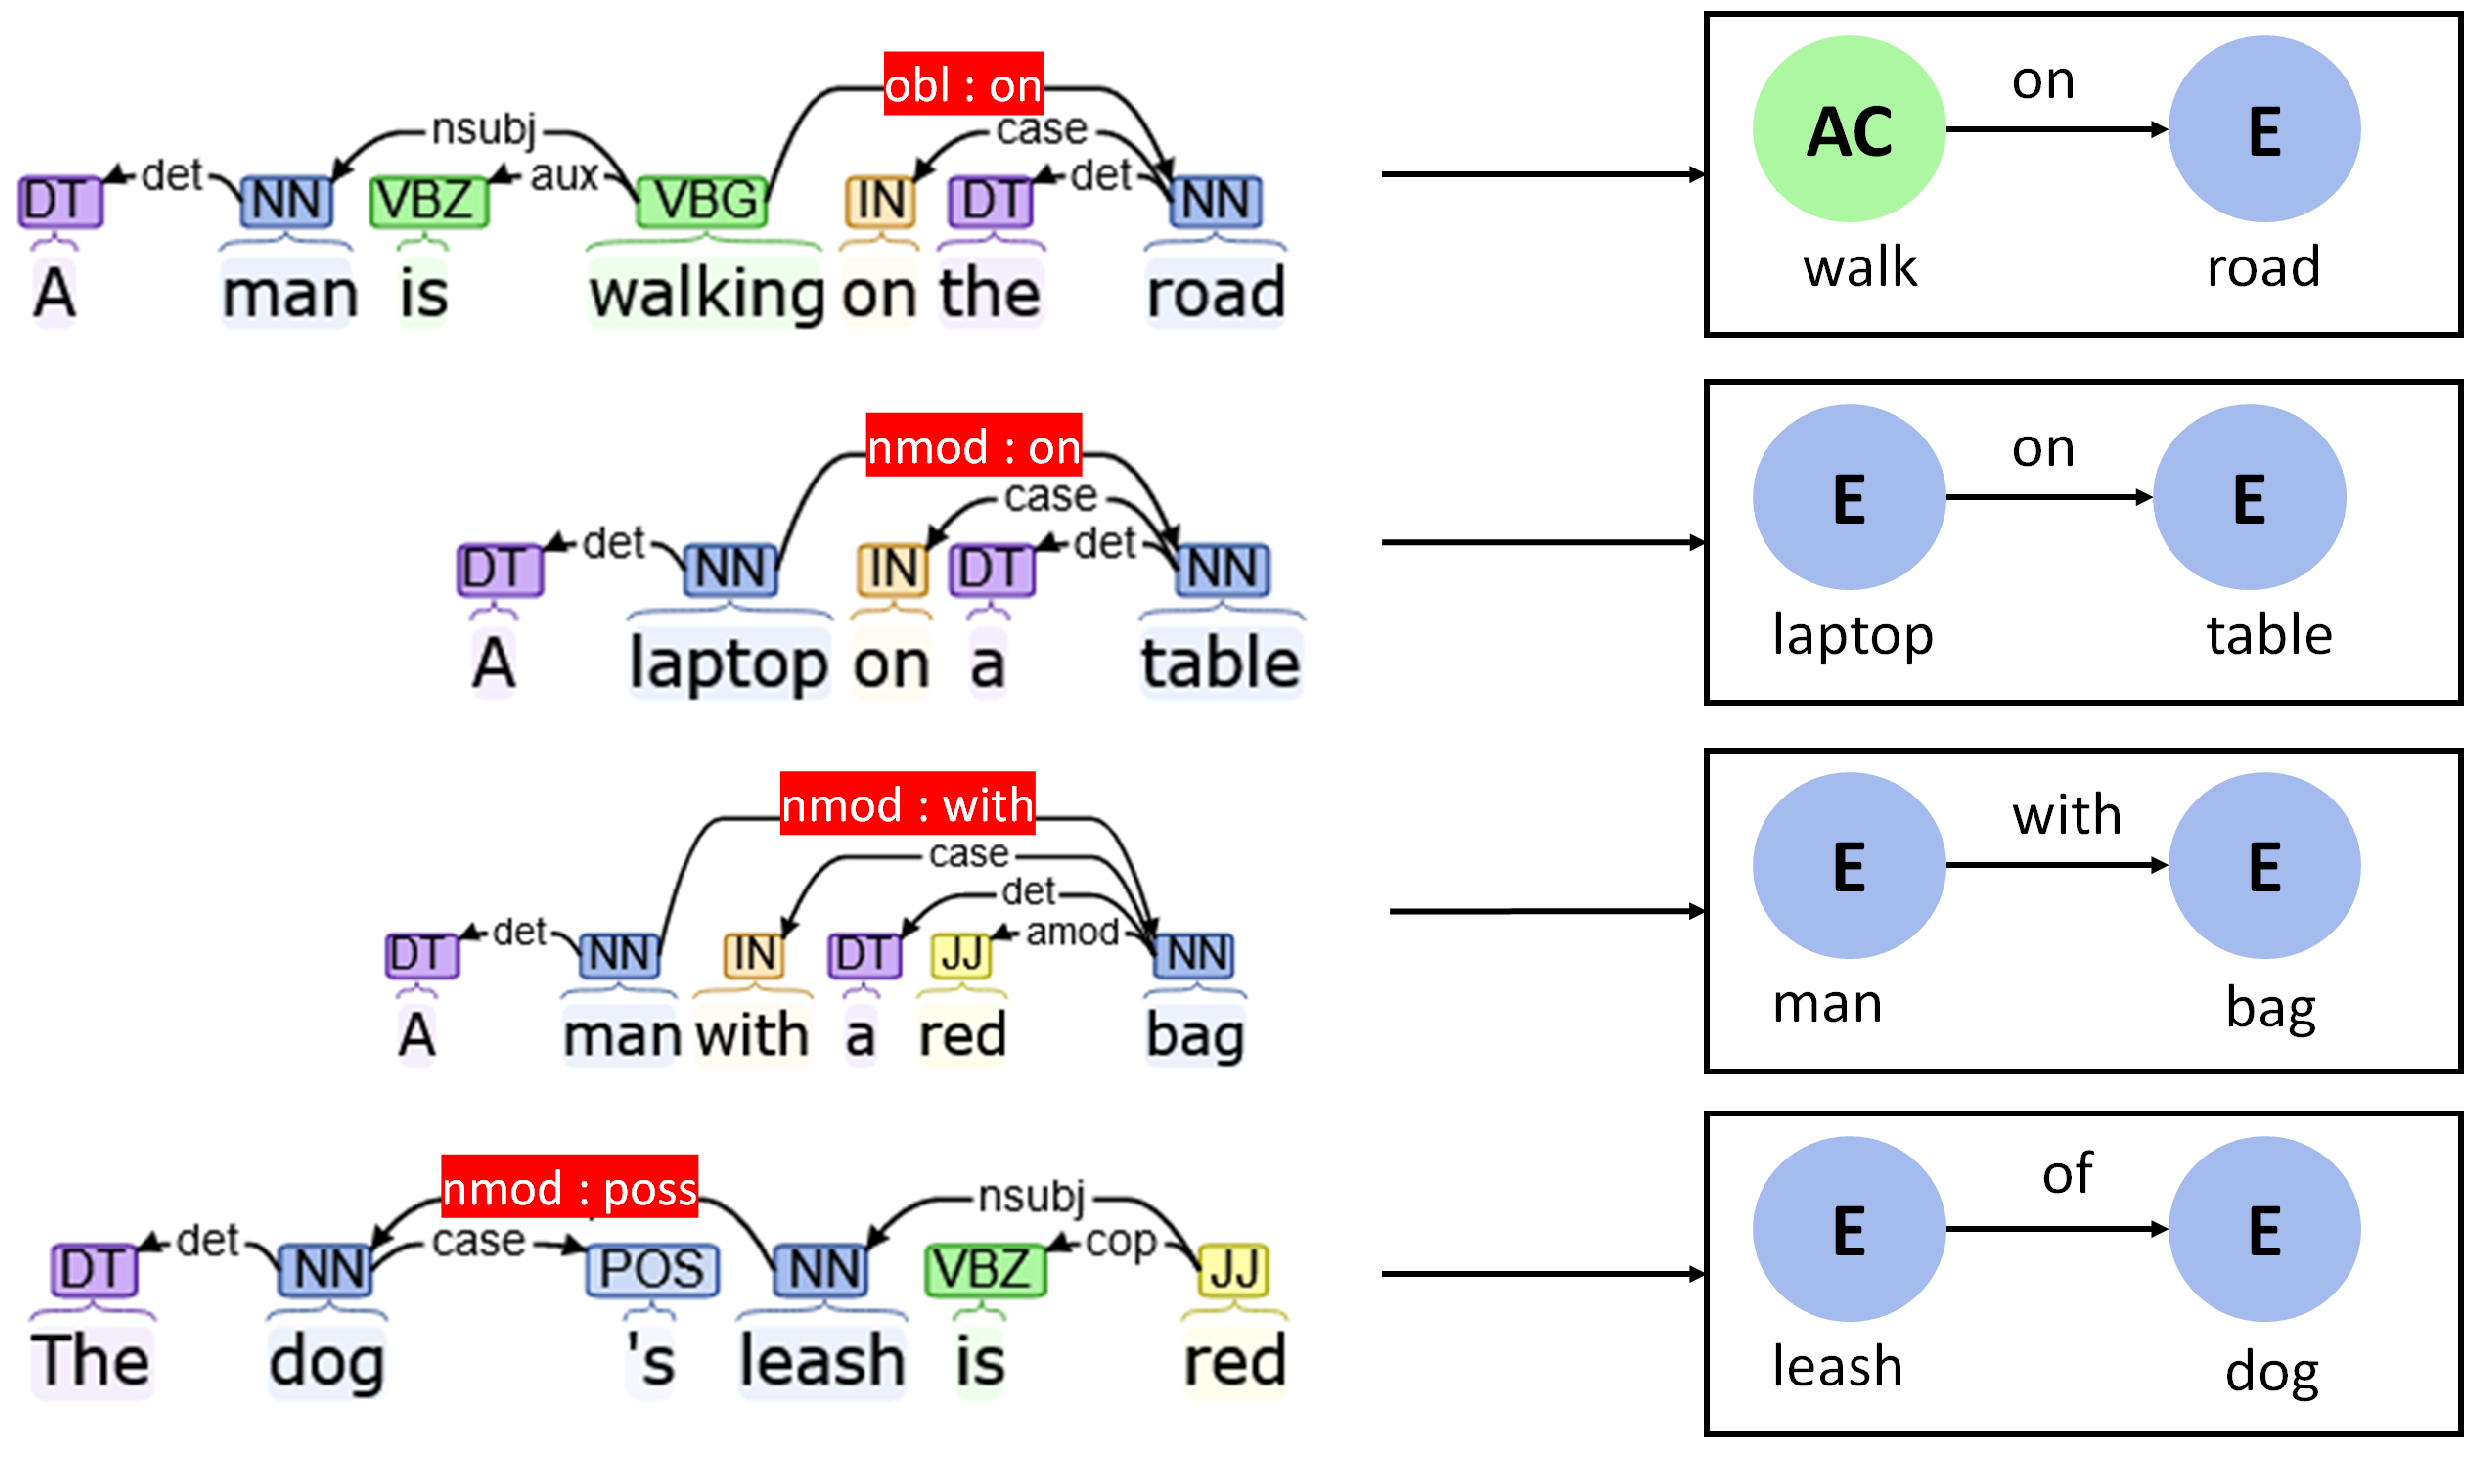
  • Entity–entity: Relations among entities can be broadly categories into two types. Firstly, spatial relations signify the position and orientation of one entity with respect to another entity. These can be directly extracted from the scene itself. Some examples of such relations are “car on road” or “dog beside person”. Secondly, meronymic relations highlight part–whole connections between various objects. Examples of such relations can be “bike with wheels” or “trees have leaves”.
  • Entity–attribute: Relations such as these serve as entity descriptors and mostly correspond to the qualitative or quantitative attributes of the entities such as “red car” or “tall building”.
  • Action–attribute: Attributes can not only describe entities, but also various actions. Examples of such attributes are “rashly driving” or “jumping high”.
  • Entity–action: One of the most-important factors when it comes to scene description is to associate various entities with related actions. This kind of relation is one of the hardest to predict because of various complications and dimensional constraints. Entity–action relations can also be of various types:
    Agent–action relation: This kind of relation connects the action with the entity that is performing the action. For the sentence “The boy is playing”, “boy” is the subject or agent who is performing the action of “playing”. In most general cases, actions are always associated with some implicitly or explicitly defined subject.
    Action–patient relations: It is often seen that various objects are directly affected as a result of an action. This object or patient of an action can be represented using this kind of relation. However, the presence of a patient of an action may not always occur in a scene. A simple example for this can be the sentence: “He is driving a car”. In this sentence, the person referred to by the pronoun “He” is the agent causing the action “driving”. However, “car” is the object that is being affected by the said action. Hence, “car” is the patient of the the action “driving”.
    Spatial relations: Not all entities will directly be associated with an action, but can still be present in the context. An action can be carried out in a specific location that also reveals important information about the scene. For example, “driving on a highway” and “driving on a street” correspond to slightly different visual stimuli, which can be significantly important for a specific task. In each of these cases, entities such as “highway” and “street” are not directly involved in the action of driving, but their spatial context is informative nonetheless.
An example of the desired holistic graph is demonstrated in Figure 1.

4. Graph Conversion from Dependency Tree

To locate regions of interest generating local captions, we drew inspiration from dense captioning approaches [57]. However, unlike these, we simply made use of pre-trained models for object detection [1] and automatic image captioning [2] algorithms.
The regional caption generation model consists of two distinct phases. One is an object detection phase that locates the key objects in the image; we used a pre-trained YOLO-V3 model for this purpose. The second phase, which is the image captioning model, takes as the input the regions of the original image that are cropped out according to the YOLO-V3 bounding box predictions. This implementation is very straightforward. However, there is one key factor that must be taken into account: the YOLO-V3 model takes an input image of size 416 × 416 , but the bounding box predictions come in a variety of sizes; moreover, the image captioning model works only for a specific size of image of 224 × 224 . Based on the works of [58], our approaches use the centered zero-padding technique. The reasons are that it is one of the fastest techniques, the aspect ratio of the objects in the scenes is not distorted, and, for our purposes, randomized reshaping techniques may lead to different outputs from the image captioning model. Hence, to ensure consistent high-quality outputs from the pre-trained image captioning module, the centered zero-padding technique was used. In this work, we considered a single generated caption per region to avoid unnecessary redundancies. An example of a set of captions for various regions across the image is shown in Figure 3.
Once we have a set of captions with respect to detected regions of interest in the image, we can generate rich conceptual graphs using the graph construction method proposed in Section 4.1. The graph construction first creates the set of primary entities followed by the edges based on the dependencies; secondary entities are created on an ad hoc basis to accommodate hanging edges.
The dependency tree provides rich information about relations between the various words in a sentence. These relations can reveal several aspects relevant to our purposes such as the dependence between subjects, predicates, and objects, modifiers of various objects, actions, and spatial relations based on the type of prepositions used to connect phrases and also demonstrate a hierarchical concept of the scene.
For this work, we used the enhanced++ typed dependencies from the Stanford dependency parser [59] and the default English language model for parsing (https://nlp.stanford.edu/software/lex-parser.shtml (accessed on: 25 December 2022)). The Stanford dependency parser was created to provide a simplified depiction of the grammatical links in a phrase such that persons without linguistic knowledge can understand and use them to extract the textual relations. It expresses all sentence relationships as typed dependency relations, instead of the phrase structure representations that have been traditionally used in the computational linguistic research community. All dependencies are expressed using specific tags. The basic version of the Stanford dependency parser introduced 55 unique tags, which were further improved to include more complex grammatical constructs in future versions, namely the enhanced and enhanced++ dependencies.
For our task, we created a simplified intermediate representation. A sentence S is defined as a sequence of words { w o r d 1 , w o r d 2 , , w o r d n } . For each word w o r d i , we have an intermediate representation h i :
h i = i d i , t i , l i , p i , LIST r k , i d k , t k ,
Here, i d i , t i , l i , and p i refer to the id, token, lemma, and part-of-speech tag of the word, respectively. The LIST refers to the set of connected parent node ids i d k and tokens t k and also the relation r k through which the parent node ( i d k ) is connected to this node ( i d i ).

4.1. Graph Construction

The graph construction is performed in two phases. Firstly, primary nodes are created by analyzing the parts-of-speech tags of each of the words from the intermediate representation. In some special cases, the lemmas are considered for refining the nodes. In the next phase, the relations or dependencies associated with each word are taken into account for generating the edges of the graphs. During this phase, additional nodes may be created to accommodate hanging edges. The secondary nodes’ creation is performed based on the parts-of-speech tags of the node connected via the dependency. An example of the generated graph from the dependency tree of captions is shown in Figure 4.
We shall go over the set of conditions that affect the creation of the nodes and edges.

4.1.1. Creating Nodes

As discussed in Section 3, the proposed graph is defined by three types of nodes as follows:
  • Entities: Entities refer to the objects that physically occupy space in a scene, e.g., “car”, “person”, “dog”.
  • Actions: Actions refer to the various events or activities connected to the entities, e.g., “drive”, “stand”, “play”;
  • Attributes: Attributes generally refer to the various properties that further define the entities or actions. Attribute nodes are generally connected to either entity or action nodes via an “attr” edge, e.g., “red”, “tall”, “two”.
All these nodes are represented using tuples i d , t o k e n , l e m m a , p o s _ t a g s . Nodes can be created in three different nodes:
  • Primary nodes: These nodes are created by only observing the POS tags of the words. The node is defined typically by the actual token and lemma.
  • Secondary nodes: These nodes are created by observing a combination of POS tags along with other factors such as the lemma or the named entity recognition tags. In these cases, the lemma of the created node is assigned a generic keyword.
  • Tertiary nodes: These nodes are created when edges are created by reading the dependency relations. It may happen that an incoming dependency is coming from a word for which no primary or secondary node exists.

Creation of Primary Nodes

Firstly, primary nodes are created by analyzing the parts-of-speech tags of the words. The properties for the nodes, i.e., the id, token, lemma, and parts-of-speech tags, are taken directly from the corresponding intermediate representation. The type of node created depends on the parts-of-speech tag of the word:
  • Entity ← NN, NNS;
  • Action ← VB, VBD, VBG, VBN, VBP, VBZ;
  • Attribute ← JJ, JJR, JJS, RB, RBR, RBS.

Creating Secondary Nodes

Some secondary nodes are also created with refined properties based on some additional conditions. These are listed below:
  • Pronouns: Since pronouns are representative of nouns, they can be used to create different types of entities as mentioned below. The distinction in this case is made on the basis of the lemma of the word: it can be used to detect whether the entity is a person or an object. It can also detect the singular or plural nature of the entity. Additionally, it can also reflect the gender, which is added as an attribute node named “masculine” or “feminine”. The type of entity or attribute generated by the lemma of each pronoun is:
    Object: it, its, itself;
    Person: I, you, my;
    Masculine person: he, him, his, himself;
    Feminine person: she, her, herself;
    People: we, they, them, ’em, themselves.
  • Determiners: Some determiners can signify the presence of an object, e.g., “this”, “that”, “these”, “those”.
  • Proper nouns (NNP, NNPS): Proper nouns are also added as entities similar to common nouns. However, the lemma is updated according to the named entity recognition tag of the word, e.g., “location”, “person”, “organization”, and so on.
  • Auxiliary verbs: Though auxiliary verbs are tagged as VB, they are not added as action tags.
  • In some rare cases, action nodes can exist without a proper subject or entity. In that case, a dummy entity is created and connected using an “agent” relation.

Creation of Tertiary Nodes

To define an edge in the concept graph, a relational data structure is used consisting of pointers to two node objects and a textual relationship tag. Each tuple corresponding to the hidden representation of the words in the sentence contains a list of incoming dependencies from other nodes. These dependency tags are processed to extract different types of edges in the concept graph. In certain cases, it may happen that the incoming dependency is from another word that has not been created as a primary or secondary node. Hence, a tertiary node must be created on an ad hoc basis. This type of node is defined according to the parts-of-speech tag of the connected word through the incoming dependency. The different types of parts-of-speech tags and the types of tertiary nodes are:
  • Action nodes: VB, VBD, VBG, VBN, VBP, VBZ, TO, CC.
  • Attribute nodes:
    • IN (prepositions).
    • CD (lemma = “number”).
  • Entity nodes:
    • EX, RP (lemma = “location”).
A summary of the protocols for creating nodes is given in Table 1.

4.1.2. Creating Edges

For edge extraction, various types of edges are added to the knowledge graph by categorizing several types of dependency tags.

Agents 

Edges between subjects and actions are tagged as “agent”. This defines which entities are responsible for which actions. The agent relationship can be extracted from the dependencies as follows:
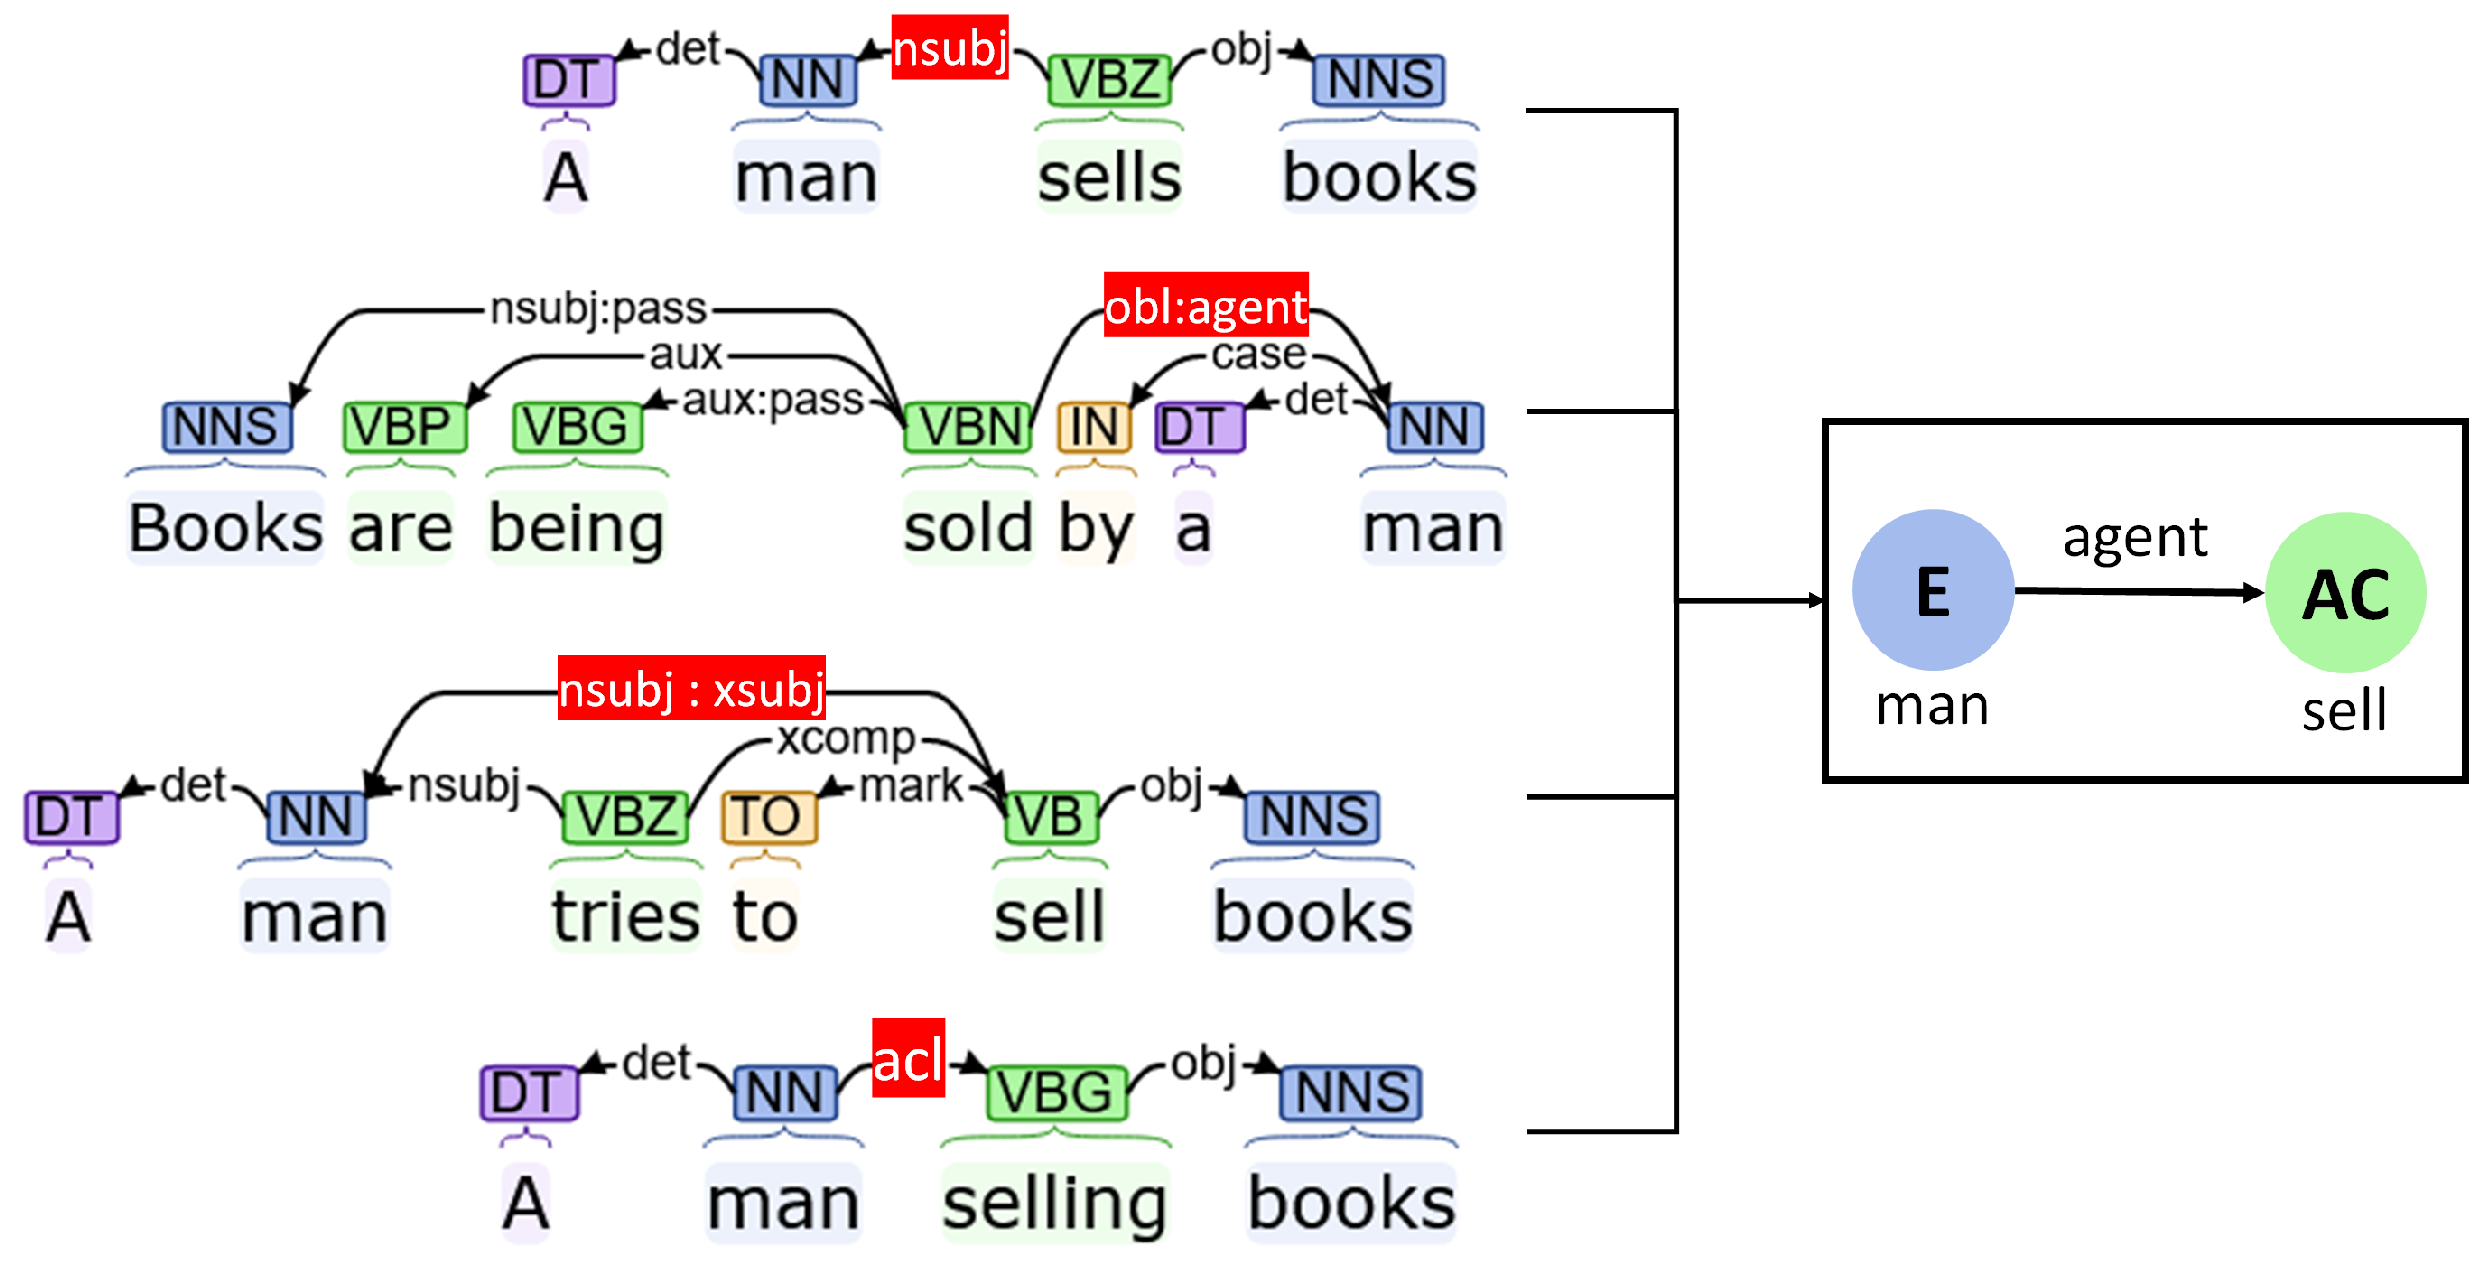
  • Nominal subjects (“nsubj”): Nominal subjects primarily refer to the action causing proto-agents of a phrase. These dependencies can define which entities are responsible for which actions.
  • Oblique agents (“obl:agent”): This type of relation highlights nominal subjects of passive verbs. The effect is similar to the “nsubj” node.
  • Subjects of embedded actions (“nsubj:xsubj”): It is often seen that the scope of one verb is embedded and controlled by another verb. While the first verb exists as an open clausal complement (that is, without a direct subject), the controlling verb is associated with the subject. The “nsubj:xsubj” dependency connects those kinds of subjects with embedded actions.
  • Adnominal clause (“acl”): This type of dependency connects verbs with nominals that modify the properties or state of the nominal. “acl” dependencies can thus be used to assign such actions to corresponding entities.
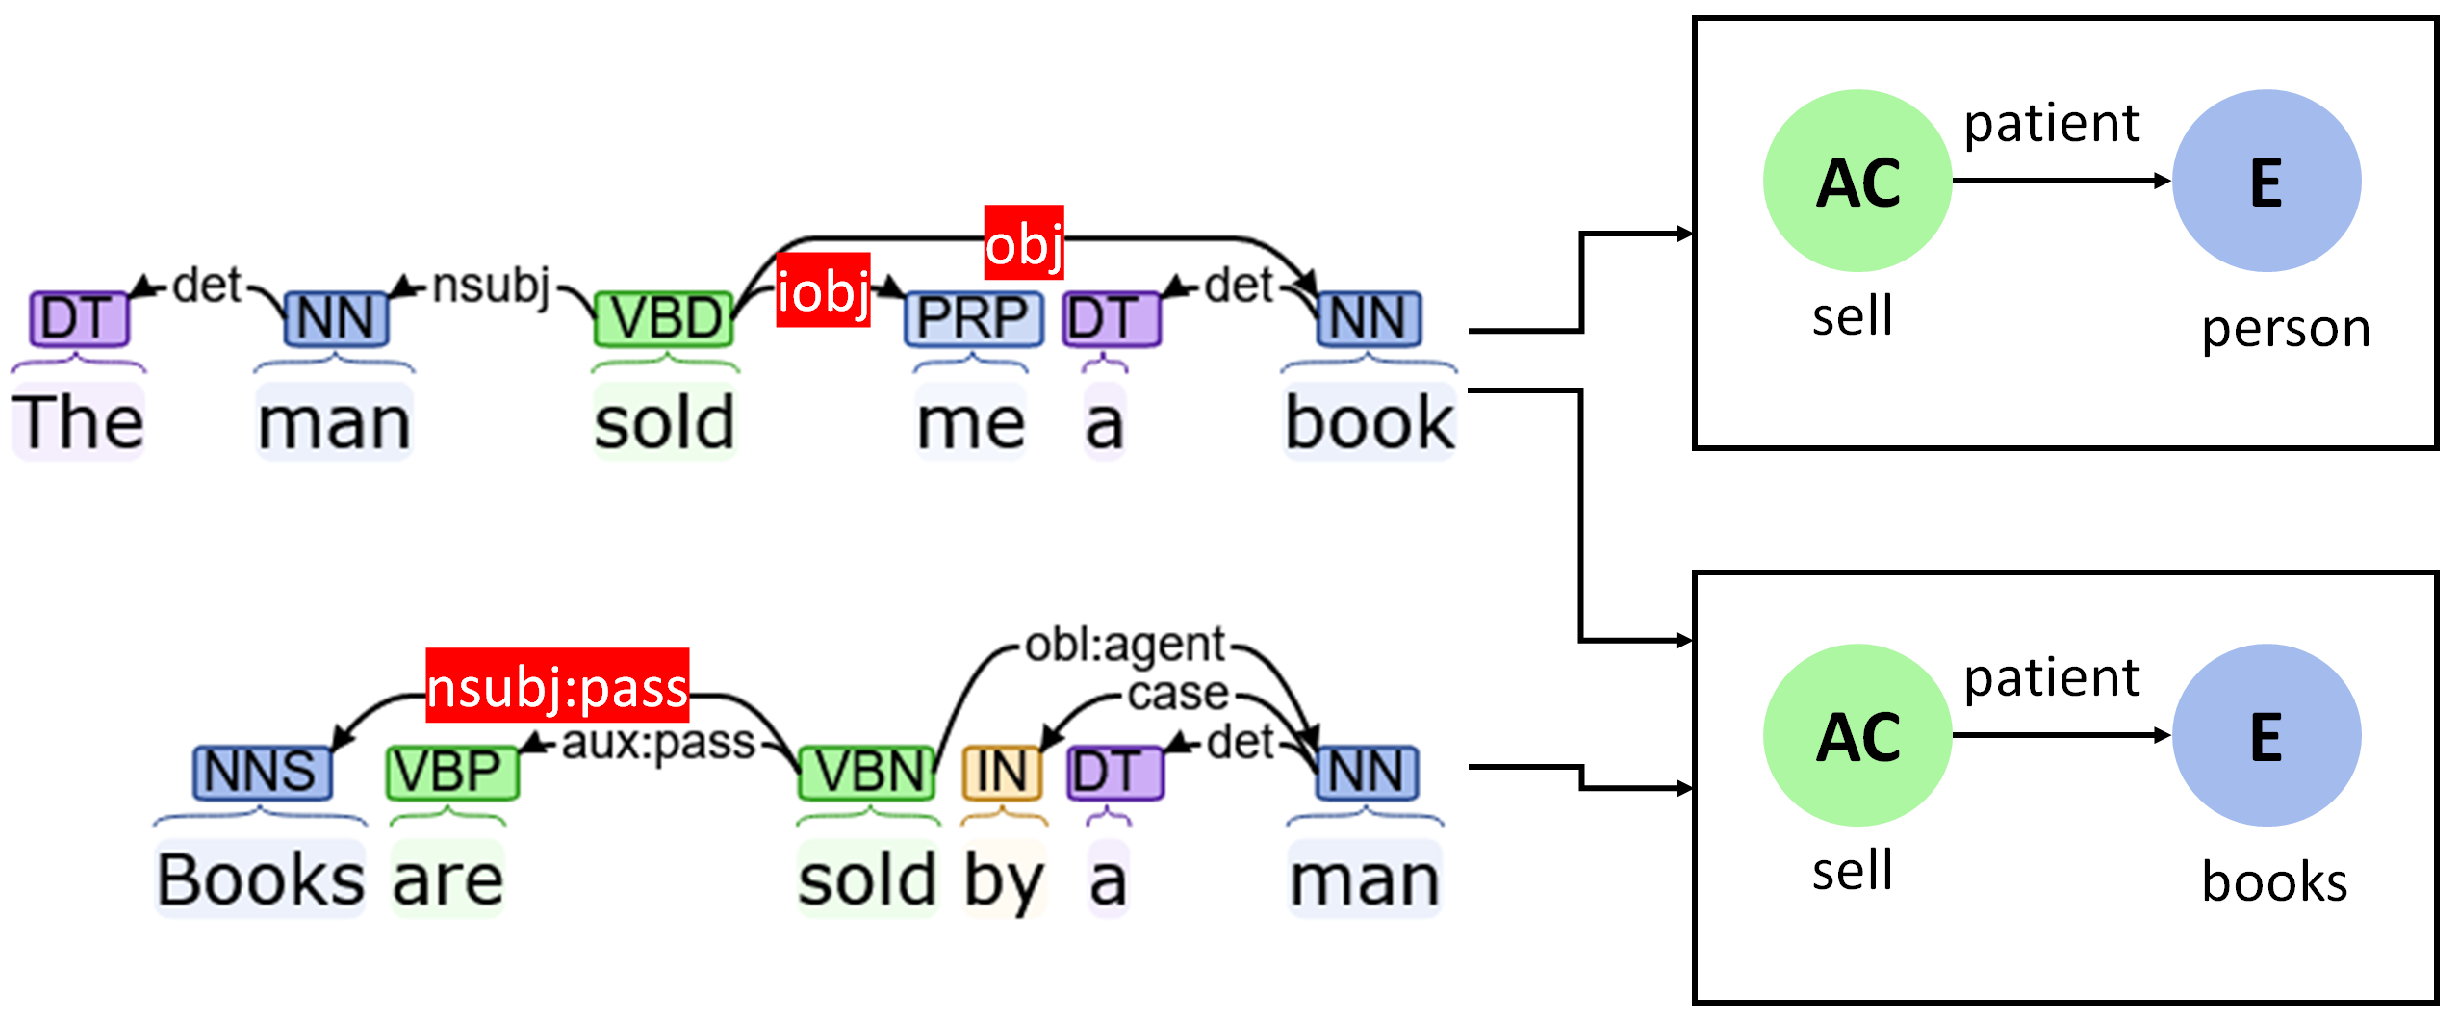
Some examples are demonstrated in Figure 5 regarding these dependencies and how “agent” edges can be created from them.

Patients 

Edges between actions and objects are tagged as “patient”. This defines which entities are affected by which actions. Patient relationships can be extracted from dependencies as follows:
  • (Direct) Objects (“obj”): Direct objects refer to entities who are the direct objects upon which the actions are performed. The edges in the graph corresponding to such dependencies are tagged as “patient”.
  • Indirect objects (“iobj”): Indirect objects are secondary objects that also are affected by the action along with the direct object. The corresponding edges also mark the entity as the “patient” of the action.
  • Passive object (“nsubj:pass”): When a verb is used in the passive tense, the subject in the sentence is actually the object upon which the action is performed. The effect is similar to previous situations.
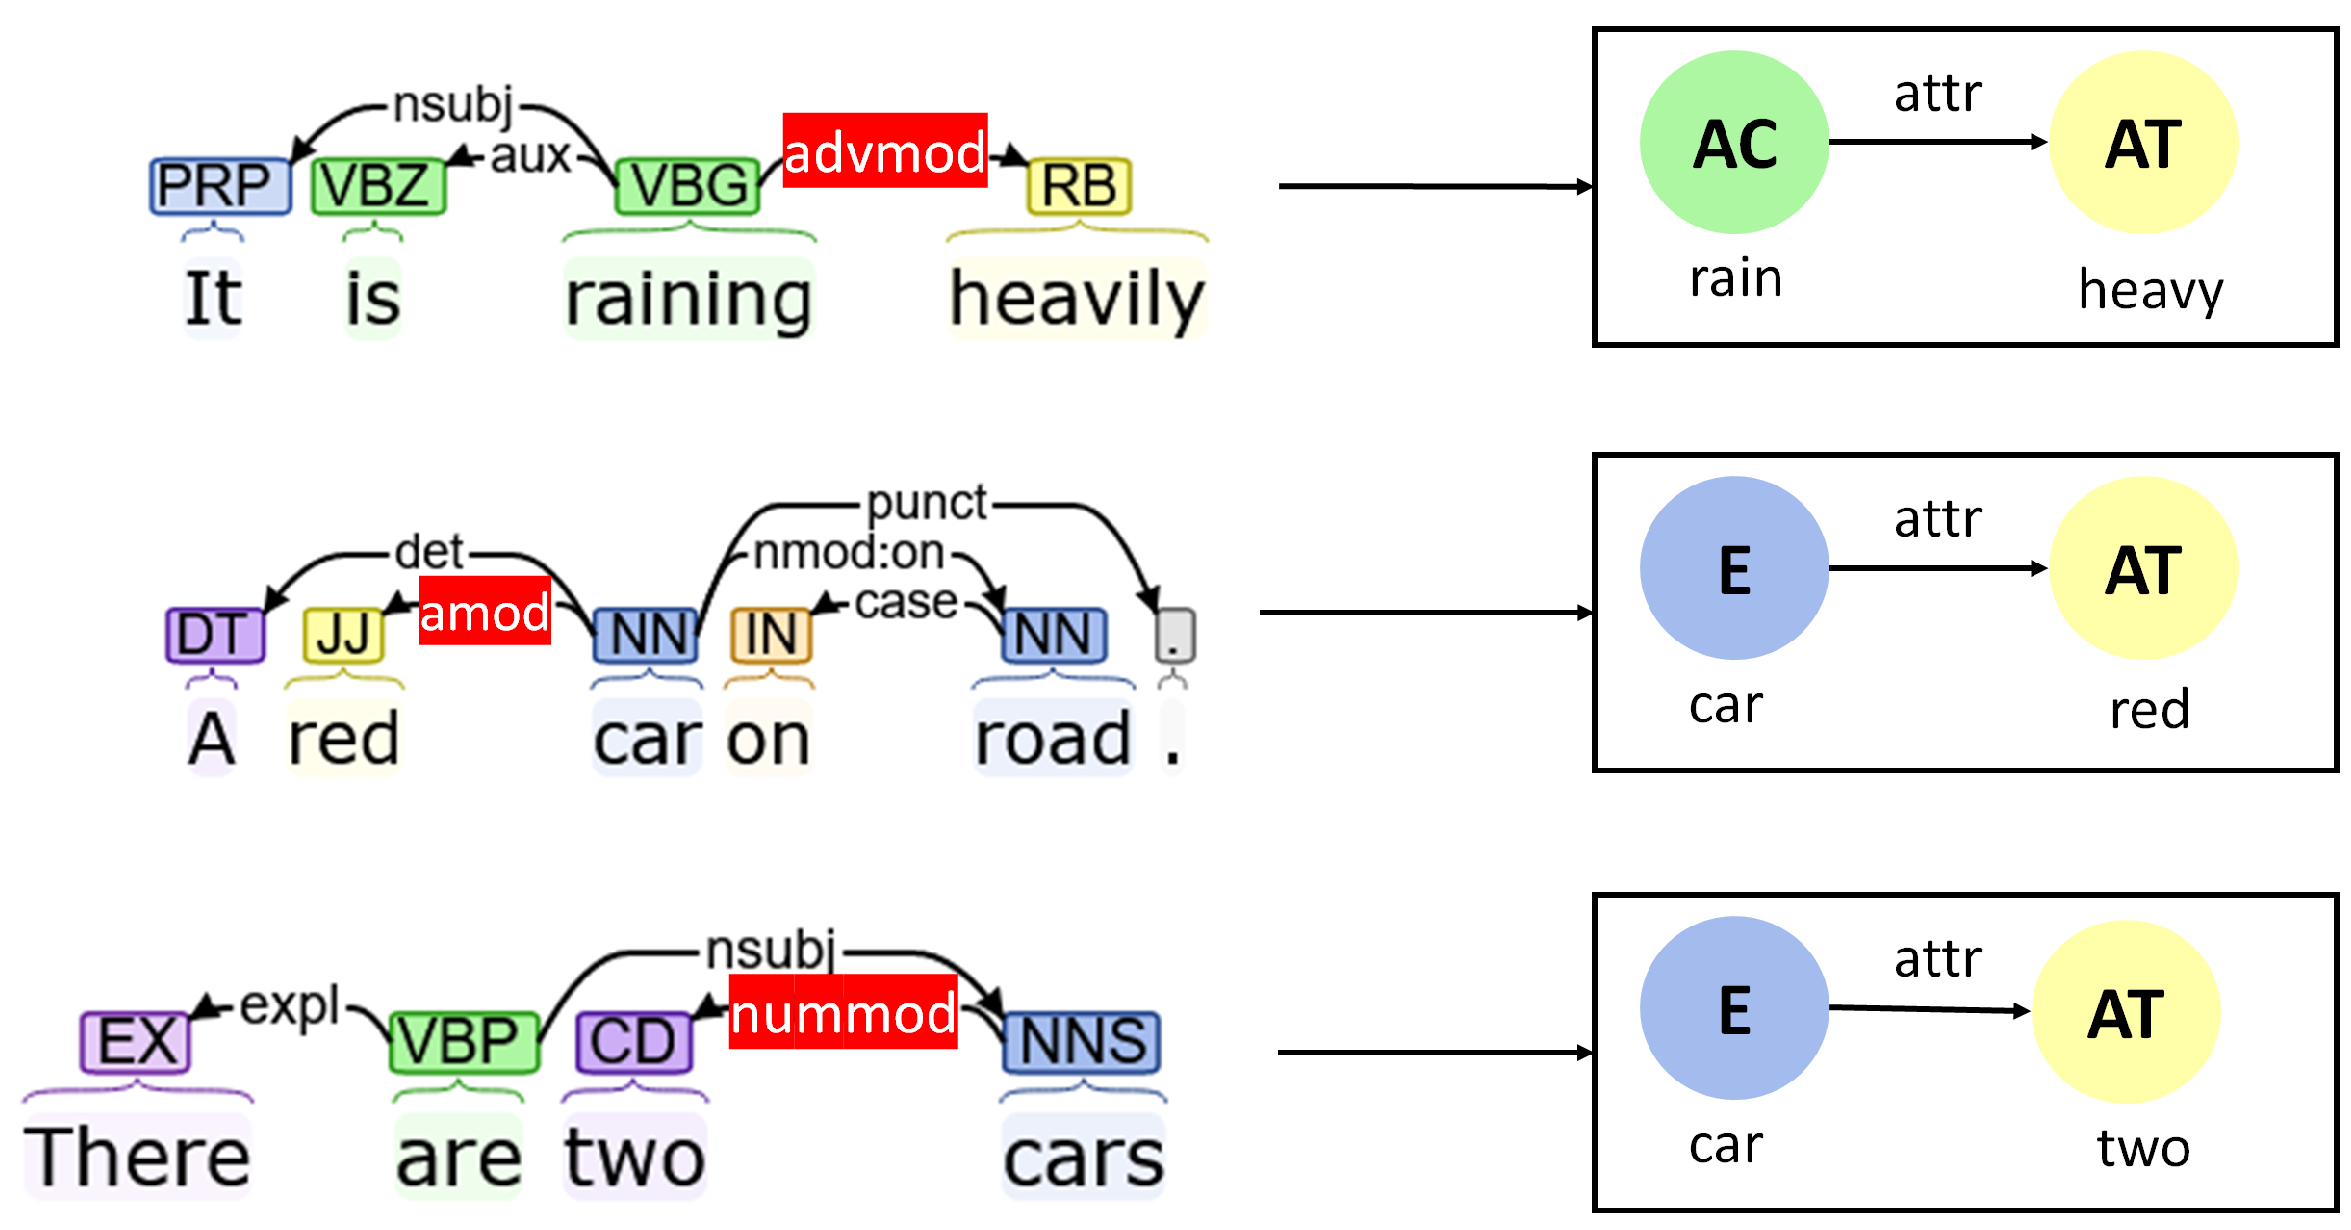
Some examples regarding these dependencies and how “patient” edges can be created from them are demonstrated in Figure 6.

Attributes 

In various situations, entities and actions can be further described on the basis of their qualitative properties. In cases such as these, “attr” edges are drawn between relevant nodes. Attribute edges can be extracted directly from the following dependencies:
  • Adverbial modifier (“advmod”): Adverbial modifiers are generally used to modify other verbs or other modifiers. They can be used to generate “attr” edges, which provide qualitative insights about other actions and attributes.
  • Adjectival modifier (“amod”): Adjectival modifiers are used to modify nouns and pronouns. In the context graph, they are used to define the attributes of entities.
  • Numeric modifier (“nummod”): While adjectival modifiers describe an entity qualitatively, numeric modifiers define them quantitatively. Numeric modifiers are thus used to define the attributes corresponding to the number of entities.
Some examples regarding these dependencies and how “attr” edges can be created from them are demonstrated in Figure 7.
Under some special circumstances, attributes can also be extracted indirectly from dependencies as follows:
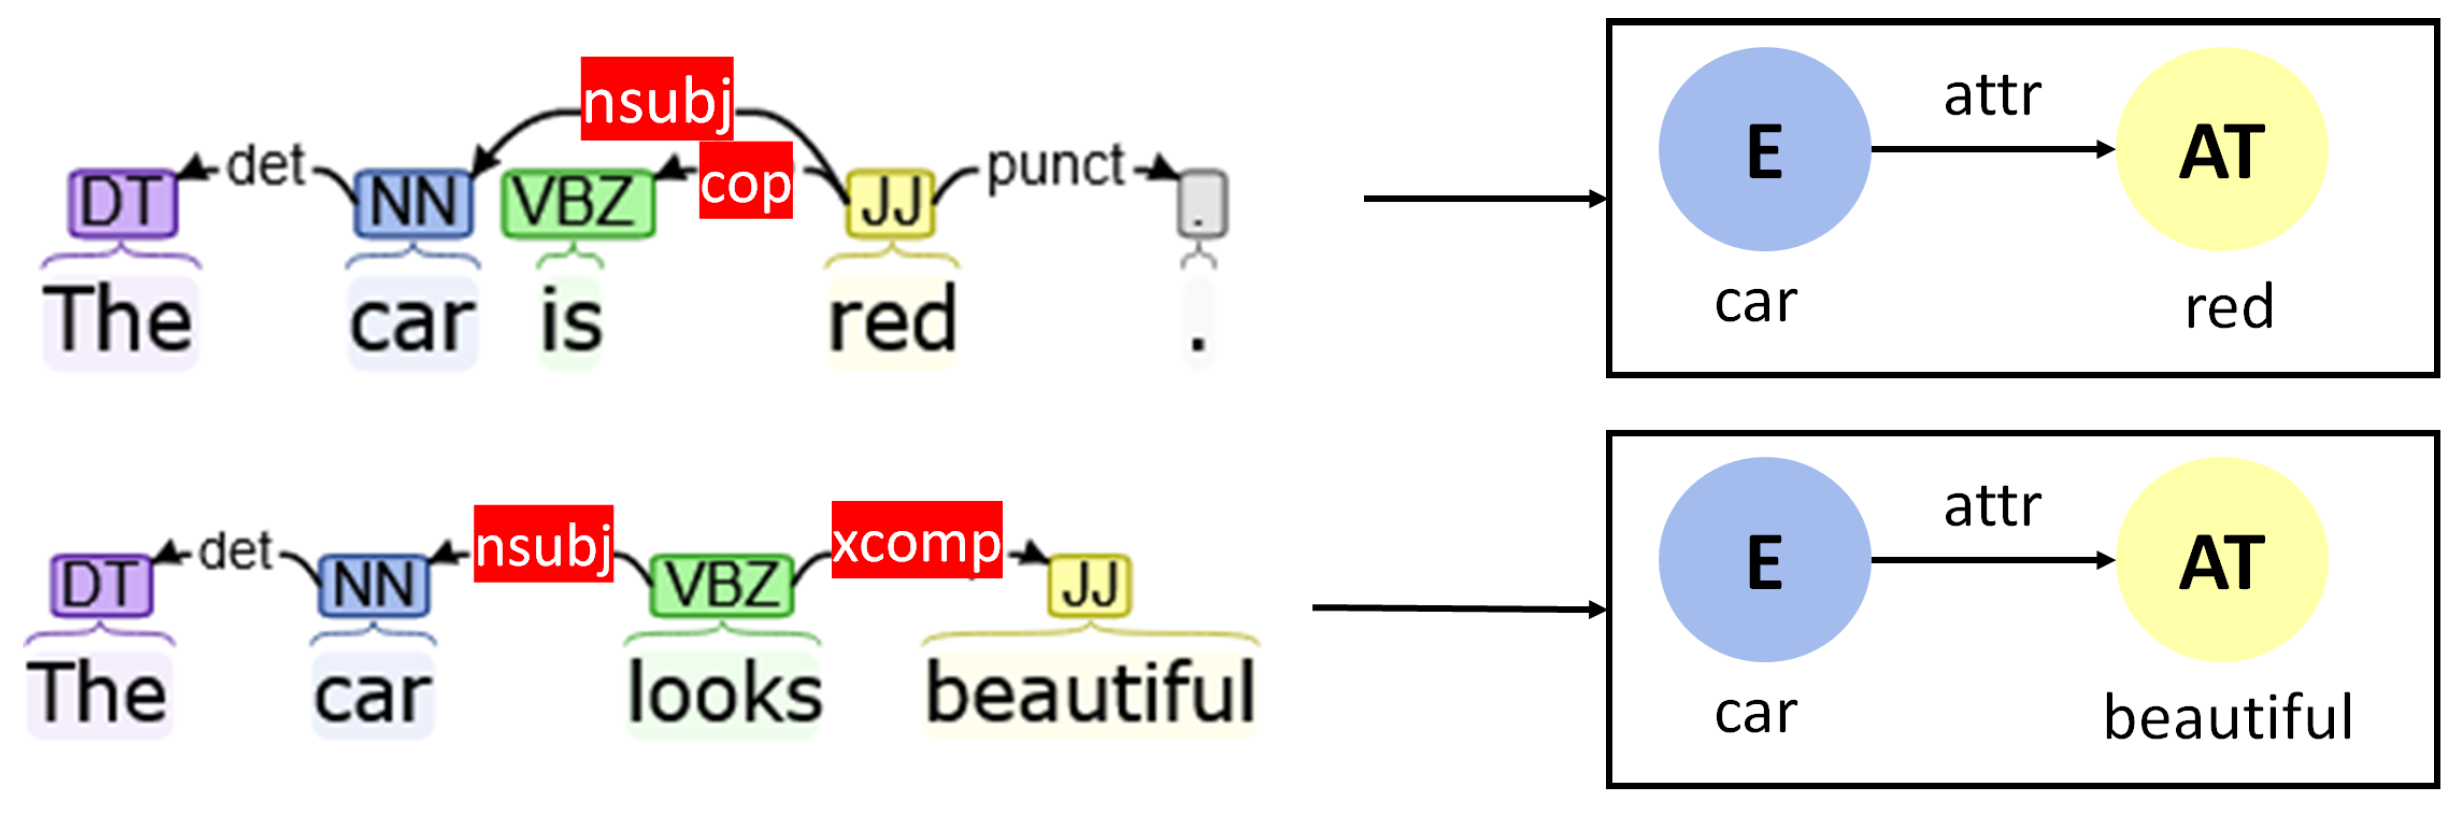
  • Copula (“cop”): Copulas are used in those cases where entities are connected to an attribute using an auxiliary such as “is”. In the case of copulas, the auxiliary is connected to the attributes, which are in turn connected to the entity using a “nsubj” dependency.
  • Open clausal complement (“xcomp”): Open clausal complements define the properties of an object through a verb that corresponds to a sensory action such as “looks beautiful” or “feels soft”.
Some examples regarding these dependencies and how “attr” edges can be created from these special dependencies are demonstrated in Figure 8.

Spatial Relations

Relations can also be drawn based on the relative spatial properties of the entities and actions in the scene. Such edges are primarily drawn between two entities or between an entity and an action. This type of spatial relation is mostly conveyed through the use of prepositions. Some ways in which spatial relations can be drawn are:
  • Oblique dependencies with preposition (“obl:preposition”): In this case, a verb is connected to a preposition using an oblique relationship. This type of dependency can be used to establish the location of an action in a scene.
  • Noun modifiers with preposition (“nmod:preposition”): Noun modifiers can also be used to connect two nouns with a preposition, which reflects the relative spatial interaction between them. In the concept graph, this dependency can be used to interpret similar relations among entities.
Some examples regarding these dependencies and how “patient” edges can be created from them are demonstrated in Figure 9.

Special Relations

Besides the previous general types of relationships that can be drawn from various dependencies, there are some more dependencies that can reveal visual concepts:
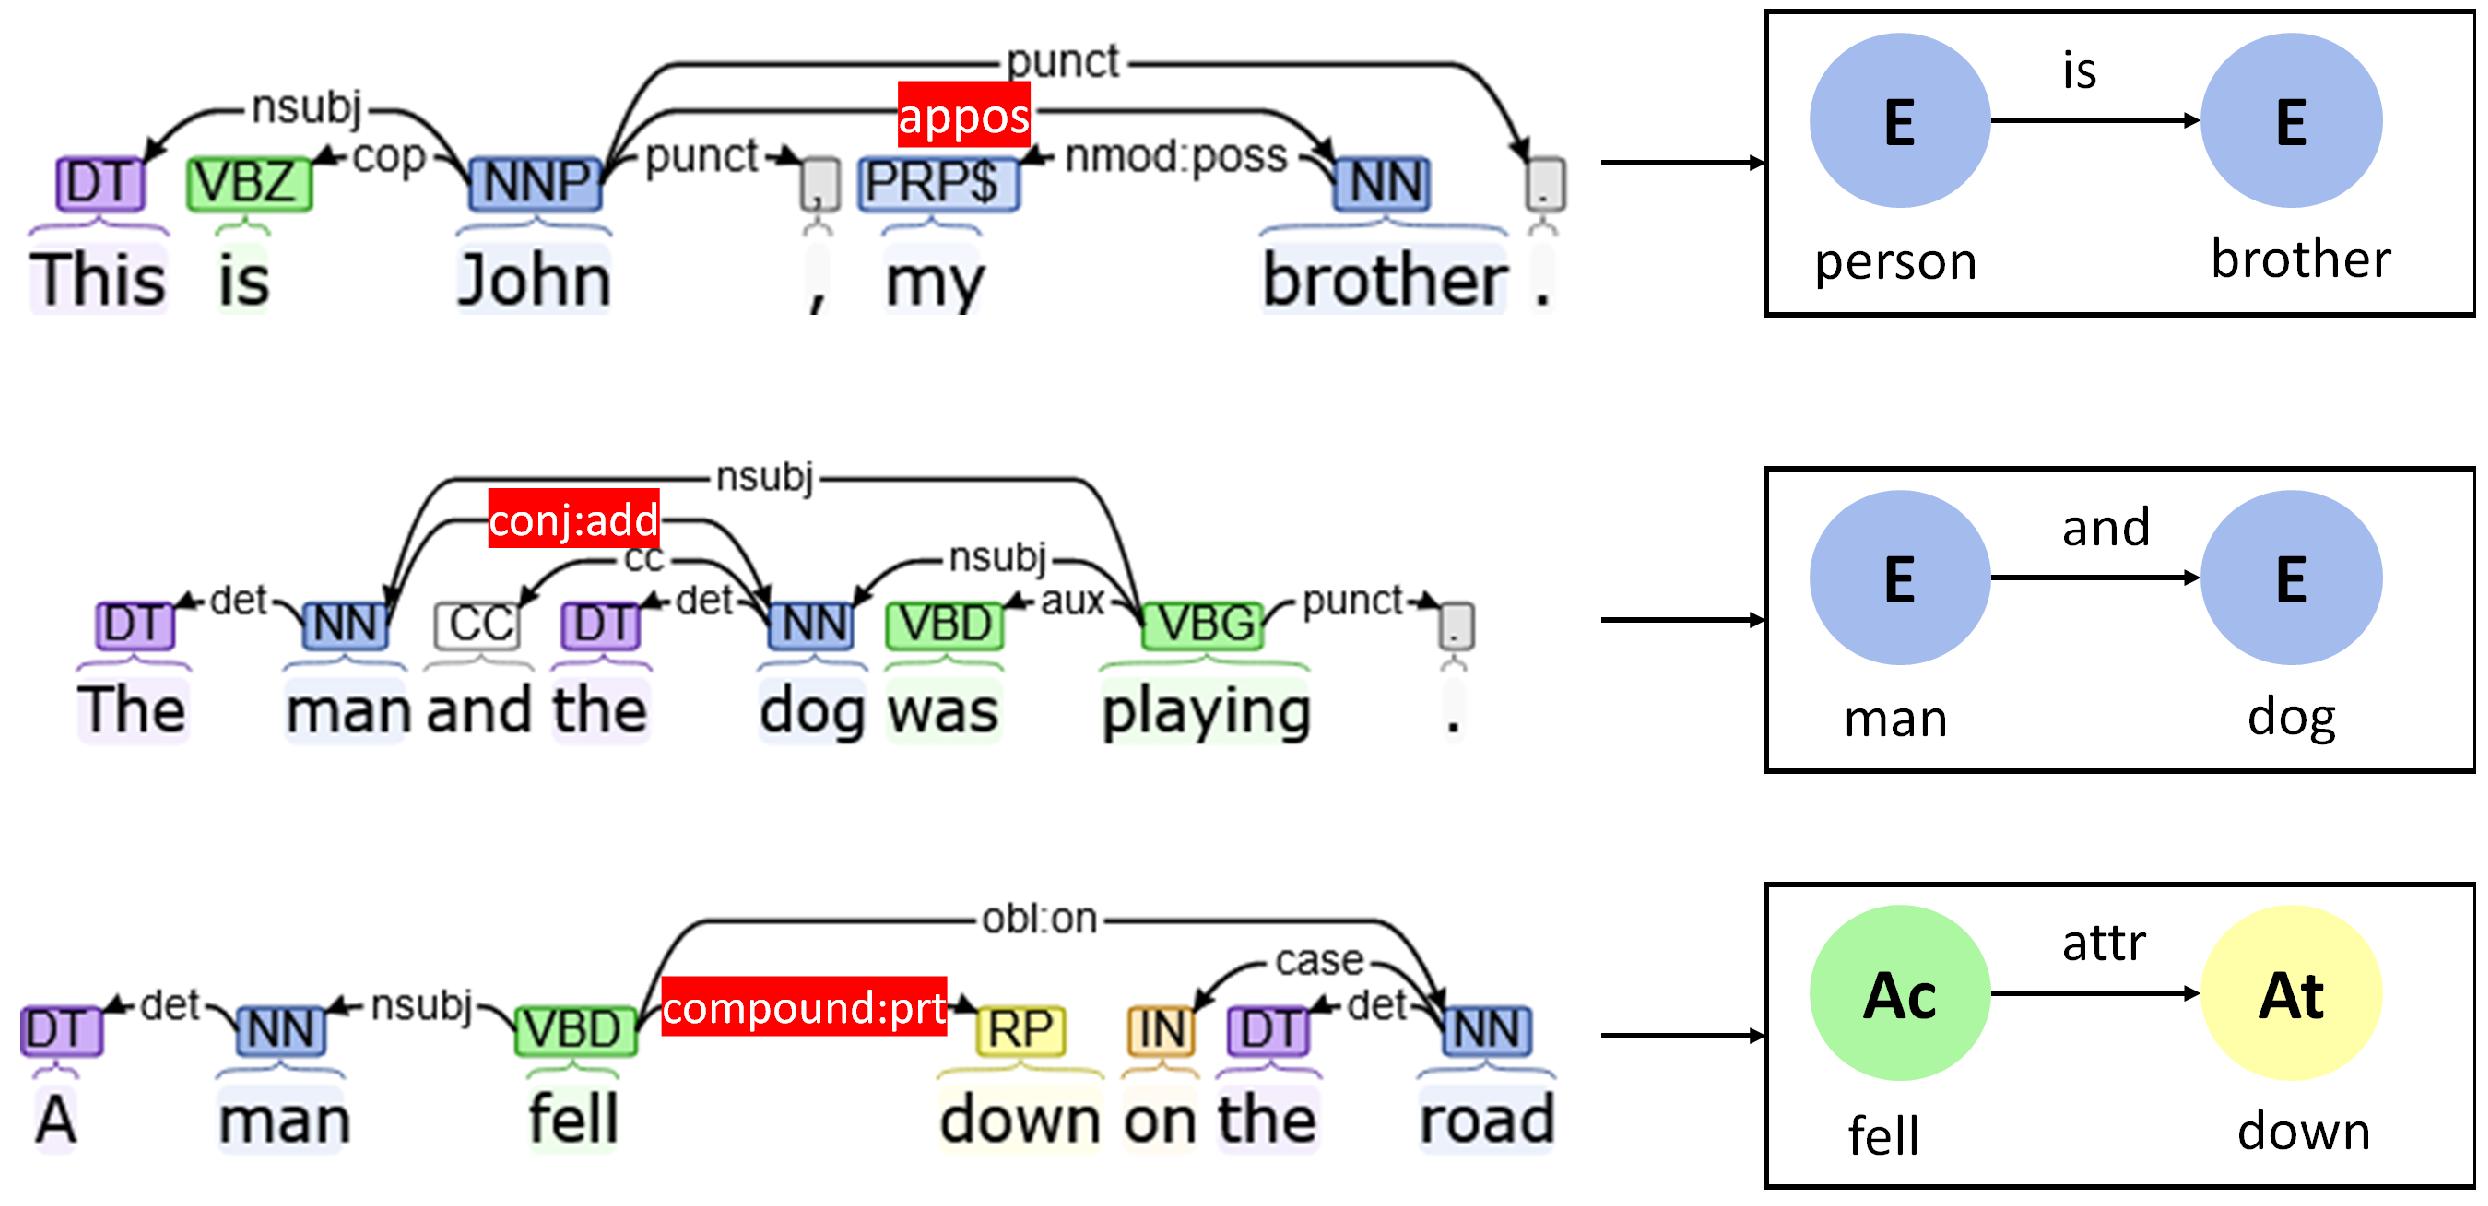
  • Appositional modifiers (“appos”): Appositional modifiers of nouns are used when one noun acts as a descriptor for another noun. They are used in several situations such as “President Kalam” or “My brother, Rishi” or an abbreviation of a name of an entity. This is reflected by an “is” edge in the concept graph to illustrate that one entity acts as an alias of the other entity.
  • Conjunction (“conj”): Conjunctions are used to group together multiple entities, attributes, or actions that exist in a similar environment. Enhanced++ dependencies automatically share the subjects’ attributes and actions with all members of the conjuncture. This can be used to group together several entities, attributes, and actions in an image as well.
  • Compound participle (“compound:prt”): Compound participles modify the behaviors of verbs that emphasize the corresponding action such as “fell down”
Some example of such uses are demonstrated in Figure 10.
All the protocols for creating edges are summarized in Table 2. Using the approach mentioned above, we generated rich graphs for the captions generated from the located regions of interest, as shown in Figure 4.

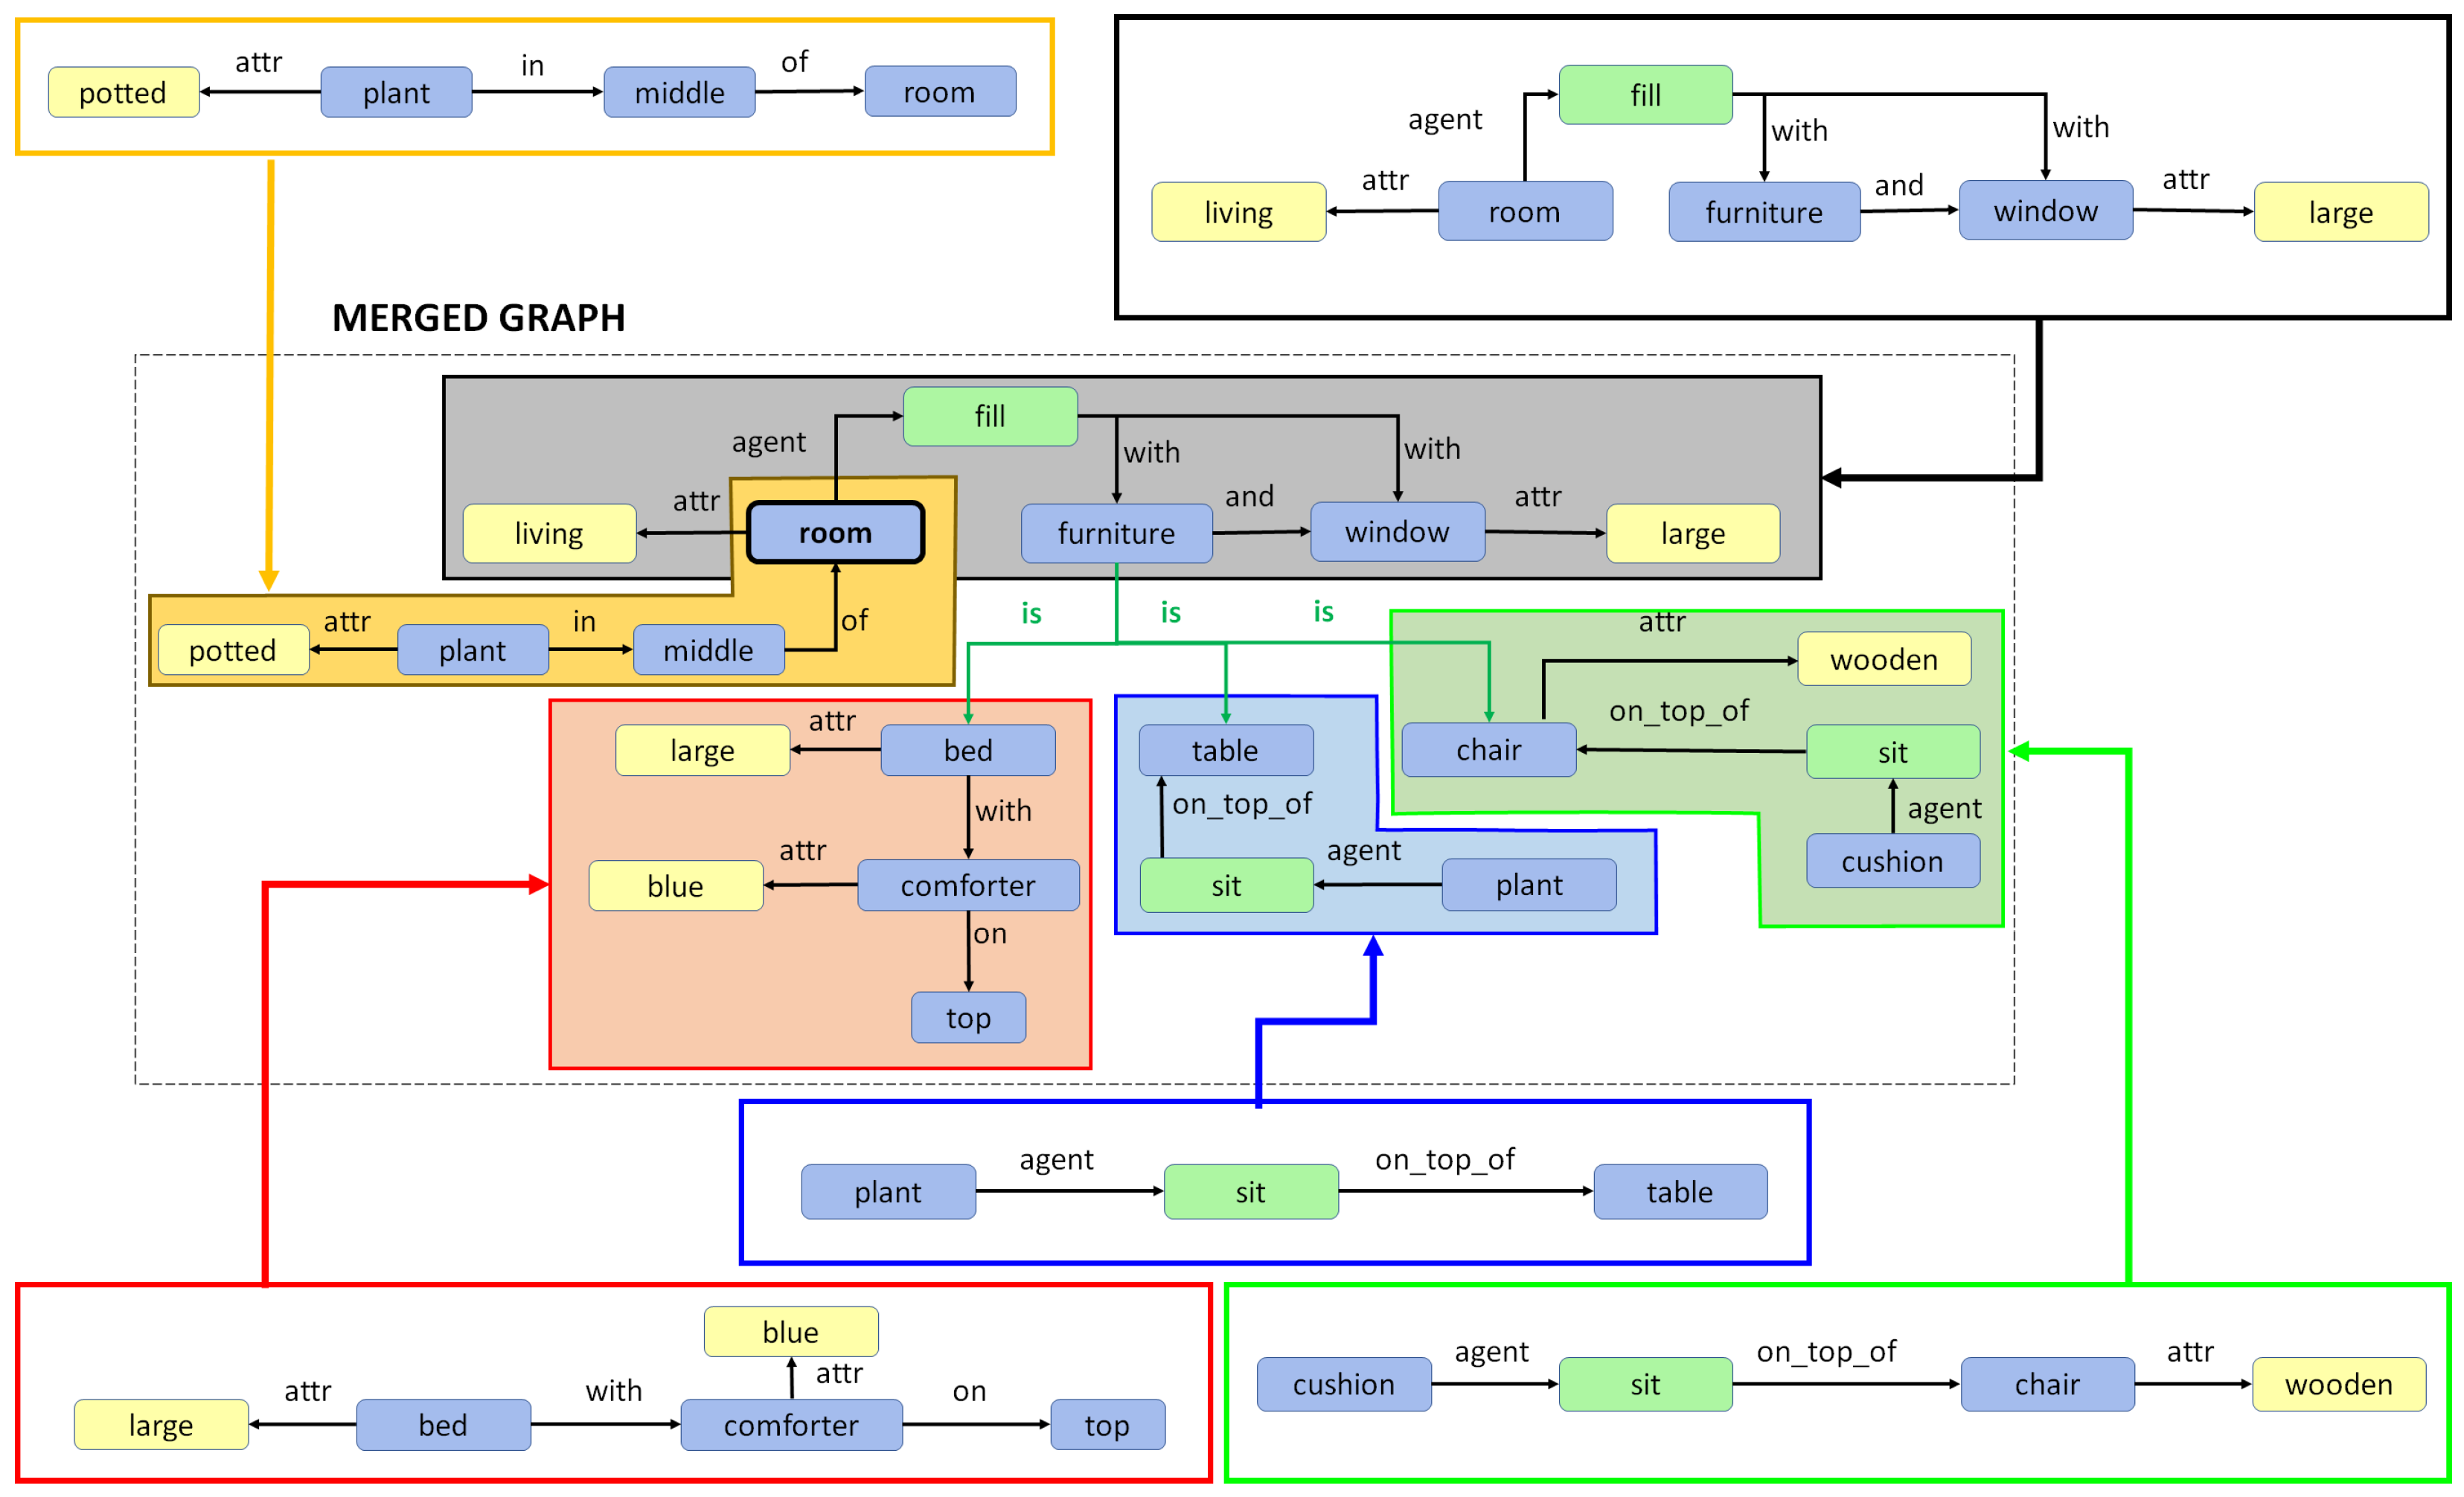
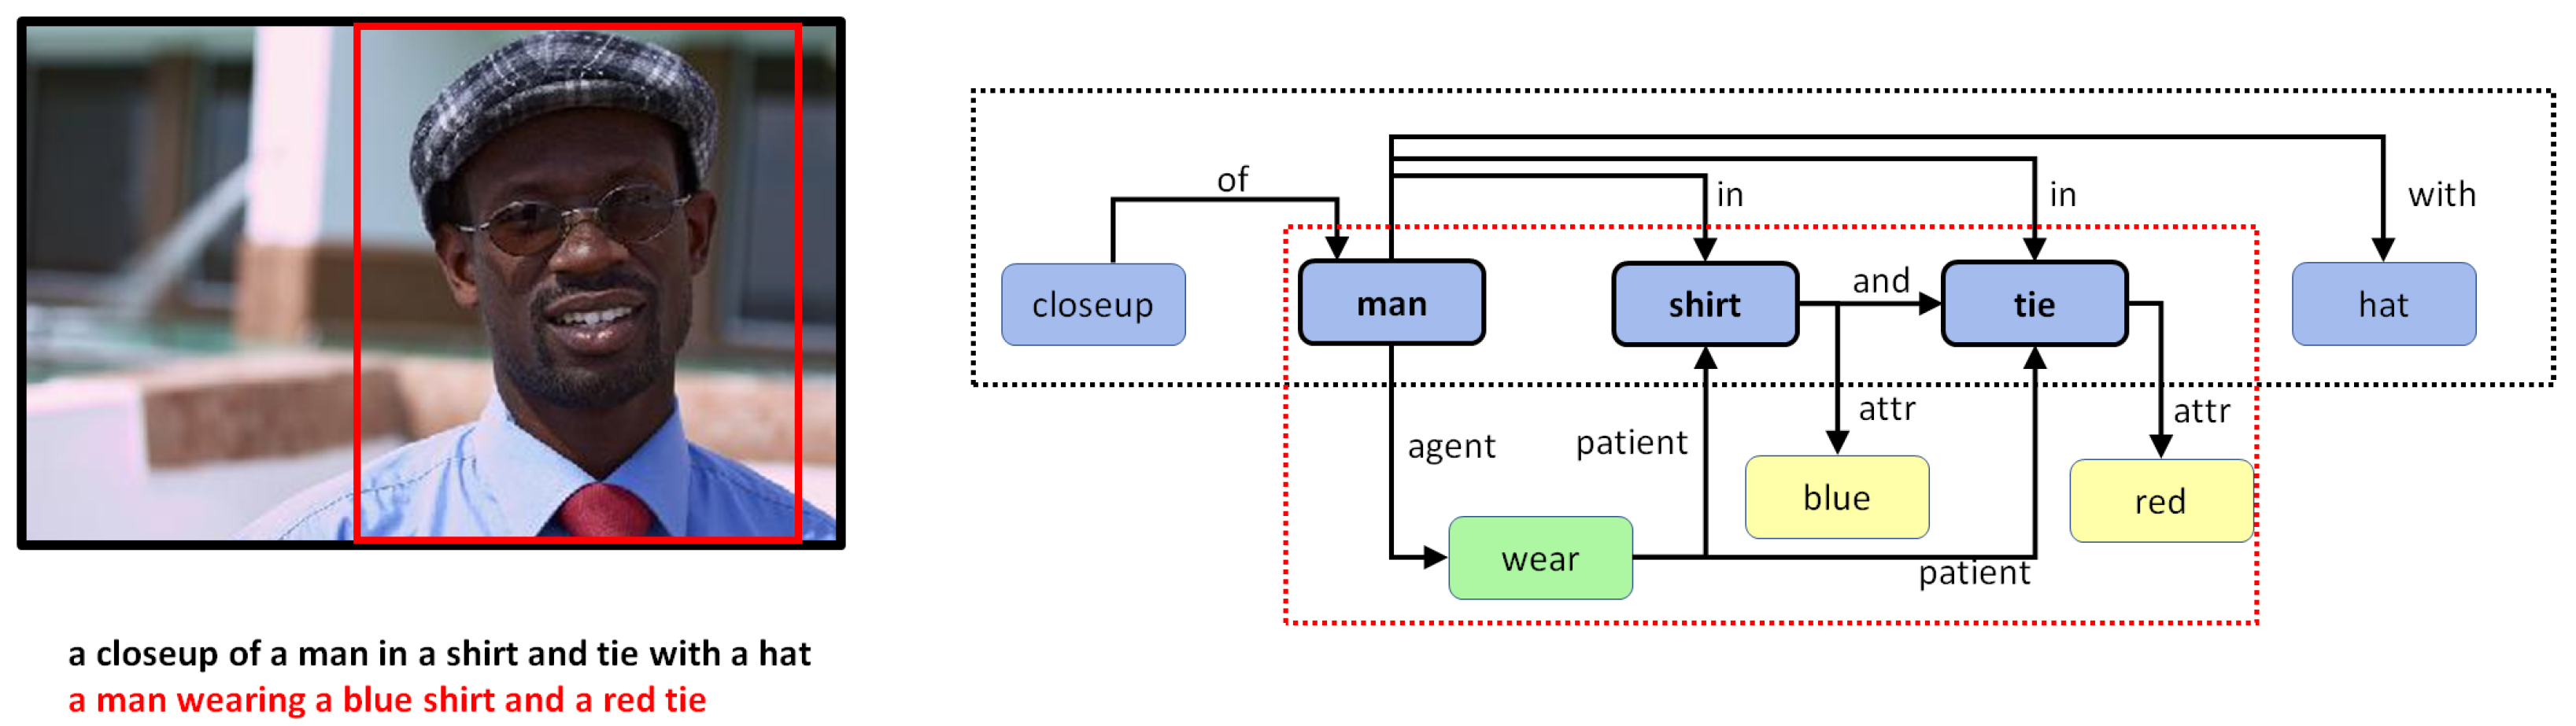
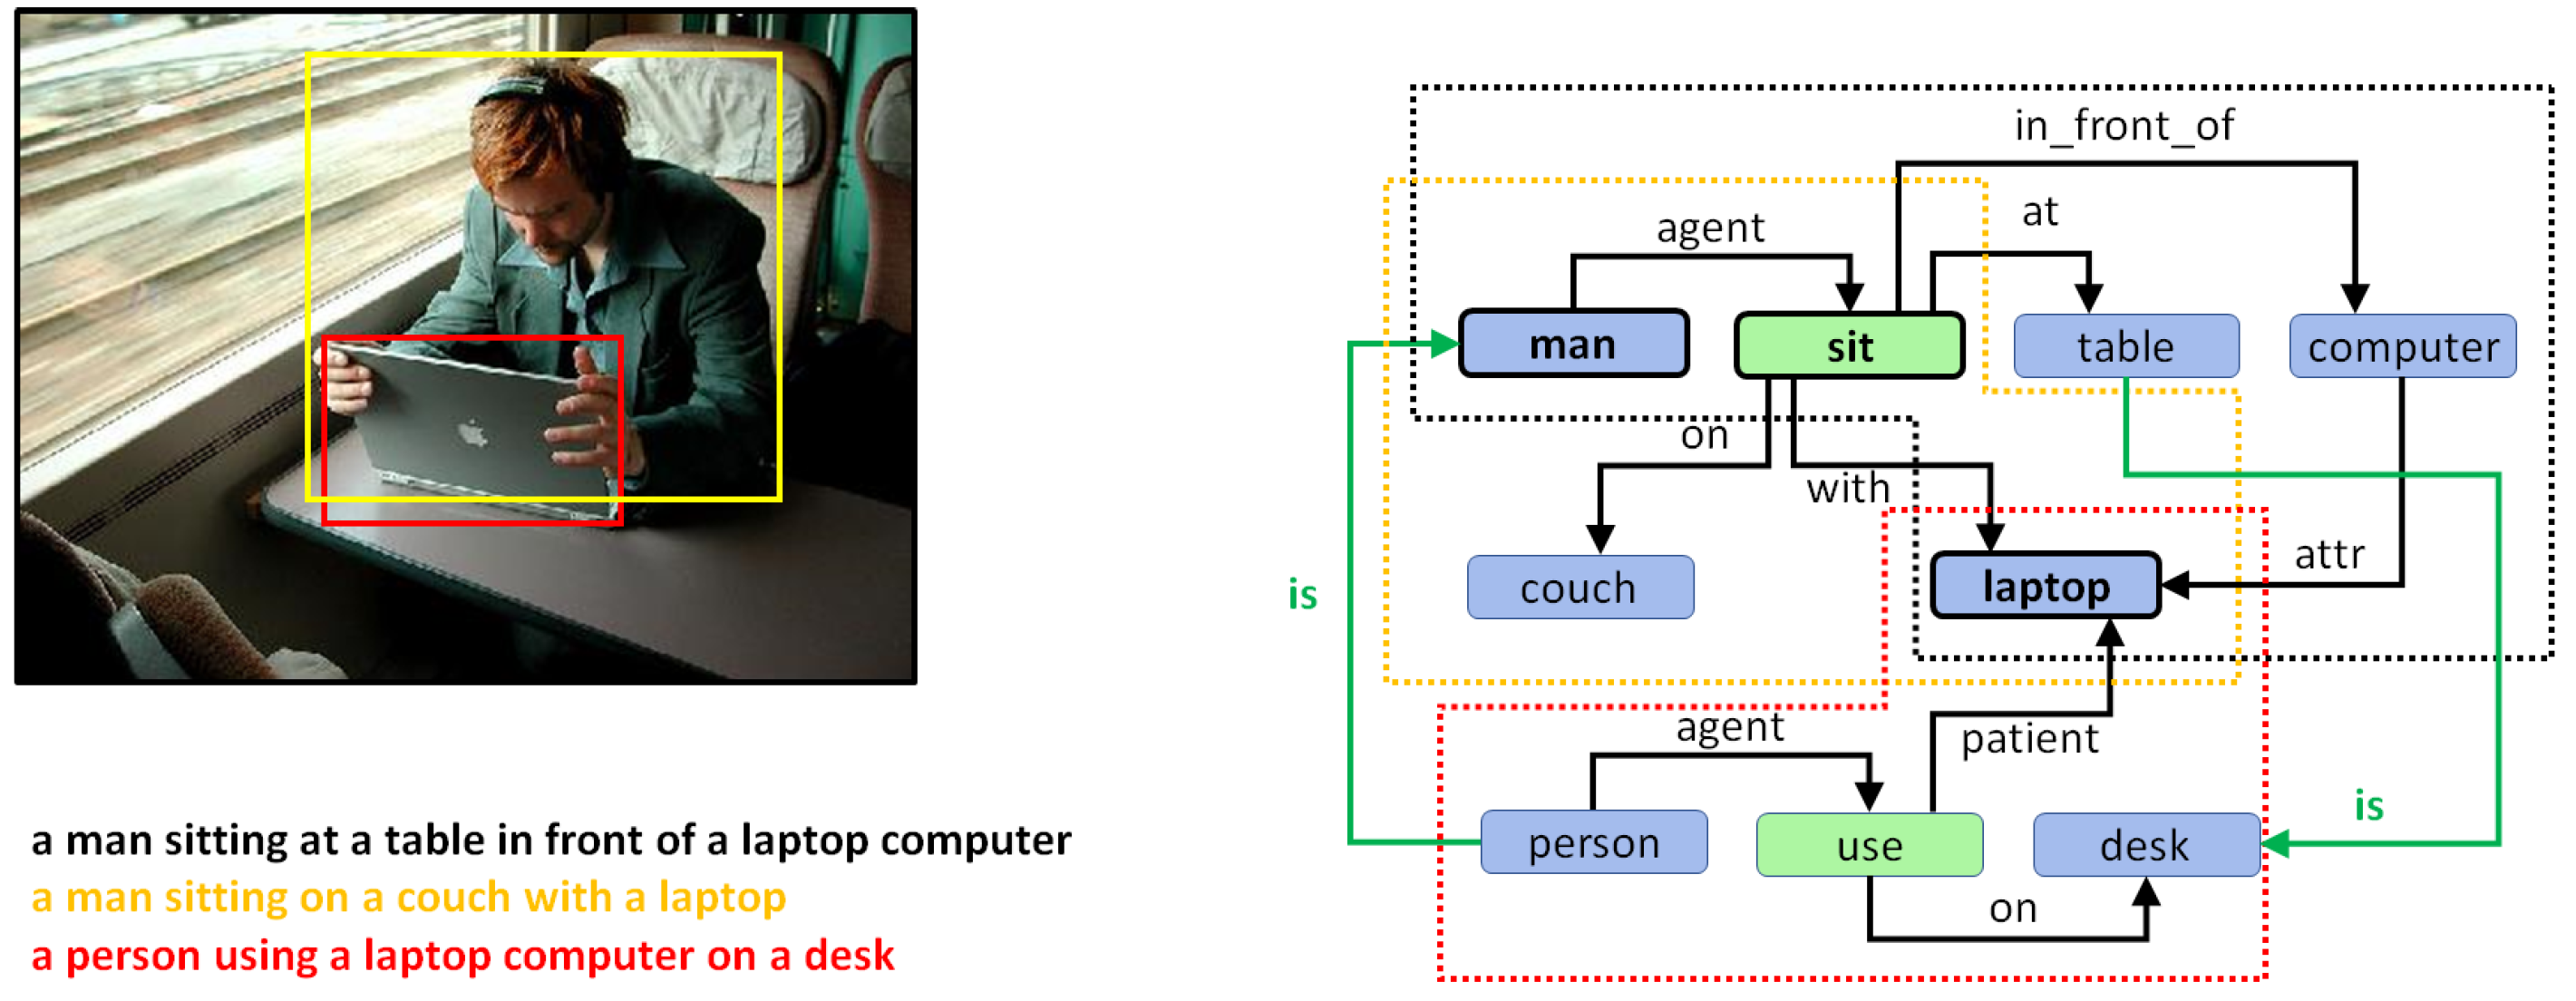
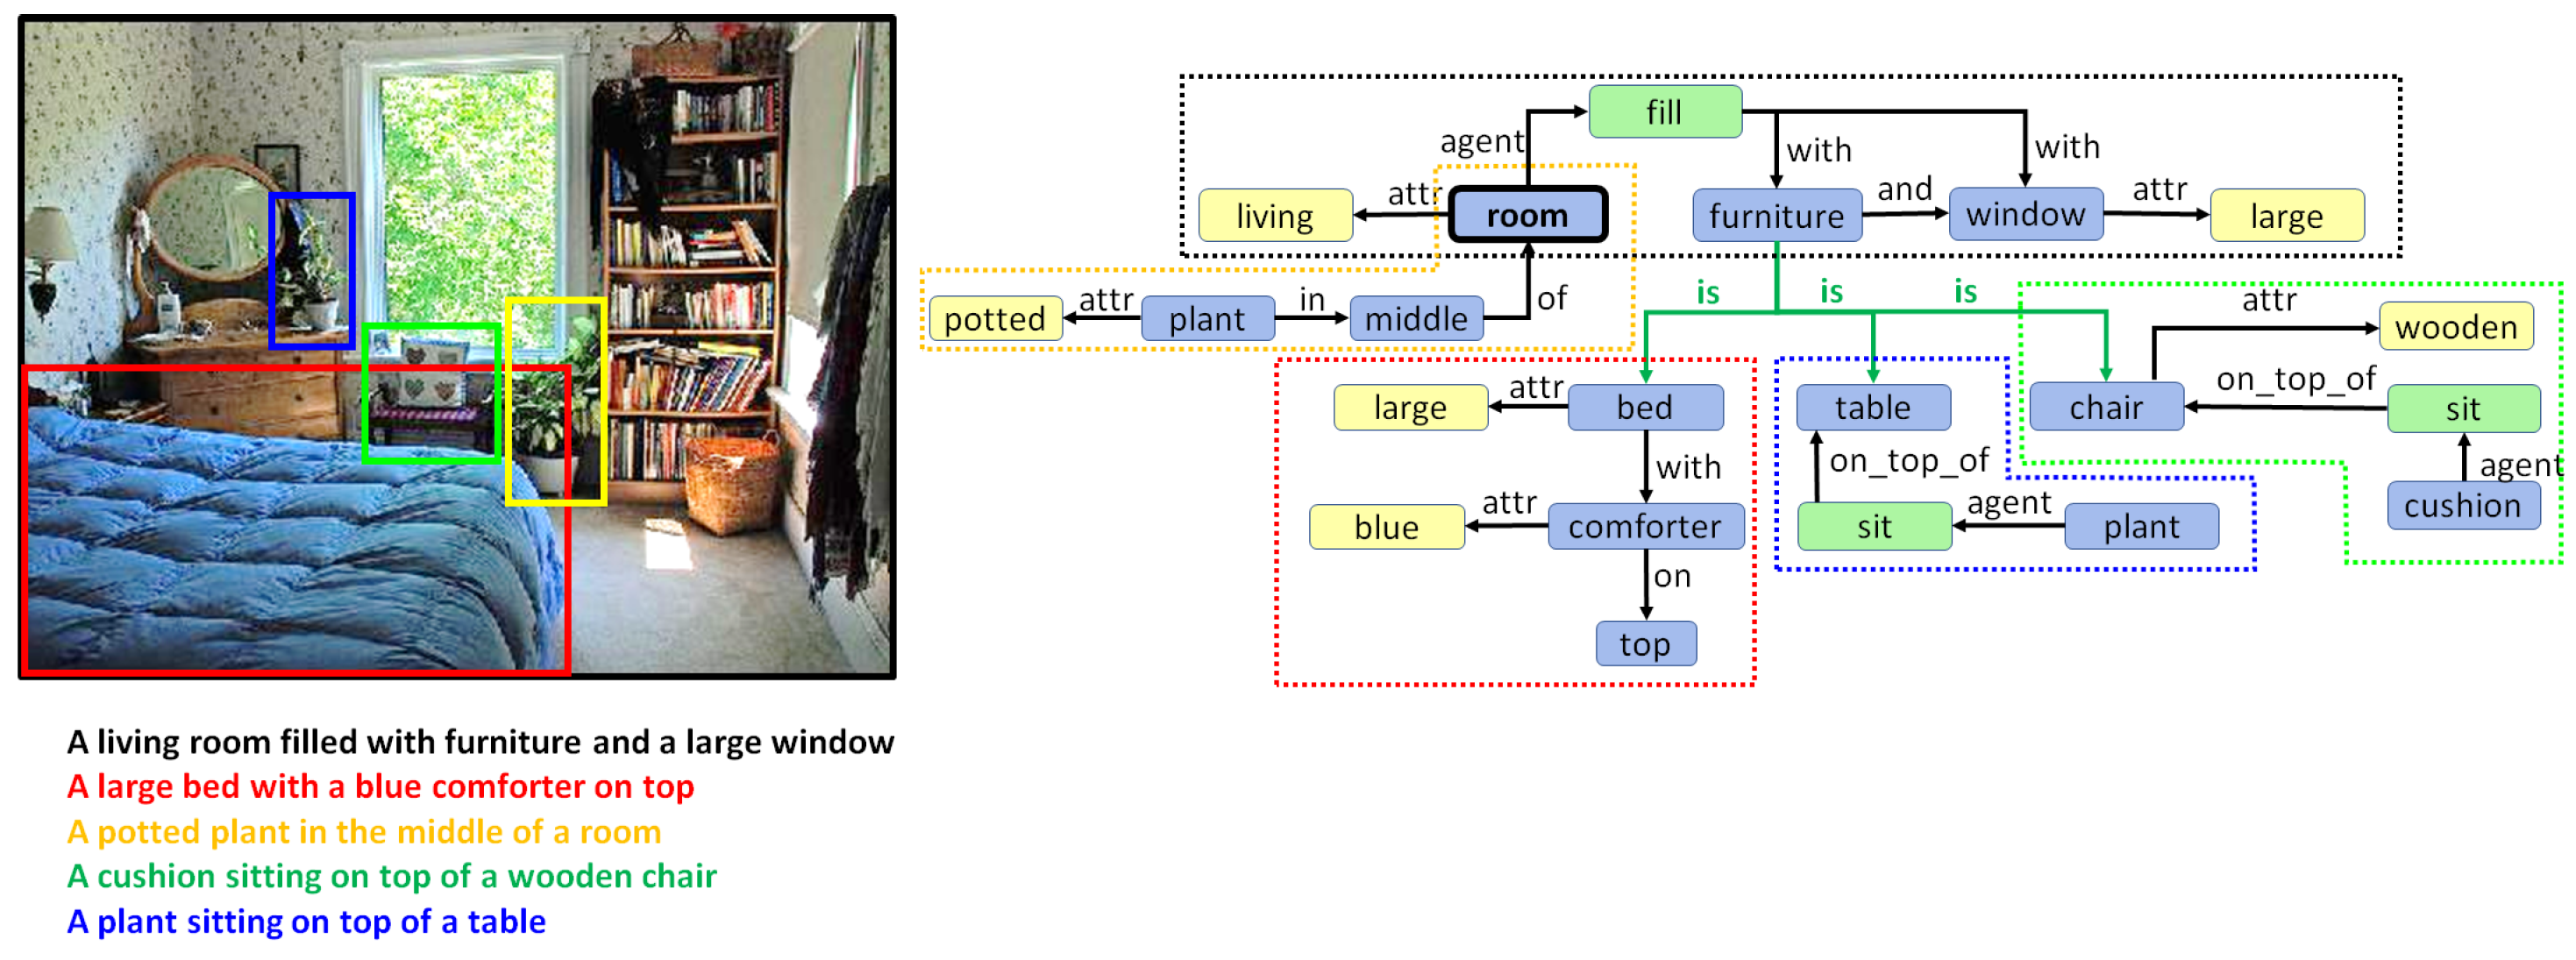
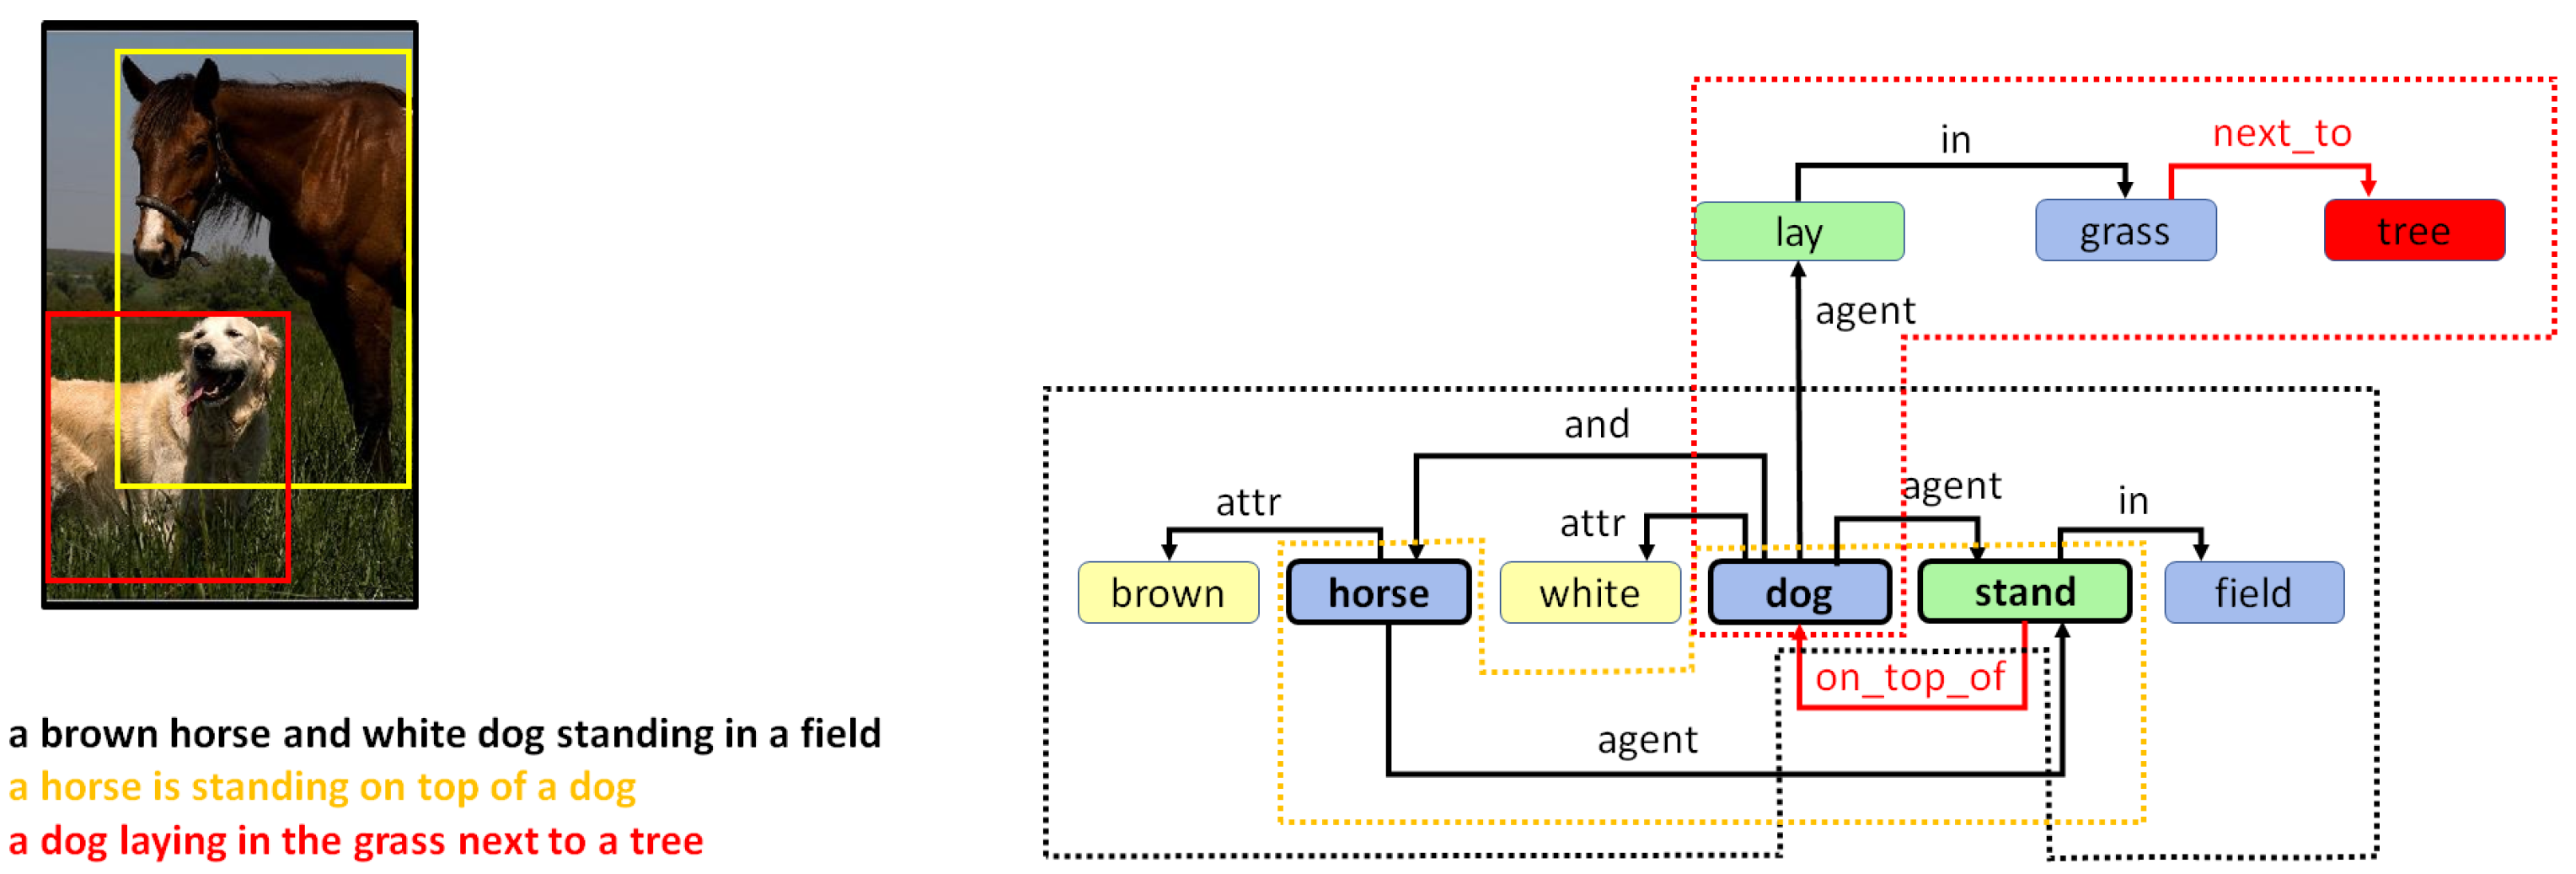
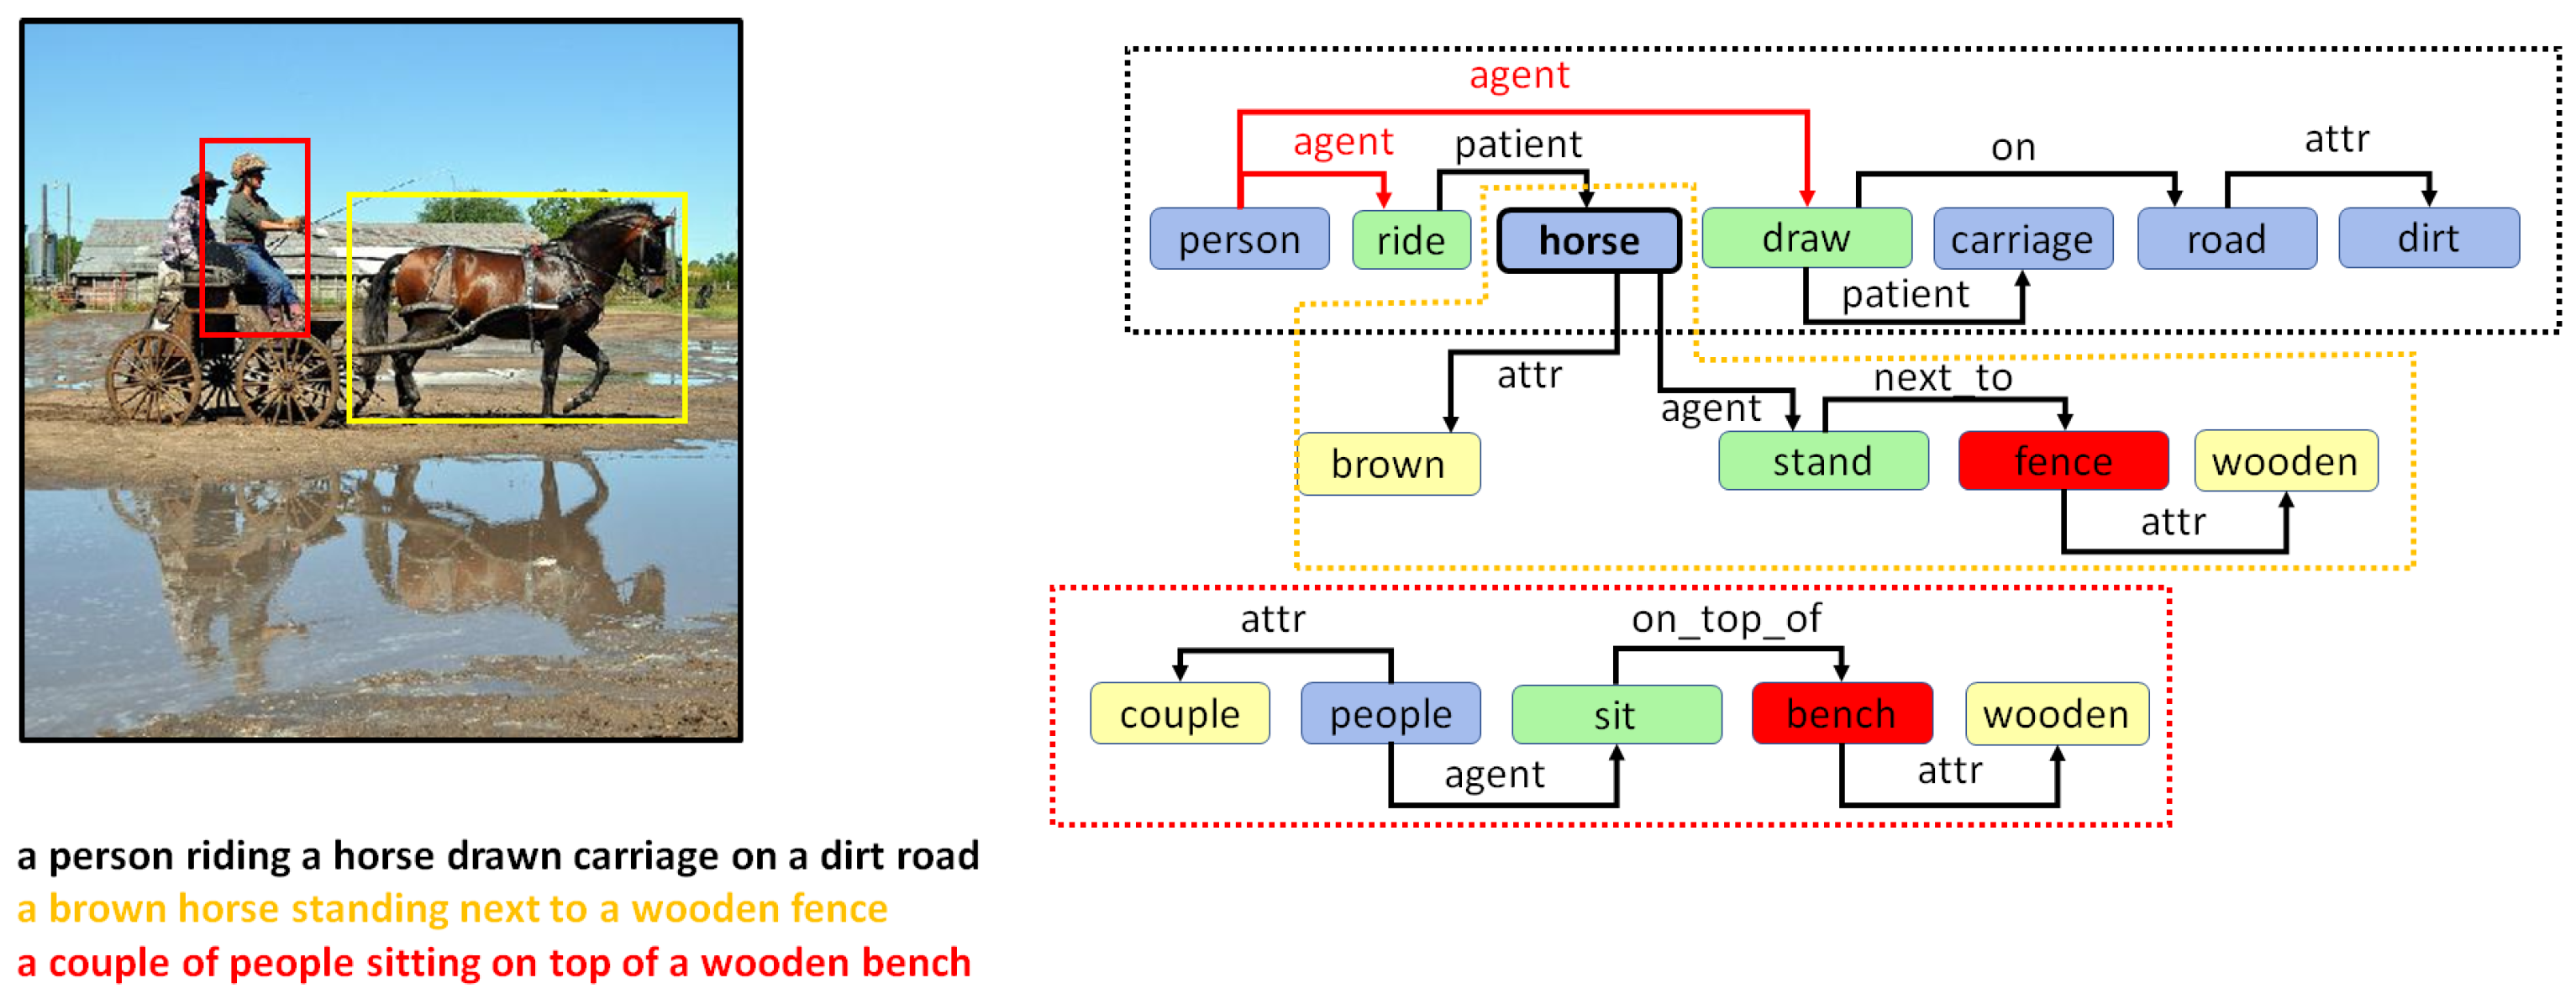
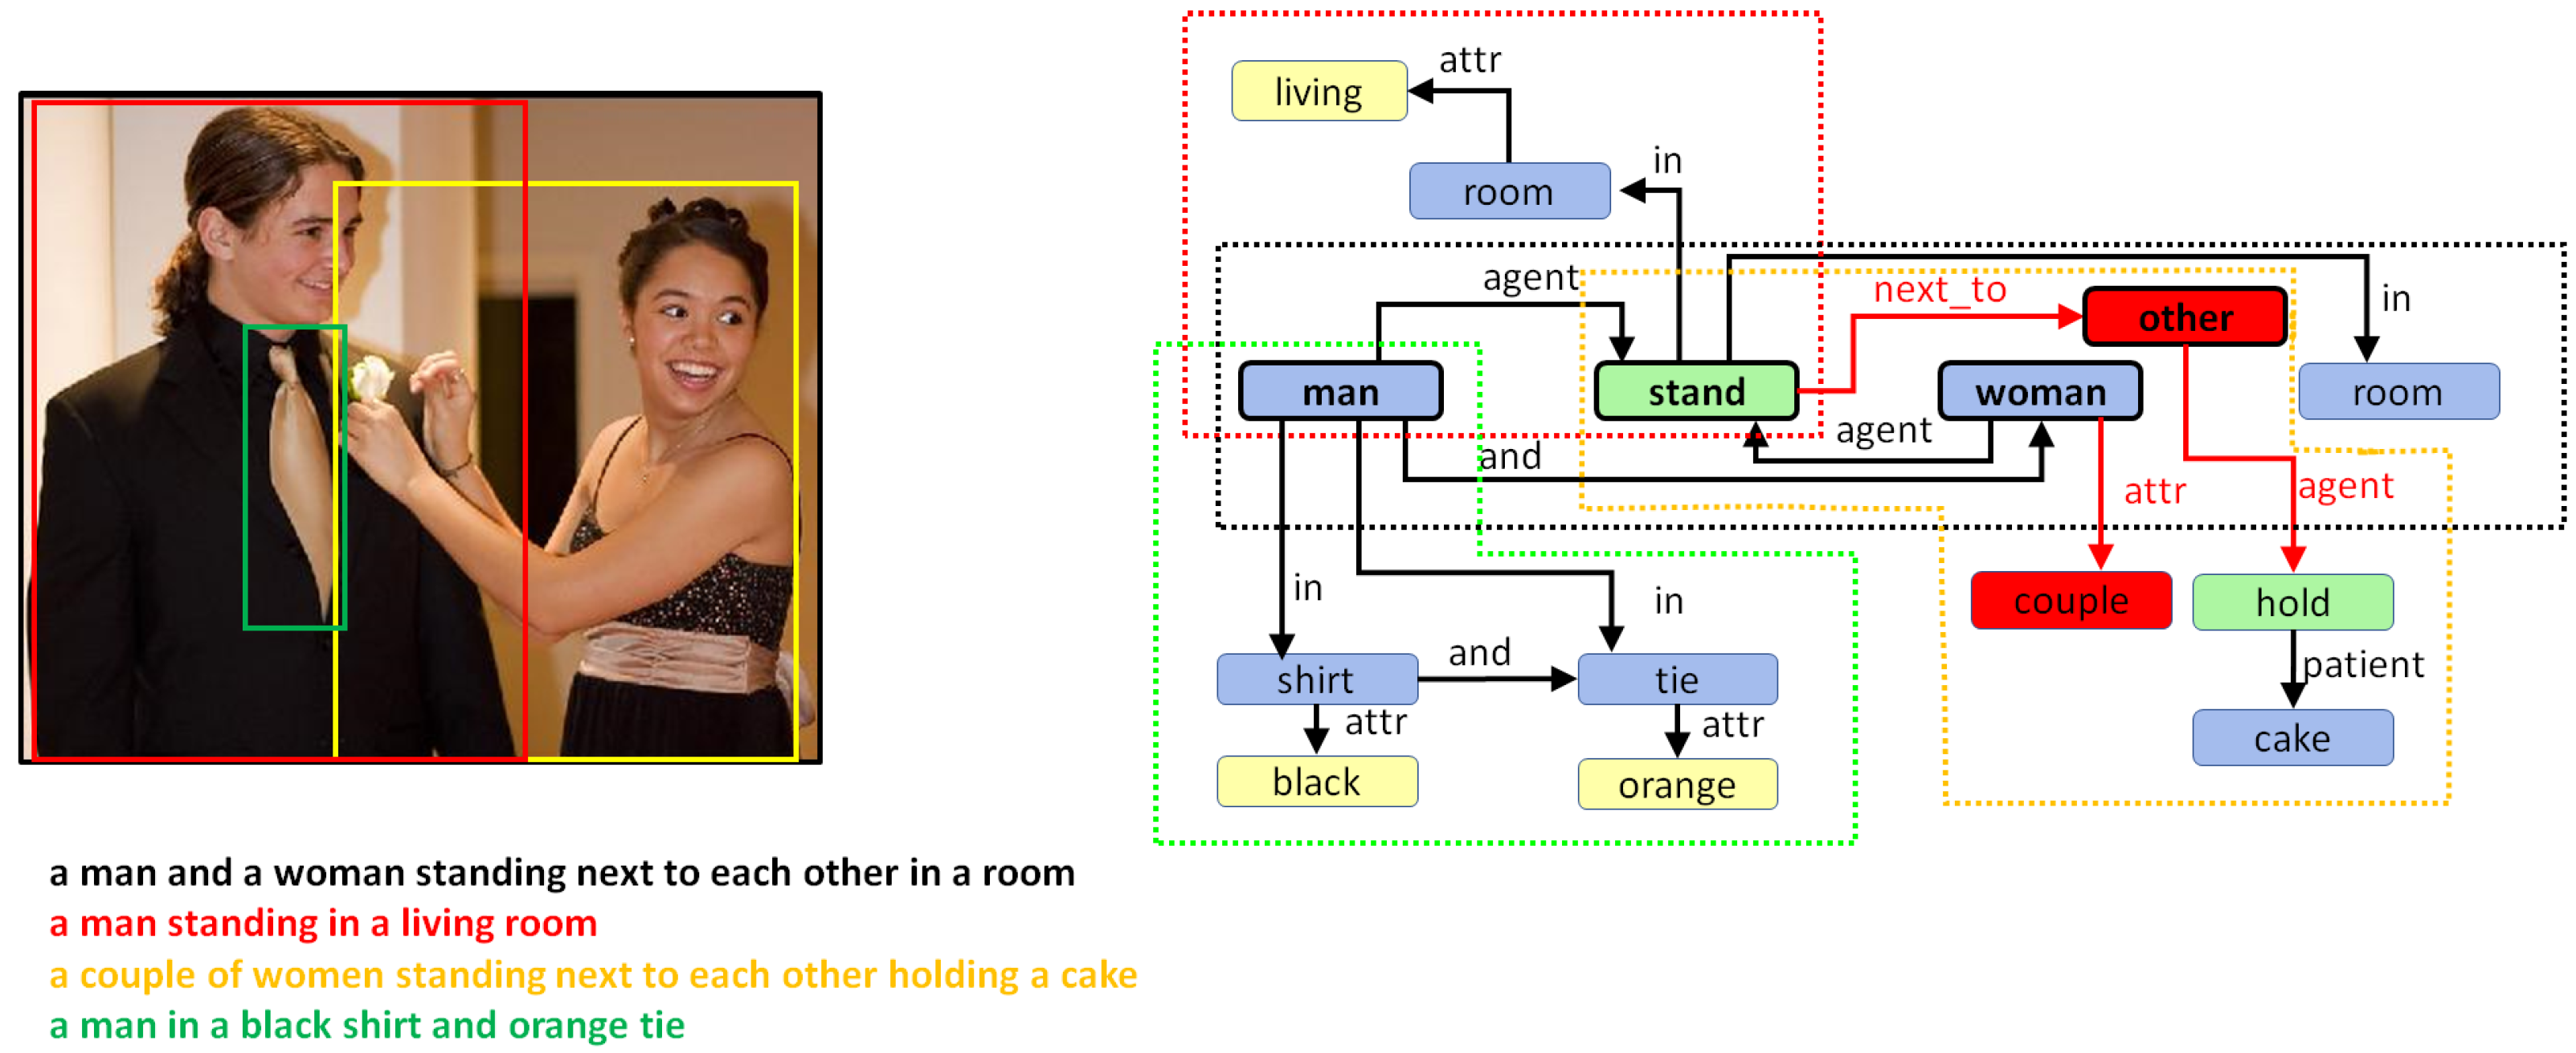
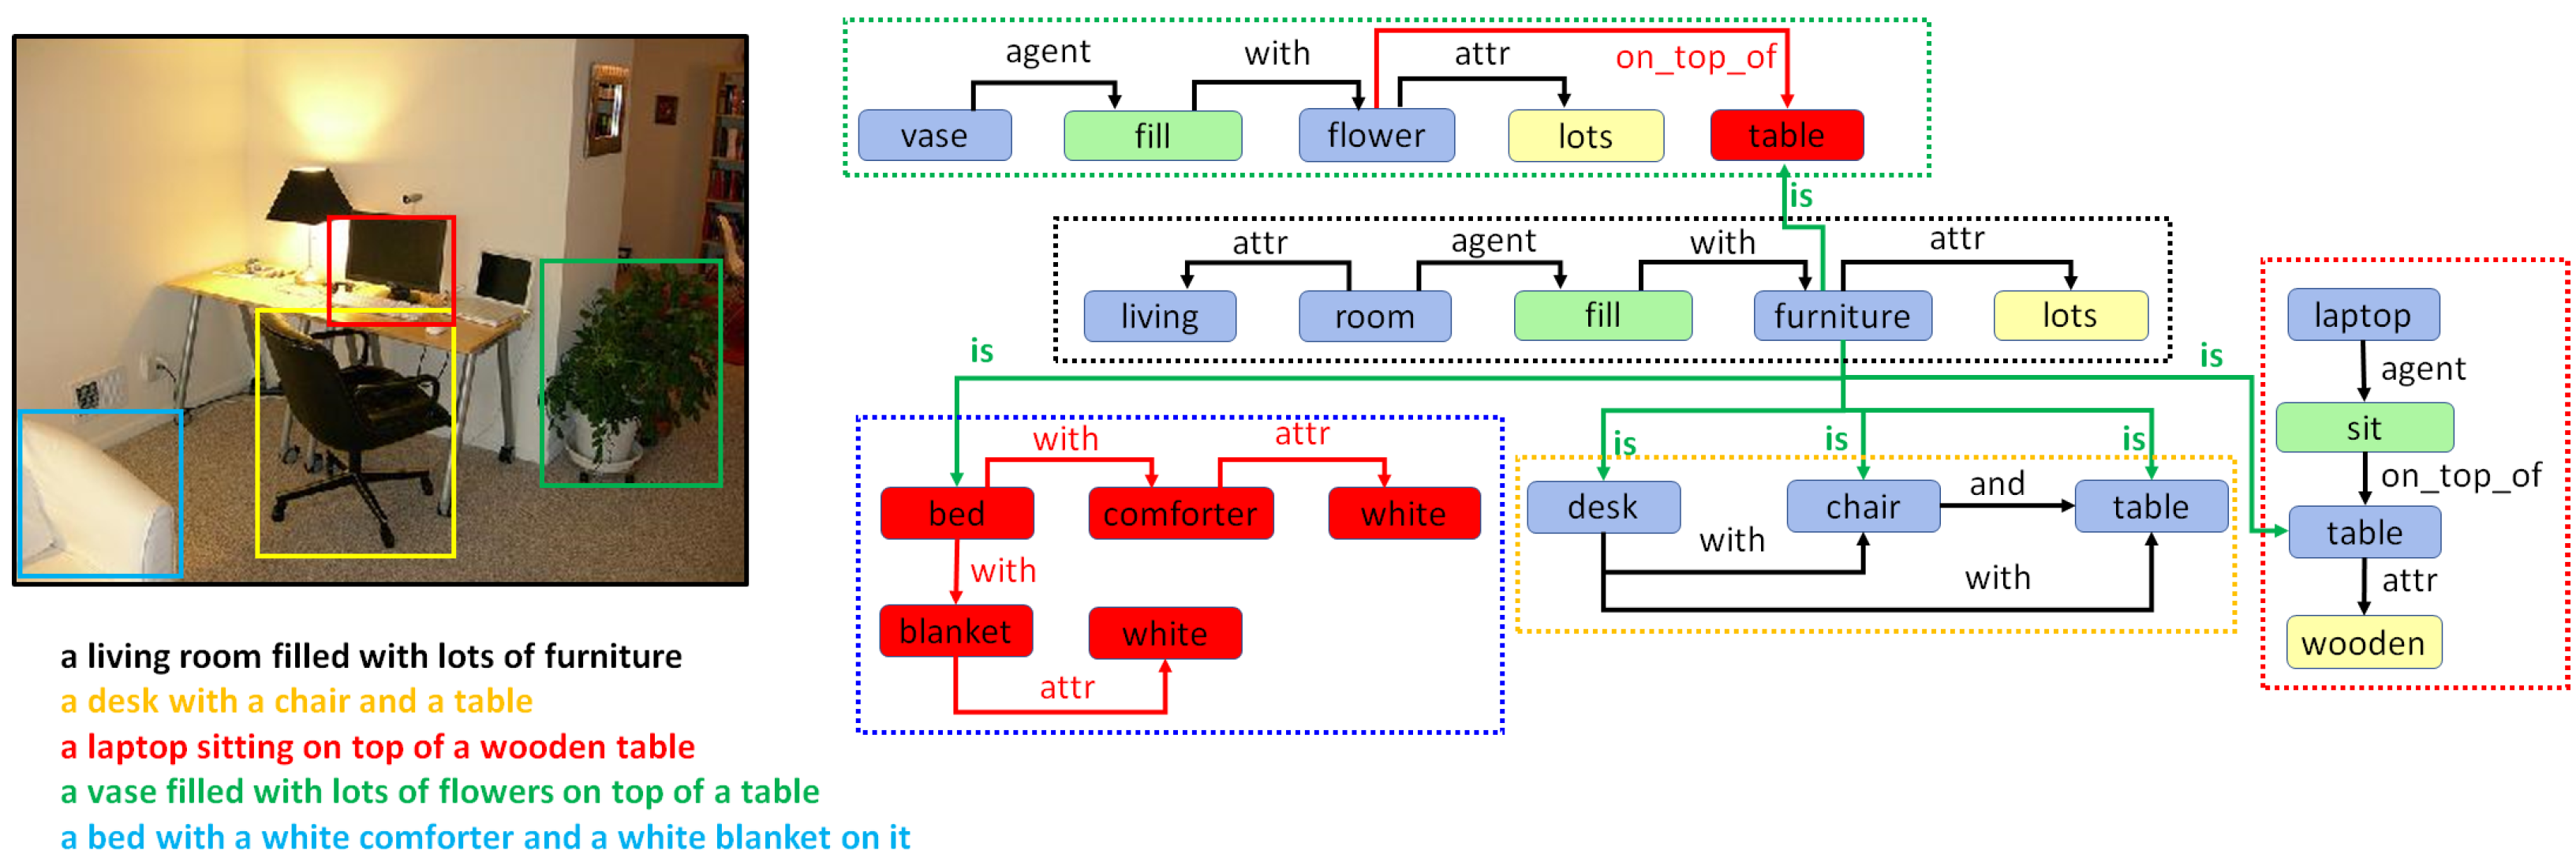
5. Combining Regional Graphs to Generate Concept Graphs

While the region graphs provide a dense conceptual description for the images, they still contain several redundant nodes, which can be combined to create a holistic representation of the image.

Combination of Region Graphs

The combination of region graphs allows the reduction of the number of nodes and edges to provide a much more tightly bound image concept graph with dense connections. The proposed method of graph combination derives inspiration from the approximate maximal common subgraph computation proposed in [3]. The process is composed of several phases:
Phase I:
Merging entities. The first phase aims to find out which entity nodes from the different region graphs can be merged. This is performed on the basis of the following rules:
  • Same lemma. If two nodes have the same lemma and have an intersection-over-min (IOM) ratio above 0.5, they can be merged. The IOM ratio for two bounding boxes A and B is given by
    I O M = a r e a ( A B ) min ( a r e a ( A ) , a r e a ( B ) )
  • Different lemma. Entities with different lemmas may also be merged if they belong to the same synset in the WordNet hypernym chain. This can be detected when the Wu–Palmer similarity [60] is 1.0. For example, pairs such as < d o g , h o u n d > or < b a b y , i n f a n t > belong to the same synset and, hence, can be merged.
Phase II:
Merging actions and attributes. Once we have a pair of entities, one from each of two different region graphs that can be merged, the matching set of actions and entities connected to that entity in both regions graphs can also be merged.
Phase III:
Drawing special edges. Finally, some entities demonstrate more detail in a specific region graph. In cases where two regions have an IOM ratio over 0.5 and the lemma of the two corresponding entities belongs to different generations in the same WordNet hypernym chain, they can be connected using a special edge. For example, if we have two entities in two regions such as “furniture” and “table”, then an edge may be added that states “furniture is table”.
An example of the holistic scene graph with respect to the previously generated captions is shown in Figure 11.

6. Results and Analysis

Based on the various graph merging techniques as described in the previous section, we can produce rich concept graphs for the images with the merging of region graphs, removing redundancy in the nodes and edges. If we count the total number of graph elements generated from all region graphs of a single image, we obtain around 18.48 ± 12.47 entities, 3.48 ± 2.87 actions, 5.13 ± 4.84 attributes, and 20.97 ± 15.86 relations. However, if we count the same statistics after merging the graphs, we obtain around 10.96 ± 6.06 entities, 1.94 ± 1.30 actions, 2.81 ± 2.11 attributes, and 16.23 ± 10.57 relations. This is visually demonstrated in Figure 12.
Most related works rely on graph-based ground truths and, hence, do not provide a suitable ground for fair comparison. For that reason, we provide statistical and qualitative analyses to demonstrate the abilities and shortcomings of the proposed model.

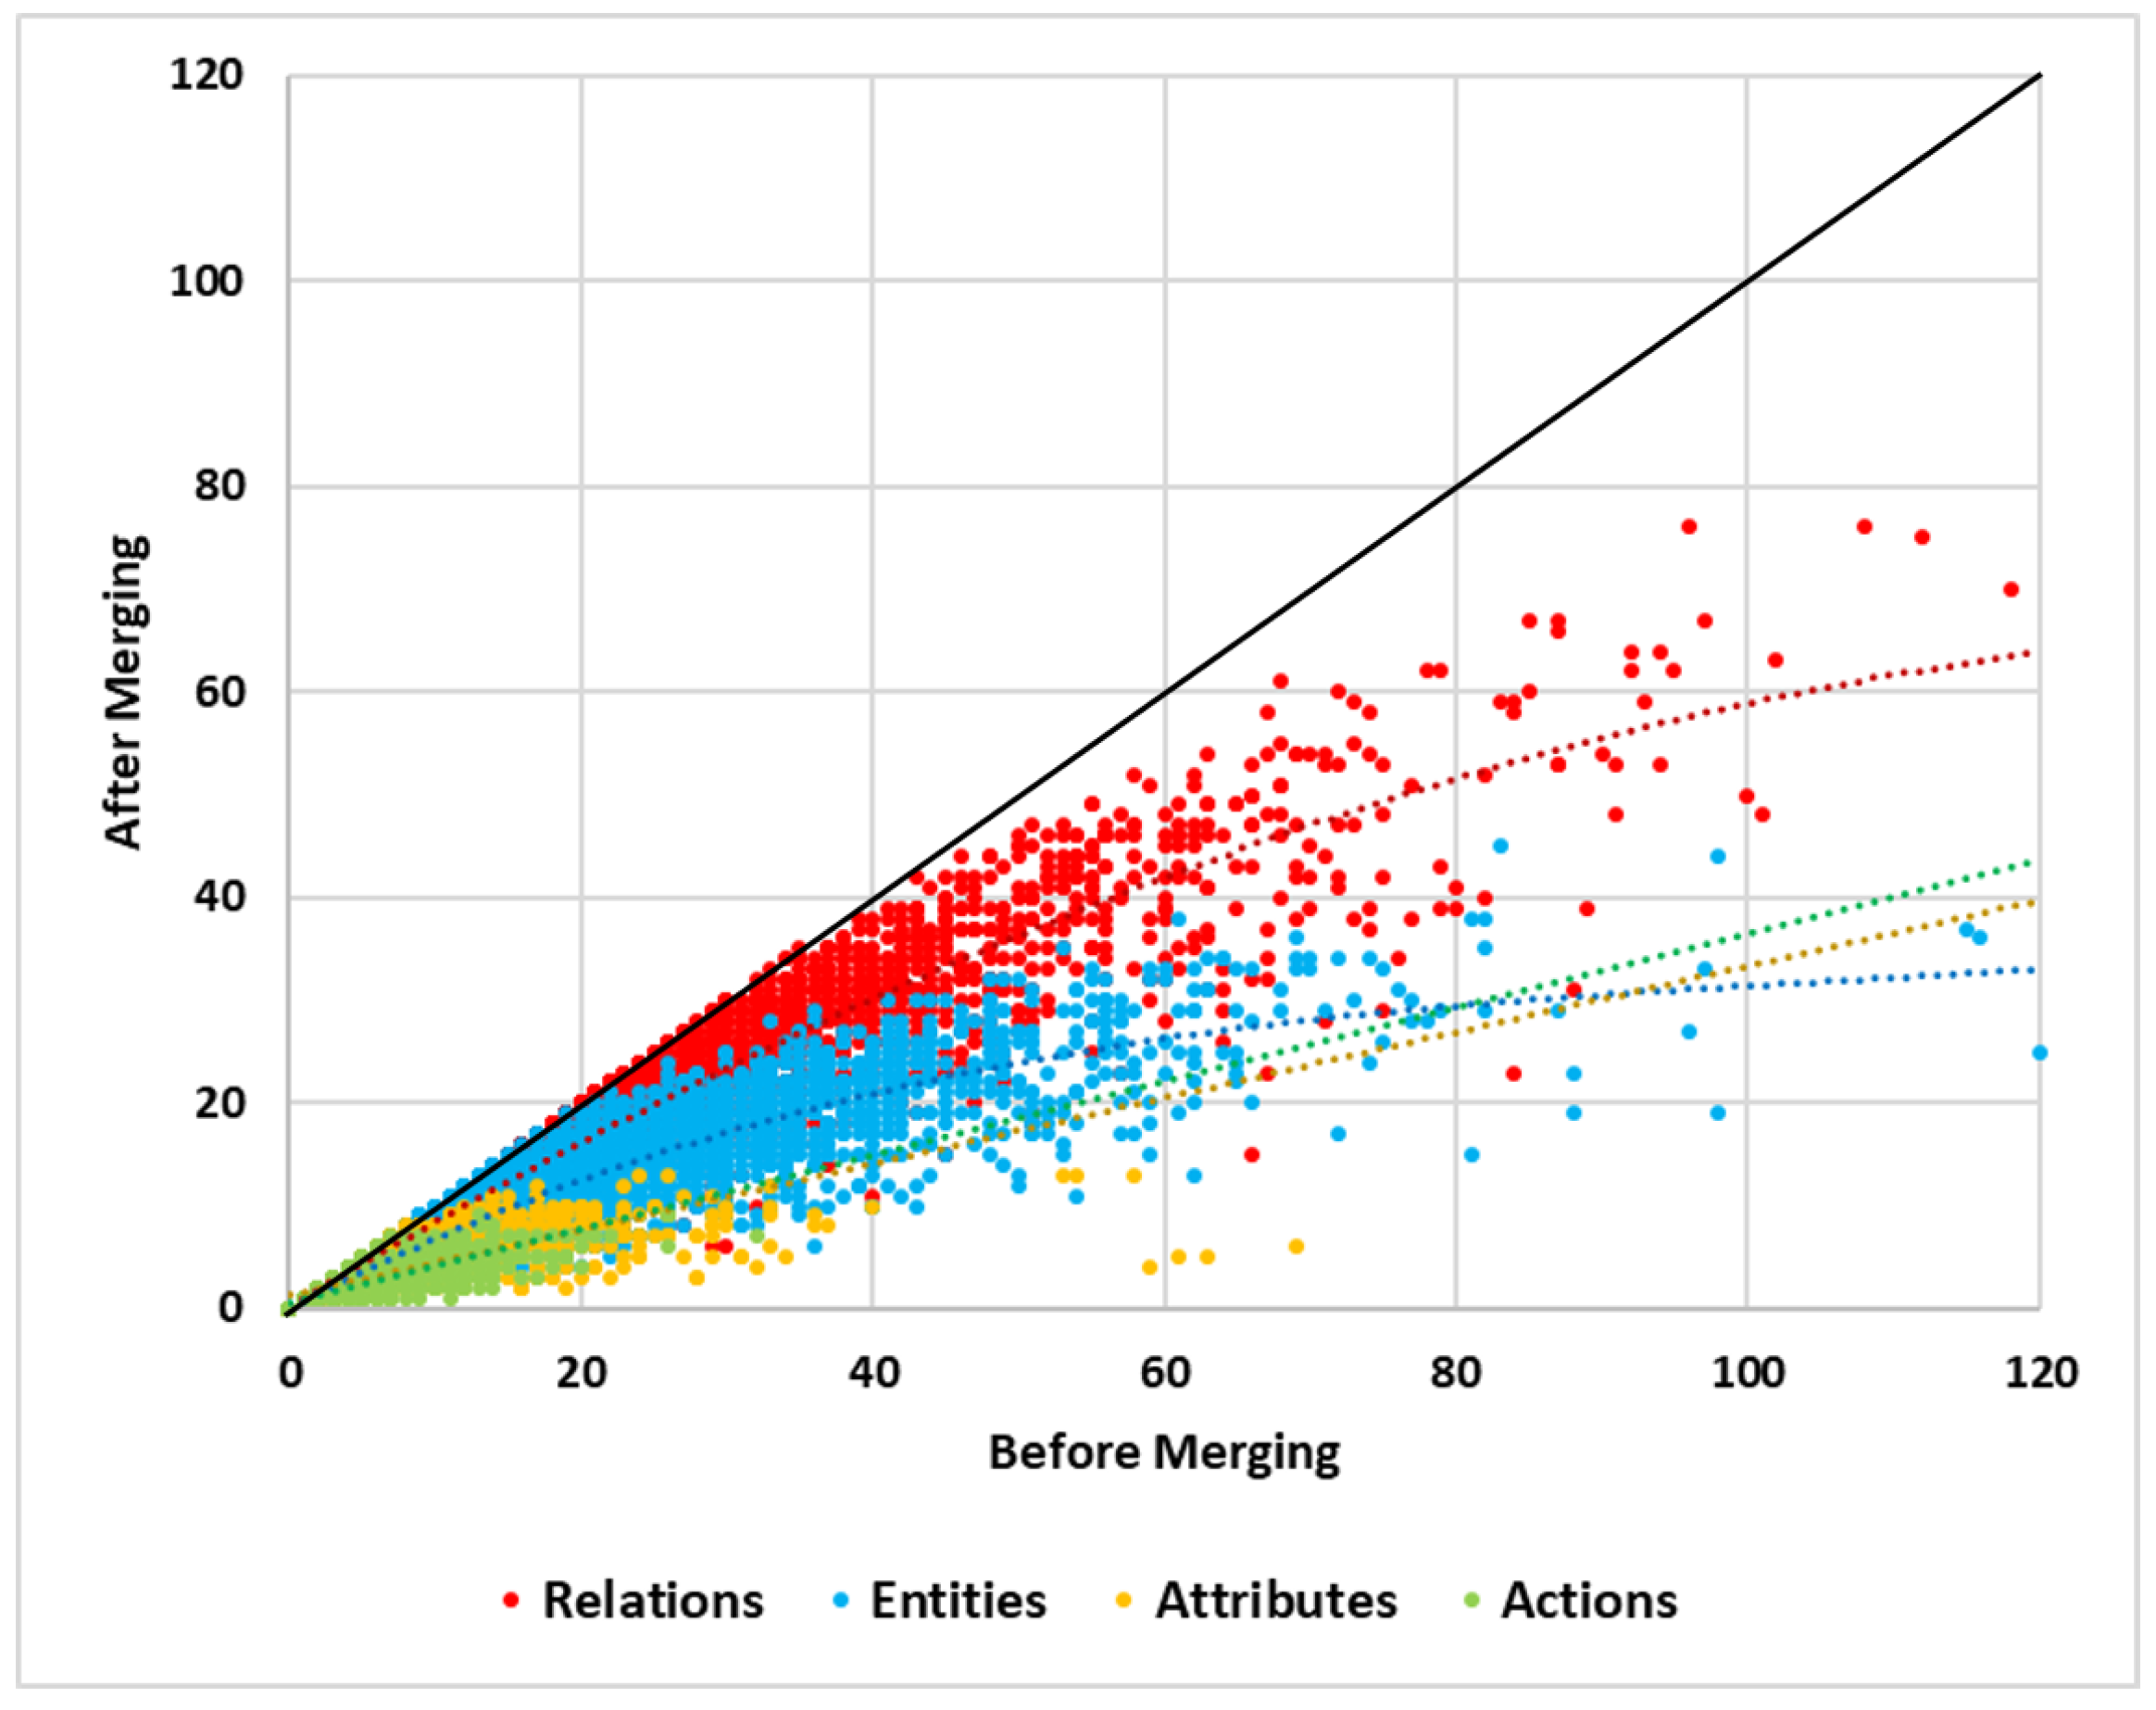
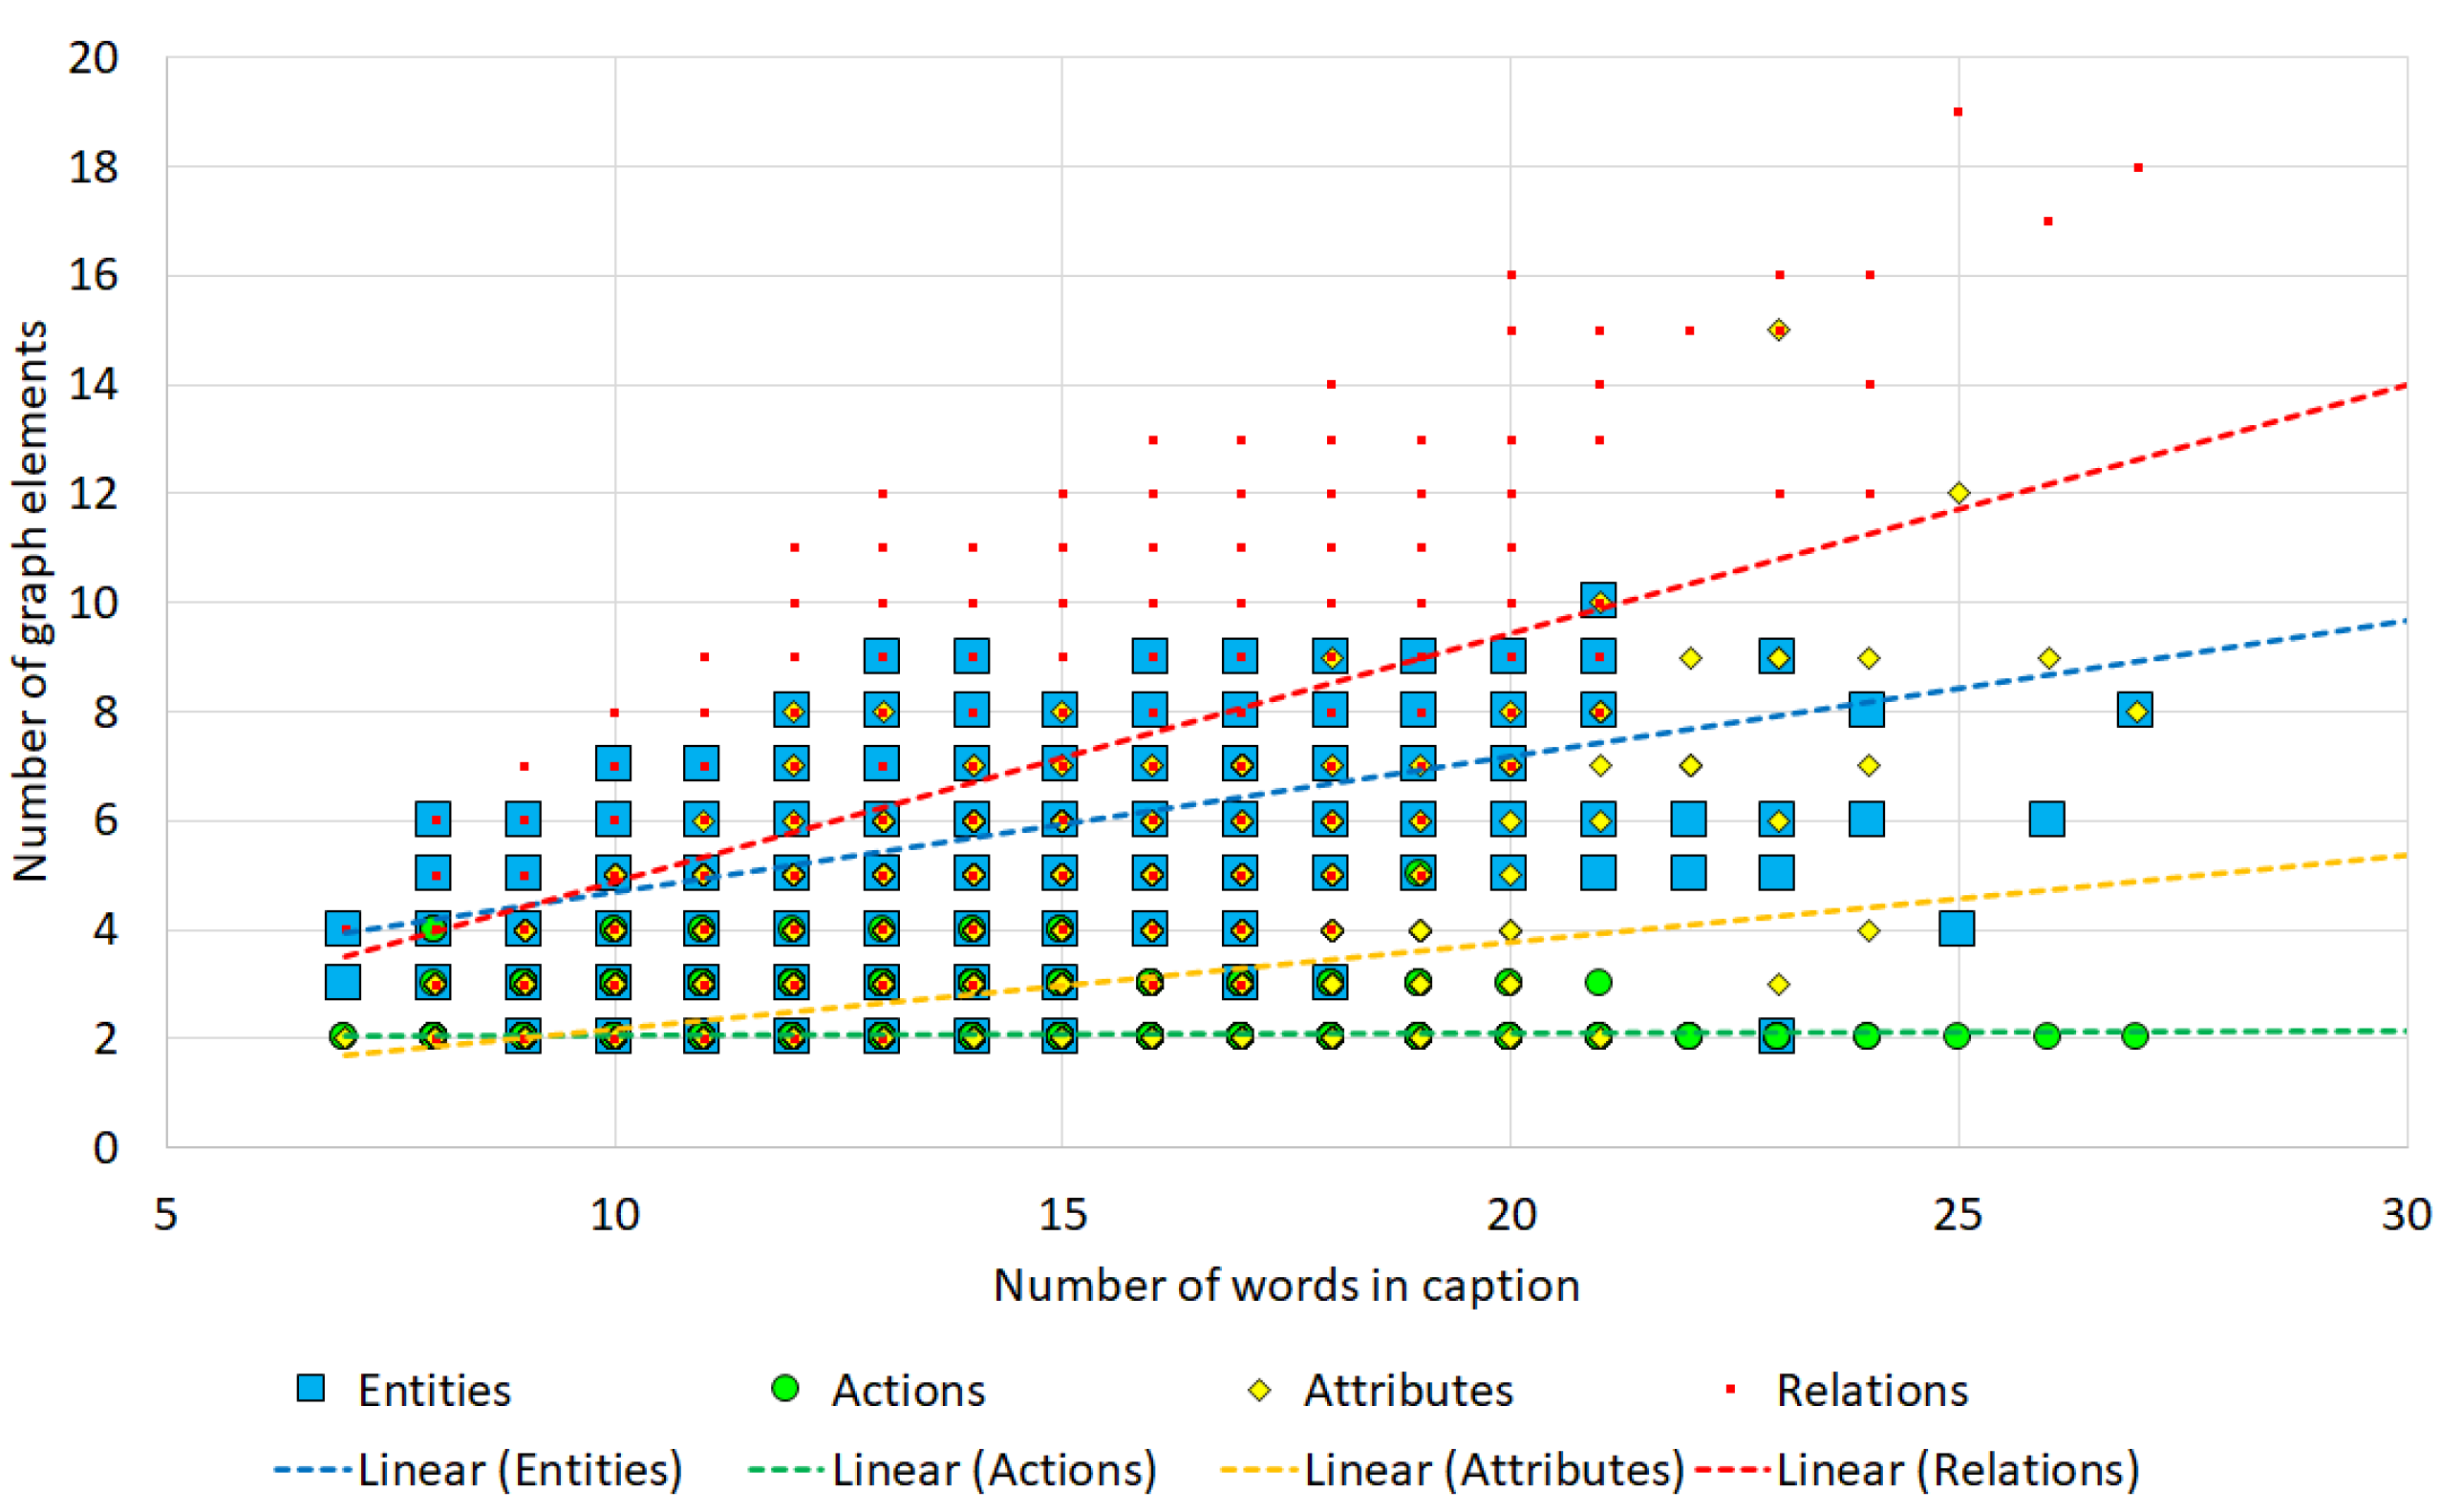
6.1. Statistical Analysis of Generated Graphs

We applied the graph construction technique on the captions from the validation set of the MSCOCO captioning database. The results revealed that the proposed approach can generate about 5.16 ± 1.00 entities, 2.06 ± 0.24 actions, 2.49 ± 0.87 attributes, and 5.73 ± 1.55 relations on average. The average length of the captions was 11.85 ± 2.04. The detailed breakdown for captions of different lengths is provided in Table 3.
Upon further analysis, as shown in Figure 13, the number of graph elements increased monotonically along with the number of words in the caption. The number of entities was highly proportional followed by attributes and then actions. This is logical, as most of the actions in an image are shared by multiple entities.

6.2. Qualitative Analysis

Figure 14, Figure 15, Figure 16, Figure 17, Figure 18, Figure 19 and Figure 20 present several examples of the proposed approach. In each figure, we can see an image in the top left corner: color-coded bounding boxes correspond to the detection by the YOLO-V3 model; the regions are cropped and passed through Show, Attend, and Tell to obtain the image captions; the captions are written below the image with relevant color codes as per the boxes. Below that, we can see the dependency parse trees of the image captions and regional graph generated by our approach. In the top right corner, we can see the combined graph generated by merging redundant nodes: each regional graph is bounded by a rectangle with the same color code as before. Even in the bounding box, dotted polygons mark which component is obtained from which region. Moreover, merged nodes are written in bold font with thick borders; these nodes are shared by two or more region graphs.
Figure 14 demonstrates a simple image with a single object of interest. The caption corresponding to the full image is enough; however, the regional captions add more attributes about the shirt and tie.
Figure 15 demonstrates three very similar captions, thus creating a tightly combined graph with many merged nodes. Redundant actions, such as “sit”, are also merged, as they appear in the same phrase in both captions.
Figure 16 shows an example of the box overlap principle. There are two captions with the “plant” word. However, they are not merged in the combined graph as their corresponding bounding boxes do not overlap, thus signifying that the plants are separate entities. Moreover, nodes such as the “window” correspond to a specific detection of the “window”, thus demonstrating that the graph generation module is not limited by the object detection limits of YOLO_V3.
As we considered multiple regions of interest contributing to multiple region graphs, it is unlikely for the algorithm to output a completely incorrect holistic graph. However, partial mistakes are demonstrated in Figure 17, Figure 18, Figure 19 and Figure 20.
Figure 17 shows an erroneous node detection (“tree”) due to inaccurate captioning. Additionally, the spatial relation “on_top_of” is not appropriate for this case.
In Figure 18, also, smaller regions incorrectly recognize the wooden carriage as a wooden bench or wooden fence in different region captions. There is another error as the person is treated as the agent for the action of drawing the carriage and riding the horses, possibly due to statistical bias. The correct caption would have been “person ride carriage” and “horse draw carriage”.
Figure 19 demonstrates how regional captions can mistakenly classify the gender of the person beyond the frame. Moreover, the “other” node mistakenly detected as the phrase “each other” is not aptly represented. Here, the action should have been associated with both the “man” and the “woman” node.
Finally, Figure 20 shows how partially visible objects can be misclassified. Here, the “armchair” is recognized as a “bed”.
The proposed algorithm does not utilize any graph-based ground truths to generate the holistic scene graphs. Hence, a quantitative analysis is not feasible. The accuracy of the proposed model is highly dependent on the performance of the region-of-interest detection and image captioning model. The performances of those models on the COCO dataset are already recorded in their respective works.

7. Conclusions

We implemented a novel scene graph generation technique that exploits modern object detection and image captioning frameworks to systematically generate region-specific captions and merge them to create a rich concept graph. This method does not require any graph-based ground truth for training. The proposed approach uses the YOLO-v3-based region-of-interest extraction combined with Show, Attend, and Tell-based image caption generation to generate region-specific captions. We proposed a novel visual-information-specific graph generation using dependency parse trees generated from sentences. As it is a rule-based approach, it adheres to the principles of explainable AI. An efficient graph merging technique using the approximate maximal common subgraph was used to combine the region graphs and compute the holistic scene graph. The major drawback of the proposed approach is the bottleneck of the third-party detection and caption generation framework. However, due to the plug-and-play nature of the approach, these frameworks may be swapped out with more robust counterparts. It was also not possible to quantify the correctness of the graph generation as the process is not dependent on any graph-based supervision. The process of converting region captions to region graphs is deterministic and is solely dependent on the success of the caption generator. It provides a very different take compared to the existing literature, which is either guided by graph-based supervision or by corpus-based knowledge. The novelty of the work is stabilizing the workflow consisting of region-of-interest detection, caption generation, dependency parsing, subgraph generation, and graph combination. The result is a rich graph consisting of nodes corresponding to objects, actions, and their attributes, while the edges provide insights about various types of spatial- or action-based relations among the nodes. The proposed holistic scene graph can be used for various tasks such as content-based image retrieval, visual question answering, image clustering, data warehousing, search engine optimization, and so on. Future works can involve the refinement of the holistic scene graphs by mapping nodes and edges to visual features learned from the image.

Author Contributions

Conceptualization, S.G.; methodology, S.G.; validation, S.G. and T.G.; formal analysis, S.G.; investigation, S.G.; writing—original draft, S.G.; writing—review and editing, T.G. and N.D.; visualization, S.G.; supervision, T.G. and N.D.; project administration, N.D.; funding acquisition, N.D. All authors have read and agreed to the published version of the manuscript.

Funding

This work funded by the Science and Engineering Research Board (DST), Govt. of India (Ref. EEQ/2018/000963). The authors are thankful to CMATER Laboratory, Dept. of CSE, Jadavpur University, for providing infrastructural support for this work.

Conflicts of Interest

The authors declare no conflict of interest.

References

  1. Redmon, J.; Farhadi, A. Yolov3: An incremental improvement. arXiv 2018, arXiv:1804.02767. [Google Scholar]
  2. Xu, K.; Ba, J.; Kiros, R.; Cho, K.; Courville, A.; Salakhudinov, R.; Zemel, R.; Bengio, Y. Show, attend and tell: Neural image caption generation with visual attention. In Proceedings of the International Conference on Machine Learning, Lille, France, 7–9 July 2015; pp. 2048–2057. [Google Scholar]
  3. Ghosh, S.; Das, N.; Gonçalves, T.; Quaresma, P. Representing image captions as concept graphs using semantic information. In Proceedings of the 2016 International Conference on Advances in Computing, Communications and Informatics (ICACCI), Jaipur, India, 21–24 September 2016; pp. 162–167. [Google Scholar]
  4. Kipf, T.N.; Welling, M. Semi-supervised classification with graph convolutional networks. arXiv 2016, arXiv:1609.02907. [Google Scholar]
  5. Xu, D.; Zhu, Y.; Choy, C.B.; Li, F.-F. Scene graph generation by iterative message passing. In Proceedings of the IEEE Conference on Computer Vision and Pattern Recognition, Honolulu, HI, USA, 21–26 July 2017; pp. 5410–5419. [Google Scholar]
  6. Chen, M.; Wu, J.; Liu, L.; Zhao, W.; Tian, F.; Shen, Q.; Zhao, B.; Du, R. DR-Net: An improved network for building extraction from high resolution remote sensing image. Remote Sens. 2021, 13, 294. [Google Scholar] [CrossRef]
  7. Zellers, R.; Yatskar, M.; Thomson, S.; Choi, Y. Neural motifs: Scene graph parsing with global context. In Proceedings of the IEEE Conference on Computer Vision and Pattern Recognition, Salt Lake City, UT, USA, 18–23 June 2018; pp. 5831–5840. [Google Scholar]
  8. Johnson, J.; Krishna, R.; Stark, M.; Li, L.J.; Shamma, D.; Bernstein, M.; Li, F.-F. Image retrieval using scene graphs. In Proceedings of the IEEE Conference on Computer Vision and Pattern Recognition, Boston, MA, USA, 7–12 June 2015; pp. 3668–3678. [Google Scholar]
  9. Schuster, S.; Krishna, R.; Chang, A.; Li, F.-F.; Manning, C.D. Generating semantically precise scene graphs from textual descriptions for improved image retrieval. In Proceedings of the fourth Workshop on Vision and Language, Lisbon, Portugal, 18 September 2015; pp. 70–80. [Google Scholar]
  10. Andriyanov, N.; Dementiev, V.; Tashlinskii, A. Detection of objects in the images: From likelihood relationships towards scalable and efficient neural networks. Comput. Opt. 2022, 46, 139–159. [Google Scholar] [CrossRef]
  11. Carion, N.; Massa, F.; Synnaeve, G.; Usunier, N.; Kirillov, A.; Zagoruyko, S. End-to-end object detection with transformers. In Proceedings of the Computer Vision–ECCV 2020: 16th European Conference, Glasgow, UK, 23–28 August 202; pp. 213–229.
  12. Cong, W.; Wang, W.; Lee, W.C. Scene graph generation via conditional random fields. arXiv 2018, arXiv:1811.08075. [Google Scholar]
  13. Zhang, H.; Kyaw, Z.; Chang, S.F.; Chua, T.S. Visual translation embedding network for visual relation detection. In Proceedings of the IEEE Conference on Computer Vision and Pattern Recognition, Honolulu, HI, USA, 21–26 July 2017; pp. 5532–5540. [Google Scholar]
  14. Gkanatsios, N.; Pitsikalis, V.; Koutras, P.; Zlatintsi, A.; Maragos, P. Deeply supervised multimodal attentional translation embeddings for visual relationship detection. In Proceedings of the 2019 IEEE International Conference on Image Processing (ICIP), Taipei, Taiwan, 22–25 September 2019; pp. 1840–1844. [Google Scholar]
  15. Hung, Z.S.; Mallya, A.; Lazebnik, S. Contextual translation embedding for visual relationship detection and scene graph generation. IEEE Trans. Pattern Anal. Mach. Intell. 2020, 43, 3820–3832. [Google Scholar] [CrossRef] [PubMed]
  16. Wan, H.; Luo, Y.; Peng, B.; Zheng, W.S. Representation Learning for Scene Graph Completion via Jointly Structural and Visual Embedding. In Proceedings of the IJCAI, Stockholm, Sweden, 13–19 July 2018; pp. 949–956. [Google Scholar]
  17. Ji, G.; He, S.; Xu, L.; Liu, K.; Zhao, J. Knowledge graph embedding via dynamic mapping matrix. In Proceedings of the 53rd Annual Meeting of the Association for Computational Linguistics and the 7th International Joint Conference on Natural Language Processing (Volume 1: Long Papers), Beijing, China, 26–31 July 2015; pp. 687–696. [Google Scholar]
  18. Woo, S.; Kim, D.; Cho, D.; Kweon, I.S. Linknet: Relational embedding for scene graph. arXiv 2018, arXiv:1811.06410. [Google Scholar]
  19. Li, Y.; Ouyang, W.; Wang, X.; Tang, X. Vip-cnn: Visual phrase guided convolutional neural network. In Proceedings of the IEEE Conference on Computer Vision and Pattern Recognition, Honolulu, HI, USA, 21–26 July 2017; pp. 1347–1356. [Google Scholar]
  20. Zhang, J.; Shih, K.; Tao, A.; Catanzaro, B.; Elgammal, A. An interpretable model for scene graph generation. arXiv 2018, arXiv:1811.09543. [Google Scholar]
  21. Kolesnikov, A.; Kuznetsova, A.; Lampert, C.; Ferrari, V. Detecting visual relationships using box attention. In Proceedings of the IEEE/CVF International Conference on Computer Vision Workshops, Seoul, Republic of Korea, 27–28 October 2019; pp. 1749–1753. [Google Scholar]
  22. Yin, G.; Sheng, L.; Liu, B.; Yu, N.; Wang, X.; Shao, J.; Loy, C.C. Zoom-net: Mining deep feature interactions for visual relationship recognition. In Proceedings of the European Conference on Computer Vision (ECCV), Munich, Germany, 8–14 September 2018; pp. 322–338. [Google Scholar]
  23. Li, Y.; Ouyang, W.; Zhou, B.; Wang, K.; Wang, X. Scene graph generation from objects, phrases and region captions. In Proceedings of the IEEE International Conference on Computer Vision, Venice, Italy, 22–29 October 2017; pp. 1261–1270. [Google Scholar]
  24. Hochreiter, S.; Schmidhuber, J. Long short-term memory. Neural Comput. 1997, 9, 1735–1780. [Google Scholar] [CrossRef]
  25. Gilmer, J.; Schoenholz, S.S.; Riley, P.F.; Vinyals, O.; Dahl, G.E. Neural message passing for quantum chemistry. In Proceedings of the International Conference on Machine Learning, Sydney, Australia, 6–11 August 2017; pp. 1263–1272. [Google Scholar]
  26. Li, Y.; Tarlow, D.; Brockschmidt, M.; Zemel, R. Gated graph sequence neural networks. arXiv 2015, arXiv:1511.05493. [Google Scholar]
  27. Goller, C.; Kuchler, A. Learning task-dependent distributed representations by backpropagation through structure. In Proceedings of the International Conference on Neural Networks (ICNN’96), Washington, DC, USA, 3–6 June 1996; Volume 1, pp. 347–352. [Google Scholar]
  28. Gori, M.; Monfardini, G.; Scarselli, F. A new model for learning in graph domains. In Proceedings of the 2005 IEEE International Joint Conference on Neural Networks, Montreal, QC, Canada, 31 July–4 August 2005; Volume 2, pp. 729–734. [Google Scholar]
  29. Scarselli, F.; Gori, M.; Tsoi, A.C.; Hagenbuchner, M.; Monfardini, G. The graph neural network model. IEEE Trans. Neural Netw. 2008, 20, 61–80. [Google Scholar] [CrossRef] [PubMed]
  30. Santoro, A.; Raposo, D.; Barrett, D.G.; Malinowski, M.; Pascanu, R.; Battaglia, P.; Lillicrap, T. A simple neural network module for relational reasoning. arXiv 2017, arXiv:1706.01427. [Google Scholar]
  31. Bruna, J.; Mallat, S. Invariant scattering convolution networks. IEEE Trans. Pattern Anal. Mach. Intell. 2013, 35, 1872–1886. [Google Scholar] [CrossRef]
  32. Dai, H.; Dai, B.; Song, L. Discriminative embeddings of latent variable models for structured data. In Proceedings of the International Conference on Machine Learning, New York, NY, USA, 19–24 June 2016; pp. 2702–2711. [Google Scholar]
  33. Defferrard, M.; Bresson, X.; Vandergheynst, P. Convolutional neural networks on graphs with fast localized spectral filtering. Adv. Neural Inf. Process. Syst. 2016, 29, 3844–3852. [Google Scholar]
  34. Niepert, M.; Ahmed, M.; Kutzkov, K. Learning convolutional neural networks for graphs. In Proceedings of the International Conference on Machine Learning, New York, NY, USA, 19–24 June 2016; pp. 2014–2023. [Google Scholar]
  35. Hamilton, W.L.; Ying, R.; Leskovec, J. Inductive representation learning on large graphs. In Proceedings of the 31st International Conference on Neural Information Processing Systems, Long Beach, CA, USA, 4–9 December 2017; pp. 1025–1035. [Google Scholar]
  36. Herzig, R.; Raboh, M.; Chechik, G.; Berant, J.; Globerson, A. Mapping images to scene graphs with permutation-invariant structured prediction. Adv. Neural Inf. Process. Syst. 2018, 31, 7211–7221. [Google Scholar]
  37. Herzig, R.; Levi, E.; Xu, H.; Gao, H.; Brosh, E.; Wang, X.; Globerson, A.; Darrell, T. Spatio-temporal action graph networks. In Proceedings of the IEEE/CVF International Conference on Computer Vision Workshops, Seoul, Republic of Korea, 27–28 October 2019; pp. 2347–2356. [Google Scholar]
  38. Wang, X.; Gupta, A. Videos as space-time region graphs. In Proceedings of the European conference on computer vision (ECCV), Munich, Germany, 8–14 September 2018; pp. 399–417. [Google Scholar]
  39. Li, Y.; Ouyang, W.; Zhou, B.; Shi, J.; Zhang, C.; Wang, X. Factorizable net: An efficient subgraph-based framework for scene graph generation. In Proceedings of the European Conference on Computer Vision (ECCV), Munich, Germany, 8–14 September 2018; pp. 335–351. [Google Scholar]
  40. Yang, J.; Lu, J.; Lee, S.; Batra, D.; Parikh, D. Graph r-cnn for scene graph generation. In Proceedings of the European Conference on Computer Vision (ECCV), Munich, Germany, 8–14 September 2018; pp. 670–685. [Google Scholar]
  41. Qi, M.; Li, W.; Yang, Z.; Wang, Y.; Luo, J. Attentive relational networks for mapping images to scene graphs. In Proceedings of the IEEE/CVF Conference on Computer Vision and Pattern Recognition, Long Beach, CA, USA, 15–20 June 2019; pp. 3957–3966. [Google Scholar]
  42. Dornadula, A.; Narcomey, A.; Krishna, R.; Bernstein, M.; Li, F.F. Visual relationships as functions: Enabling few-shot scene graph prediction. In Proceedings of the IEEE/CVF International Conference on Computer Vision Workshops, Seoul, Republic of Korea, 27–28 October 2019; pp. 1730–1739. [Google Scholar]
  43. Zhang, J.; Shih, K.J.; Elgammal, A.; Tao, A.; Catanzaro, B. Graphical contrastive losses for scene graph parsing. In Proceedings of the IEEE/CVF Conference on Computer Vision and Pattern Recognition, Long Beach, CA, USA, 15–20 June 2019; pp. 11535–11543. [Google Scholar]
  44. Jung, T.W.; Jeong, C.S.; Kim, I.S.; Yu, M.S.; Kwon, S.C.; Jung, K.D. Graph Convolutional Network for 3D Object Pose Estimation in a Point Cloud. Sensors 2022, 22, 8166. [Google Scholar] [CrossRef] [PubMed]
  45. Andriyanov, N. Application of Graph Structures in Computer Vision Tasks. Mathematics 2022, 10, 4021. [Google Scholar] [CrossRef]
  46. Jayatilaka, G.; Hassan, J.; Sritharan, S.; Senanayaka, J.B.; Weligampola, H.; Godaliyadda, R.; Ekanayake, P.; Herath, V.; Ekanayake, J.; Dharmaratne, S. Holistic interpretation of public scenes using computer vision and temporal graphs to identify social distancing violations. Appl. Sci. 2022, 12, 8428. [Google Scholar] [CrossRef]
  47. Lu, C.; Krishna, R.; Bernstein, M.; Fei-Fei, L. Visual relationship detection with language priors. In Proceedings of the European Conference on Computer Vision, Amsterdam, The Netherlands, 11–14 October 2016; pp. 852–869. [Google Scholar]
  48. Liang, X.; Lee, L.; Xing, E.P. Deep variation-structured reinforcement learning for visual relationship and attribute detection. In Proceedings of the IEEE Conference on Computer Vision and Pattern Recognition, Honolulu, HI, USA, 21–26 July 2017; pp. 848–857. [Google Scholar]
  49. Cui, Z.; Xu, C.; Zheng, W.; Yang, J. Context-dependent diffusion network for visual relationship detection. In Proceedings of the 26th ACM international conference on Multimedia, Seoul, Republic of Korea, 22–26 October 2018; pp. 1475–1482. [Google Scholar]
  50. Yu, R.; Li, A.; Morariu, V.I.; Davis, L.S. Visual relationship detection with internal and external linguistic knowledge distillation. In Proceedings of the IEEE International Conference on Computer Vision, Venice, Italy, 22–29 October 2017; pp. 1974–1982. [Google Scholar]
  51. Dai, B.; Zhang, Y.; Lin, D. Detecting visual relationships with deep relational networks. In Proceedings of the IEEE Conference on Computer Vision and Pattern Recognition, Honolulu, HI, USA, 21–26 July 2017; pp. 3076–3086. [Google Scholar]
  52. Krishna, R.; Zhu, Y.; Groth, O.; Johnson, J.; Hata, K.; Kravitz, J.; Chen, S.; Kalantidis, Y.; Li, L.J.; Shamma, D.A.; et al. Visual genome: Connecting language and vision using crowdsourced dense image annotations. Int. J. Comput. Vis. 2017, 123, 32–73. [Google Scholar] [CrossRef] [Green Version]
  53. Zareian, A.; Karaman, S.; Chang, S.F. Bridging knowledge graphs to generate scene graphs. In Proceedings of the European Conference on Computer Vision, Glasgow, UK, 23–28 August 2020; pp. 606–623. [Google Scholar]
  54. Gu, J.; Zhao, H.; Lin, Z.; Li, S.; Cai, J.; Ling, M. Scene graph generation with external knowledge and image reconstruction. In Proceedings of the IEEE/CVF Conference on Computer Vision and Pattern Recognition, Long Beach, CA, USA, 15–20 June 2019; pp. 1969–1978. [Google Scholar]
  55. Lee, C.W.; Fang, W.; Yeh, C.K.; Wang, Y.C.F. Multi-label zero-shot learning with structured knowledge graphs. In Proceedings of the IEEE Conference on Computer Vision and Pattern Recognition, Salt Lake City, UT, USA, 18–23 June 2018; pp. 1576–1585. [Google Scholar]
  56. Speer, R.; Chin, J.; Havasi, C. Conceptnet 5.5: An open multilingual graph of general knowledge. In Proceedings of the Thirty-First AAAI Conference on Artificial Intelligence, San Francisco, CA, USA, 4–9 February 2017.
  57. Johnson, J.; Karpathy, A.; Li, F.-F. Densecap: Fully convolutional localization networks for dense captioning. In Proceedings of the IEEE Conference on Computer Vision and Pattern Recognition, Las Vegas, NV, USA, 27–30 June 2016; pp. 4565–4574. [Google Scholar]
  58. Ghosh, S.; Das, N.; Nasipuri, M. Reshaping inputs for convolutional neural network: Some common and uncommon methods. Pattern Recognit. 2019, 93, 79–94. [Google Scholar] [CrossRef]
  59. De Marneffe, M.C.; Dozat, T.; Silveira, N.; Haverinen, K.; Ginter, F.; Nivre, J.; Manning, C.D. Universal Stanford dependencies: A cross-linguistic typology. In Proceedings of the 9th International Conference on Language Resources and Evaluation (LREC’14); 2014; pp. 4585–4592. [Google Scholar]
  60. Wu, Z.; Palmer, M. Verb semantics and lexical selection. arXiv 1994, arXiv:cmp-lg/9406033v3. [Google Scholar]
Figure 1. An example showing generated holistic scene graphs (right) from images (left) using region-specific dependency parse trees.
Futureinternet 15 00070 g001
Figure 2. Block diagram of the proposed approach.
Futureinternet 15 00070 g002
Figure 3. An example regional caption generation. Regions are detected using YOLO-V3 [1], and captions are generated using Show, Attend, and Tell [2].
Futureinternet 15 00070 g003
Figure 4. Generating graphs for the generated captions as shown in Figure 3. Left: dependency parse tree generated using Stanford dependency parser. Right: generated Graph using the proposed approach.
Futureinternet 15 00070 g004
Figure 5. Various ways to create “agent” edges from dependencies.
Futureinternet 15 00070 g005
Figure 6. Various ways to create “patient” edges from dependencies.
Futureinternet 15 00070 g006
Figure 7. Various ways to directly extract “attr” edges from dependencies.
Futureinternet 15 00070 g007
Figure 8. Various ways to indirectly extract “attr” edges from dependencies.
Futureinternet 15 00070 g008
Figure 9. Deriving edges signifying spatial relations from dependencies.
Futureinternet 15 00070 g009
Figure 10. Some more types of dependencies that can represent visual concepts.
Futureinternet 15 00070 g010
Figure 11. After combining the graphs generated from individual regions as shown in Figure 4, we obtain the holistic scene graph.
Futureinternet 15 00070 g011
Figure 12. A scatter plot showing the number of entities, attributes, actions, and relations, before and after merging regional graphs. Trends show a below-linear relation for most cases.
Futureinternet 15 00070 g012
Figure 13. Visualization of the dependency between the number of words and the number of graph elements. The dotted line demonstrates the linear regression of the scatter plot of a specific graph element.
Futureinternet 15 00070 g013
Figure 14. Holistic scene graph from a simple image with a single object of interest.
Futureinternet 15 00070 g014
Figure 15. Holistic scene graphs showing three very similar captions, hence demonstrating several merged nodes and several WordNet-based “is” edges.
Futureinternet 15 00070 g015
Figure 16. Holistic scene graphs showing distinct instances of plants in disjoint bounding boxes.
Futureinternet 15 00070 g016
Figure 17. Holistic scene graph showing a captioning error leading to an erroneous node “tree”.
Futureinternet 15 00070 g017
Figure 18. Holistic scene graphs demonstrating statistical bias forcing erroneous edges.
Futureinternet 15 00070 g018
Figure 19. Holistic scene graph showing caption generator making wrong assumptions about objects beyond the bounding box.
Futureinternet 15 00070 g019
Figure 20. Holistic graph generation showing misclassification of partially occluded objects.
Futureinternet 15 00070 g020
Table 1. A summary of the criteria for creating nodes from dependency trees.
Node TypeType of NodeDescriptionNode LemmaCriterion
EntityPrimary NodesObjects that physically occupy spaceWord LemmaPOS Tags: NN, NNS
Secondary NodesPronounsObjectPOS Tags: PRP, Lemma: it, its, itself
PersonPOS Tags: PRP, PRP$, Lemma: I, you, my
Masculine PersonPOS Tags: PRP, PRP$, Lemma: he, him, his, himself
Feminine PersonPOS Tags: PRP, PRP$, Lemma: she, her, herself
PeoplePOS Tags: PRP, PRP$, Lemma: we, they, them, ’em, themselves
DeterminersObjectPOS Tags: DT, Lemma: this, that, these, those
Proper NounsLocationPOS Tags: NNP, NNPS, NER Tag: LOCATION
PersonPOS Tags: NNP, NNPS, NER Tag: PERSON
OrganizationPOS Tags: NNP, NNPS, NER Tag: ORGANIZATION
Actions without SubjectsSubjectNA
Tertiary NodesCreated during edge creation to
account for missing nodes
LocationPOS Tags: EX
LocationPOS Tags: RP, Lemma = location
ActionPrimary NodesEvents or activities connected with the entitiesWord LemmaPOS Tags: VB, VBD, VBG, VBN, VBP, VBZ
Secondary NodesAction nodes are NOT created for auxiliary verbsNot CreatedPOS Tags: VB
Tertiary NodesCreated during edge creation to
account for missing nodes
Word LemmaPOS Tags: VB, VBD, VBG, VBN, VBP, VBZ, TO, CC
AttributesPrimary NodesProperties that further define the entities or actions.Word LemmaPOS Tags: JJ, JJR, JJS, RB, RBR, RBS
Tertiary NodesCreated during edge creation to
account for missing nodes
Word LemmaPOS Tags: IN (Prepositions)
LemmaPOS Tags: CD, Word Lemma: “number” (Cardinals)
Table 2. A summary of the edge creation protocols based on dependency relations.
Edge TypeDependencyDescriptionEdge
AgentA → nsubj → BNominal SubjectB → agent → A
A → obl:agent → BOblique AgentsB → agent → A
A → nsubj:xsubj → BSubjects of Embedded ActionsB → agent → A
A → acl → BAdnominal ClauseB → agent → A
PatientA → obj → BDirect ObjectA → patient → B
A → iobj → BIndirect ObjectB → patient → A
A → nsubj:pass → BPassive ObjectA → patient → B
AttributesA → advmod → BAdverbial ModifierA → attr → B
A → amod → BAdjectival ModifierA → attr → B
A → numeric → BNumber ModifierA → attr → B
A → cop → B and A → nsubj → CCopulaA → attr → C
A → nsubj → B and A → xcomp → COpen Clausal ComplementB → attr → C
Spatial RelationsA → obl:preposition → BOblique Dependencies with prepositionsA → preposition → C
A → nmod:preposition → BNoun Modifiers with prepositionsA → preposition → C
Special relationsA → appos → BAppositional ModifierA → is → B
A → conj → BConjunctionA → and → B
A → compound:prt → BCompound ParticiplesA → attr → B
Table 3. A statistical analysis of the number of entities, action, attributes, and relations generated in the concept graph for captions of various lengths.
No. of WordsNo. of CaptionsNo. of EntitiesNo. of ActionsNo. of AttributesNo. of Relations
733.33 ± 0.582.00 ± 0.002.00 ± 0.004.00 ± 0.00
83393.91 ± 0.592.02 ± 1.042.07 ± 0.964.03 ± 1.10
917324.34 ± 0.762.03 ± 0.162.26 ± 0.594.78 ± 0.89
1034184.67 ± 0.742.06 ± 0.232.31 ± 0.555.19 ± 1.07
1144375.02 ± 0.732.05 ± 0.222.28 ± 0.595.25 ± 1.11
1243445.17 ± 0.882.07 ± 0.262.49 ± 0.705.59 ± 1.12
1331975.57 ± 0.912.10 ± 0.302.54 ± 0.836.03 ± 1.24
1417455.79 ± 0.952.06 ± 0.252.68 ± 0.996.61 ± 1.38
159595.84 ± 1.112.05 ± 0.233.05 ± 1.327.25 ± 1.58
165536.18 ± 1.002.04 ± 0.193.20 ± 1.287.95 ± 1.88
172576.00 ± 1.262.05 ± 0.233.88 ± 1.688.76 ± 2.02
181186.79 ± 1.252.03 ± 0.183.53 ± 1.518.57 ± 1.81
19497.37 ± 1.182.16 ± 0.513.24 ± 1.369.02 ± 1.73
20216.62 ± 1.282.10 ± 0.304.52 ± 1.9710.81 ± 2.71
21126.50 ± 2.112.08 ± 0.295.92 ± 3.0312.25 ± 2.49
2255.80 ± 0.452.00 ± 0.007.40 ± 0.8915.00 ± 0.00
2355.40 ± 2.512.00 ± 0.008.40 ± 4.4516.20 ± 3.63
2436.67 ± 1.152.00 ± 0.006.67 ± 2.5214.00 ± 2.00
2514.00 ± 0.002.00 ± 0.0012.00 ± 0.0019.00 ± 0.00
2616.00 ± 0.002.00 ± 0.009.00 ± 0.0017.00 ± 0.00
2718.00 ± 0.002.00 ± 0.008.00 ± 0.0018.00 ± 0.00
Disclaimer/Publisher’s Note: The statements, opinions and data contained in all publications are solely those of the individual author(s) and contributor(s) and not of MDPI and/or the editor(s). MDPI and/or the editor(s) disclaim responsibility for any injury to people or property resulting from any ideas, methods, instructions or products referred to in the content.

