1. Introduction
With the development and innovation of 5G, Super-Fast broadband and WiFi 6 [
1,
2], everyone anticipates that these developments will not only bring fast and reliable internet, but also significantly enhance user experience, particularly for real-time services. Increasing video streaming usage and the emergence of new forms of real-time applications, such as online game streaming and cloud gaming, are compelling network providers to increase spectrum capacity, decrease network latency, and improve other network parameters, in order to provide satisfactory service to users. Quality of Service (QoS) is a set of technologies and practices that are used to manage and prioritize network traffic in order to ensure that certain data flows, or groups of data flows, receive a certain level of performance. It involves optimising network parameters to fulfil the user’s service level agreement (SLA). Metrics, such as throughput, delay, jitter, packet loss, etc., are used to measure QoS objectively. However, in the end, the demand for the relevant network providers is based on how the user feels about their experience. It has been proven difficult to evaluate the user’s experience accurately and objectively. Therefore, until the recent past, network engineers constructed networks without actual user feedback. To understand the user’s perspective, the quality of experience (QoE) metric was developed [
3]. There are many different definitions of QoE. One of the main reason for this is that the experience of users is a really broad phenomenon, that exists in multiple disciplines. As a result, it becomes difficult to have a coherent and consistent definition of what QoE is. In this study, we stick with the popular understanding of what QoE is for multimedia applications under telecommunication systems. In the 2019 amended version of the ITU-T Vocabulary for Performance, Quality of Service, and Quality of Experience [
4], QoE is defined as “the degree of delight or annoyance of the user of an application or service”. However, they also mentioned that this definition of QoE is a work in progress and subject to change as research in this area is ongoing.
Recognising the importance of the user’s perceived experience, service providers and researchers became eager to identify QoS and QoE correlations. Several studies focused on finding how various QoS parameters affect the user QoE in telecommunication systems [
5,
6]. By using QoS metrics in this manner, there was a way to oversee the end user’s experience. Instead of using simulation, network emulators have been extensively used to test the performance of such models and validate theory. Therefore, it is vital to have emulators that can accurately replicate real networks. Due to their accessibility and peer assistance, open-source emulators are popular among network researchers. One such packet network emulator, which is popular in both academia and in the communication industry, is NetEm. However, authors in [
7,
8] noted that NetEm has a number of significant shortcomings that hinder its capacity to replicate realistic packet traffic and packet network systems. One of the limitations is its lack of ability to correlate between various types of network QoS metrics; this is significant, as the correlation between QoS metrics is common in real-world network systems [
9]. For example, in a simple queuing system, as the delay of the packets increases, the probability of packet loss also increases. This indicates that delay and loss QoS metrics are cross-correlated in some form. The increase in delay also increases the likelihood that the next packet will also be delayed. This can be a significant disadvantage, since the emulation lacks the realistic nature of internet buffering. In addition, the emulator cannot accurately simulate the long-tail packet waiting times observed in actual Internet traffic [
10].
Despite many studies exploring the relationship between Quality of Service (QoS) and Quality of Experience (QoE), very few have considered the effect of correlated QoS factors on QoE for end users. This may be because of limitations in network emulation software or lack of access to real-world traffic statistics. As a result, the impact of cross-correlated QoS metrics on QoE for applications has not been explored by researchers, limiting the usefulness of previously published QoS-to-QoE mapping models. Additionally, the mapping between QoS and QoE is application-dependent. So, the way video streaming and VoIP applications are currently mapped is not suitable for new real-time applications, like passive game streaming, interactive game streaming, and cloud gaming. To provide the end user with a good experience, the mapping of these services needs to be done as quickly as possible. In order to accomplish this, it is essential that the emulator used produces cross-correlated QoS measures that are realistic.
This research suggests a new way to work around these problems with network emulation and aimed to bring more attention to these problems. The primary contribution of this study was to modify NetEm so that it more accurately replicates real network processes through correlation between loss and delay and to analyse how this affects the end-user QoE, both subjectively and objectively, for cloud-gaming applications. We show how important cross-correlation analysis of QoS metrics is by partnering up with a network analytics company to utilise their extensive database of real-time QoS information for the top four UK internet providers. We employed these data to establish empirical distributions and perform cross-correlation analysis between various network parameters to address both the lack of accurate and precise waiting-time distributions and correlated parameters in NetEm.
Next, the impact of correlated ‘Delay-Loss’ was compared with the default non-correlated NetEm configuration using subjective QoE evaluation for emerging cloud gaming applications. The results from the human subjects of the experiments demonstrated that the QoE of cloud gaming applications affected the subjects differently when they were subjected to correlated versus non-correlated QoS metrics. In a non-correlated scenario, the two different aspects of QoE, video-QoE and game-QoE, did not differ significantly. However, in correlated-QoS scenarios, there was a significant difference in in how the video and the game QoE were perceived by the human users. Interestingly, game-QoE was more affected by degrading network conditions than video-QoE in the correlated scenario. This could have a significant impact on the success of the cloud gaming industry, as the majority of existing QoS–QoE models were developed without QoS-correlation in mind. This would lead to an erroneous conclusion regarding the Game-QoE, which is the most important QoE factor in cloud gaming applications.
To confirm our subjective QoE analysis findings, we performed objective QoE analysis on the subjective experiment’s video. We evaluated the accuracy with which popular existing Full-Reference (FR) video quality assessment (VQA) metrics represented subjective QoE. Existing FR metrics showed a higher correlation to subjective MOS in non-correlated QoS than in correlated QoS scenarios. We also proposed a new No-Reference (NR) QoE metric that outperformed the existing FR metrics. Finally, we compared the average number of stuttering events in correlated and non-correlated network conditions. We believe this is the first study of its kind to examine how the QoE of cloud-gaming applications are affected by the correlated nature of actual internet traffic and to present correlated emulation for the first time as a wholly new paradigm for network performance evaluation.
2. Related Work
Cloud gaming has emerged as an interactive application, where users can play resource-intensive games on thin clients. The idea is the application of utilising powerful computer devices to run the game in a remote data centre, streaming the game play to the user over the internet, capturing their input, and returning it to the host computers in the data centre. This is the reason cloud gaming is also sometimes referred to as Gaming on Demand, as the user can play it conveniently wherever they desire without having high-spec hardware to run the game [
11]. Cloud gaming requires a lot of data to be transferred from the host (cloud) to the user (client) over the internet. This transfer of data packets through the network makes network quality a significant factor of the end-user experience of cloud gaming applications. A higher delay in the network can result in delayed user responses that can lead to poor game control, and vice versa [
12]. In the same way, a higher packet loss in the network means that key game information is lost and video quality goes down, which makes for a bad user experience. There are many studies that look at the effect of these network parameters on the user experience of cloud gaming, but they miss how these network parameters also have correlations between them, which can have a significant impact on the quality assessment of cloud gaming. This study aimed to fill that gap in the literature by demonstrating how PLR and correlated delay affect the end-user gaming experiences.
The majority of studies that examine the effect of network traffic on the quality of the cloud gaming experience use a network emulator to recreate the cloud gaming experience in the laboratory [
13,
14,
15]. NetEm is one of the most popular network emulators that are used in both academia and industry. NetEm provides multiple benefits, such as the use of custom delay distribution, support for heavy tail distributions, and auto-correlation between different network parameters, but it still lacks some key network principles that need to be evaluated for accurate mimicry of the network traffic. The most commonly used uniform or Pareto distribution of the Netem does not represent realistic network delay distribution. Refs. [
16,
17] argue that network delay distribution follows a log-normal distribution, which is not available in Netem by default.
In addition to the delay distributions, the packet loss implementation in NetEm is not realistic. Ref. [
18] NetEm drops packets randomly to achieve the desired packet loss levels. However, in many network configurations, packet loss is caused by full packet buffers, resulting in a correlation between high packet delay and discarded packets, which is what we mean by QoS parameter correlation. NetEm provides a Gilbert–Elliot two-state model where subsequent packet loss can increase if some packets are lost in the current time period. However, this loss is still not correlated to the accumulation of delay. Furthermore, the authors in [
7] reported that network emulators do not consider the correlation between different QoS parameters. Most emulators assume that packet loss, delay, and jitter are independent of each other. Some studies, such as [
16,
19,
20] showed that different QoS parameters could be correlated. The authors reported a mathematical relationship between loss, delay and jitter and established that QoS parameters were cross-correlated. Other studies that use NetEm to study the effect of packet loss, delay and jitter on the QoE of video applications include [
21,
22]. Most of these studies use the default configurations of NetEm and, hence, do not take into account cross-correlation between QoS metrics; thus, limiting their findings.
There are multiple accounts where the quality assessment of cloud gaming under various network conditions was tested. Ref. [
23] is one such example. The study presented network performance analysis for various games hosted on the onLive gaming platform. By analyzing the bit-rate, packet size, and inter-packet times for upstream and downstream traffic, the authors found that upstream traffic had a lower bit-rate, smaller packet size, and shorter inter-packet times. Similarly, the authors in [
24] examined the impact of various network conditions on the objective quality of games played on two cloud gaming platforms: StreamMyGame(SMG) and onLive. They found that using frame-rate as an objective metric, the objective quality of games decreased as the levels of delay and packet loss increased on both platforms. However, they found that onLive generally performed better than SMG. It is worth noting that the study’s limitation is that they only tested traditional games with low frame rates (24, 30 fps) which is not representative of contemporary games that support higher frame rates and have more complex content.
Similarly, the authors in [
25] investigated the impact of varying levels of delay and packet loss on the subjective quality of cloud gaming. They utilized PlayStation 3 as an alternative for a high-spec cloud machine, and manipulated network parameters using a network emulator. They found that the performance of the game decreased as the levels of QoS parameters increased. They noted that when the packet loss rate (PLR) was greater than 1%, the perceived quality was unsatisfactory. The authors in [
14] used a recently developed cloud gaming platform (Nvidia Geforce) and studied the effect of frame loss, jitter and latency on the subjective quality of gaming. Similarly, in [
25], it was reported that the quality of the game decreased as the levels of QoS parameters increased. However, their research showed that games streamed on NVIDIA Geforce performed poorly as the delay increased, but showed better tolerance for packet loss. The authors in [
15] also looked at the impact of packet loss on video and game QoE individually, and concluded that MOS distribution of game and video QoE were comparable. Recent studies have also examined the effects of a combination of delay and visual artifacts on QoE in cloud-based virtual reality (VR) applications [
26].
Moreover, the authors in [
27] examined the performance of cloud gaming applications on the Moonlight platform using objective measures. The researchers evaluated how different transport networks (LTE, Ethernet, and WiFi) affected Key Quality Indicators (KQIs) of cloud gaming. The metrics used were RTT, frame rate, rendering time, and rendering loss. The results showed that Ethernet was the best option for hosting games, outperforming WiFi and LTE. However, the study did not investigate the impact of varying Quality of Service parameters on game and platform performance.
In all the aforementioned studies, the default settings of the network emulators were used, and, hence, they ignored any cross-correlation present between the network parameters and limited the ability to capture the impact on the end-user experience. This paper, however, implemented cross-correlation between network parameters and then captured its effect on both subjective and objective quality metrics for cloud gaming applications.
3. QoS Correlation Analysis
The initial step of the experiment was to determine the nature of actual internet traffic. In order to accomplish this, we collaborated with a UK network analytics firm Teragence UK [
28] that was able to offer us a massive volume of real internet traffic data collected from the most popular UK internet service providers. This was made possible by partnership with network operators and through crowd-sourcing. This stage was intended to determine if open source network emulators, such as NetEm, could emulate real internet traffic.
The data were gathered through active measurements involving the injection of probes into the network, which were then captured by the Teragence servers. These probes were extremely lightweight and did not interfere with the network’s operation. The data were anonymised to protect identity and comply with the General Data Protection Regulation (GDPR) of the European Union. Four UK-based network operators’ data were used for the correlation analysis of QoS metrics and to determine the shape of packet delay distributions in this study. For each operator, five million rows of data from January 2019, to May 2019, were evaluated.
The empirical data contained a number of QoS indicators, of which the four most significant were utilised for the study. They were:
Correlation Analysis of Empirical Measurements
The correlation between the metrics was determined using both the Pearson Correlation Coefficient (PCC) and the Spearman Correlation Coefficient (SCC). The results indicated that the PCC between the QoS metrics was stronger than the SCC, indicating that the data had a stronger linear relationship than a monotonic one. As a result, for ease of analysis, only PCC was considered in the cross-correlation analysis [
16].
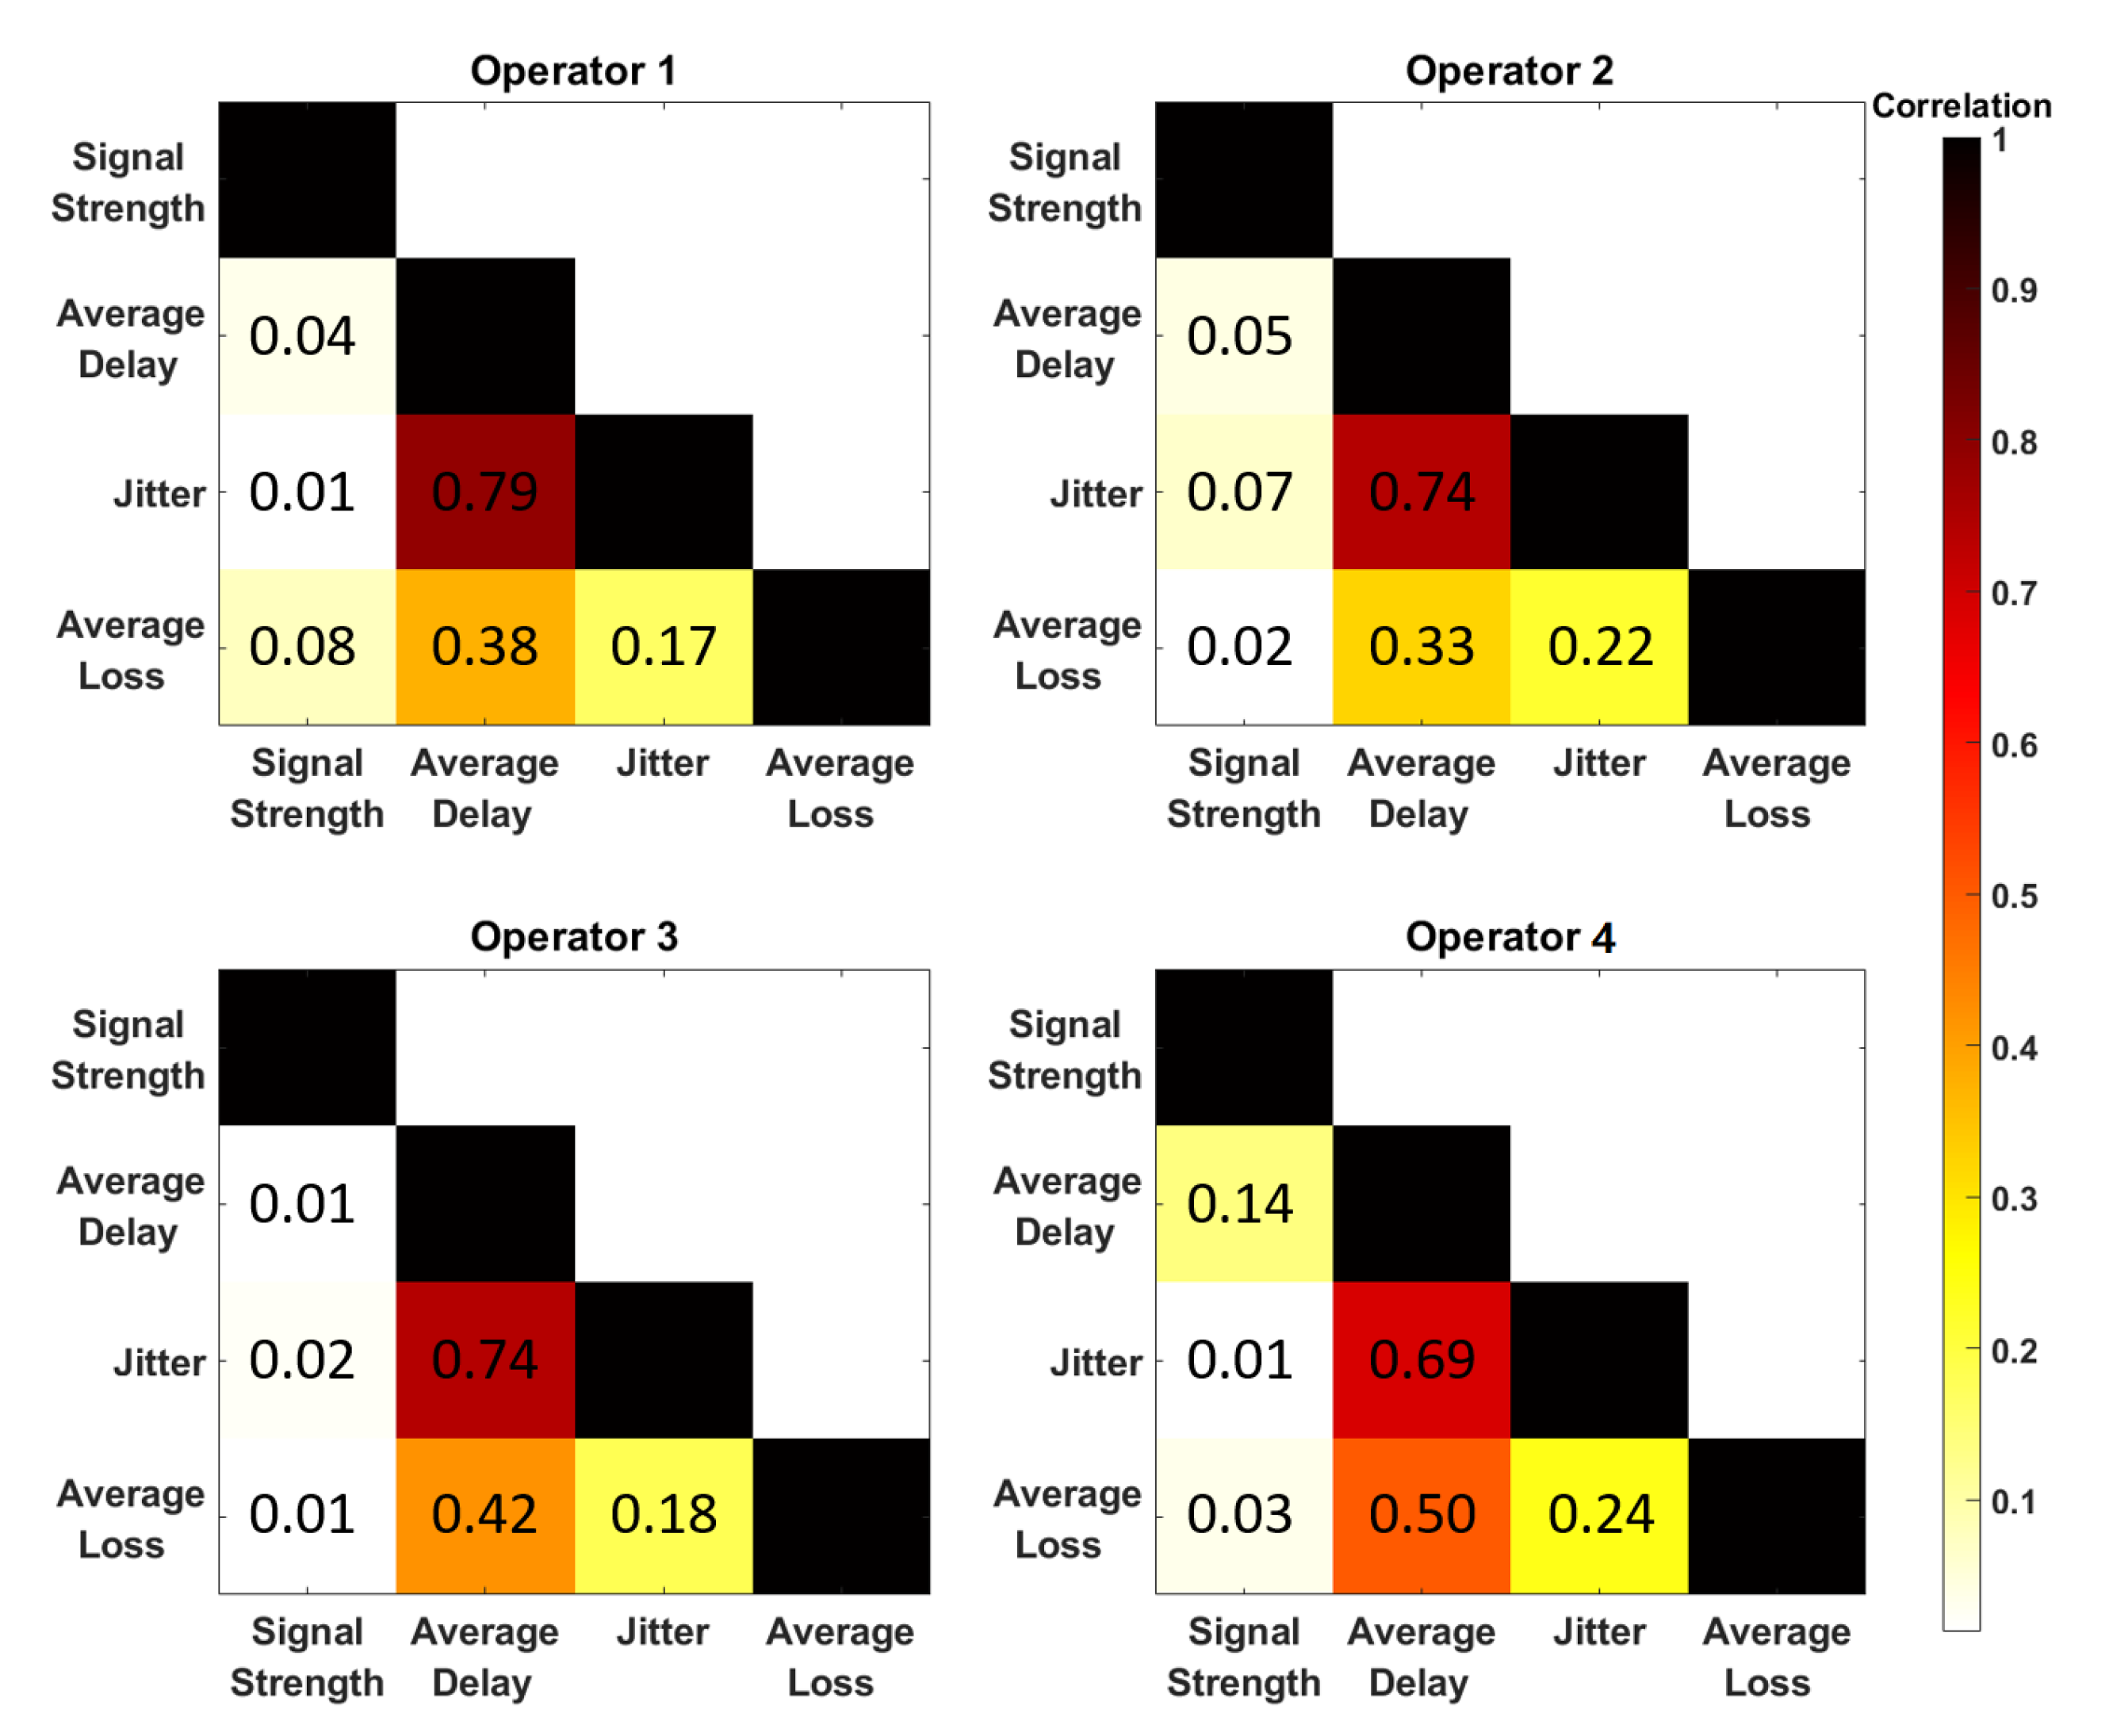
Figure 1 is a heat-map displaying the Pearson correlation of the four QoS measures. All network operators were shown to generate similar correlation values between the QoS measures.
The “Delay-Jitter” set of parameters has the highest correlation (dark red), followed by the “Delay-Packet Loss” and “Jitter-Packet Loss” combinations. The correlation between Delay and Jitter ranges from 69% to 79%, which is logical given that Jitter is the variability in delay between packets.
One of the most important QoS pairs is “Delay-Loss”, which showed correlation ranging from 33% to 50%. This correlation was expected to be higher based on the model of queuing theory, since in a simple queuing system, as packet delay increases, the buffer fills up and packets are lost once the buffer is full. This is explained by the method used to measure packet loss. As previously mentioned, probes were inserted into the network traffic in order to evaluate QoS. The server was unable to calculate the average delay when all 20 packets were lost because the packets never reached their destination. This created a data gap that was not accounted for in a scenario where probes were lost due to extreme delays. As a result, the correlation analysis produced a lower value than anticipated. Regardless, correlations of up to 50% may still be significant in QoE analysis, given that packet loss has a significant impact on the perception of any real-time applications [
29]. The range of the “Delay-Loss” obtained in this analysis was much higher than the results obtained in [
8], where the correlation of the same pair was determined to be 23%.
Finally, none of the operators other than operator 4 demonstrates any significant correlation between Signal Strength and other QoS metrics. Even if it sounds counter-intuitive, the mobile signal intensity can be explained by comparing it to a switch or step function. Signal Strength is registered as 0 when a phone cannot send packets to a cell tower owing to network congestion or interference, regardless of the signal’s strength (Off). When it can make a connection, the ‘Signal Strength’ is 1 (On) (On). Therefore, in the majority of the cases, the pinging of packet performance characteristics, such as delay and loss, is independent of the device’s signal strength. This was the same conclusion reached by the authors in studies [
30,
31] and explains this discrepancy due to the way RSSI is measured. According to these studies, RSSI in commercial Network Interface Controllers (NICs) is measured during the Physical Layer Protocol where before any data packets are sent, the headers and preamble are sent at low data rate. If the transmission of header and preamble fails, then the data packets are not sent giving RSSI a value of 0. But in case it does reach, regardless of the RSSI values, the data packets are sent at a stable rate. Hence, signal strength reading (RSSI) shows no variation in performance for different values.
Next the delay distributions of each operator were generated from the measured data. First we obtained the probability density function (PDF) of delay distributions obtained from four operators’ QoS data. This was then best fitted to an existing distribution based on Maximum Likelihood Estimation (MLE) and Information Criterion. It was discovered that the Log-Normal distribution best fits the data for all operators. This is the expected result given that packet latency over the internet is generally long [
32]. One thing to keep in mind is that the delay times provided here represent Round Trip Time (RTT), or the total time it takes a packet to travel to and from the server. To emulate end-to-end delay (either downstream or upstream), we halve the latency times, assuming the packet takes the same amount of time to travel to and from the server. At the moment, there is no way around this assumption because there are no existing empirical solutions for determining one-way latency. The mean end-to-end delay for all four operators obtained are shown in
Table 1. The characteristic parameters; mu (
) and sigma (
) of log-normal distribution were found for each operator. These parameterised log-normal distributions were later implemented in NetEm to provide realistic packet delay distribution for our QoE experiments.
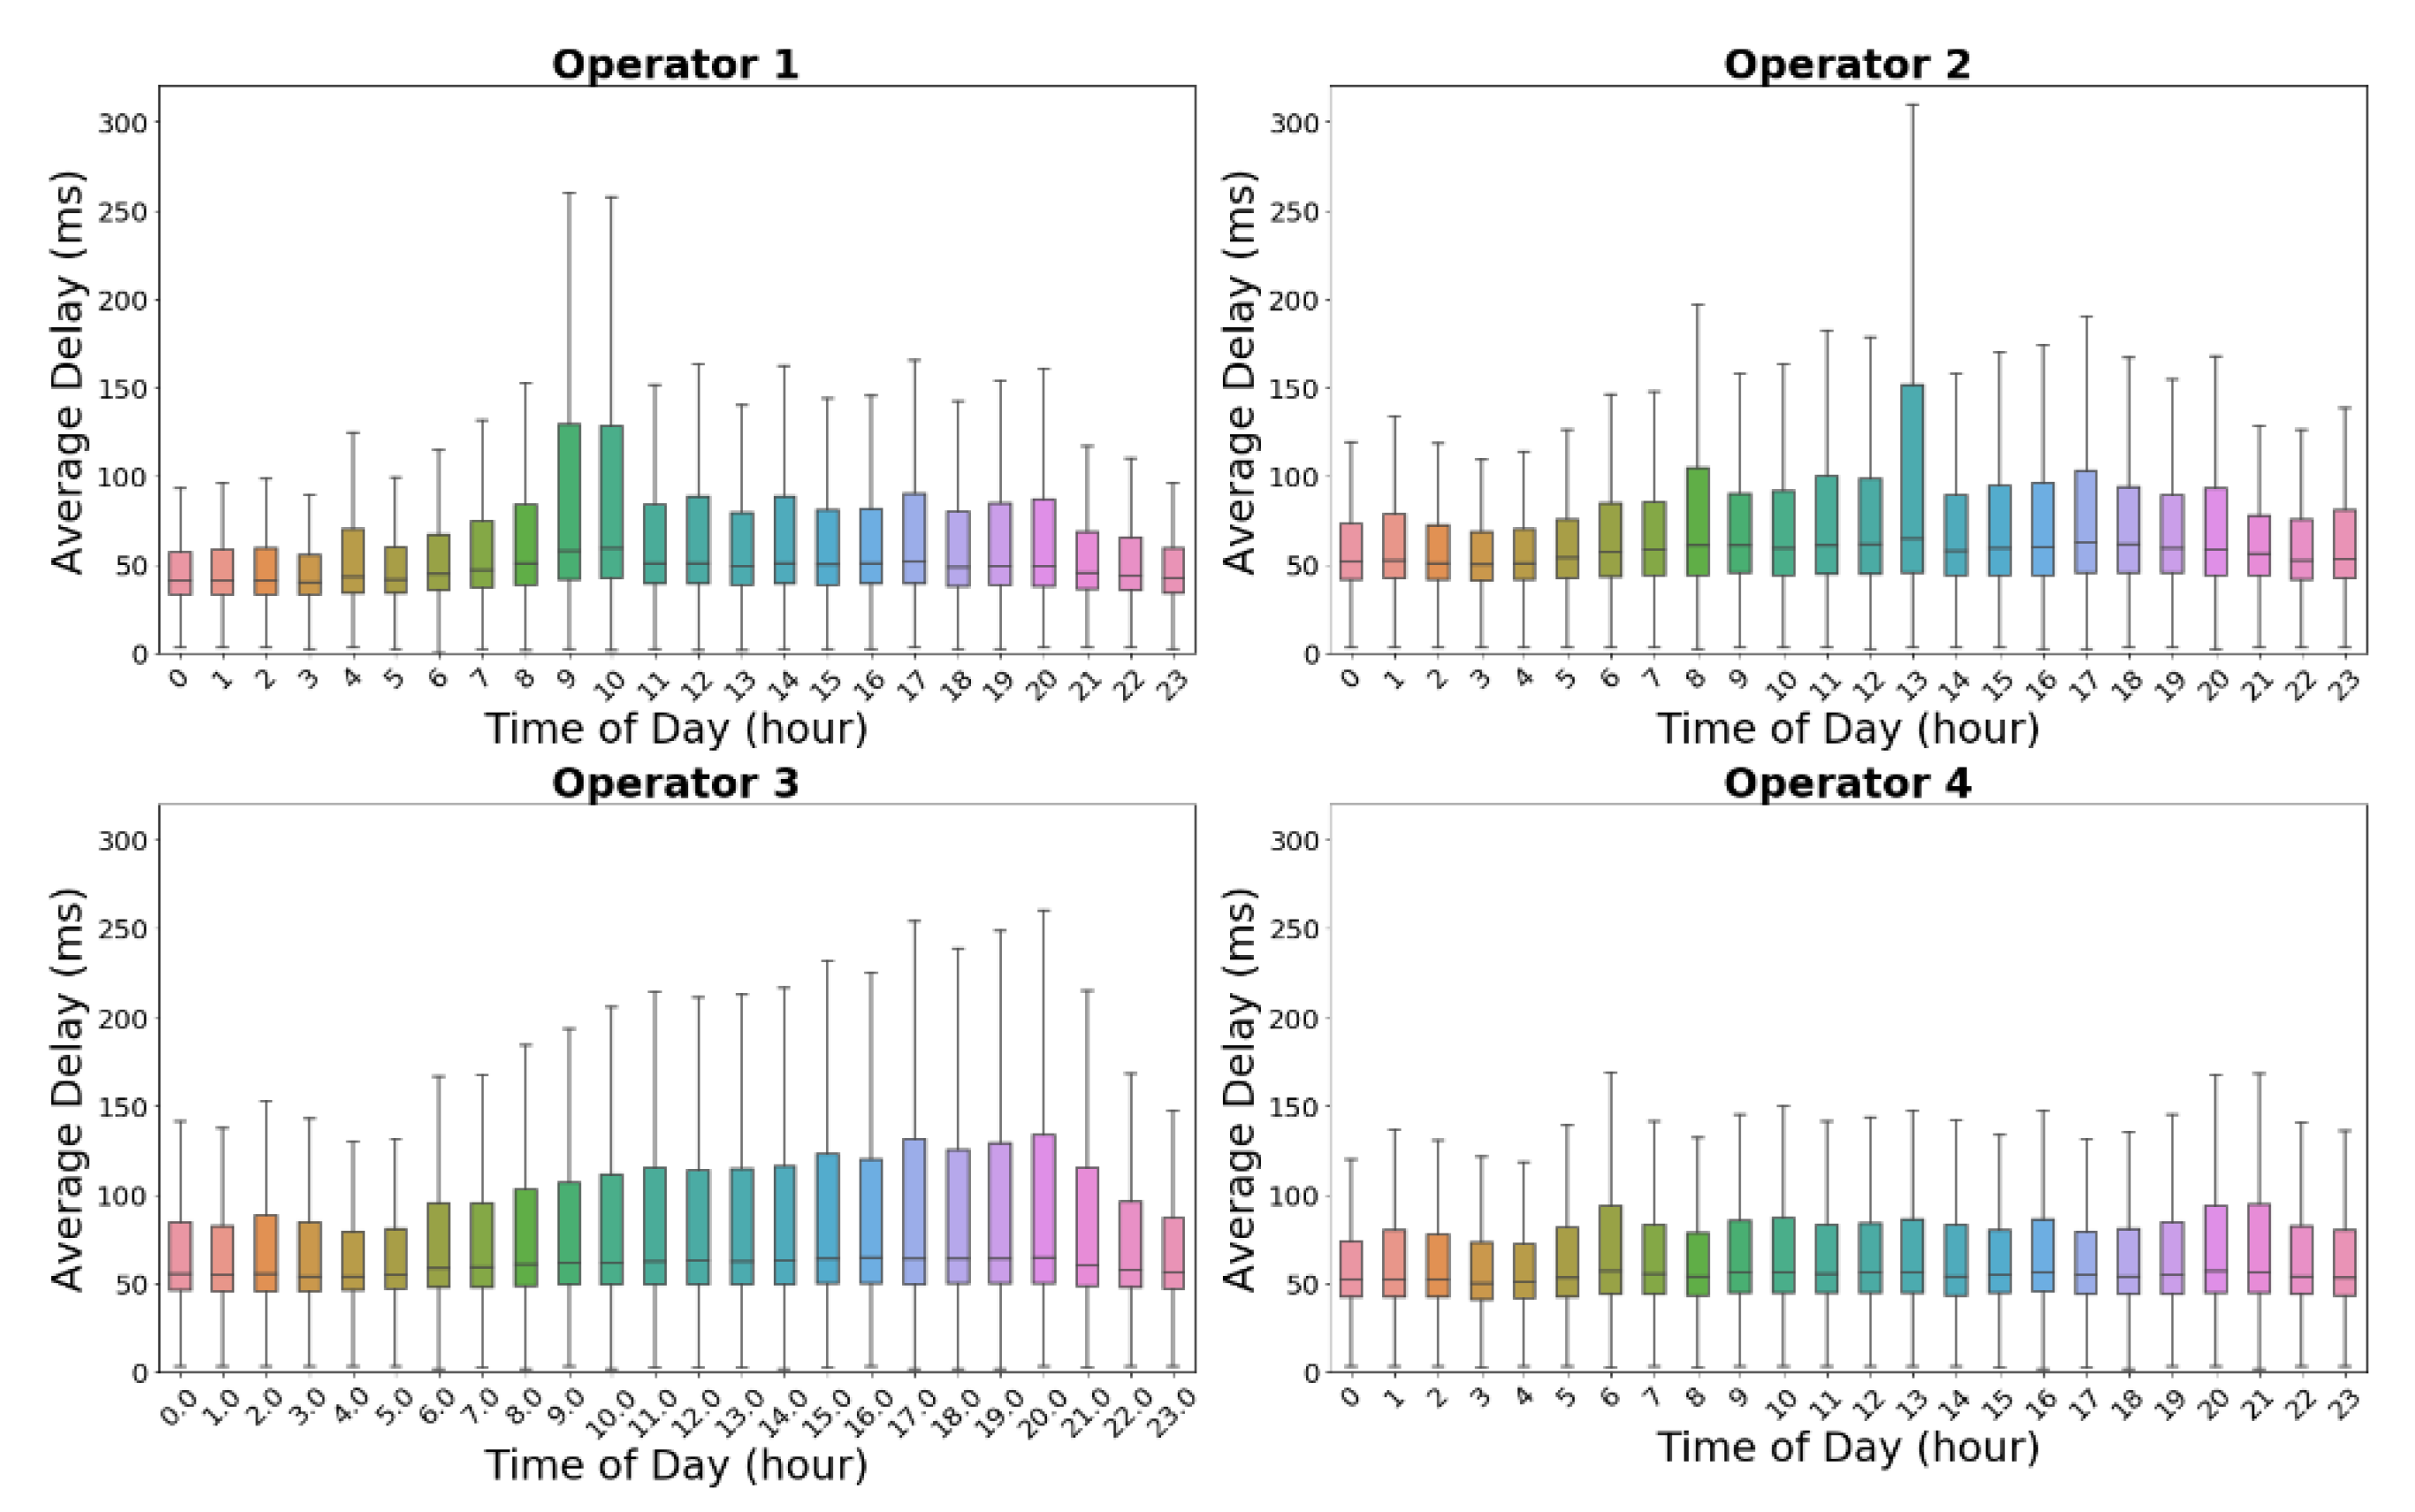
To get a better context of the delay distribution throughout the day, a box-plot representation for each hour packet delay was plotted, as shown in
Figure 2. The outliers were not included in the calculation because they were limited in number and more than 1000 milliseconds, which is an enormous amount in networking terms. As predicted by the log-normal distribution nature of packet delay, the medians were considerably closer to the First Quartile than the Third Quartile.
Figure 2 demonstrates that operator 4 had a more constant average hourly delay than the other operators. Even though the average delay values for operator 1 and operator 4 were nearly identical (51 ms and 49 ms, respectively), the hourly distributions were substantially different. While the average hourly delay for operator 4 remained between 40 ms and 60 ms throughout the day, the average hourly delay for operator 1 fluctuated significantly more, reaching a peak of nearly 120 ms between 8 a.m. and 10 a.m. This might be considered operator 1’s busiest hour. Similar results were applicable for operators 2 and 3. Even though their mean latencies, over a 24-h period, were quite comparable, their hourly averages were vastly different.
These results could be utilised to emulate alternative off-peak and peak distributions for QoS-QoE evaluation. Depending on the type of application and time of day, consumers are able to determine which operator best meets their requirements. The operators could also use this information to efficiently reallocate network resources. The findings of different mean hourly delay and maximum points were later used in the QoE evaluation experiments, to emulate different off-peak and on-peak scenarios.
4. Bespoke Network Emulator
As noted in the section on related work, NetEm’s inability to provide a suitable delay distribution, and its lack of cross-correlation between QoS metrics, limit its usefulness as a network emulator. Therefore, we decided to modify NetEm to overcome these restrictions and utilise it to build a cloud-gaming testbed in order to investigate the effects of cross-correlated QoS metrics on the QoE of various games.
4.1. Modification of NetEm
For the reasons stated above, the NetEm’s built-in distribution of packet delays was not an appropriate choice for emulating realistic traffic. Hence, the Log-normal distribution parameters and PDF relationships obtained from real-traffic data were used to create an empirical delay distribution table that could be integrated into NetEm. NetEm allows the inclusion of custom delay distribution with mean and standard deviation using iproute2, GNU compiler and maketable utility. A bash script was used to create a bespoke version of NetEm, where a custom long-tail delay distribution could be generated using any and parameters of the distribution.
As mentioned previously, it is understood from queuing theory that one of the most important pairs of QoS metrics is Delay and Loss. So, it was decided to implement this pair of QoS first, in the bespoke NetEm. To implement the linearly correlated Delay–Loss parameter in NetEm, a simple bash script was written. The script started off by importing randomly generated custom delay distribution. A python script was used to generate instantaneous loss depending on the value of the delay, correlation coefficient and average loss. This allowed us to emulate Delay and Loss with the required correlated percentage. Furthermore, the rate at which the packet delay were updated was kept at two per second to nullify the effect of jitter. In this way, only the impact of correlated Delay-Loss could be observed. The algorithm used to generate the required packet loss is given below.
Let us assume that the delay distribution is an array of positive delay values, D (in ms) of size N. We then need to generate an array of length N of loss values, L for each corresponding delay values. To start off, we generate random noise array, the same length as D. We can then find the least square linear regression of the noise Q such that , where and , where m is the gradient and c is the y-intercept Q. So and the residuals R of noise on D is such that the R and D have zero correlation between them.
Since
D has correlation of 1 with itself, and 0 with
R, we can easily find the appropriate linear combination to have an array with any required correlation value. Equation (
1) gives the linear combination formula to generate an array of loss
L:
where,
where,
r is the Pearson Correlation Coefficient,
and
are the standard deviation of the residuals and delay values respectively.
Now, the issue is the generated loss array can range from a negative value to more than 100 depending on delay and randomly generated noise values. However, the loss input value in NetEm was in %, hence we had to scale and shift the generated array to give us an array ranging from 0 to 100.
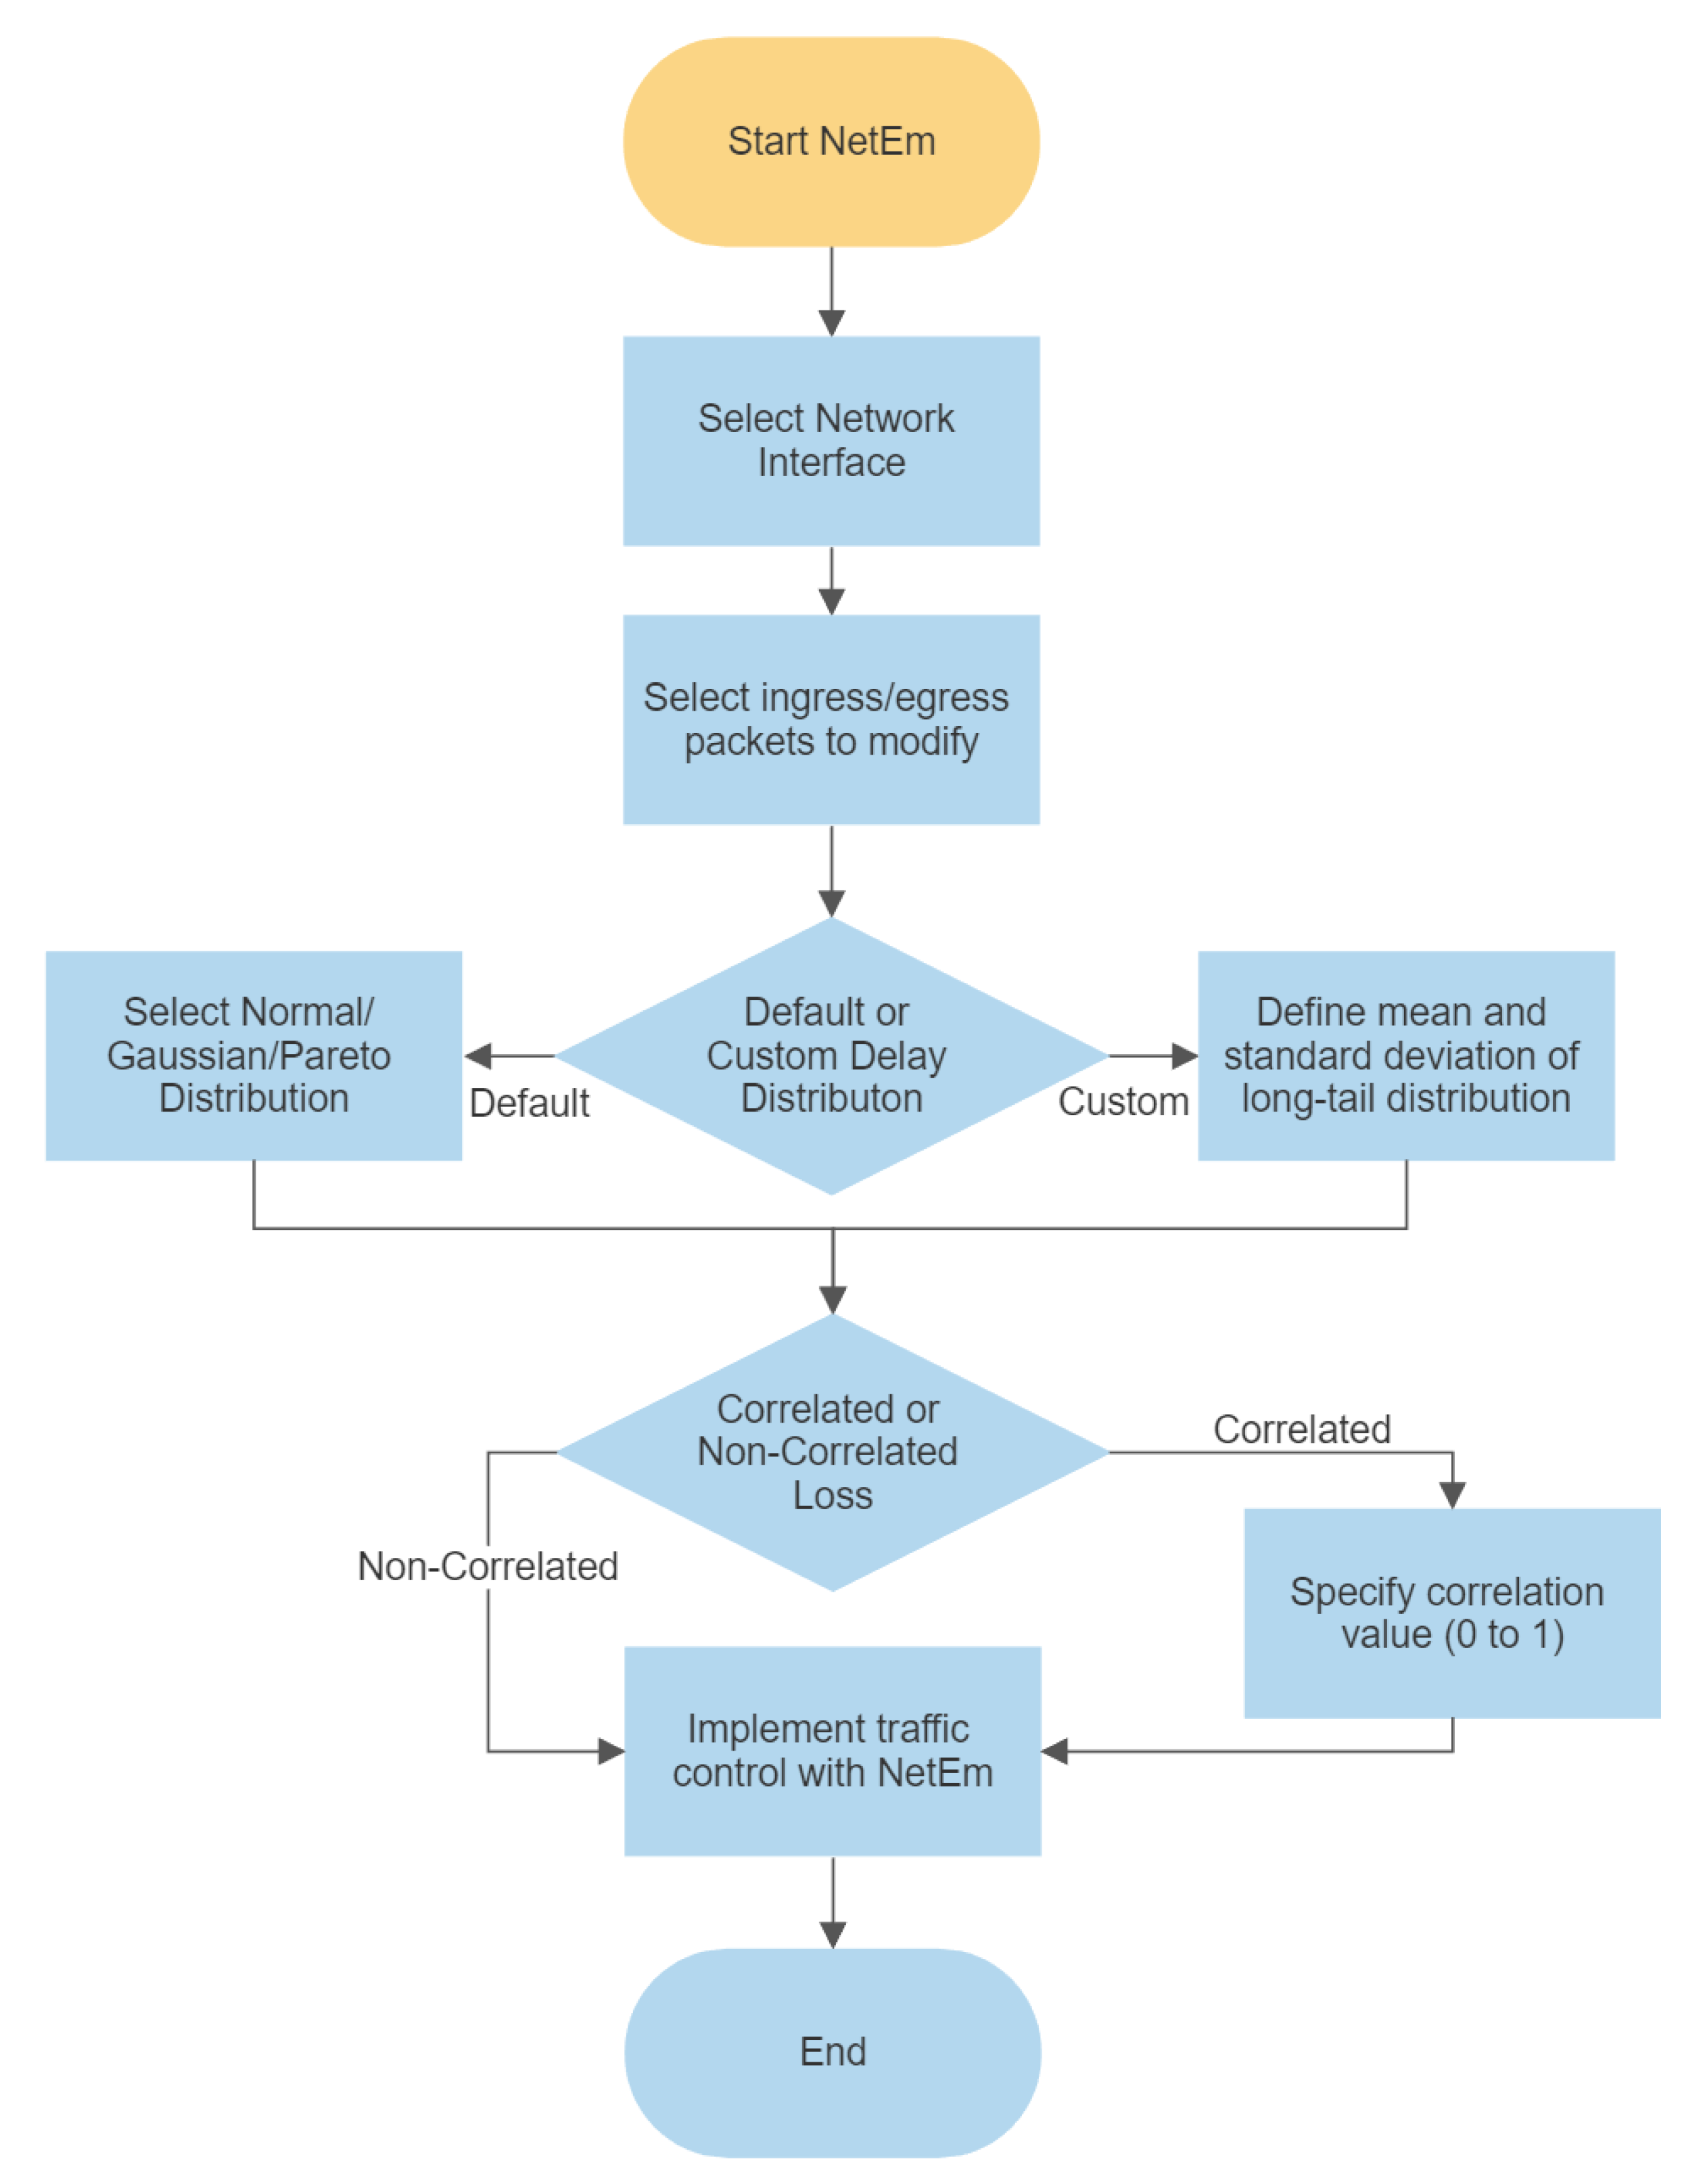
Figure 3 shows the flowchart of the processes taken by the bespoke emulator. Once NetEm was initiated, it requested from the user which of the existing network interfaces to use for emulation. The user was then prompted to choose between applying the traffic control to packets entering (ingress) or leaving (egress) the interface. The user then had the option of using the default NetEm delay distribution or to generate custom delay distribution. The user then had the option to add the percentage of packet losses with or without correlation to delay. If correlated loss was chosen, a correlation value between 0 and 1 had to be specified. This simple, yet effective, change to NetEm would allow the user to emulate more realistic network scenarios than the default setup.
4.2. Emulator Testbed for QoE Experiment
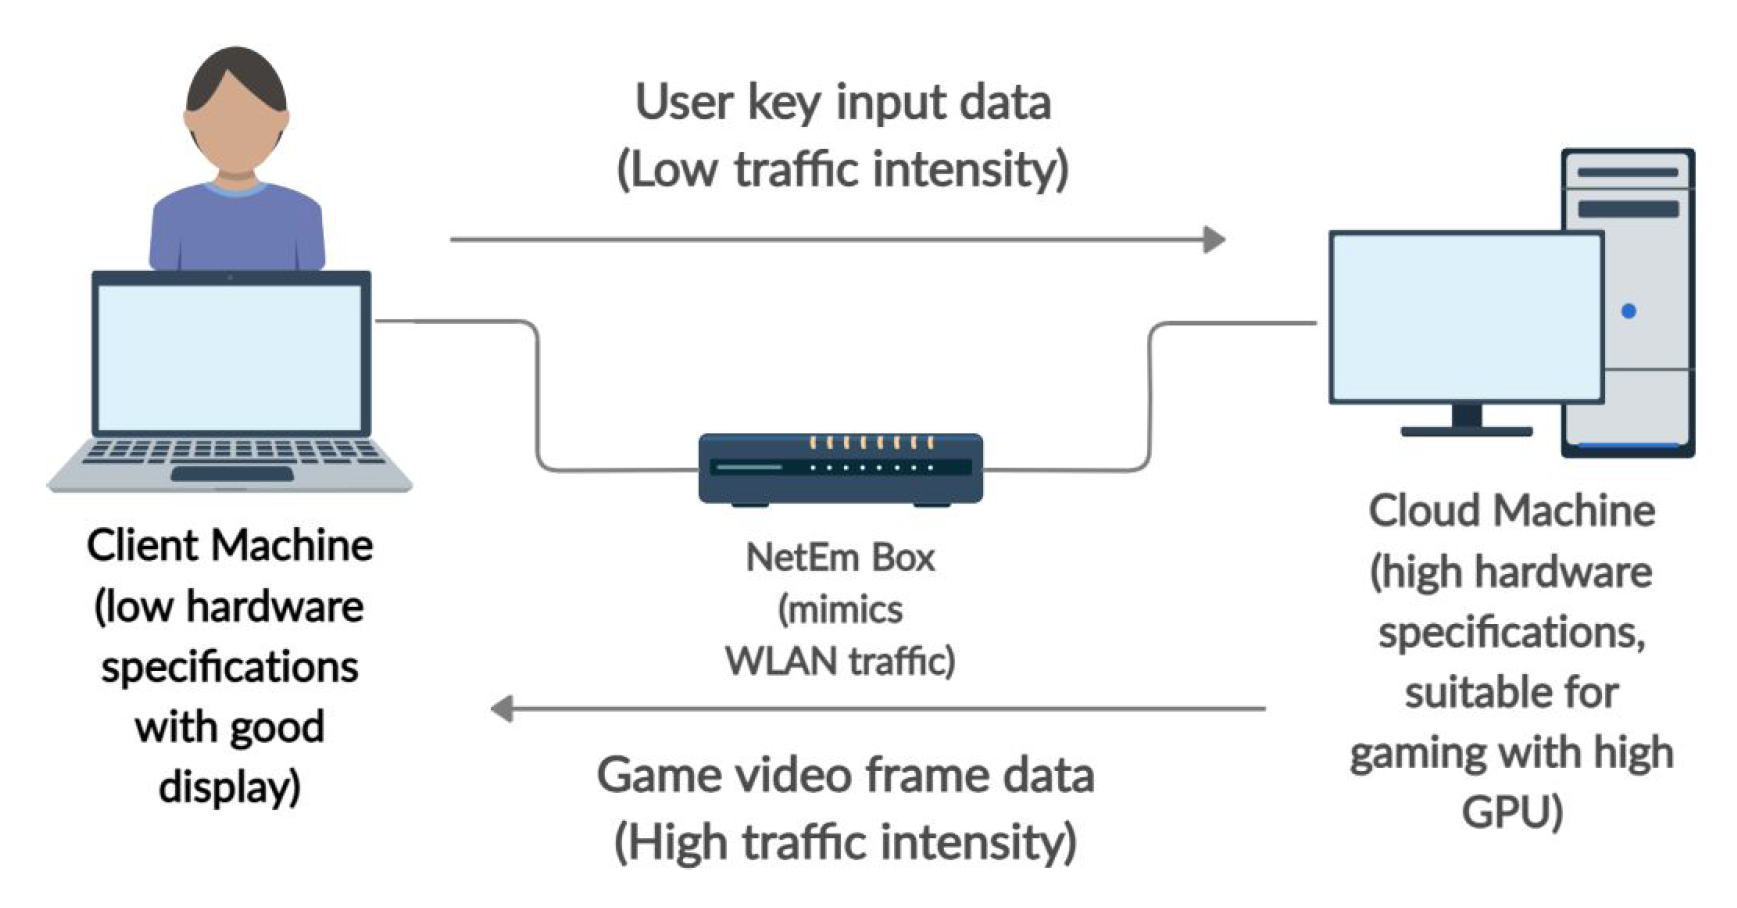
The modified emulator was then used to setup a testbed to be used to assess how the correlated QoS metric affected the QoE of cloud gaming applications. The cloud gaming testbed was created using a three-PC configuration. It was decided to employ a powerful PC with a highly capable i9 processor, RTX 2080Ti GPU, and 16GB RAM as a cloud server. The cloud game played was hosted on this computer. The user’s client computer, which was a mid-range Dell laptop without a dedicated GPU, was used to play the game. This was the most typical case in an actual cloud gaming platform; the user takes advantage of the power of the cloud host computer because they do not have a powerful enough PC to run on their own system. A third PC running Linux-based NetEm that had been modified was used to connect the client and server computers.
The NetEm box served as a bridge between the server and the client, as seen in
Figure 4. However, neither a switch nor a hub could be used to create this connection. This was because, in order to change the QoS values, traffic between the client and server had to pass via the qdisc of the NetEm box. Additionally, using a hub or switch diverted the packet away from the Linux kernel’s qdiscs. Therefore, we chose to connect the NetEm box to a device that had two separate Ethernet connections. As seen in
Figure 4 the client PC was linked to the second Ethernet port (ETH2), while the server was connected to the first Ethernet port (ETH1). To enable packets to move between the server and the client, a bridged connection was established between these ports using the bridge utility tool. The network interface settings in the Linux distribution’s /etc/network/interfaces file was changed to build a bridge between the Ethernet ports.
5. Subjective QoE Evaluation of Cloud Gaming
Equipped with the bespoke emulator, we decided to carry out subjective testing with human subjects playing three different games under different correlated and non-correlated “Delay–Loss” QoS scenarios. Since this was an interactive application, this research considered two QoE criteria. The first criterion was the quality of the game itself, in terms of how easy or difficult it was to play the game at a satisfactory level. The second criterion was the quality of the game’s video. The video-QoE examined solely the image/frame quality of the video. Research has demonstrated that immersive systems, like VR, can affect the user’s Quality of Experience (QoE) in gaming applications [
33]. However, in this study, the focus was limited to the QoE of video and game aspects only, and immersiveness was not considered for practical reasons. In terms of various network conditions, we chose the peak-hour log-normal delay distribution with a mean delay of 50ms to maintain consistency with our past findings. After reviewing similar experiments conducted by other researchers, seven different packet loss ratio (PLR) were chosen which were the following: 0.1%, 0.25%, 0.5%, 1%, 2%, 5% and 10%. So, for each game, there were 14 scenarios: even with correlated “Delay-Loss” and seven with non-correlated “Delay-Loss”. To maintain consistency with the prior section’s findings, the correlation value was selected to fall between 0.3 and 0.5.
After careful consideration, it was decided to implement the correlated QoS metrics only on the incoming packets. This was done since the vast majority of the packets in the cloud gaming scenario are going from server to client. All the video frames and audio packets are coming towards the client, whereas only the key inputs from the client are being sent to the cloud server. Other studies [
25] have shown how network degradation to packets going from client to server has minimal impact on QoE since very few packets are being sent to the server.
The three game genres were chosen based on their popularity, genre, and content. The selected games were:
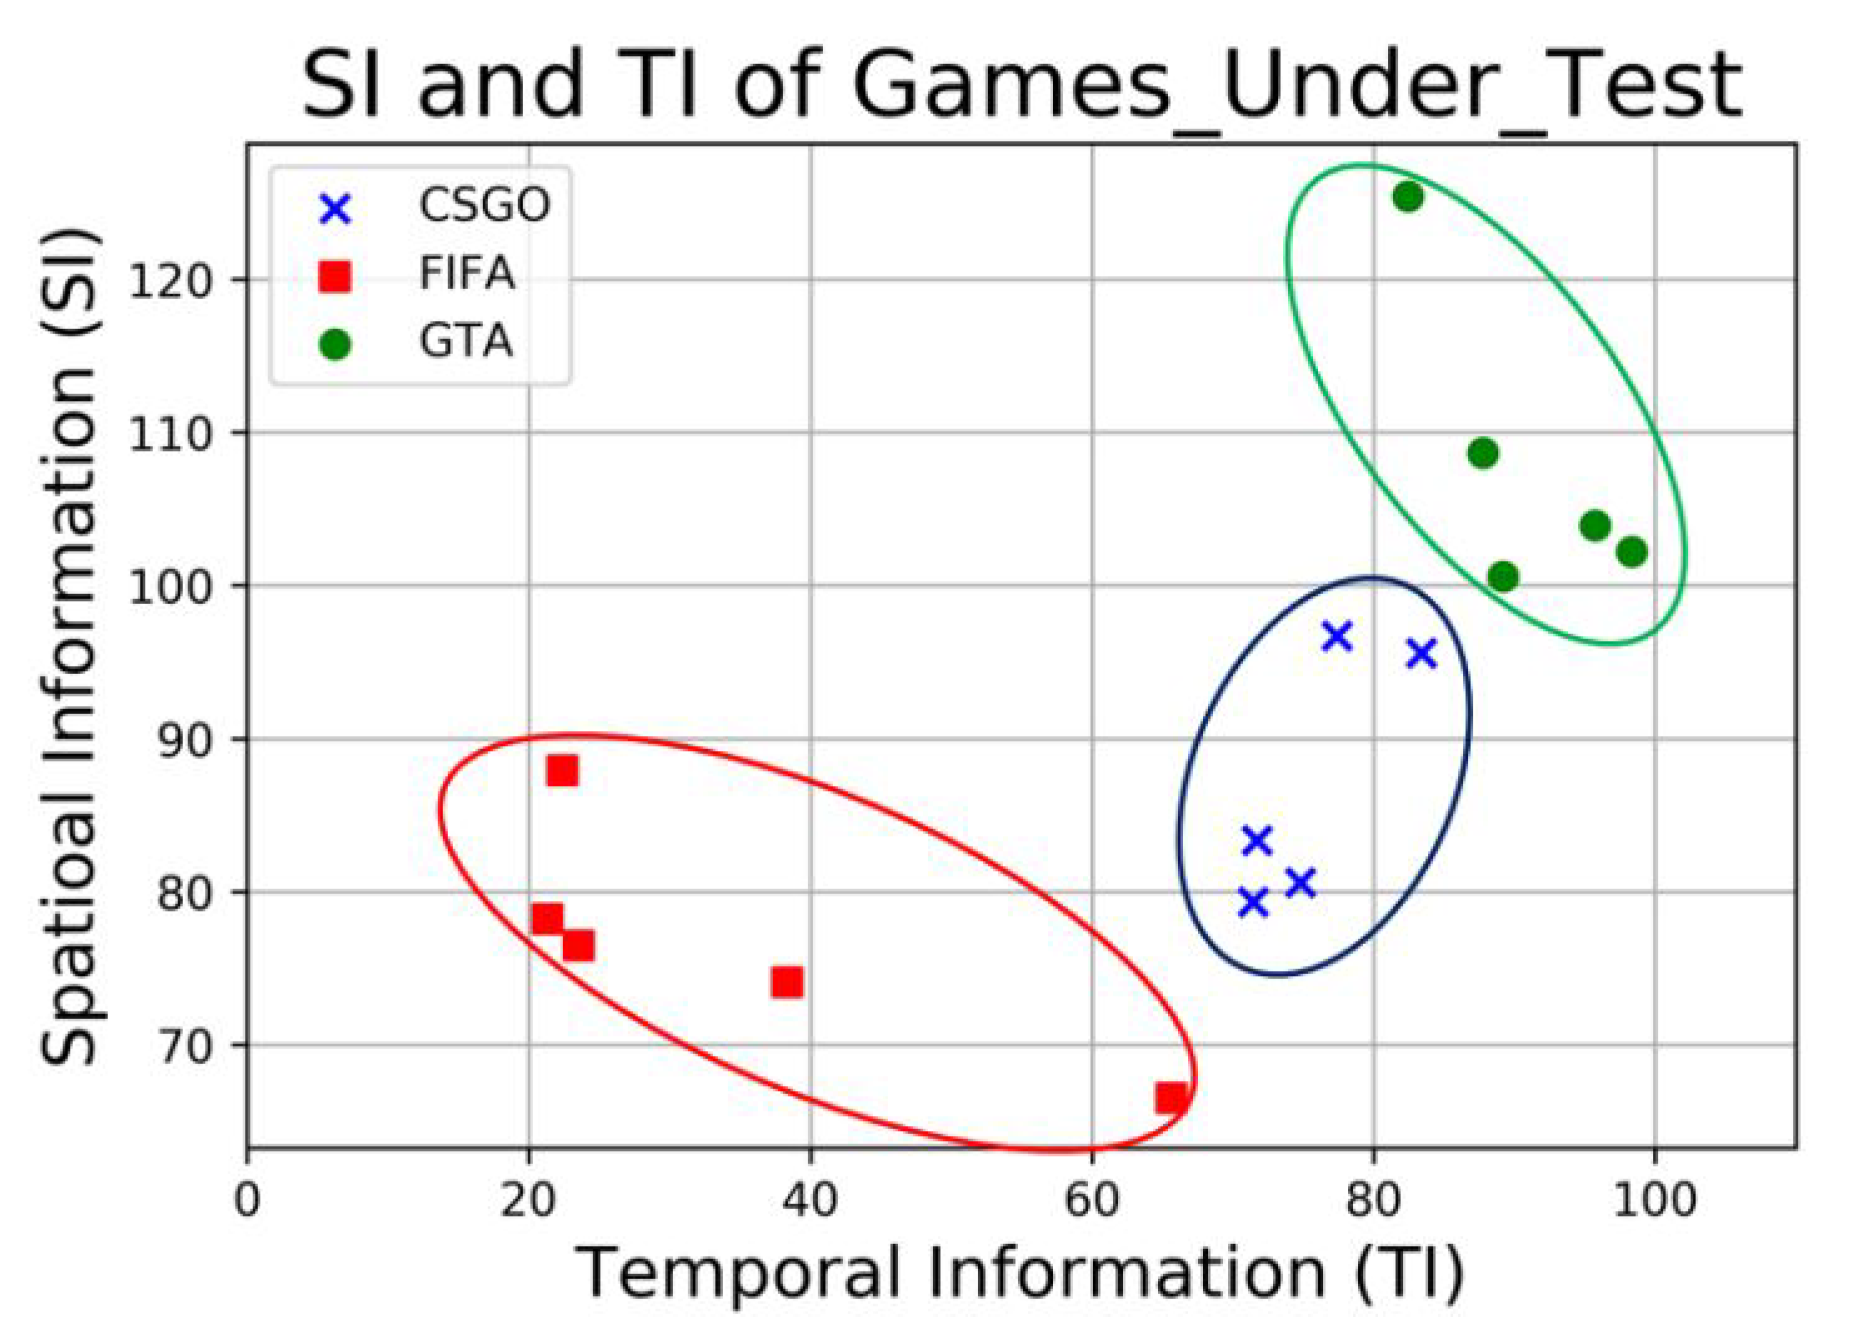
Using Spatial Information (SI) and Temporal Information, we subsequently analysed the content complexity (TI) of the three games. SI measured the amount of spatial information present in each frame of the game, whereas TI measured the amount of temporal changes that occurred between the frames. Therefore, a high SI implied that the game had a high level of image detail, while a high TI suggested that the game had rapid changes between each frames.
In our prior work [
15], we covered in greater depth the game selection procedure and the content complexity of each game. In general, they were added to cover a wide range of gaming applications based on the selection criteria in ITU-T G.1032 and G.1072 [
34,
35].
Figure 5 depicts the results of the content complexity evaluation. The SI and TI findings showed that FIFA had the lowest SI and TI, indicating that it was a game with a slow tempo. GTA V had the highest SI and TI and was regarded as a high quality, quick-paced game. The content level of CSGO fell between that of FIFA and GTA, and it was classified as a medium-paced game.
The objective of evaluating the SI and TI of each game was to determine whether varying QoS parameters had an impact on the QoE of the games, due to their complexity. This could potentially provide a future method for classifying QoS–QoE mapping, based on the genre or type of game.
5.1. Gaming Platform and User Profile
Following careful consideration of several gaming platforms, it was determined that the Parsec streaming platform would serve as the application for the subjective experiments. The choice was to either use the Steam game platform or Parsec out of several other options. We chose Parsec because it enabled streaming via LAN connections, which was necessary for a controlled network environment without uncontrolled network degradation over the internet. Secondly, it is extremely popular in the gaming community, due to the proprietary Better-UDP (BUD) networking protocol utilised by Parsec [
36]. BUD combines the dependability of TCP with the low latency of UDP to give the user one of the best possible remote gaming experiences. It also provides control over a number of important streaming KQIs’, including frame rate, bandwidth, video encoding, and resolution.
Subjective assessment included 24 human individuals, 6 females and 18 males. The tests were conducted in a laboratory designed specifically for QoE trials in accordance with BT500 and P809 specifications [
37,
38]. The Parsec application was installed on both the server and client PCs via the emulator PC’s LAN connection. Before the QoE experiment, each subject played all three games for 10 min to familiarise themselves with the controls and ideal conditions. All the subjects had experience of playing PC games before, but played less than 7 h a week, so would be classified as recreational gamers and not as experienced gamers, according to the definition in a report by Limelight Networks [
39].
As indicated previously, each game featured fourteen scenarios, each lasting 45 s. After each scenario, participants were asked to score video-QoE and game-QoE on a scale from 1 to 7, with 1 representing the worst experience and 7 representing the best. As indicated by ITU 809, the ranking was based on a 7-scale ACR. This allowed for greater versatility and representation of user experience than a 5-point scale. The participants also had the option to provide a reasoning for each rating, describing why they selected a certain value for video and game QoE. The subject required around 90 min to complete the test, with pauses after every scenario to lessen the impact of fatigue on the QoE rating.
5.2. Subjective QoE Results
The results of the subjective evaluation of cloud gaming QoE were then converted to Mean Opinion Score (MOS) on a 7-point scale and, subsequently, a 5-point scale. The majority of QoS-QoE modelling studies cited in the related work section used a 5-point scale MOS as a barometer for QoE. This is why we opted to convert our 7-point scale QoE data to 5-point scale MOS in order to enable comparisons with studies of a similar nature. Equation (1) presents the equation for rating conversion from a 7-point scale to a 5-point scale.
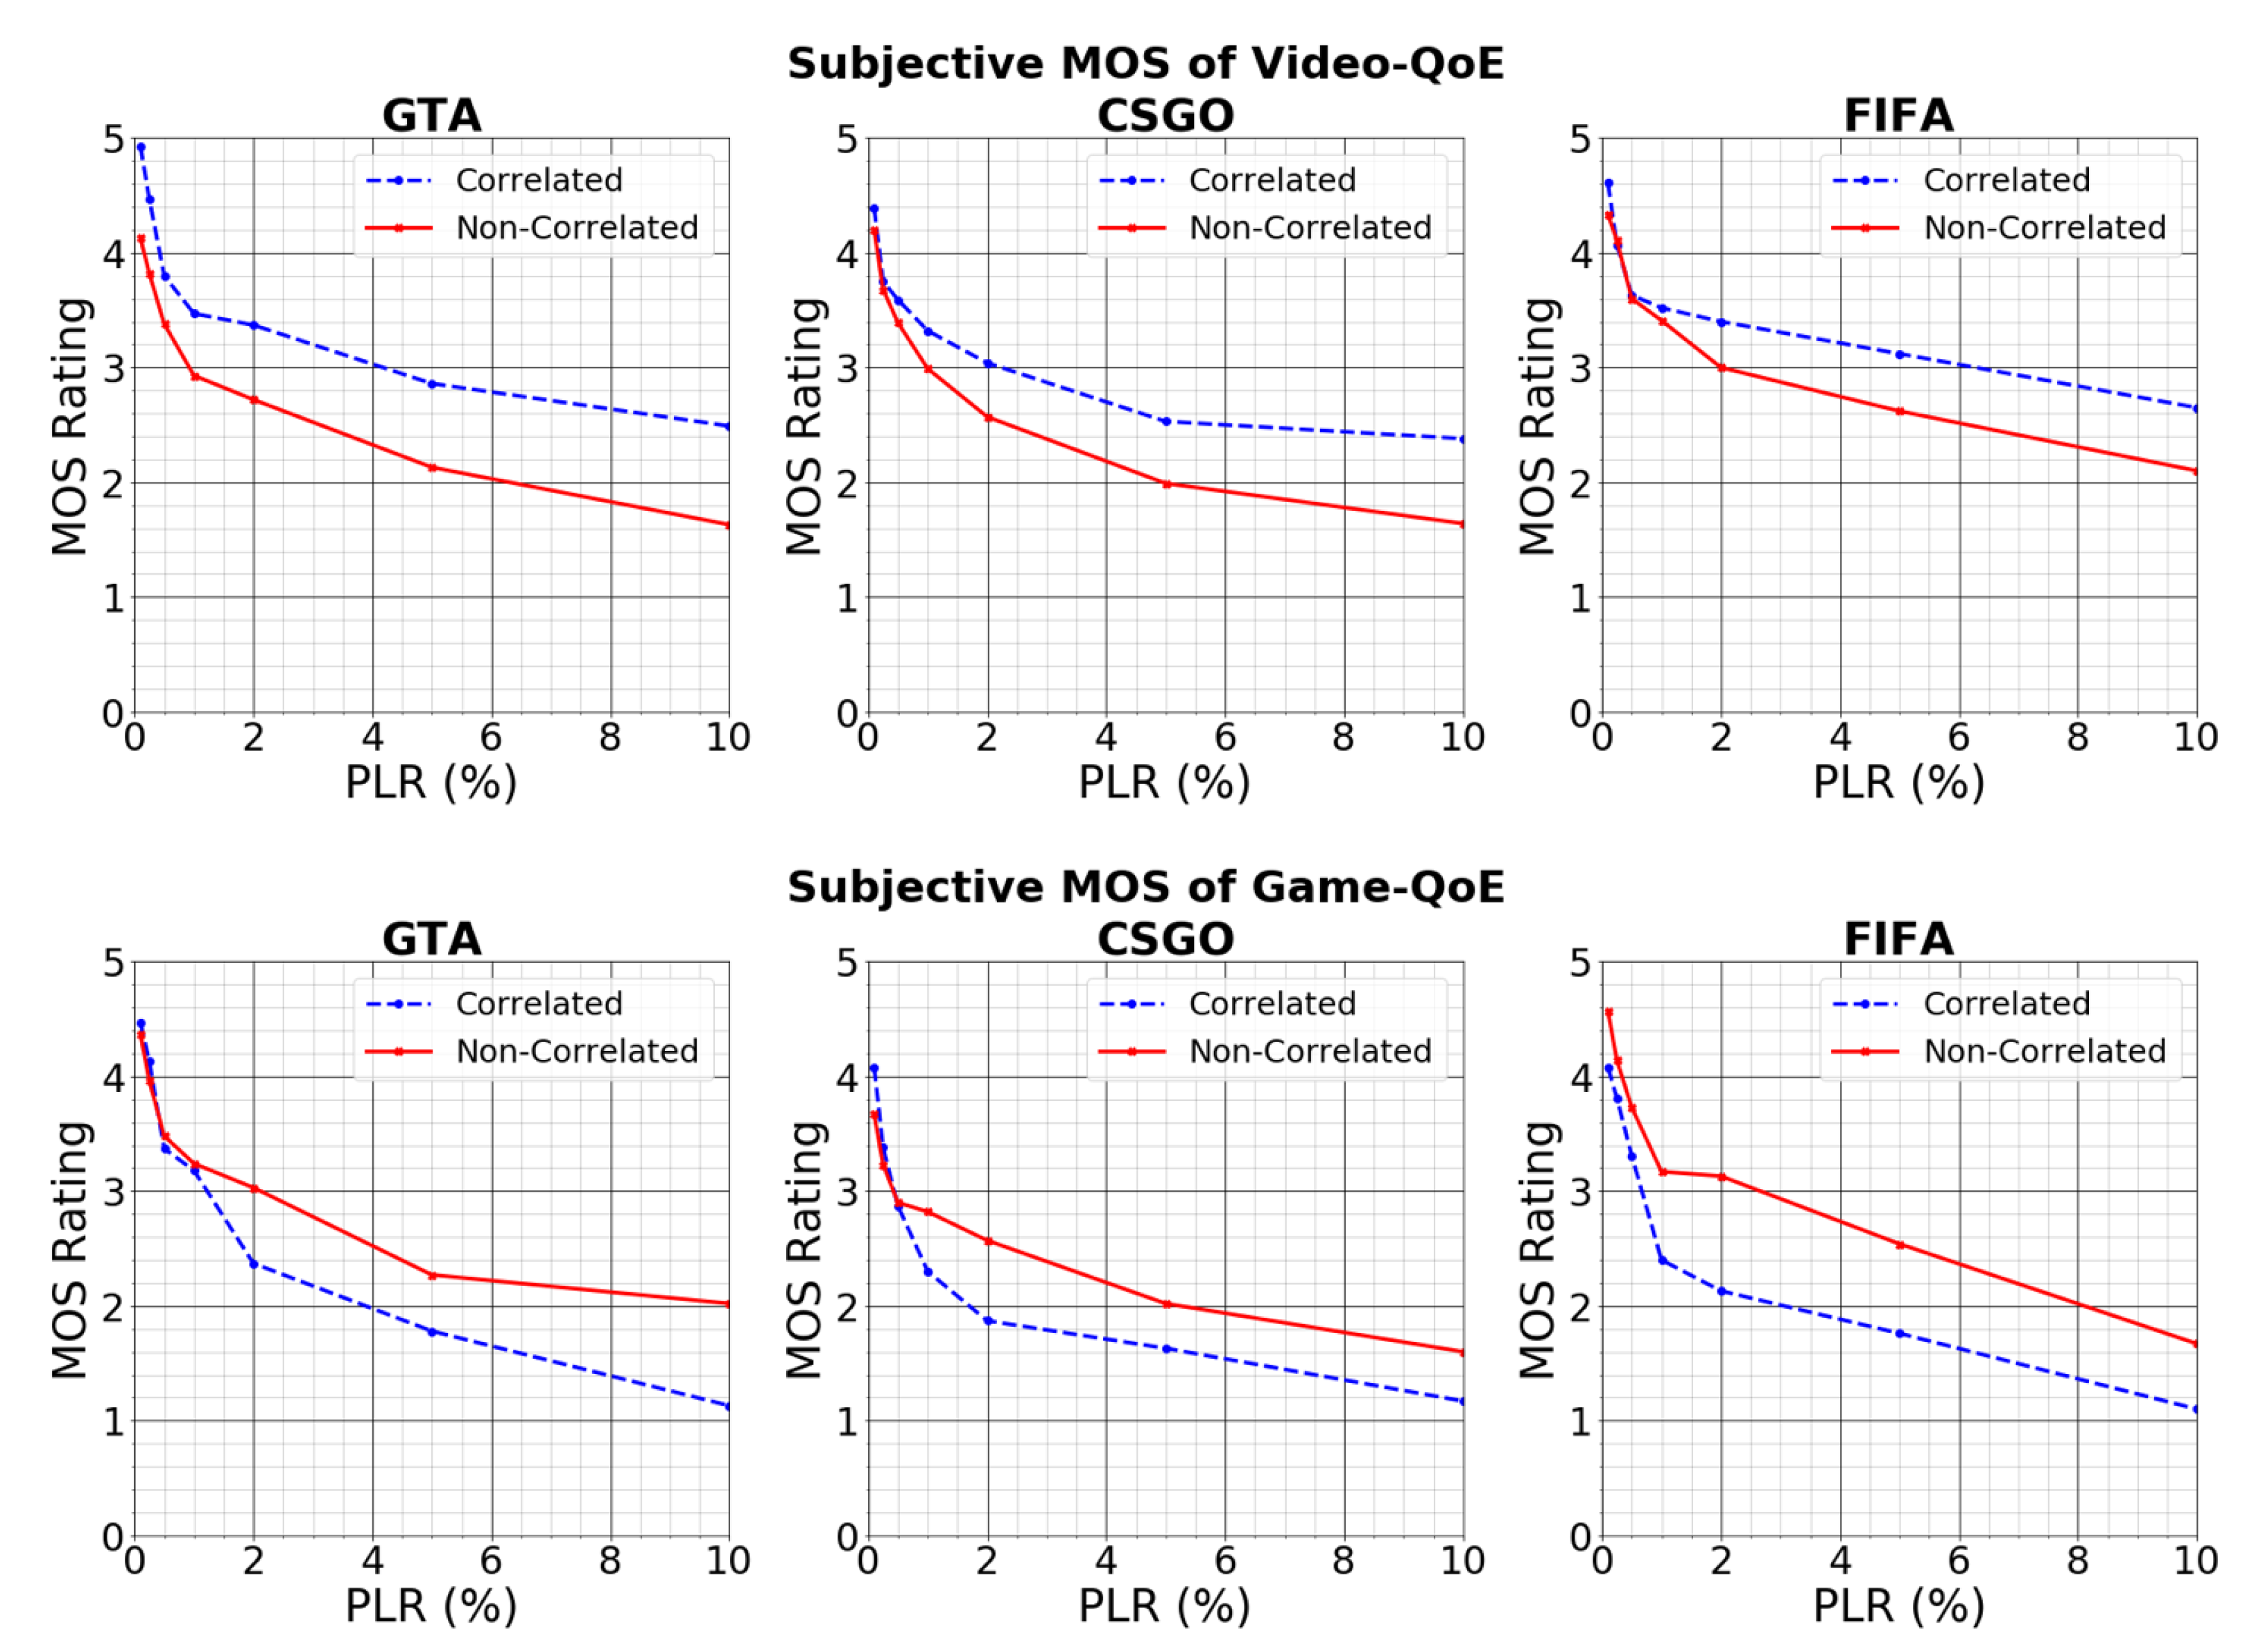
Figure 6 shows the summary of both the subjective Video-QoE and Game-QoE plotted against different PLR scenarios. The blue line represents the correlated “Delay–Loss” scenario, whereas the red line represents the non-correlated scenarios. As expected, MOS of both video-QoE and game-QoE decreased with increasing PLR conditions for all games. Regarding the video-QoE, FIFA was the least affected by the growing PLR, never falling below a MOS of 2 in either correlated or non-correlated scenarios. In both PLR scenarios, the video-QoEs of the CSGO and GTA were nearly identical. This could be explained by FIFA’s low level of complexity. Since it had the lowest TI and SI, it has the lowest amount of details per frame and was least influenced by PLR. Due to the broadcast camera angle and the video’s slow pace, the Parsec platform’s packet loss correction algorithm could re-transmit critical data in bit-stream to recover faster, giving it a better QoE score [
40]. On the other hand, CSGO was viewed from a First-Person point of view, resulting in faster motion in frames and it being highly affected by packet loss. Since GTA had the highest video quality of all the games, it was also particularly susceptible to poor video-QoE for increasing PLR.
More importantly, the subjective results, demonstrated in
Figure 6, showed how video-QoE and game-QoE were affected differently by correlated and non-correlated scenarios. In a non-correlated “Delay–Loss” QoS scenario, the impact on Video-QoE was greater than in a correlated situation. This could be due to the variations in PLR implementation. NetEm dropped packets at a steady rate in non-correlated conditions, causing all video frames to be affected. As a result, the viewer routinely gave it lower ratings. In correlated conditions, on the other hand, the bursty nature of real-world Internet packet loss was apparent, with regions of high loss and regions of low loss. This caused some portions of the game to have very high video quality, whereas other parts had extremely low video quality. The average evaluation from human subjects showed that people preferred the second scenario over continually poor video quality.
However, game-QoE behaved exactly the opposite of video-QoE. The game-QoE was more affected by correlated QoS conditions than non-correlated conditions. This was an interesting finding, as multiple other studies have demonstrated that game-QoE and video-QoE are similarly impacted by PLR [
15]. However, all those studies ignored any correlation between Delay and Loss metrics. Upon reviewing the survey responses from gamers, it became understandable why this was the case. The most common reason for this outcome was that because PLR was consistent regardless of delay in non-correlated scenarios, players were able to adapt to the stuttering events in the game caused by PLR. Due to the predictability of the gameplay, players were able to complete the game’s objective despite the subpar quality of the gameplay. In correlated scenarios, however, players struggled to maintain a sense of predictability since, at times, the gameplay was quite smooth and, at other times, it was extremely difficult with quite a few long-stuttering events. This made it difficult to predict what would happen next, resulting in highly difficult game control and extremely poor MOS ratings.
Finally, we could also see the difference between correlated and non-correlated scenarios for both video and game QoE becoming apparent once the PLR > 2% This was understandable, given that the Parsec streaming architecture was highly effective at handling low-level PLR, thereby minimising the potential impact of PLR events and resulting in similar user ratings. However, when the PLR was large, the streaming application’s packet loss recovery had a hard time keeping up, and the difference in the way PLR implemented in correlated and non-correlated scenarios was reflected in the user ratings. This concept is examined in further depth in the objective analysis section.
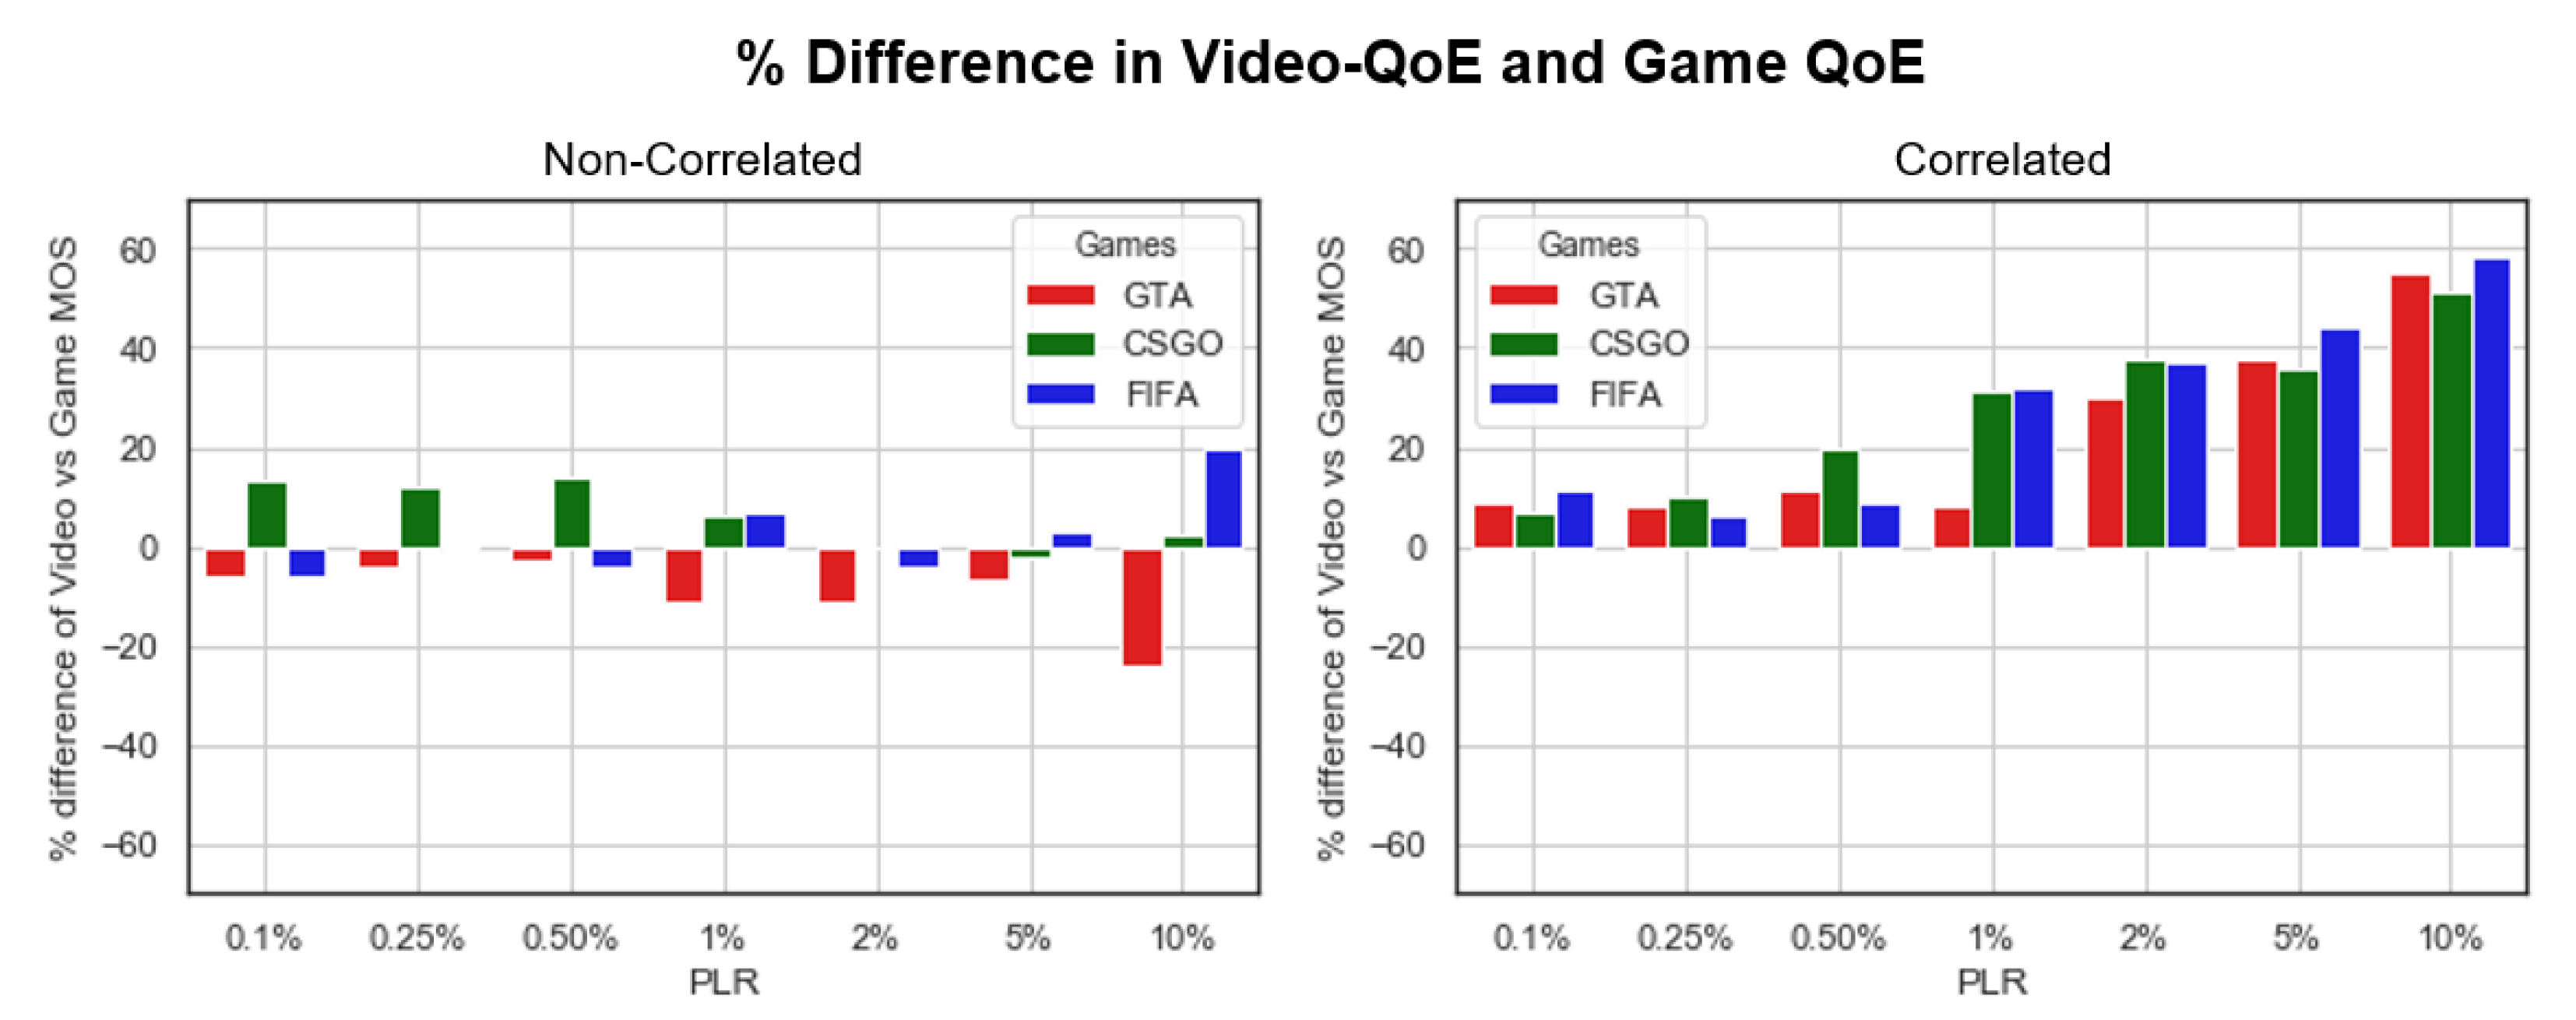
To understand the magnitude of difference between the video-QoE and the game-QoE, we decided to plot the percentage differences between the video-QoQ and game-QoE under different PLR scenarios, as shown in
Figure 7. It was clear from the figure that video-QoE and game-QoE behaved differently under correlated and non-correlated QoS scenarios. In non-correlated “Delay–Loss” scenario, video-QoE and game-QoE showed very small differences. Only at the 10% PLR scenario, did GTA show much higher game-QoE, and FIFA showed much higher video-QoE. Other than that, both video and game QoEs were quite comparable for all three games. However, in the scenario, all of the games showed better video-QoE than game-QoE. The difference was small when PLR was less than 1%. However, as PLR increased to more than 1%, the difference between video and game QoE kept increasing until almost 60%. This was quite a surprising finding, since there were some studies which mentioned how gamers give importance to game-playability more than video. These studies never showed such big differences between them. This result showed how important it is to consider cross-correlated QoS for interactive applications like cloud gaming.
To understand the extent of the difference between video-QoE and game-QoE, we decided to plot the percentage differences between the video-QoE and the game-QoE under different PLR scenarios, as shown in
Figure 7. The graph shows that video-QoE and game-QoE reacted differently under correlated and non-correlated QoS scenarios. In non-correlated “Delay–Loss” scenarios, the differences between video-QoE and game-QoE were minimal. Only in the 10% PLR scenario did GTA exhibit a significantly higher game-QoE and FIFA a significantly higher video-QoE. Aside from this, the video and game quality of experience for all three games were comparable. In correlated scenarios, however, the video-QoE was always higher than the game-QoE for every game. When PLR was less than 1%, the difference was minimal. However, as PLR increased by more than 1%, the disparity between video and gaming QoE continued to grow until it reached about 60%. This was a somewhat an unexpected finding. Even though there are studies [
25] that have indicated that gamers place a greater emphasis on game-playability than on video, they never demonstrated such a large gap between the two QoEs. This research illustrates the significance of cross-correlation in interactive applications such as cloud gaming.
6. Objective QoE Evaluation of Cloud Gaming
To have a better understanding on the results obtained from the subjective experiments it was decided to carry out Full-Reference (FR) objective QoE metrics on the gaming videos. The FR technique refers to the video quality assessment (VQA) requiring full information to carry out the analysis. In our case, this meant utilising server-side video as the original source and client-side video as the source for the distorted video. Both videos were captured with the same 1080p resolution, 60 frames per second frame rate, and H264 encoding of the Parsec platform used to stream them.
6.1. FR Objective QoE Metrics
This study employed three well-known FR metrics: Structural Similarity Index (SSIM), Peak Signal-to-Noise Ratio (PSNR), and Video Multi-method Assessment Fusion (VMAF) (VMAF). SSIM analyses the similarity between the original and distorted images by comparing them. It employs contrast, luminance, and structure to identify the similarities. SSIM is scored between 0 and 1, with 0 indicating no similarity and 1 indicating complete similarity between the images. PSNR uses the ratio of the signal to the distorted power of the noise between two images (one original, one distorted) and gives a rating measured in dB. According to the authors in [
41] PSNR above 37 is regarded as good quality. However, the authors in [
42] claimed that having PSNR of more than 20 was regarded as good for online video streaming videos. Finally, VMAF is an open source metric developed by Netflix [
43] that utilises a combination of various metrics and machine learning algorithm that has been pre-trained on other videos. It assigns a score between 0 and 100, with 0 being the lowest quality and 100 representing the highest.
6.2. Correlation of FR and NR Metrics with Subjective QoE
Next, Pearson Correlation Coefficient (PCC) and Spearmans’ Rank Correlation Coefficient (SCC) values were determined for all three FR measures versus the subjective QoEs obtained in the preceding section. PCC measures the linear relationship between two variables on a scale from −1 to 1, with 0 indicating no correlation and 1 indicating a perfect positive linear relationship. However, PCC cannot show good relationships for variables which are non-linear. SCC, on the other hand, can indicate a nonlinear relationship between two variables. Similar to PCC, this also gives a value from −1 to +1. It can determine the relationship between two variables, whether they are continuous or ordinal (like ACR). The findings of PCC and SCC in both correlated and non-correlated cases are summarised in
Table 2. The
p values for the Pearson correlation were not included in the table as they were all less than 0.05, indicating that the correlation coefficient
r was statistically significant.
In the majority of cases, SSIM and PSNR exhibited a greater correlation coefficient with SCC than PCC, as shown in
Table 2. Both SSIM and PSNR are non-linear FR measurements; therefore, this was to be expected. VMAF, ranging from 0 to 100, exhibited greater coefficient values with PCC than with SCC. This again was expected, since VMAF rating was developed to represent user experience in a linear scale.
Secondly, the VMAF performed the best among all FR metrics across all three games. It was also the most consistent of the three, which was understandable, considering that it was designed primarily to evaluate the human perspective of online streaming videos. SSIM and PSNR were primarily developed to determine image quality, not user experience. So, in some cases, such as non-correlated FIFA and CSGO scenarios, it was able to perform well. In other circumstances, though, it was incapable of representing the human perspective of the game experience.
Finally, all three FR metrics performed worse in correlated “Delay–Loss” scenarios compared to non-correlated scenarios. Only VMAF was able to show some level of consistency in the correlated scenario. Despite being a full-reference VQA metric, its performance was still inadequate in determining user QoE with a high level of accuracy. This showed how the VMAF was developed and trained in non-correlated QoS scenarios. SSIM was able to achieve some level of consistency with slower-paced games, but was extremely poor with the fast-paced GTA. PSNR was the worst out of all three FR metrics showing very inconsistent results, especially with FIFA and GTA games. This again showed the weaknesses of the existing VQA metrics in predicting the human user QoE, especially for cloud gaming scenarios, with the cross-correlated nature of the real internet.
Now, the issue with online applications is that often FR metrics are not a very useful method for QoE analysis. This is because it is difficult to obtain both server-side and client-side videos, let alone ensure the frames of the videos are in sync to carry out the FR metrics mentioned above. As a result, No-Reference (NR) metrics are becoming more and more popular among the industry and academics. Quite a few such NR metrics have developed, such as the Blind/Referenceless Image Spatial Quality Evaluator (BRISQUE) and the Natural Image Quality Evaluator (NIQE).
However, in our previous work [
15,
44], we showed how these NR metrics were unable to perform consistently for cloud gaming in a non-correlated QoS setting. In that work, we proposed an alternative NR model, that made use of a fusion of perceptual hash (pHash) and SSIM, to identify duplicated packets. We chose to utilise duplicated packets because, first, they can be retrieved from client-side video alone, without the necessity for server-side video, and, secondly, the number of duplicated packets is highly correlated with PLR in cloud gaming. The use of duplicated packets showed better results than the existing NR models in non-correlated settings in the previous work.
We also found how the P-Hash-SSIM (PHS) models, PCC and SCC, as shown in
Table 2. Since the number of duplicated packets increases as the MOS goes down, the correlation coefficient obtained is negative. Similar to our prior studies, PHS performed exceptionally well in non-correlated situations. However, it was not as successful for correlated network parameter settings. Nonetheless, it outperformed VMAF in non-correlated cases and was comparable in correlated ones. Despite the fact that this is still an NR metric, as opposed to the other three, the results of this model were impressive, and it would be more time efficient and require less computational power, since it only requires client-side game footage for evaluation.
6.3. Stutterting Events for Correlated vs. Non-Correlated Scenarios
Based on the subjective analysis feedback, we found that one of the main reasons for the difference in video and game QoEs was stuttering events and input lag. There are instances in games where, because of high PLR and latency, the streaming platform cannot keep up and broadcasts the same frame for a period of time in order to clear the buffer of corrupted packets and catch up with the live streaming. These cause the gameplay to stutter, lowering the overall quality of the experience. However, the video itself does not lose much clarity because the streaming platform does not display distorted frames, but rather keeps showing the same frame for a period of time. Participants said that when the key input had too much lag, due to high network latency and low PLR, the video quality was not affected, but the game was harder to play because of input lag. Participants rated lower game QoE compared to video QoE when the input had too much lag due to high network latency but had a low PLR. This was because high latency made it harder to react to a game scenario but did not affect the video quality.
Keeping the feedback in mind, it was decided to look at the number of duplicated packets in more detail. We decided to use the number of duplicated packets to find two types of stutter events. One was a short stutter, while the other was a long stutter. A short stutter event is one where the game stutters for 0.2 to 0.3 s, and a long stutter is one where the game is stuck for more than 0.3 s. The reason to look at short events is that, according to studies done in [
45], most professional gamers have reaction times less than 0.3 s and would, therefore, suffer in these kinds of events. These events can also point out situations where the recreational player would feel the game to be difficult to play and less smooth than ideal. The long stutter events give an idea of the situations where controlling the gameplay starts to become unplayable.
Since the games were streamed at 60 frames per second, having 12 to 18 consecutive duplicated frames would give us the short stutter events. More than 18 consecutive duplicated frames would mean the stuttering event was a long one. We used the average number of duplicated packets for each game to find the frequency of stutter events for all of the games in both correlated and non-correlated QoS scenarios, as shown in
Table 3.
Table 3 only shows the average stuttering events for PLRs of 2% and above, as there were no stuttering events of at least 0.2 s for lower PLR scenarios. In most circumstances, the frequency of short and long stuttering events was greater in correlated scenarios than in non-correlated ones. This applied to each of the three games. This supported the results of the subjective assessment, in which the participants experienced parts of extremely smooth gameplay and parts of extremely tough gameplay due to stutter events in correlated scenarios. This demonstrated how packets were lost during bursts in correlated QoS metric networks, resulting in more frequent stuttering events, and affecting the game QoE more than in non-correlated scenarios.
7. Conclusions and Future Works
This research provides a novel technique to deal with challenges posed by limitation of network emulators. We modified a popular network emulator to replicate real network operations more precisely and analysed how it affected end-user QoEs, both subjectively and objectively, for interactive cloud-gaming applications. We utilised real-life internet data to build empirical distributions and to analyse cross-correlations across network metrics to solve NetEm’s lack of accurate waiting-time distributions and correlated QoS parameters.
Next, subjective QoE evaluation for upcoming cloud gaming apps was used to compare correlated ’Delay–Loss’ with the default non-correlated NetEm setup. Human test subjects showed that correlated, versus non-correlated, QoS indicators affected cloud gaming QoEs differently. Video-QoE and game-QoE did not differ considerably in a non-correlated scenario. In correlated-QoS, human users interpreted video and game QoEs differently and we observed game-QoE as being more influenced by network degradation than video-QoE.
To confirm our subjective QoE analysis findings, we analysed the experiment’s video objectively. We assessed how well Full-Reference (FR) VQA measures represented subjective QoE. Non-correlated QoS demonstrated a stronger correlation between FR QoE metrics and subjective MOS than correlated QoS scenarios. We also saw how taking packet duplication into consideration could be used to model a NR metric that ccould predict the user QoE with as much accuracy as FR VMAF metric. Finally, we found that correlated scenarios had more stuttering than non-correlated scenarios, which made the quality of the game experience (QoE) worse.
It is evident from both the subjective and objective QoE analysis of cloud-gaming applications that it is important to take correlated QoS network condition into account when modelling for QoS to QoE metrics. Subjective analysis clearly showed how video and game QoE vastly differ in correlated versus non-correlated scenarios. The existing objective metrics are geared towards analysing the video QoE generally, and would be unable to correctly identify situations where a user experienced a bad game-QoE, even though the video-QoE was satisfactory. This could lead service providers to incorrect conclusions regarding the level of end-user satisfaction based on QoS information.
In the future, we intend to explore significant quality indicators that could be utilised to more accurately estimate the game-QoE in a correlated QoS situation. Additionally, we need to collect more user-rating data, as the data used in this study was still limited in quantity. This should enable us to extend our investigation in order to derive mathematical correlations between various QoS parameters and game-specific KQIs in order to model the QoS–QoE metric for cloud-gaming applications. In addition, we also plan to investigate whether the effect of correlated Delay and PLR on other interactive applications, such as online interactive classrooms, is comparable to what we observed in this study.


