
Performance Assessment and Comparison of Deployment Options for 5G Millimeter Wave Systems


Abstract
:1. Introduction
2. System Model
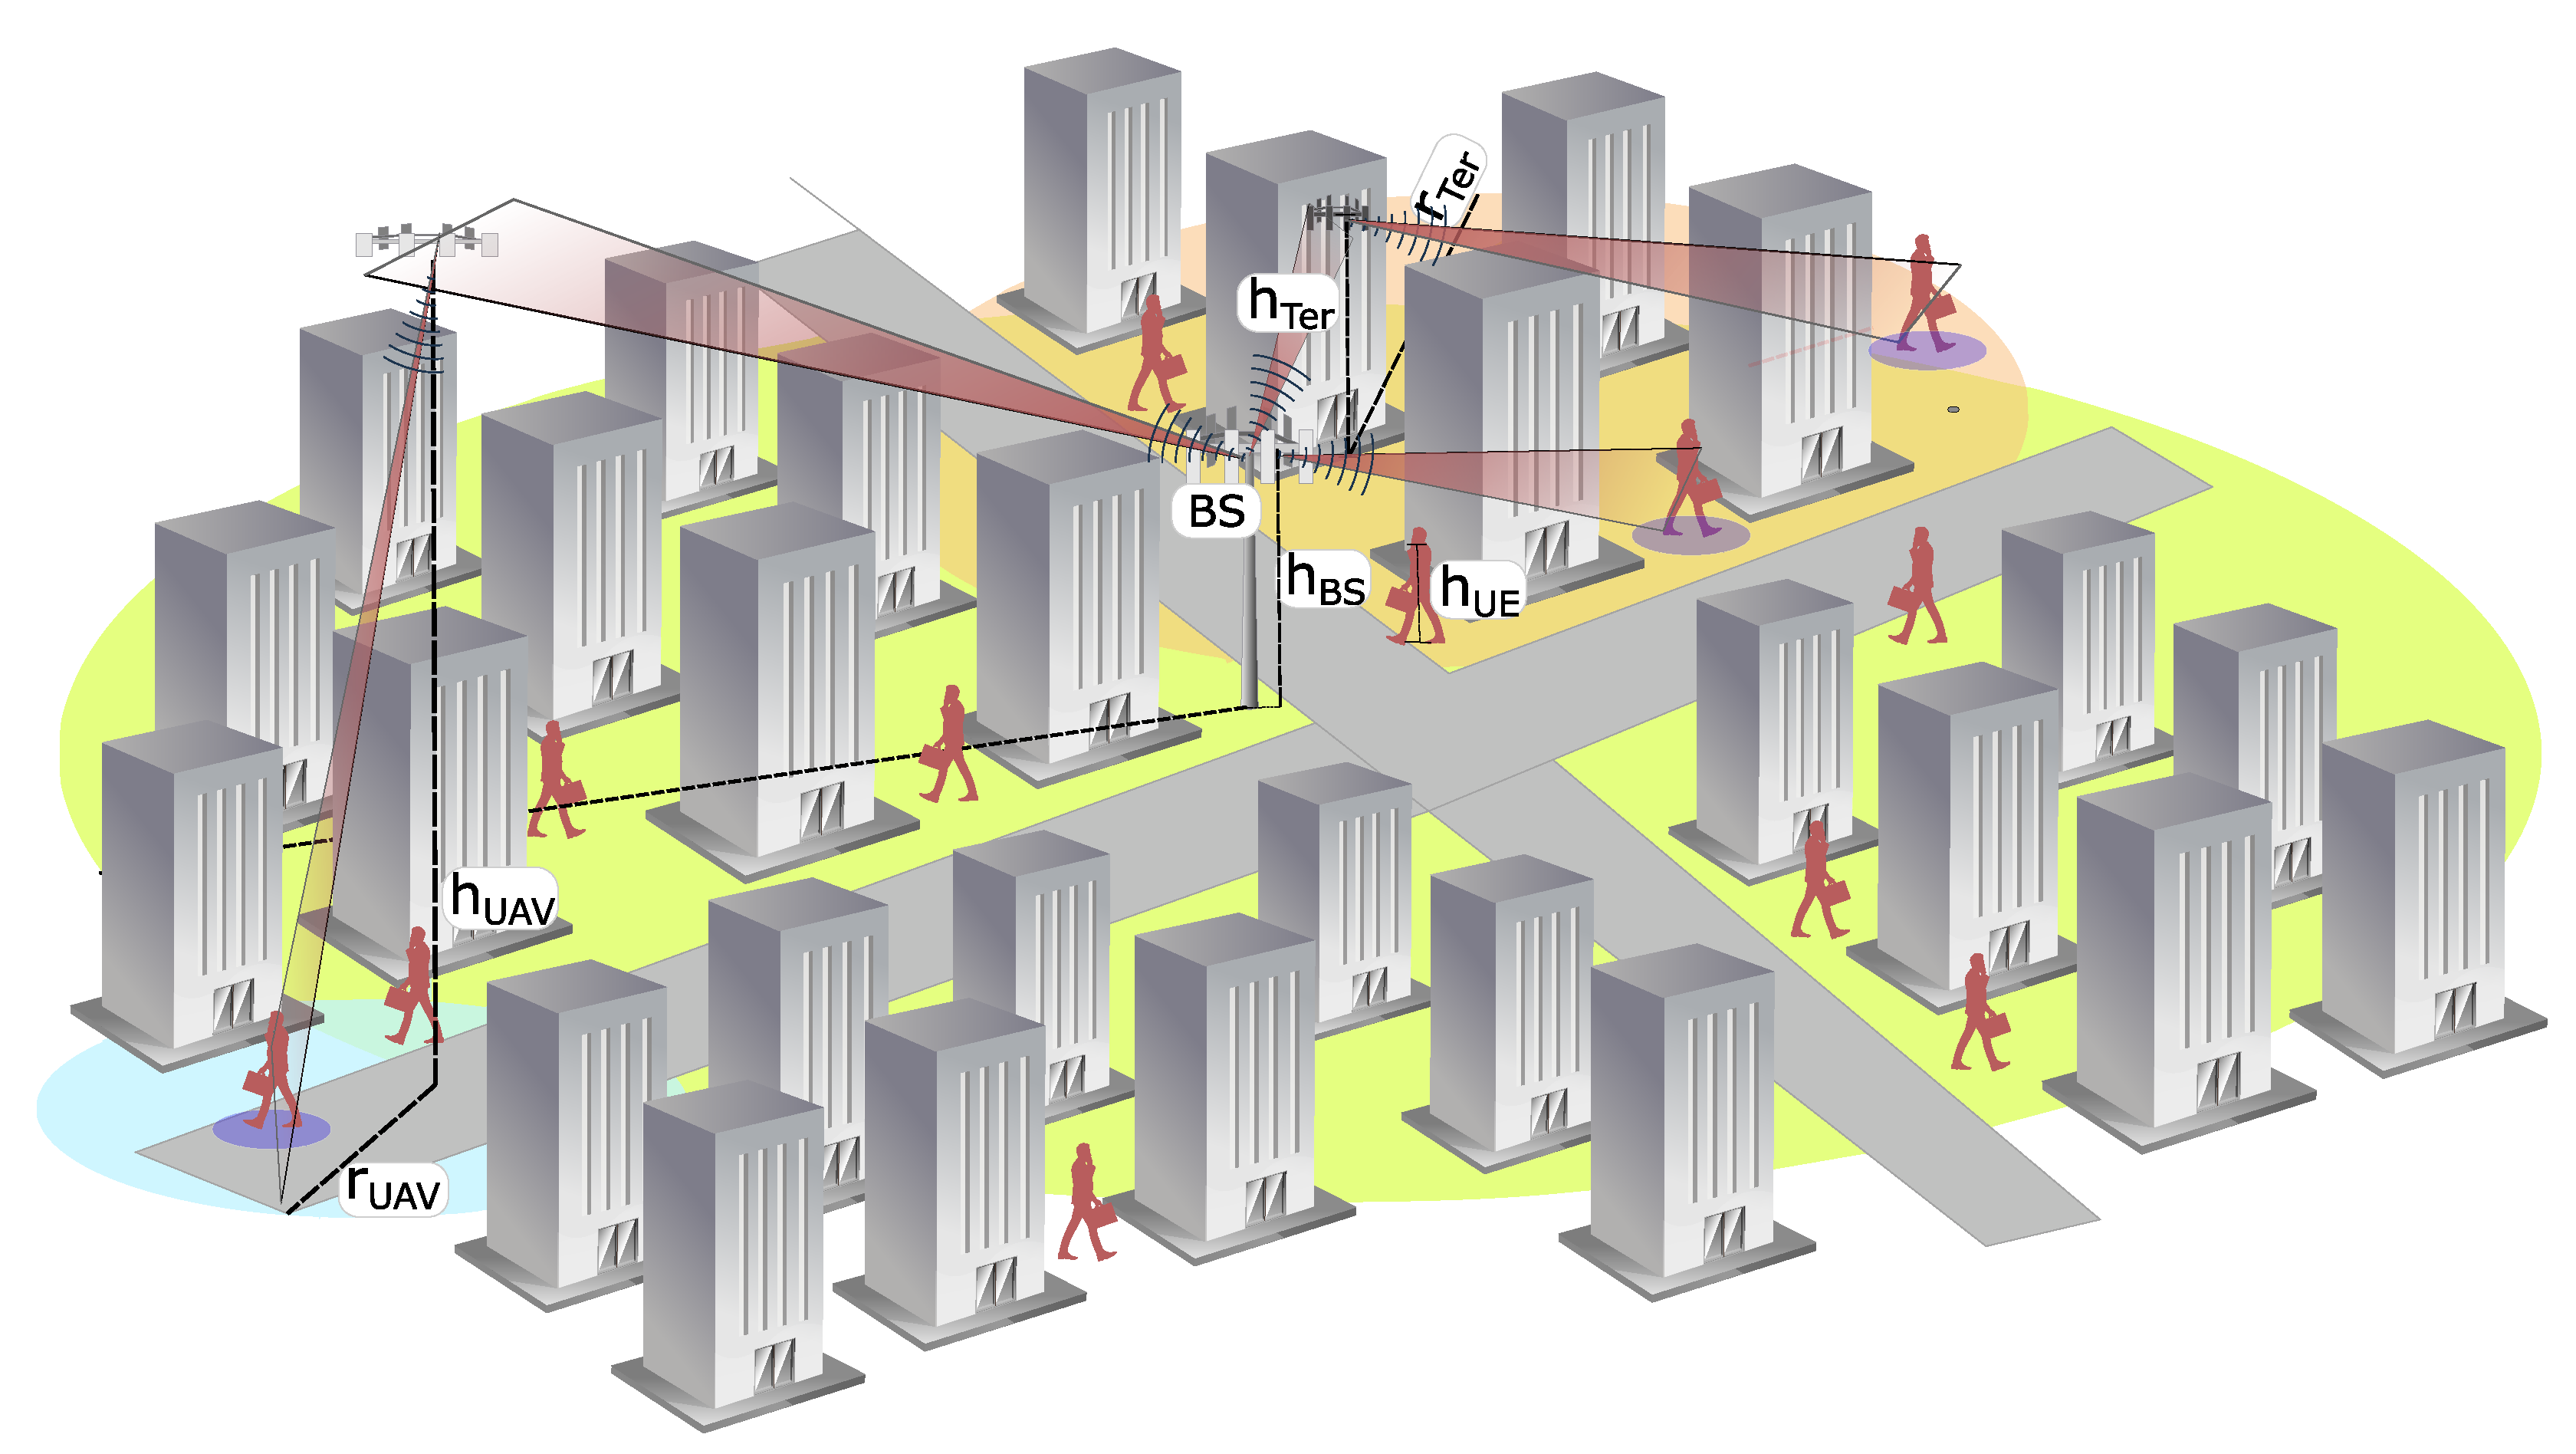
2.1. Deployment
2.2. Blockage Models
2.3. Metrics of Interest
3. Analytical Model
4. Numerical Results
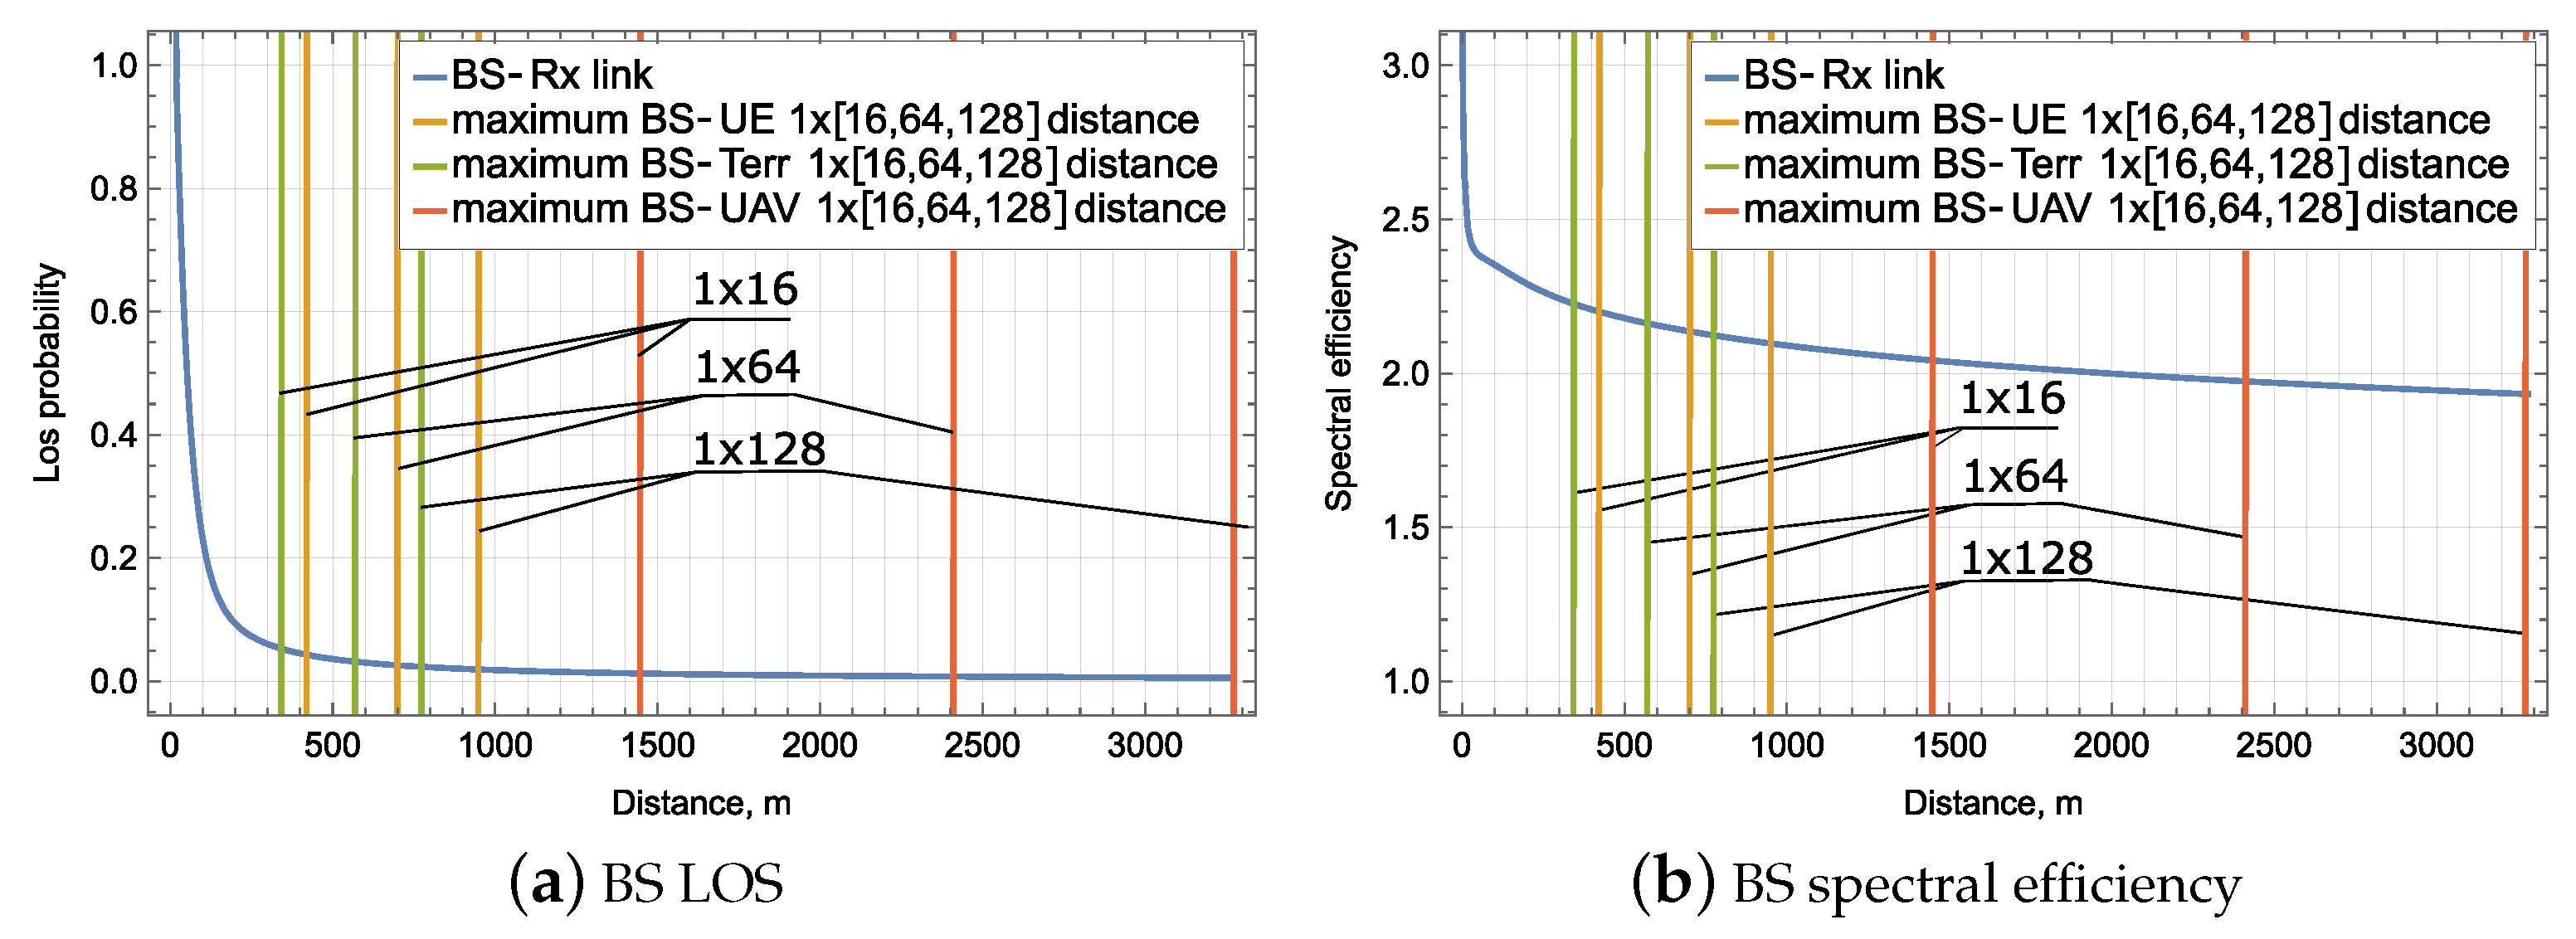
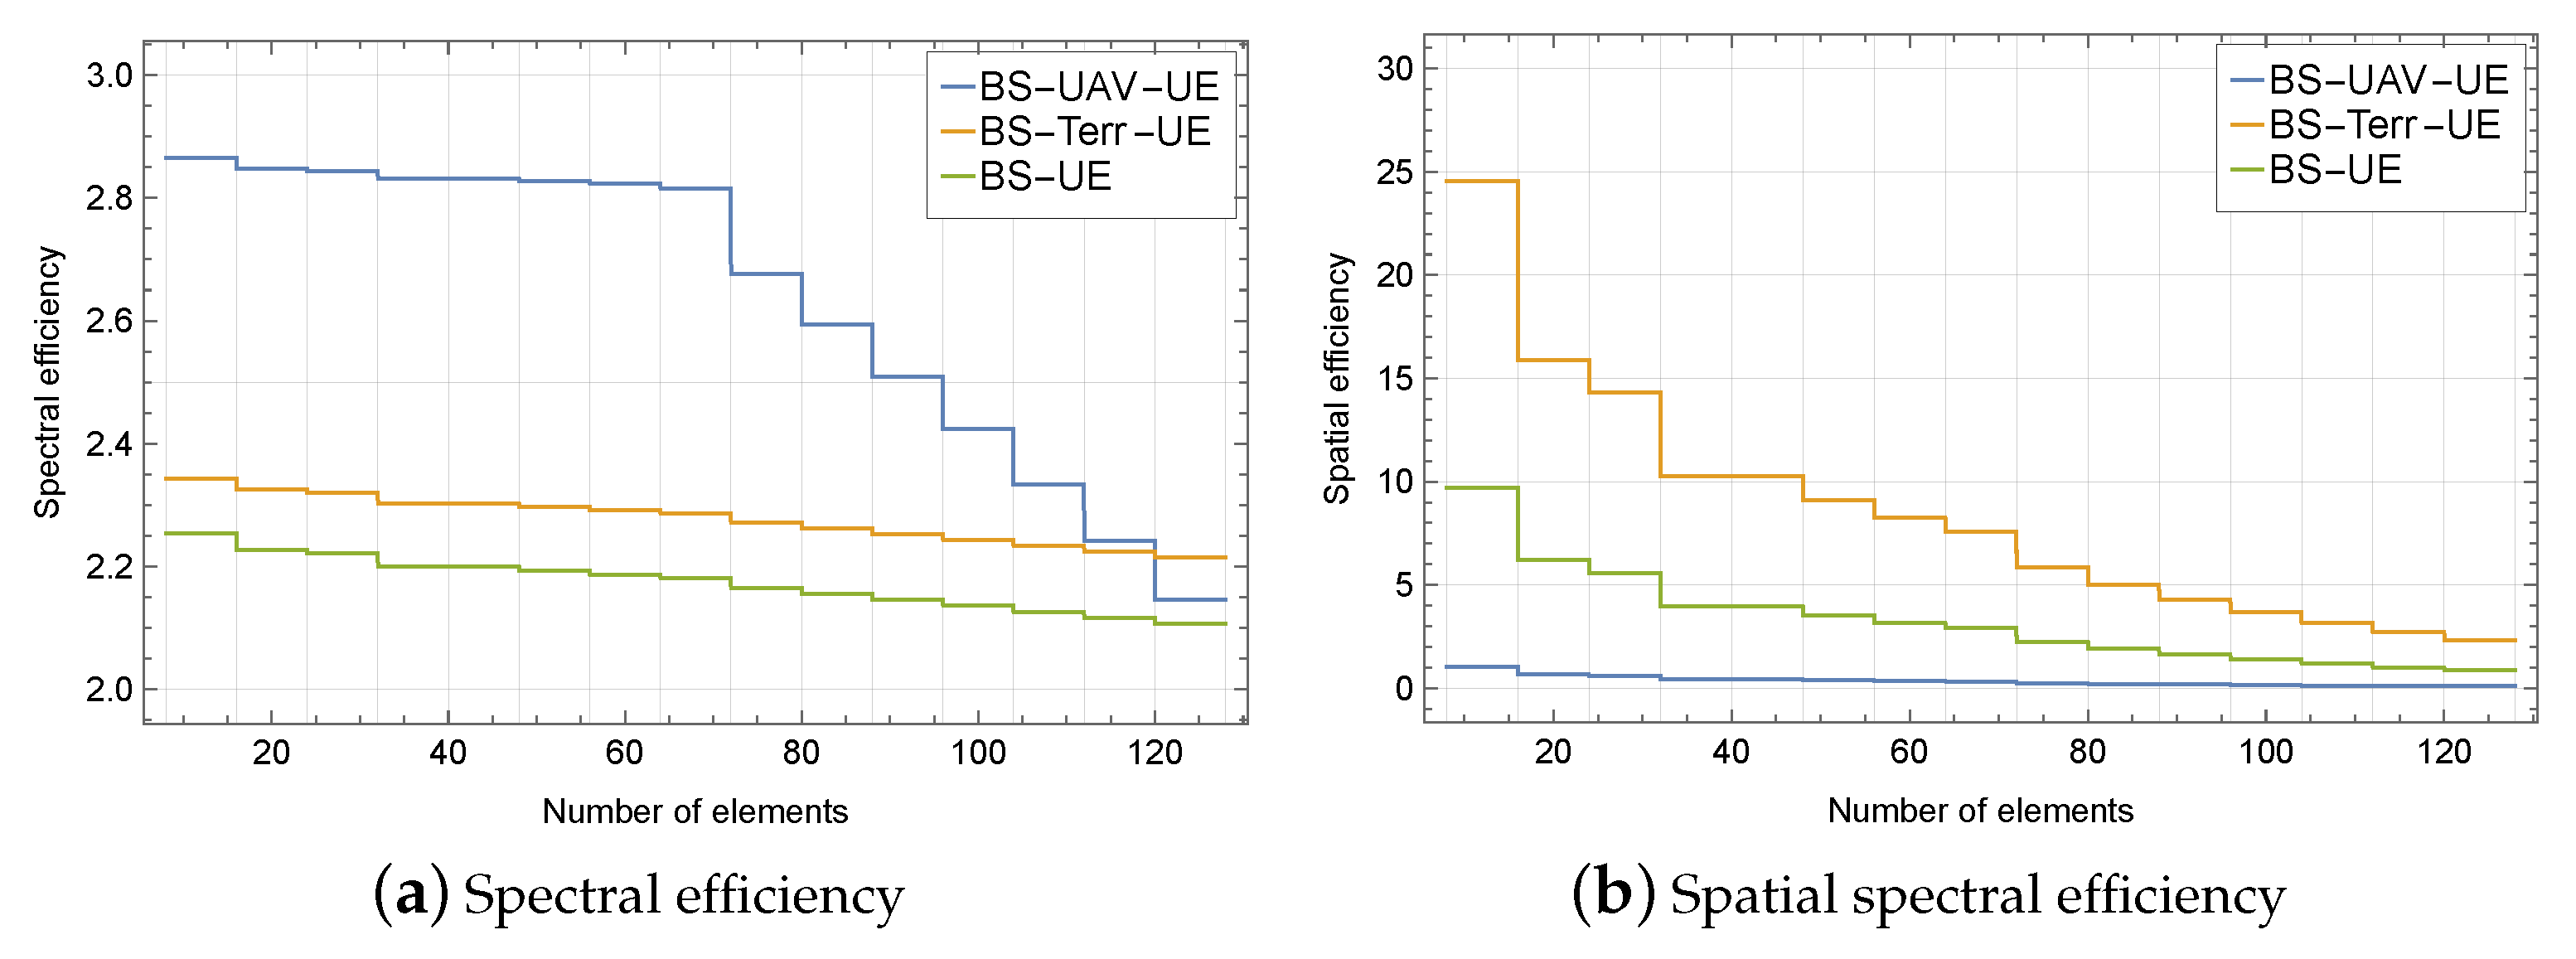
4.1. Spectral Efficiency
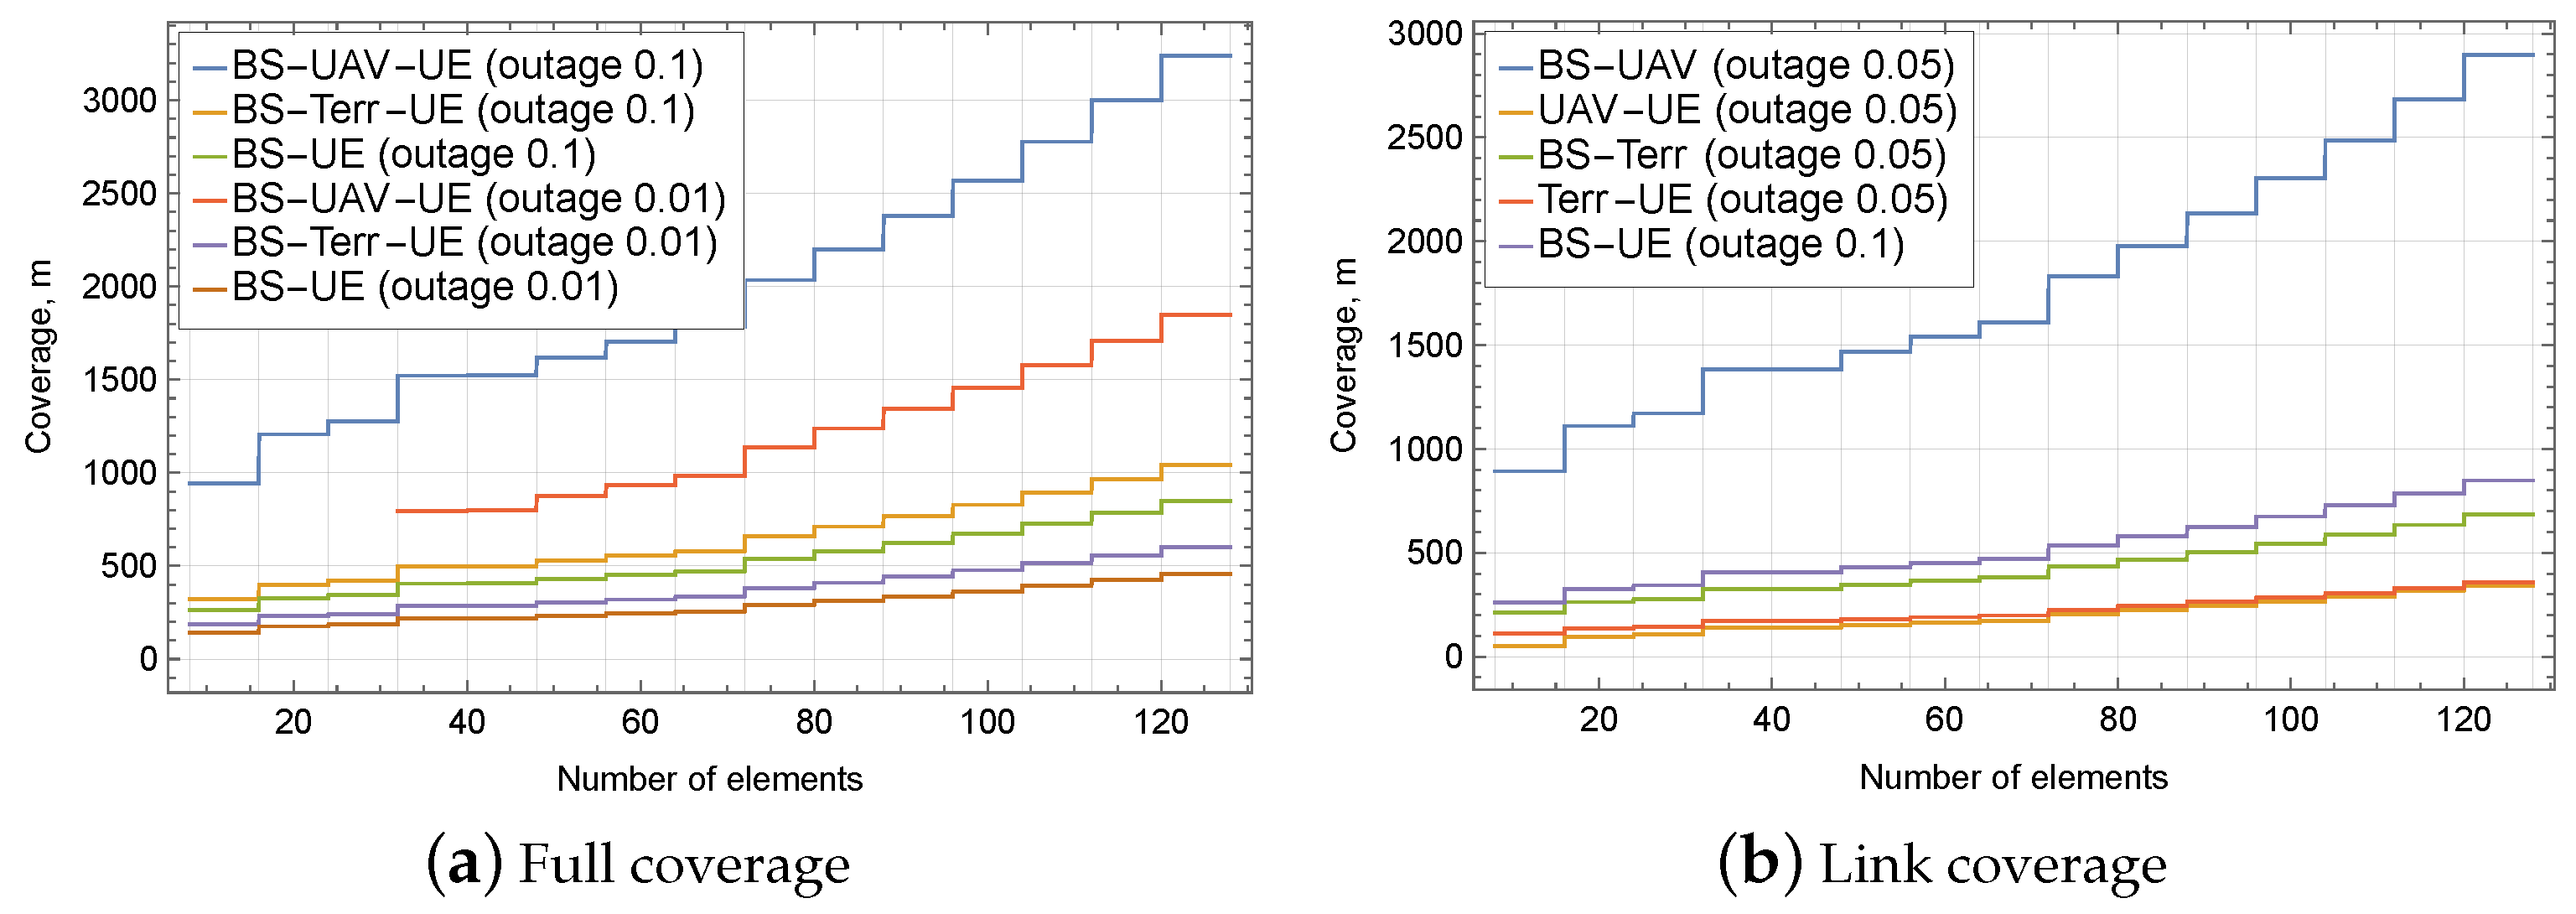
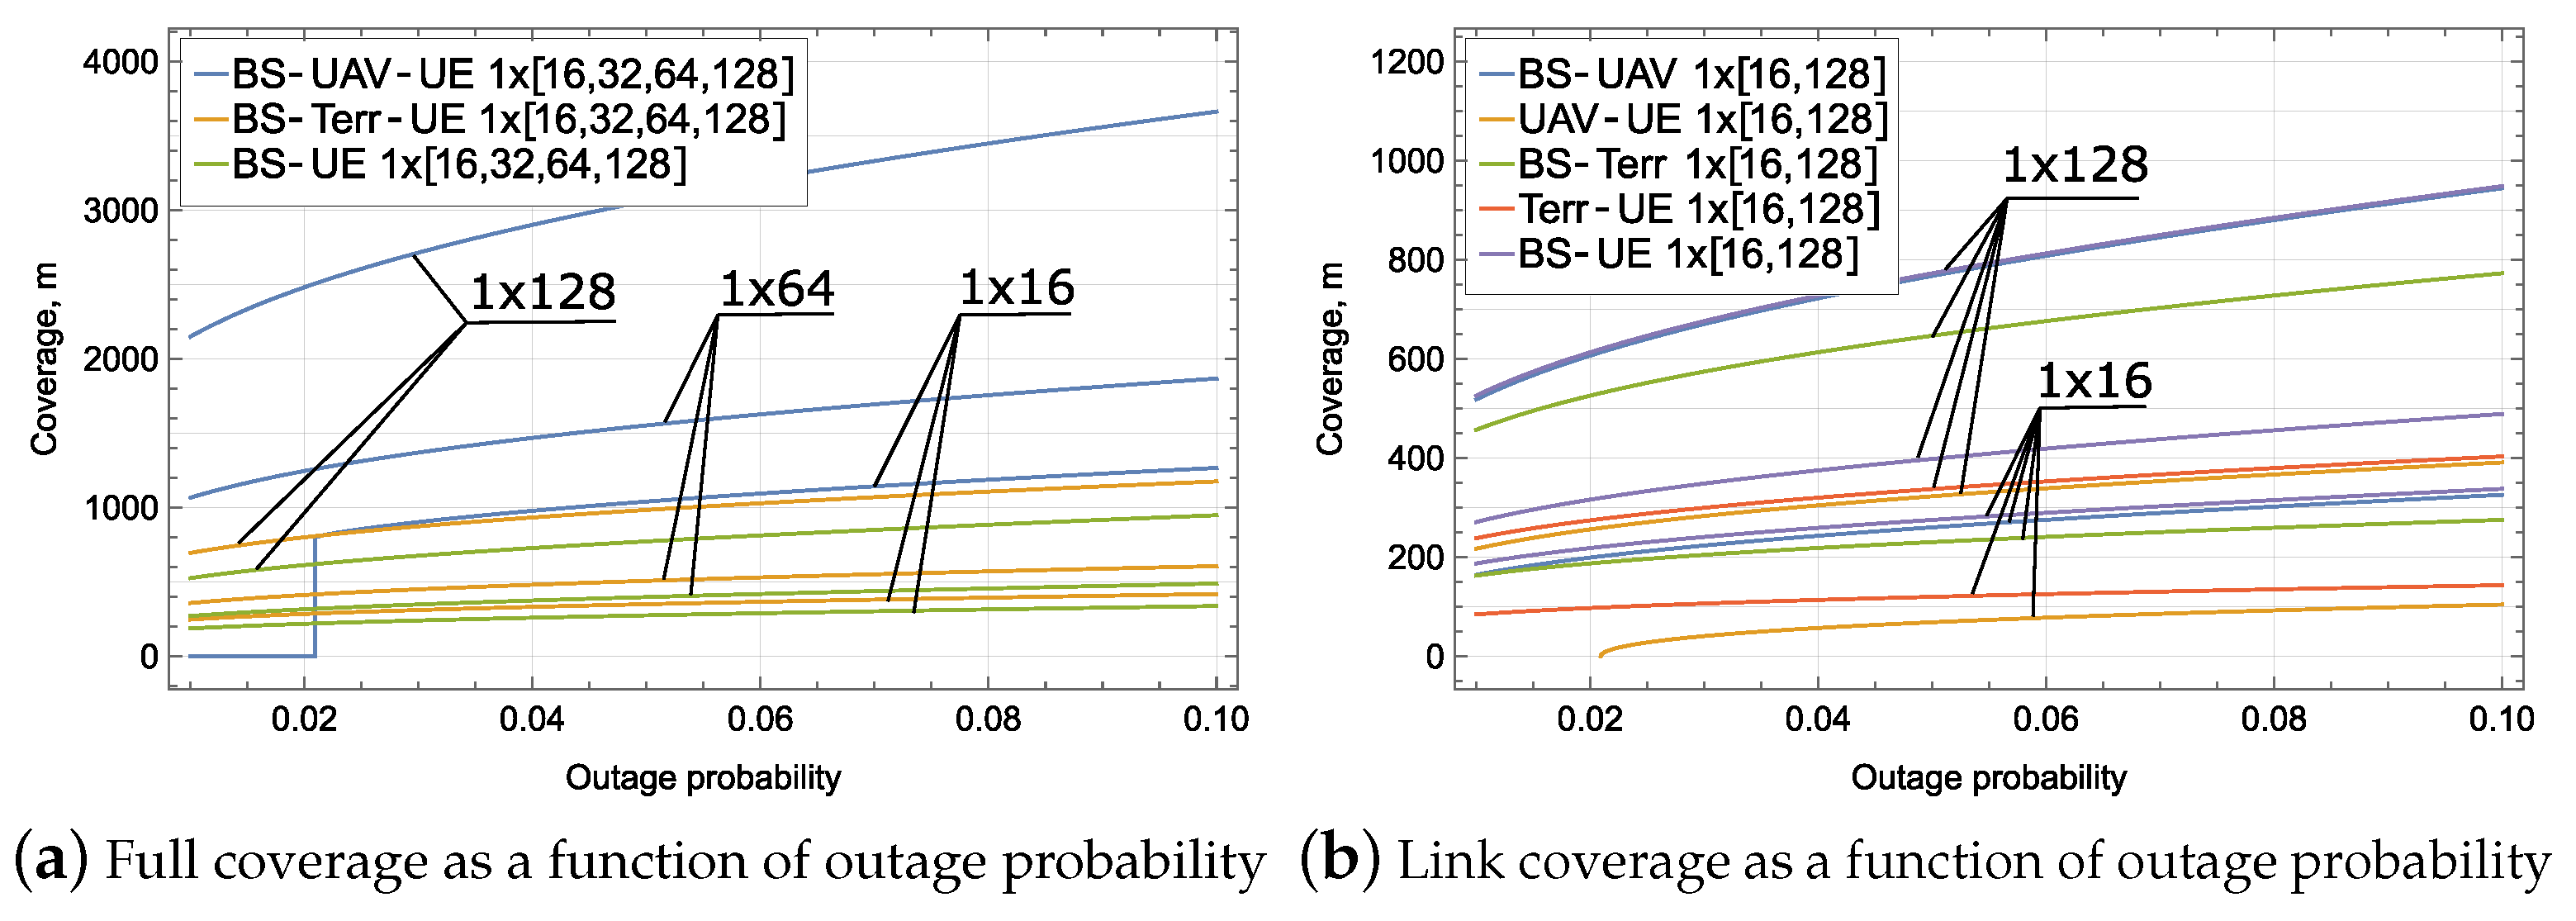
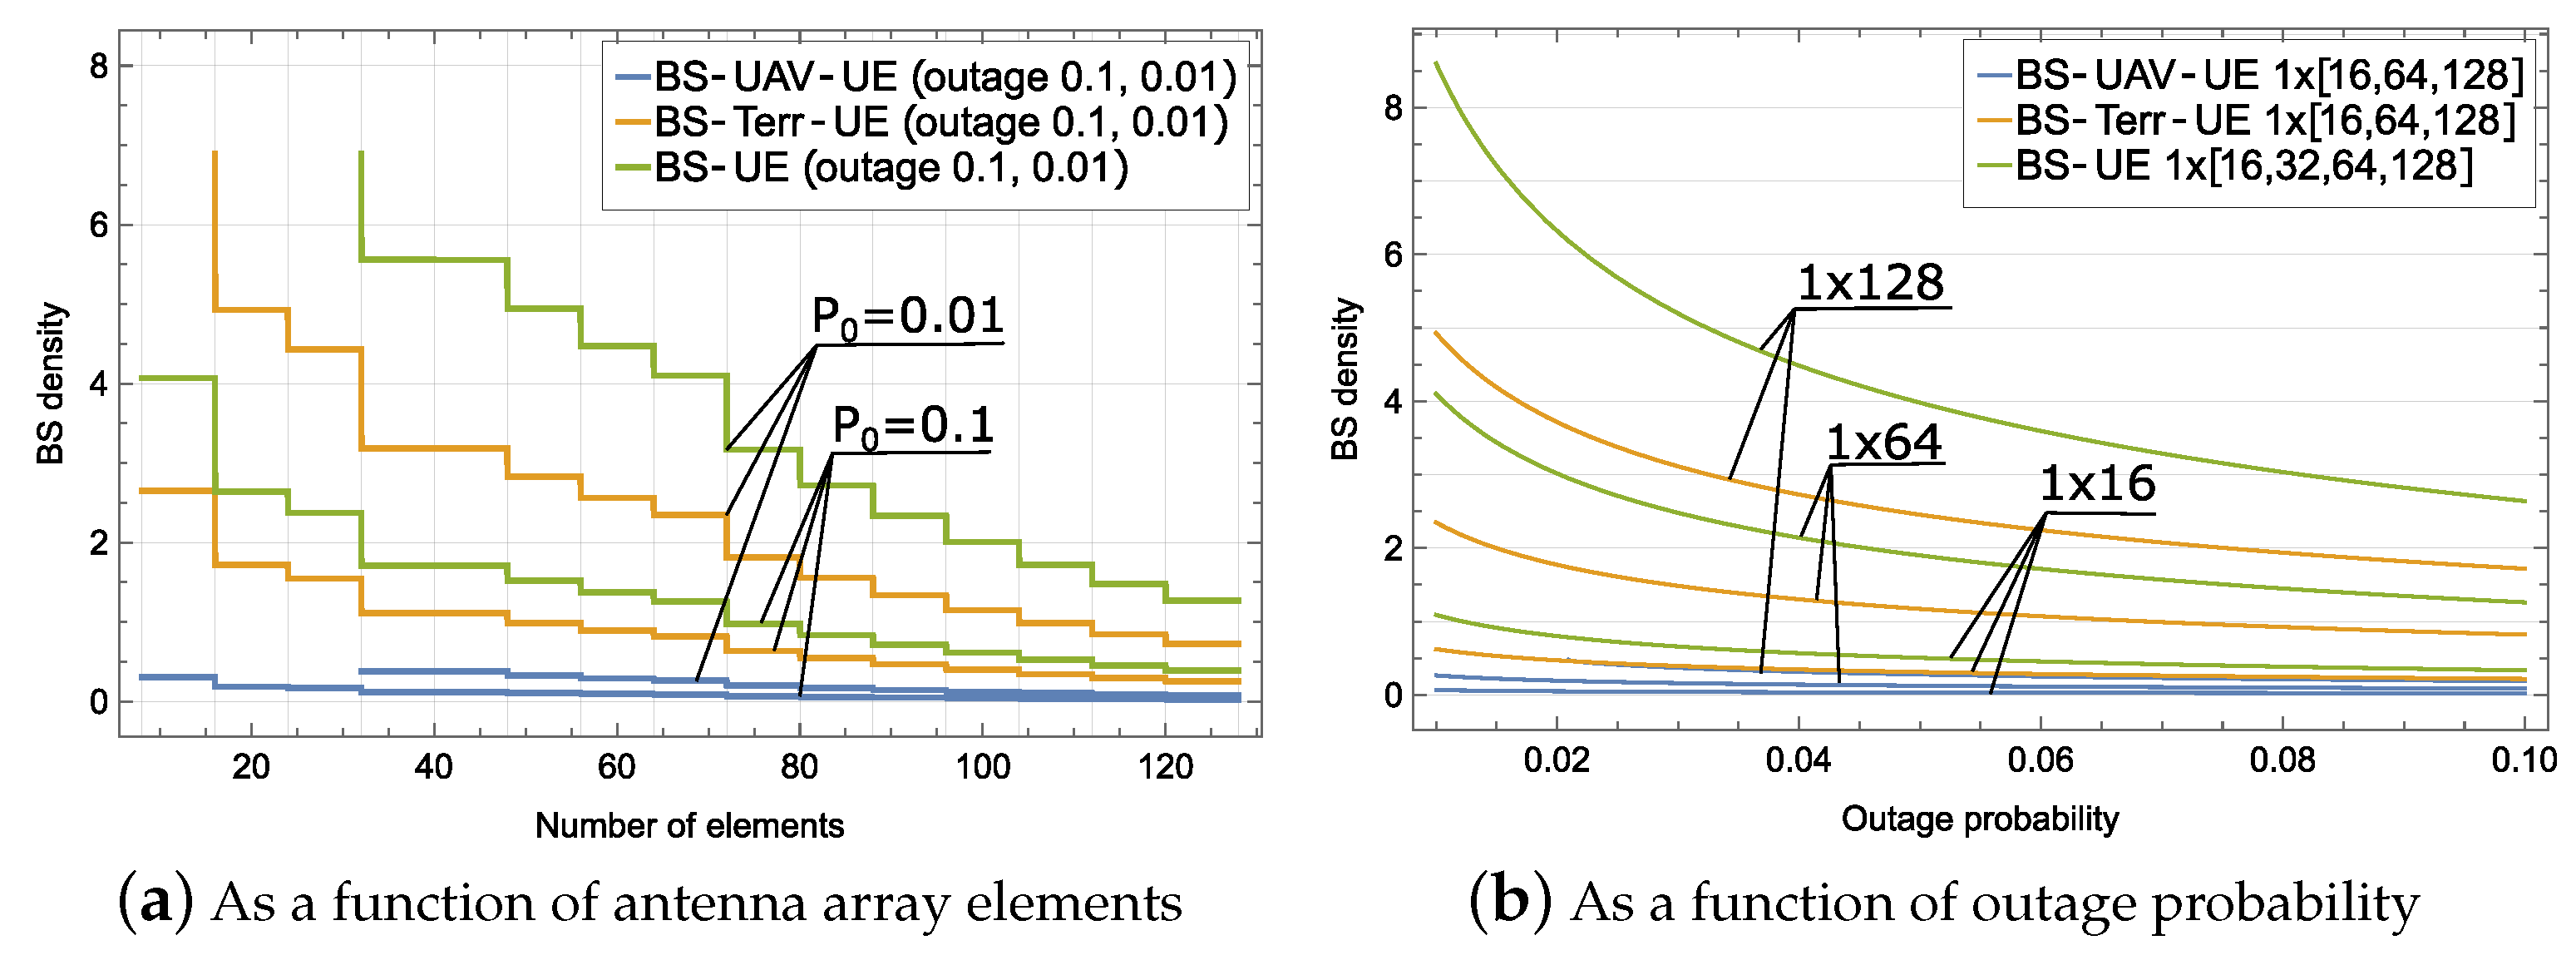
4.2. Coverage Metrics
5. Conclusions
Author Contributions
Funding
Institutional Review Board Statement
Informed Consent Statement
Data Availability Statement
Conflicts of Interest
Abbreviations
| 5G | Fifth-Generation |
| NR | New Radio |
| CAPEX | Capital Expenditures |
| OPEX | Operational Expenditures |
| IMT | International Mobile Telecommunications |
| MIMO | Multiple-Input and Multiple-Output |
| IAB | Integrated Access and Backhaul |
| BS | Base Station |
| UAV | Unmanned Aerial Vehicle |
| UE | User Equipment |
| Terr | Terrestrial re-translator |
| SNR | Signal-to-Noise Ratio |
| UMa | Urban Macro Cell |
| UMi | Urban Micro Cell |
| RMa | Rural Macro Cell |
| Tx | Transmitter |
| Rx | Receiver |
| LoS | Line-of-Sight |
| NLoS | Non-Line-of-Sight |
| SCM | Shannon’s Capacity Margin |
| MCS | Modulation and Coding Scheme |
References
- Narayanan, A.; Rochman, M.I.; Hassan, A.; Firmansyah, B.S.; Sathya, V.; Ghosh, M.; Qian, F.; Zhang, Z.L. A Comparative Measurement Study of Commercial 5G mmWave Deployments. In Proceedings of the IEEE INFOCOM 2022—IEEE Conference on Computer Communications, London, UK, 2–5 May 2022; pp. 800–809. [Google Scholar] [CrossRef]
- Dahlman, E.; Parkvall, S.; Skold, J. 5G NR: The Next Generation Wireless Access Technology, 1st ed.; Academic Press, Inc.: Cambridge, MA, USA, 2018. [Google Scholar]
- Li, X.; Huang, M.; Liu, Y.; Menon, V.G.; Paul, A.; Ding, Z. I/Q Imbalance Aware Nonlinear Wireless-Powered Relaying of B5G Networks: Security and Reliability Analysis. IEEE Trans. Netw. Sci. Eng. 2021, 8, 2995–3008. [Google Scholar] [CrossRef]
- ITU. Rec. ITU-R P. 525–3 Calculation of Free-Space Attenuation ITU-R Recommendation; P Series ITU; ITU: Geneva, Switzerland, 2016. [Google Scholar]
- ITU. Rec. ITU-R P.1411-6 Propagation Data and Prediction Methods for the Planning of Short-Range Outdoor Radiocommunication Systems and Radio Local Area Networks in the Frequency Range 300 MHz to 100 GHz; P Series ITU; ITU: Geneva, Switzerland, 2012. [Google Scholar]
- Gapeyenko, M.; Samuylov, A.; Gerasimenko, M.; Moltchanov, D.; Singh, S.; Akdeniz, M.R.; Aryafar, E.; Himayat, N.; Andreev, S.; Koucheryavy, Y. On the Temporal Effects of Mobile Blockers in Urban Millimeter-Wave Cellular Scenarios. IEEE Trans. Veh. Technol. 2017, 66, 10124–10138. [Google Scholar] [CrossRef] [Green Version]
- Raghavan, V.; Podshivalov, V.; Hulten, J.; Tassoudji, M.A.; Sampath, A.; Koymen, O.H.; Li, J. Spatio-Temporal Impact of Hand and Body Blockage for Millimeter-Wave User Equipment Design at 28 GHz. IEEE Commun. Mag. 2018, 56, 46–52. [Google Scholar] [CrossRef]
- 3GPP. 3rd Generation Partnership Project; Technical Specification Group Radio Access Network; Study on Channel Model for Frequencies from 0.5 to 100 GHz (Release 17). Technical Report, 3GPP TR 38.901 V17.0.0. 2022. Available online: https://www.etsi.org/deliver/etsi_tr/138900_138999/138901/17.00.00_60/tr_138901v170000p.pdf (accessed on 18 December 2022).
- Moltchanov, D.; Gaidamaka, Y.; Ostrikova, D.; Beschastnyi, V.; Koucheryavy, Y.; Samouylov, K. Ergodic Outage and Capacity of Terahertz Systems Under Micromobility and Blockage Impairments. IEEE Trans. Wirel. Commun. 2022, 21, 3024–3039. [Google Scholar] [CrossRef]
- Stepanov, N.; Moltchanov, D.; Begishev, V.; Turlikov, A.; Koucheryavy, Y. Statistical analysis and modeling of user micromobility for THz cellular communications. IEEE Trans. Veh. Technol. 2021, 71, 725–738. [Google Scholar] [CrossRef]
- Madapatha, C.; Makki, B.; Fang, C.; Teyeb, O.; Dahlman, E.; Alouini, M.S.; Svensson, T. On Integrated Access and Backhaul Networks: Current Status and Potentials. IEEE Open J. Commun. Soc. 2020, 1, 1374–1389. [Google Scholar] [CrossRef]
- Zhang, B.; Filippini, I. Mobility-Aware Resource Allocation for mmWave IAB Networks via Multi-Agent RL. In Proceedings of the 2021 IEEE 18th International Conference on Mobile Ad Hoc and Smart Systems (MASS), Denver, CO, USA, 4–7 October 2021; pp. 17–26. [Google Scholar] [CrossRef]
- Sadovaya, Y.; Moltchanov, D.; Mao, W.; Orhan, O.; Yeh, S.p.; Nikopour, H.; Talwar, S.; Andreev, S. Integrated Access and Backhaul in Millimeter-Wave Cellular: Benefits and Challenges. IEEE Commun. Mag. 2022, 60, 81–86. [Google Scholar] [CrossRef]
- ETSI TS 138 401. 5G; NG-RAN; Architecture Description (3GPP TS 38.401 Version 16.3.0 Release 16). Available online: https://www.etsi.org/deliver/etsi_ts/138400_138499/138401/16.03.00_60/ts_138401v160300p.pdf (accessed on 18 December 2022).
- Gapeyenko, M.; Petrov, V.; Moltchanov, D.; Andreev, S.; Himayat, N.; Koucheryavy, Y. Flexible and reliable UAV-assisted backhaul operation in 5G mmWave cellular networks. IEEE J. Sel. Areas Commun. 2018, 36, 2486–2496. [Google Scholar] [CrossRef]
- ETSI TS 138 401. 5G; System Architecture for the 5G System (5GS) (3GPP TS 23.501 Version 17.4.0 Release 17). Available online: https://www.etsi.org/deliver/etsi_ts/123500_123599/123501/17.04.00_60/ts_123501v170400p.pdf (accessed on 18 December 2022).
- Fiore, P.; Moro, E.; Filippini, I.; Capone, A.; Donno, D.D. Boosting 5G mm-Wave IAB Reliability with Reconfigurable Intelligent Surfaces. In Proceedings of the 2022 IEEE Wireless Communications and Networking Conference (WCNC), Austin, TX, USA, 10–13 April 2022; pp. 758–763. [Google Scholar] [CrossRef]
- Fouda, A.; Ibrahim, A.S.; Guvenc, I.; Ghosh, M. Interference Management in UAV-Assisted Integrated Access and Backhaul Cellular Networks. IEEE Access 2019, 7, 104553–104566. [Google Scholar] [CrossRef]
- Lukowa, A.; Venkatasubramanian, V.; Visotsky, E.; Cudak, M. On the Coverage Extension of 5G Millimeter Wave Deployments Using Integrated Access and Backhaul. In Proceedings of the 2020 IEEE 31st Annual International Symposium on Personal, Indoor and Mobile Radio Communications, London, UK, 31 August–3 September 2020; pp. 1–7. [Google Scholar] [CrossRef]
- Sun, S.; Rappaport, T.S.; Shafi, M.; Tang, P.; Zhang, J.; Smith, P.J. Propagation Models and Performance Evaluation for 5G Millimeter-Wave Bands. IEEE Trans. Veh. Technol. 2018, 67, 8422–8439. [Google Scholar] [CrossRef]
- Gapeyenko, M.; Samuylov, A.; Gerasimenko, M.; Moltchanov, D.; Singh, S.; Aryafar, E.; Yeh, S.p.; Himayat, N.; Andreev, S.; Koucheryavy, Y. Analysis of human-body blockage in urban millimeter-wave cellular communications. In Proceedings of the 2016 IEEE International Conference on Communications (ICC), Kuala Lumpur, Malaysia, 22–27 May 2016; pp. 1–7. [Google Scholar] [CrossRef] [Green Version]
- Gapeyenko, M.; Moltchanov, D.; Andreev, S.; Heath, R.W. Line-of-sight probability for mmwave-based UAV communications in 3D urban grid deployments. IEEE Trans. Wirel. Commun. 2021, 20, 6566–6579. [Google Scholar] [CrossRef]
- Begishev, V.; Moltchanov, D.; Gaidamaka, A.; Samouylov, K. Closed-Form UAV LoS Blockage Probability in Mixed Ground-and Rooftop-Mounted Urban mmWave NR Deployments. Sensors 2022, 22, 977. [Google Scholar] [CrossRef] [PubMed]
- Fan, J.; Yin, Q.; Li, G.Y.; Peng, B.; Zhu, X. MCS Selection for Throughput Improvement in Downlink LTE Systems. In Proceedings of the 2011 Proceedings of 20th International Conference on Computer Communications and Networks (ICCCN), Maui, HI, USA, 31 July–4 August 2011; pp. 1–5. [Google Scholar] [CrossRef]


| Coefficient | LoS Value | NLoS Value | Description |
|---|---|---|---|
| 2.1 | 3.19 | Building blockage coefficient | |
| 3.24 | 5.24 | Human blockage coefficient |
| Parameter | Value | Description |
|---|---|---|
| 3.19 | NLoS building blockage coefficient | |
| 2.1 | LoS building blockage coefficient | |
| 5.24 | NLoS human blockage coefficient | |
| 3.24 | LoS human blockage coefficient | |
| f | 28 Ghz | Carrier frequency |
| P | 2 Wt | Transmitted signal power |
| −9.478 dB | Signal-to-noise ratio margin | |
| 3 dB | Shannon capacity margin | |
| 0.1, 0.01 | Outage probability | |
| 2 dB | Cable loss | |
| 7 dB | Noise figure due to UE configuration | |
| 1 km | Base radius | |
| 10 m | eNB height | |
| 10 m | Terrastial re-transmitter height | |
| 1.3 m | User equipment height | |
| 100 m | UAV re-transmitter height | |
| 0.3 units/m | Density of human blockers | |
| 1.7 m | Human blocker height | |
| 0.3 m; | Human blocker radius | |
| 14.58 dB | eNB antenna gain | |
| 14.58 dB | Terrastial re-transmitter gain | |
| 5.57 dB | User equipment antenna gain |
Disclaimer/Publisher’s Note: The statements, opinions and data contained in all publications are solely those of the individual author(s) and contributor(s) and not of MDPI and/or the editor(s). MDPI and/or the editor(s) disclaim responsibility for any injury to people or property resulting from any ideas, methods, instructions or products referred to in the content. |
© 2023 by the authors. Licensee MDPI, Basel, Switzerland. This article is an open access article distributed under the terms and conditions of the Creative Commons Attribution (CC BY) license (https://creativecommons.org/licenses/by/4.0/).
Share and Cite
Mokrov, E.; Samouylov, K. Performance Assessment and Comparison of Deployment Options for 5G Millimeter Wave Systems. Future Internet 2023, 15, 60. https://doi.org/10.3390/fi15020060
Mokrov E, Samouylov K. Performance Assessment and Comparison of Deployment Options for 5G Millimeter Wave Systems. Future Internet. 2023; 15(2):60. https://doi.org/10.3390/fi15020060
Chicago/Turabian StyleMokrov, Evgeni, and Konstantin Samouylov. 2023. "Performance Assessment and Comparison of Deployment Options for 5G Millimeter Wave Systems" Future Internet 15, no. 2: 60. https://doi.org/10.3390/fi15020060