Article

An IoT-Based COVID-19 Prevention and Control System for Enclosed Spaces

1
Department of Computer Science and Technology, Southwest University, Chongqing 402460, China
2
Department of Management Science and Engineering, Southwest University, Chongqing 402460, China
3
Department of Environmental Science, Nanjing University of Information Science and Technology, Nanjing 210044, China
4
University of Chinese Academy of Sciences, Beijing 100049, China
5
Xinjiang Institute of Ecology and Geography, Chinese Academy of Sciences, Urumqi 830011, China
*
Authors to whom correspondence should be addressed.
Future Internet 2022, 14(2), 40; https://doi.org/10.3390/fi14020040
Submission received: 6 January 2022 / Revised: 24 January 2022 / Accepted: 24 January 2022 / Published: 26 January 2022

Abstract

:
To date, the protracted pandemic caused by the severe acute respiratory syndrome coronavirus 2 (SARS-CoV-2) has had widespread ramifications for the economy, politics, public health, etc. Based on the current situation, definitively stopping the spread of the virus is infeasible in many countries. This does not mean that populations should ignore the pandemic; instead, normal life needs to be balanced with disease prevention and control. This paper highlights the use of Internet of Things (IoT) for the prevention and control of coronavirus disease (COVID-19) in enclosed spaces. The proposed booking algorithm is able to control the gathering of crowds in specific regions. K-nearest neighbors (KNN) is utilized for the implementation of a navigation system with a congestion control strategy and global path planning capabilities. Furthermore, a risk assessment model is designed based on a “Sliding Window-Timer” algorithm, providing an infection risk assessment for individuals in potential contact with patients.

1. Introduction

COVID-19 has resulted in a devastating pandemic, which seems uncontrollable in some countries. By December 2021, the total number of COVID-19 cases had exceeded 286 million, and more than 543 thousand people had died. Regardless of the pathogens that cause infectious diseases, the most effective strategies to prevent them are obvious, such as controlling the source of infection, cutting off the route of transmission, and protecting vulnerable people [1]. The prevention and control of infectious diseases, especially COVID-19, is not only a medical problem but is also influenced by politics, culture, the economy, etc. In practice, appropriate and strict prevention and control measures in epidemiology cannot always be conducted in terms of social management [2]. A case in point is the difficulty in promoting the use of vaccines [3]. Some individuals are reluctant to receive the vaccine because they may deem it futile, noxious, troublesome, etc.
SARS-CoV-2 is one of the most infectious viruses, and it has a wide range of transmission routes: respiratory droplets from coughs and sneezes, contact via contaminated objects, aerosols, etc., may cause an infection [4,5]. Some variants of SARS-CoV-2 have a long incubation period, even with asymptomatic infections. The sensitivity of reagents for detecting infections also needs to be improved. Although the various stringent lockdown policies have contributed significantly to COVID-19 prevention and control, some necessary economic and political activities have been hindered, causing a number of other losses, which have had serious consequences for some countries [6]. Nevertheless, ignoring the pandemic also results in numerous casualties [7]. Hence, the authorities are required to prevent and control the pandemic as much as possible without excessively hindering normal life.
In this paper, by “enclosed spaces”, we mainly refer to airless places, such as airport terminals, factory workshops, and shopping malls. Ventilating facilities exist sometimes, but they are not specifically designed for medical use. Compared to open-air areas (plazas, parks, playgrounds, etc.), the risk of infection is much higher in these locations. COVID-19-positive individuals inevitably pollute the air, contaminate the surfaces of objects, and generate aerosols containing virus particles [8]. All these factors make enclosed spaces dangerous during the pandemic period; moreover, these spaces cannot always be made inaccessible for COVID-19 prevention and control.
Many scholars are conducting research on COVID-19 prevention and control at the macro level. Articles exist that evaluate pandemic prevention policies [9,10]; some researchers focus on the use of big data to address COVID-19 macroscopically [11]; some researchers are interested in the application of machine learning, which is considered to significantly contribute to overall COVID-19 prevention and control [12,13], etc. In this paper, we mainly focus on the use of Internet of Things for implementing some pandemic control and prevention guidelines in enclosed spaces. Our main concern is how to implement COVID-19 prevention and control measures in specific places. This is an ineluctable compromise between pandemic handling and normal life.
In many cases, COVID-19-positive individuals are not aware of their illness; they unintentionally act as a virus “broadcaster”. Firstly, restricting social gatherings greatly reduces the probability of virus transmission. A COVID-19-positive individual in a large group of people causes in more infections than in a scattered crowd [14]. Thus, a booking algorithm is specifically contrived, guiding individuals to obtain an official permit before entering a region; users are encouraged to apply to enter an area and stay there for a reasonable period of time. In order to obtain a permit as soon as possible, users ought to consciously abide by pandemic prevention guidelines. In addition, a path-planning algorithm presented thereinafter also seriously considers congestion control [15], i.e., as people attempt to move to an enclosed space, the algorithm provides a navigation service that conducts background congestion control. The congestion control also utilizes the booking algorithm.
Furthermore, it is necessary to prevent COVID-19-positive individuals from entering several locations. If a COVID-19-positive individual idles, a great many virus particles may exist in the places where he passes. A path-planning algorithm accelerated by a Graphics Processing Unit (GPU) is introduced, ensuring that the individual swiftly reaches his destination.
The system tracks users, and related information is sent to the risk assessment model. There is a high risk of infection in an area where a COVID-19-positive individual is located, but after he leaves, this risk will gradually decrease over time. The “Sliding Window-Timer” algorithm is responsible for risk level assessment. If a patient has entered an enclosed space before, other related people will be identified, and an infection risk level is assigned. In addition, the authorities can also obtain an analysis report for subsequent measures.
The fundamental aspect of the system is the indoor navigation service. Considering cost-effectiveness and convenience, Bluetooth Low-Energy (BLE) devices (iBeacon) are selected as hardware support [16,17]. With the received signal strength indication (RSSI)-based indoor positioning algorithm, the tracking of the real-time location of an individual becomes possible. Positioning technology based on the fingerprint database is introduced. Initially, in the offline stage, Bluetooth beacons are deployed; then, the RSSI values of the Bluetooth beacons are collected at reference points; the fingerprint of each reference point is confirmed step by step [18]. In the online positioning stage, the collected signals are transformed into real-time positioning fingerprints, and then the trained model is used to match the fingerprint in the RSSI fingerprint database; the positioning coordinates are determined with the matching results [19,20]. We use KNN as the matching algorithm in the online stage.
In this paper, we first review studies related to COVID-19 and indoor positioning. Then, a booking algorithm is introduced. After this, a means to establish an indoor positioning system is presented, which is the fundamental navigation service, and we also introduce the risk assessment model. By testing these parts, the reliability of the indoor positioning system and the performance of the path planning algorithm are demonstrated. Furthermore, privacy and compliance are considered in depth.
The structure of the system is shown in Figure 1. The first layer illustrates functions from a user or manager’s perspective. The middle layer presents related algorithms and models supporting the functions. The bottom is the hardware layer in which programs run.

2. Related Work

Many scholars are currently conducting research on COVID-19 prevention and control in their research fields. Gandhi, Rajesh T. et al. [21], Tian, Wenmin et al. [22], and Morens, David M. et al. [23] clarify the characteristics and transmission routes of SARS-CoV-2, and they demonstrate that the pandemic can be prevented and controlled. These studies are scientific evidence with which a system can be designed. Huang, Lianzhou et al. [24] and Leask, Julie et al. [25] claim that there are no specific drugs or vaccines which can definitively avoid infections, so routine ways such as keeping social distance, tracking individuals who have contact with COVID-19-positive individual, and isolating COVID-19-positive individual can function well to tackle the pandemic. Our research assists in the implementation of these pandemic prevention and control guidelines. Many researchers such as Alsunaidi, Shikah J. et al. [26], Ghaleb, Taher A. et al. [27], and Agbehadji, Israel Edem et al. [28] use big data and IoT, which can track people, diagnose individuals, predict a new outbreak of COVID-19, etc. Nevertheless, these studies mainly function effectively at the macro level. We need to pay attention to minimizing the impact of the pandemic on the population. D’angelo, Daniela et al. [29] emphasize the importance of precise prevention and control measures. Thus, it is necessary to devise a series of schemes for an indoor environment.
It is feasible to track a person in an enclosed space. Outdoor positioning infrastructures (BeiDou, Galileo, GPS, etc.) cannot function effectively in indoor environments because of the signal attenuation (Kaiser, Sean A. et al. [30] and Tang, Yongwei et al. [31]). Deng Zhongliang et al. [32] and Zhu, Wenqi et al. [33] describe various methods for deploying an indoor positioning system. Song, Wook et al. [34] and Yadav, Rohan Kumar et al. [35] show the advantages of BLE technology in indoor positioning: low power, cost effective, easy to deploy, etc. Compared to Ultrawideband (UWB) used by Zhu, Xiaomin et al. [36], ZigBee used by Cheng, Chia-Hsin et al. [37] and Radio Frequency Identification (RFID) used by Bernardini, Fabio et al. [38], etc., a BLE-based indoor positioning system is an optimal choice; those positioning methods that require special devices are not applicable to a large-scale application. Among various positioning methods such as Time of Arrival (TOA) used by Bernardini, Fabio et al. [39], Angle of Arrival (AOA) used by Bergen, Mark H. et al. [40], and Time Difference of Arrival (TDOA) used by Wang, Mei et al. [41], a common means is to create an RSSI fingerprint database like Li, Fei et al. [42], and then the database can be accessed when in the online stage to obtain a predicted location.
For the purpose of matching in the fingerprint database, Zhou, Rui et al. [43] highlight the use of a Support Vector Machine (SVM). However, the original SVM algorithm can only solve the binary classification problem (Chauhan, Vinod Kumar et al. [44]); thus, a number of binary classifiers are required, and it takes a long time to train the model. In the research carried out by Zhang, Xiaona et al. [45], the Bayes algorithm is crucial to their implementation. It is a probability-based algorithm, requiring a prior probability. The accuracy and reliability of the positioning system is affected by a complex indoor environment. It is certain that more advanced matching algorithms exist, such as long-short term memory (LSTM) used by Maghdid, Halgurd S. et al. [46], and multilayer perceptron (MLP) utilized by Li, Da et al. [47]; however, the difficulty and cost of training these models have increased significantly, which makes managers less interested in deploying these systems. Though KNN is not the most popular algorithm in the machine learning field nowadays, it is often used when deploying wireless networks for positioning. It is insensitive to outliers, and the overall effect satisfies the requirements (Tran, Huy Quang et al. [48]).
There are various scheduling algorithms widely applied in different cases. Raheja, Supriya [49] mentions the Highest Response Ratio Next (HRRN) algorithm, which is often used in implementing a Central Processing Unit (CPU) scheduler. Compared to other scheduling algorithms such as First Come First Serve (FCFS), Short Job First (SJF), and Highest Possible Frequency (HPF) (Wang, Meng et al. [50] and Al-maweri A, Nasr Addin et al. [51]), both waiting time and service time are considered. There are few scheduling (booking) algorithms specifically used for COVID-19 prevention and control in enclosed spaces. Therefore, we modify the HRRN algorithm to adapt to the need. Pradhan, Anu et al. [52] make use of the parallel Dijkstra algorithm to find the shortest path in a graph. These methods can be modified and then introduced to the system to control social gatherings and find the shortest path to the destination.

3. Materials and Methods

In this section, the proposed booking algorithm is able to control social gatherings. The indoor positioning technology is crucial for providing navigation services with congestion control strategies, and the risk assessment model also requires people’s locations.

3.1. Booking Algorithm

Subareas exist in an enclosed space, e.g., different shops and dining rooms are in a shopping mall. Physically, each subarea is able to contain plenty of people; nevertheless, gathering crowds lead to higher infection risks. Hence, an optimized booking algorithm is introduced.
Here, an example to explain how to calculate w , s , and r is shown in Table 1. There are 4 people (A, B, C, and D) applying to enter an area which can only contain 1 person.
Related details are shown below (Table 2). At 12:00, A applies to enter the area, and he plans to stay there for about 1 minute (service time). At 12:01, B attempts to enter the area and the request is then immediately satisfied. At 12:02, C should wait for B until 12:05, and so should D. At 12:05, the waiting time for C and D is 3 minutes and 1 minute, respectively.
The booking algorithm is a variant of the original HRRN algorithm. In the original HRRN algorithm, r is defined as below (Equation (1)).
r = w + s s = 1 + w s
The main idea of the HRRN algorithm is to allocate the CPU resource to the job or process waiting longer (greater w ) and requiring less service time (less s ), i.e., the job or process with greater r has higher priority to get the CPU resource. In the booking algorithm, an area is seen as a CPU, and people are seen as processes. If the space can contain the amount of people who are requesting to enter, their requests will be satisfied immediately (e.g., 3 people concurrently apply to enter an area with 5 free vacancies).
Nonetheless, pandemic guidelines do not encourage a person to spend too much time waiting. Additionally, for fairness, individuals requiring too little service time are also not encouraged. Therefore, the original definitions of waiting time and service time are modified. In Equations (2)–(4),
    f ( w ) = { w ,     0 w < w 0 C 1 ln w + w 0 C 1 ln w 0 ,     w w 0 ,    C 1 > 0
g ( s ) = { C 2 ln 1 s + s 0 C 2 ln 1 s 0 ,    0 < s s 0 ,   C 2 > 0    s ,    s > s 0
r = 1 + f ( w ) g ( s )
C 1 and C 2 are constant values preliminarily set by the manager of an area.
Other related scheduling algorithms such as FCFS, SJF, and HPF are unsuited for COVID-19 prevention and control. FCFS ensures that a person who comes earlier can also get an earlier permit. However, people who only need to stay in an area for a short time may wait for a long time. The sum of waiting time of all people will not be the minimum. Though SJF is conducive to getting a minimum total waiting time, it is unfair for people needing to stay in an area for a longer time, leading to bad user experience. As for HPF, we cannot confirm the priority values for individuals easily in advance. Therefore, the HRRN is a compromise which considers both COVID-19 prevention and control and user experience.
Let C 1 = C 2 = 1 , w 0 = s 0 = 1 . Hence, Equations (5) and (6) are presented.
f ( w ) = { w ,     0 w < 1 ln w + 1 ,     w 1
g ( s ) = { ln 1 s + 1 ,     0 < s 1     s ,     s > 1
In Equations (7) and (8), the response ratio r always increases with w ( r w > 0 ), and 2 r w 2 < 0   ( w 1 ) , viz., 1 minute is the threshold value for the encouraged waiting time.
r w = 1 g ( s ) d f d w
r s = f ( w ) g 2 ( s ) d g d s
Excessive waiting does not contribute much to the increase in priority. Because r s < 0   ( 0 < s 1 ) , similarly, 1 minute is the threshold value for the encouraged service time. All these strategies should be told to users first in a user-friendly way, and then they can make their own choices. To get a higher priority (higher r ) to enter an area, people ought to consciously follow pandemic prevention and control policies.
The result of applying Equations (5) and (6) to the example in Table 2 is shown in Table 3. The status “In” indicates that a person is in the area with permission. Statuses “Left” and “Not Arrived” mean that a person is not in the area. When the region is full, a new user wanting to enter must wait. At 12:05, C and D compete for the vacancy and D is satisfied because of their higher r ( 1.59 > 1.35 ).
The algorithm does not ensure the first person will get the first permit, which sometimes makes people unhappy. The manager of the area may take some measures for compensation, e.g., in a shopping mall, it is acceptable to give e-coupons.
Reservation and booking approaches are widely adopted nowadays, especially in the pandemic period, e.g., a scenic spot may sell fewer tickets and ask tourists to queue up to enter the scenic spot in batches. When using the algorithm, a manager of a region should help people to understand and follow the pandemic prevention and control guidelines. Sometimes, urgent entry requests (jumping the queue) should be also processed in time.

3.2. Indoor Positioning

In an enclosed place, the relationship between a location and corresponding RSSI vector is built by selecting reference points and collecting RSSI values from iBeacon nodes at each reference point. R = [ r 1 , r 2 ,   r 3 r p ] T denotes a series of RSSI values; r i represents the RSSI value from node i . At each point, a receiver (usually a mobile phone) gets RSSI values steadily in a period from iBeacon nodes. The vector r = [ r 1 , r 2 ,   r 3 r n ] T is a vector of RSSI values from an iBeacon node via repeated measurements. The simplest way is to average the values in the vector r (in Equation (9)).
R S S I = 1 m i = 1 m r i
Nevertheless, this simple method is unable to adapt to the real situation, especially when the indoor environment is complex and volatile. Kalman filtering (KF), a linear, minimum variance estimation method, is required to be used; the KF algorithm consists of a gain calculation loop (filter gain, estimation error, and prediction error) and a filter calculation loop (state prediction and state estimation) [53,54]. The covariance of the observation noise R is calculated by averaging the variance of the RSSI at each reference point. The system process noise is Q , and the state transition is T (the RSSI value is expected to be stable). The observation is H . The first estimated error covariance of the point is shown in Equation (10).
P 1 = 1 N i = 1 N ( Z 1 l E [ Z l ] ) 2
Z l 1 is the first sample RSSI of reference point l. E [ Z l ] is the expected RSSI value of the corresponding point. N is the number of elements of the vector r .
The prediction error covariance of the t -th sample RSSI is shown in Equation (11).
P t , t 1 l = P t 1 l + Q
The filter gain of the t -th sample RSSI is denoted by J t l (Equation (12)).
J t l = P t , t 1 l [ P t , t 1 l + R ] 1
The estimated error covariance of the t -th sample RSSI is confirmed by Equation (13) ( U is the unit vector).
P t 1 l = [ U J t l ] P t , t 1 l [ U J t l ] T + J R J t l T
The predicted value of the t -th RSSI is calculated via Equation (14).
X t , t 1 l = T X t 1 l
In order to gain the predicted value of the t -th sample of RSSI, we put the filter gain into the filter calculation (Equation (15)).
X t l = X t , t 1 l + J t l [ Z t l X t , t 1 l ]
Through the KF algorithm, the error of RSSI measurement can be reduced so that we can gain more accurate RSSI values. For the fingerprinting database, a more reliable offline fingerprinting database is established. Figure 2 shows the process of building a fingerprint database (offline stage) and real-time positioning (online stage).
The distance between a received RSSI vector and fingerprint vector R i needs to be calculated. The corresponding location for R i is P i ( x i , y i ) . Firstly, we calculate the first k largest distances and record the corresponding P i , then we generate an ascending distance vector D = ( d 1 , d 2 ,   d 3 d n ) . The method of calculation is shown below Equations (16)–(18).
x p r e d i c t = i = 1 k ( w i x i ) i = 1 k 1 d i
y p r e d i c t = i = 1 k ( w i y i ) i = 1 k 1 d i
w i = 1 d i m = 1 k 1 d m
The implementation of an indoor positioning system requires some experiments. An ideal place for testing the feasibility of the algorithm is a typical enclosed space. Firstly, we select points, and at each point we carry out positioning many times. Then, the positioning errors at each point are averaged and recorded. Among all of the different values of k , the value which can make the positioning results stable and accurate is acceptable. Though a larger k may make the result more accurate, we should consider the computation pressure of server computers. In this process, k is determined.
After that, we select a fixed point to carry out continuous positioning to observe the distribution of positioning results. This can verify the static stability and reliability of positioning. However, individuals are always moving in an enclosed space; thus, it is needed to move and form a trajectory, and then compare the real trajectory to the predicted trajectory. This experiment demonstrates dynamic stability and reliability. The indoor positioning system should be reliable whether people are moving or not.

3.3. Path-Planning Algorithm with Congestion Control

The main function of the path-planning algorithm is to guide users to destinations as soon as possible, which reduces the infection risk. For a COVID-19-positive individual, fewer contaminants will be unconsciously emitted; and for a healthy person, the exposure time to contaminants will be reduced.
The path-finding algorithm is introduced to solve the Single-Source Shortest Path problem with efficiency. The Dijkstra algorithm is a ubiquitous and typical solution to find the shortest path between two given vertices. In the statement of Dijkstra, V is a set saving all nodes in the graph, and S is initialized to store nodes whose shortest paths from the start vertex are found. Every time, we select a node u with the shortest distance from start vertex s in V S (difference set between V set and S set). After that, the vertex u can be considered as the intermediary point, and then the shortest distance between the start vertex s and any vertex v that can be reached from u is optimized [55]. The pseudo code of the sequential Dijkstra algorithm is presented in Algorithm 1.
Algorithm 1: Sequential Dijkstra Algorithm
Input: vertex s, graph G
Output: None
  • set collected;
  • double_array d[];
  • while(1){
  • node v = get_min_node();
  • if(v is null)break;
  • collected.insert(v);
  • for(w in v.adjacent_vertices())
  • if(w not in collected)
  • if(d[v] + G[v][w] < d[w])
  • d[w] = d[v] + G[v][w];
  • }
However, for a public area in which many people stay, a single-thread Dijkstra algorithm implementation is of low efficiency for handling a great many simultaneous requests. An increase in the use of the General-Purpose Graphics Processing Unit (GPGPU) offers massive-scale parallel computing capabilities. The GPGPU is based on a single-instruction, multiple-thread (SIMT) execution model, i.e., each thread executes the same code. CUDA (Compute Unified Device Architecture) is a parallel computing framework enabling programmers to develop GPU-accelerated applications on major architectures including x86, Arm and POWER. It dispatches GPU parallelism for general-purpose computing and retains performance. It is developed based on industry-standard C++. CUDA consists of a small set of extensions to enable heterogeneous programming [56].
Algorithm 2: Parallel Dijkstra Algorithm
Input:
vertex s, graph G
Output: None
  • generate subgroups;
  • while (there are vertices not in collected){
  • for (vertices in the subgroup but outside collected){
  • select the locally closest vertex;
  • }
  • find the globally closest vertex;
  • }
In the sequential algorithm, the outer loop must be executed in order. Subgroups for every V / P vertices are partitioned. P is the number of computation units, which is set by programmers according to the need, and V is the number of vertices. Each core finds its closest vertex to the source vertex, selects the globally closest one, and broadcasts the result to all cores. In Algorithm 2, at each loop, the value for O ( V ) cores is updated separately, and the gross execution time is O   ( V 2 + V / l o g ( P ) ) [57,58].
After surveying and mapping, the original graph of an enclosed space is generated, and then it is converted to an adjacency table or adjacency matrix. The graph is sometimes a multi-graph (e.g., Figure 3). The edges represent roads, and the numbers indicate the distance between two vertices. The vertices are marked by the manager of the enclosed space as needed.
An appropriate path is generated very soon after a user selects a destination. The maximum number of people that each road can accommodate should be set in advance, and “congestion” means that the number of people on a road exceeds a predetermined limit. In Figure 4, the limitation information for Figure 3 is presented (the numbers refer to a number limit).
It is required to make statistics and record the roads (edges in the multi-graph) most prone to congestion (or manually analyze which roads have higher probabilities for congestion), and these roads are stored in a set E s . Every time a user sends a request for navigation, the multi-graph needs to be converted to a simple graph.
Edges between two vertices (e.g., three edges between A and C with weight 5, 6, and 7, respectively) are divided into two categories: “congestion edges” and “ordinary edges”. Congestion edges with probability of p and ordinary edges with probability of 1 p ,   ( p < 1 p ) are selected. If the congestion edges are selected, they are stored in l i s t 1 . Then, let D 1 = [ d 1 ,   d 2 ,   d 3   d n ] T , and d i denotes the distance of the i -st edge in l i s t 1 . Let L 1 = [ l 1 ,   l 2 ,   l 3   l n ] T , and l i represents the number limit of the i -st edge. The probability of selecting D i follows Equations (19) and (20).
  ρ i = l i d i
  p i = e ρ i m = 1 n e ρ m
The probability of finally selecting D i follows Equation (21).
p f _ i = p p i
Indicator ρ is the “capacity density”. An edge with greater capacity and shorter distance has a larger capacity density. Edges with a higher capacity density are more likely to be selected. The strategy for selecting ordinary edges is similar.
After this process, a simple graph G s is generated. The navigation for a user is based on G s . Each person’s real-time location is marked on a multi-graph G m , and the number of people on each edge is monitored in real time. If a user is moving and the server finds that the number of people on the next planned edge e p has reached the limit, it will open any adjacent edge near e p . The next vertex v p is selected as the start vertex to find the shortest path to the destination. If all edges have reached the number limit, the booking algorithm in this paper is applied to wait for an edge.
As shown in Figure 5, a person plans to go to A from D, and the path is D ≥ C ≥ A ( e 1 is selected among e 1 , e 2 , and e 3 ). The number inside parentheses indicates the current number of people on this edge. When the person is on the edge between C and D and about to reach C, the number of people on e 1 and e 2 exceeds the limit, and C is chosen as the start vertex to find the shortest path from C to A. Rollback is not allowed, and the person will go through e 3 . In the case where the number of people on e 1 , e 2 , and e 3 has all reached the limit, the booking algorithm will work.
Though the parallel algorithm is fast, we introduce a cache strategy which can greatly reduce the computation pressure on the server. An unordered map is a hash-based data structure which stores key-value pairs. On the premise of a proper hash algorithm implementation, the value can be accessed in constant time complexity via the key. The key of the unordered map is a combination of information (the differences between the original multi-graph and simple graph, and the start vertex with the destination vertex). For example, a key-value pair is (Key: (Delete e 1 , e 2 , and edges between A and B, Move from D to A), Value: (A path)). Every time the parallel algorithm finds the shortest path, the path is stored in the unordered map if it is never added to the cache. Additionally, we can even adopt a more aggressive cache strategy: it is feasible to generate and store most of the possible paths as early as possible.
In this paper, our purpose is not to build a high-performance computing center, and the hardware budget is also limited. Because of the cache strategy, the computing pressure on the server is reduced. When the cache has not been established or there are many changes to the multi-graph, the real-time path-planning algorithm will work, which often takes much more time than loading a path from the cache. In general, there is no need to invoke the parallel algorithm. The test of cache is relatively simple. The time consumption of loading a path from the cache should be within a reasonable time. To examine the performance of the path-finding algorithm, we generate different scales of graphs, and use the parallel algorithm to find out all of the shortest paths (the shortest path for any two vertices is generated). The sequential algorithm is applied for comparison. Ideally, when the scale of a graph is large, the parallel algorithm will be faster than the sequential algorithm.

3.4. Risk Assessment Model

Potential COVID-19-positive individuals may enter an enclosed place, putting others at risk. As a whole, the closer an uninfected person is to an infected person, the greater the risk of infection. Moreover, due to the pollutants produced by infected individuals, the space is still at risk of infecting people after infected individuals leave, and the infectivity of pollutants left in the site will gradually decrease with the passage of time. The risk assessment model will assess the infection risk of all relevant people during the period from the time the infected individual enters the enclosed space to the time when he is diagnosed with COVID-19. Ideally, all relevant people should be isolated and nucleic acid tested, and even the whole city should be shut down. However, this is an impossible measure in many countries, so a relatively accurate risk assessment model is necessary. The model divides people into different risk levels and provides information for them and managers. It is up to the authorities and regulations to decide what measures to take.
Nowadays, many countries that have adopted strict measures are also gradually improving the efficiency of pandemic prevention and control. Recently, the concept of “possible contacts in time and space” has been put forward by the health departments in China, and people who appear in the same area as infected individuals for a certain period of time are likely to meet this definition. At present, this is mainly realized by base station positioning technology, which requires the cooperation of base stations and mobile phones. This model based on the indoor positioning technology provide accurate assessment services.
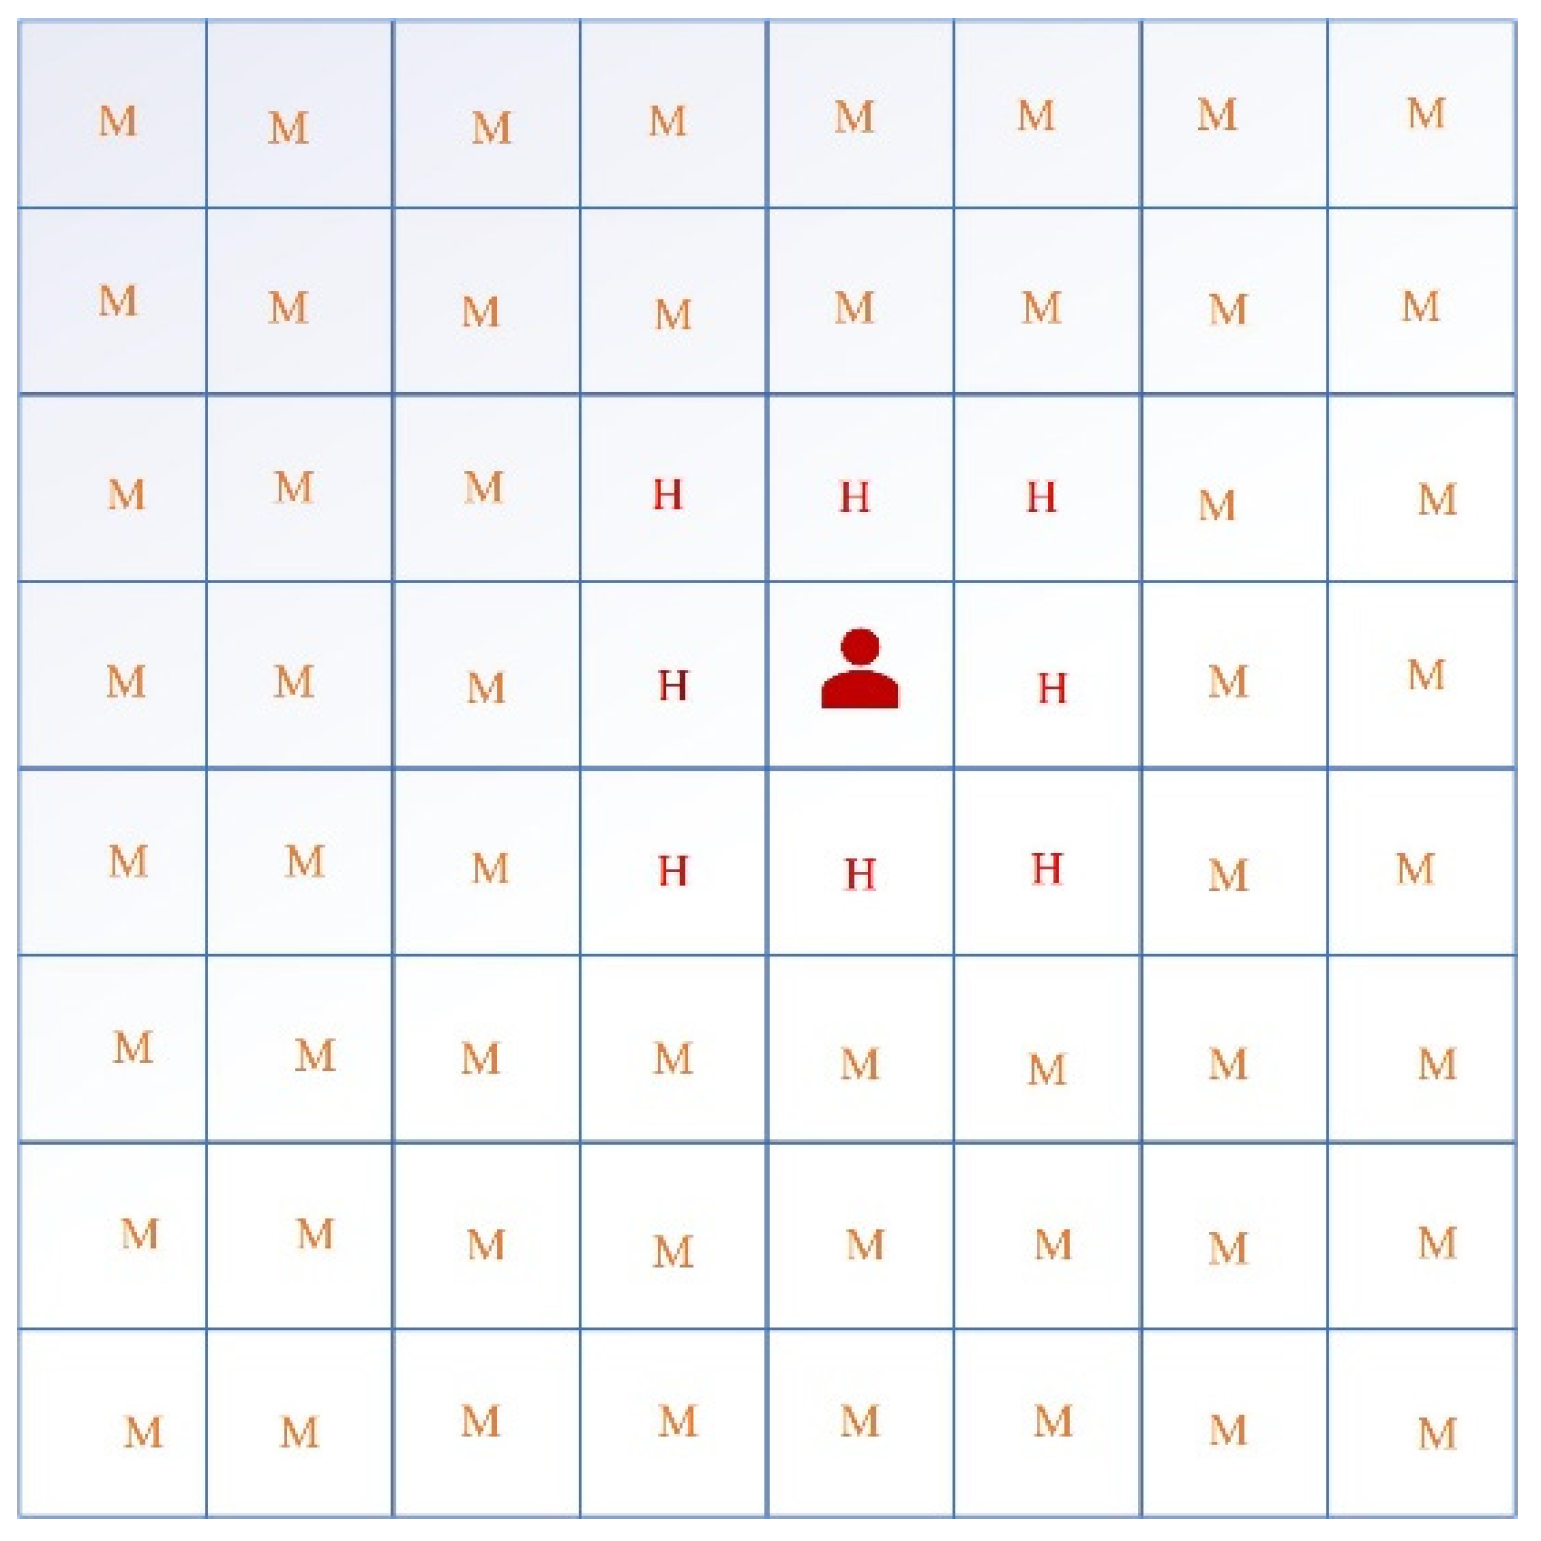
The enclosed space is divided into many grids (each grid 20 m × 20 m) such as Figure 6, and every person’s arrival and leaving times at a grid are recorded. In Figure 6, a COVID-19-positive individual is in a grid, and the location of this grid is denoted as ( a , b ) , and the risk level of this grid is seen as “Extremely High” at this moment. There are four risk levels for each grid: “Extremely High = 1”, “High = 2”, “Medium = 3”, and “Low = 4”. They change in real time. Risk levels at this moment of other grids ( x , y ) follow Equation (22).
Risk   Level = { E x t r e m e l y   H i g h ,     x = a ,   y = b H i g h ,     | x a | = 1 ,   | y a | = 1 M e d i u m ,     1 < | x a | 4 ,   1 < | y a | 4 L o w ,   O t h e r
Let us assume that the patient disappears directly at this moment. Then, every grid launches a timer. Suppose the time from the disappearance of the patient is t , and the principles of risk level changes follows Table 4.
When 0 < t 1   h , the risk level of all grids remains unchanged. The second row in the table represents that when 1 < t 6   h , the former grid with “Extremely High” risk level is “High”, etc. The risk level can only be reduced by two levels at most.
A patient cannot disappear directly in a grid. He can only leave from the boundary. When he moves, the new grid he steps in will be subsequently defined as “Extremely High” level and other grids will change their levels according to Equation (22). Visually, it is like “sliding” the original risk distribution window with the patient’s footsteps. The risk level is influenced by both Equation (22) and Table 4, and the final risk level of a grid is the highest result. An example is presented in Figure 7. At 12:00, a patient was at D and all grids are defined as “High” risk level (except D). He entered E at 12:05 without leaving. After 5 h, the timer at E defines the risk level as “High” according to Table 4, but Equation (22) considers E as “Extremely High”, so the final definition is “Extremely High” for “ E x t r e m e l y   H i g h > H i g h ”. Each grid may start more than one timer because of the continuous movement of a patient, and we only recognize the results that are considered the riskiest.
A user with a mobile phone sends an RSSI vector to the server and the server matches information in the fingerprint database with the vector to return a location, which means it is simple to associate the location with time. After dividing the enclosed space into grids, when a person enters the grid, when he leaves the grid, and how long he stays are recorded. Thus, many statistics are available, including but not limited to the following:
  • Viewing a patient’s track on the timeline.
  • Viewing a user’s track on the timeline.
  • Checking how long a user has been in risk areas.
  • Finding the closest point to an infected individual a person has ever been to.
Based on this information, individuals can be classified by different risk levels. People who have ever been in any grid in the “Extremely High” level are marked “Extremely High infection risk”; those who have stayed in “High”-level grids, or the gross staying time in “Medium”-level grids exceeds 2 h are denoted “High infection risk”; other related people are seen as “potentially infected”. If someone has never been to the enclosed space after an infected individual went in, he is deemed to be at low risk. All these threshold values are not arbitrarily determined, and they refer to the pandemic prevention and control policies conducted by governments around the world (e.g., red–yellow–green code strategy for marking different crowds) [59].

4. Results and Discussion

4.1. Test for Indoor Positioning

We used a real-world test field to carry out tests (a room for storing things), which is a typical enclosed space, and the valid size was 200 m2. There were 21 evenly distributed iBeacon nodes. In order to test the performance of positioning, 30 points were selected, and we carried out positioning 100 times at each point, and errors of the 100 measurements at every point were averaged, which are presented in Figure 8; the x-axis is the sequence of Point ID (from 1 to 30) and the y-axis is the average error (meter) of each point. If the value of k is too large ( k = 5 ), it will increase the amount of computation, and a too small k leads to lower accuracy ( k = 2 ,   3 ). The average error is 1.65 m ( k = 4 ). An error refers to the geometric distance between predicted coordinates and real coordinates.
We also performed 100 separate positioning measurements on the point ( 5 , 5 ) , and the results are presented in Figure 9. The average error is 1.68 m, and about 80.0% of predicted coordinates are within 2 m of the actual coordinates, which fulfilled the requirement for keeping track of people. This does not mean that the positioning accuracy cannot continue to improve, while the deployment of more iBeacon nodes requires more funding.
Finally, a person walked in the test field and the track was nearly a line segment. Positioning was carried out while walking, and the predicted track from the positioning system and real track are shown in Figure 10. In the test, we obtained locations from the server computer and performed 200 measurements. The average error is 1.78 m, which is a bit better than testing without moving. The movement of people may affect accuracy a little, but it is still suitable for tracking a person.

4.2. Performance of the Path-Planning Algorithm

On a computer with AMD Ryzen 7 5800X, the time consumption of matching and loading the path from the cache containing 1000 key-value pairs is about 11 ms. It is obvious that the cache strategy will not be a performance bottleneck.
However, the layout of an enclosed space may be changed occasionally, e.g., some internal roads may be temporarily closed in a factory workshop. Minor changes may make the cache invalid. In this case, the computing power of the server will greatly affect the efficiency.
We randomly generated sparse graphs of different sizes and used the sequential Dijkstra algorithm (the multi-core feature of CPU is not used) and the Dijkstra algorithm implemented by CUDA to compute them. In the test (Table 5), we generated the shortest paths for every two vertices in the graph. Finding the shortest path between two given vertices is of course much faster than the shortest path among all vertices.
This test was executed on an ordinary personal computer (AMD Ryzen 7 5800X and Nvidia RTX 3060). From the test, we know that when the scale of the graph is relatively small, the sequential algorithm has advantages, because it takes a certain time to copy data from memory to video memory, and it also takes a certain initialization time to invoke the GPU. Conversely, when the scale of the graph is large, the parallel algorithm using GPU has significant advantages. The traditional Dijkstra algorithm running on a single-instruction, single-data (SISD) execution model is not appropriate to complete the task in time compared to the parallel algorithm.

4.3. Privacy and Compliance

Tracking is fundamental to the system. Individuals are worried about violations of their privacy by pandemic prevention and control policies. This inevitably makes many policies impossible to implement in practice. In the system, we try to avoid obtaining data with identity information.
IBeacon advertisements from iBeacon nodes only include Universally Unique Identifier (UUID), major and minor values. This is unidirectional broadcasting, and there is no mutual communication between an iBeacon node and a mobile phone. Hence, iBeacon devices do not collect any private information from users’ devices, acting like a lighthouse. As shown in Figure 2, a mobile phone can get RSSI values from nearby iBeacon nodes, and the corresponding iBeacon node to a received RSSI value is known. The mobile phone forwards the RSSI values to server, and the server then returns a predicted coordinate. The server needs to clarify which device each positioning request comes from, which is a sine qua non for risk assessment. A possible solution is to ask a user to register and log in when using the system, and the system hides identity information. The registered account can be an identifier for each person. The server will store the track and time information of each user; once a user is identified as a COVID-19-positive individual by medical institutions and the information is input on the system by the authorities, the server will send alerts to related people. In the whole process, only medical institutions and the authorities will access private information, and the system only keeps an account, meaning the manager of the enclosed space is not able to access identity data of people. The system is more applicable to some places with strict management, such as airport terminals for entry and exit administration, children’s play areas, and factory workshops.

5. Conclusions

Enclosed spaces are risky during the pandemic period. In order to balance normal life and pandemic prevention and control, this paper proposes an IoT-based COVID-19 prevention and control system. The means of building an indoor positioning system is introduced. An iBeacon network is established, and we use a fingerprint-based method for real-time positioning. Based on the indoor positioning system, the booking algorithm, navigation algorithm, and risk assessment model can have an effect. In tests, the result demonstrates the feasibility of the positioning system. Moreover, the risk assessment model is made for an enclosed space; it could be integrated into a big-data pandemic prevention and control system promoted by the government, which helps to form an overall and systematic mechanism for COVID-19 prevention and control.
Nevertheless, there are still some limitations. The booking algorithm does not guarantee that somebody who arrives earlier is given an earlier permit, which may make individuals exasperated. We use HRRN as a compromise. There could be more compensation measures. In addition, the overall numeric simulation is not applicable because of such a complex system, and the overall real-world test is also infeasible. Ideally, we should deploy the whole system to many enclosed spaces and compare people’s infections in places which do not have this system. Then, the general effects of the system are clear. This experiment is only applicable when there are a number of potential COVID-19-positive individuals.

6. Future Work

Although the overall test is not applicable because of some policies and the current pandemic situation, we will try to promote our design in places which can provide opportunities to test the overall effect of the system. Then, our work may make contributions to the prevention and control of COVID-19.

Author Contributions

Conceptualization, C.Y. and W.W.; methodology, C.Y. and W.W.; validation, C.Y., W.W., F.L. and D.Y.; writing—original draft preparation, C.Y.; writing—review and editing, C.Y. and W.W.; supervision, W.W., F.L. and D.Y.; project administration, W.W., F.L. and D.Y.; funding acquisition, F.L. and D.Y. All authors have read and agreed to the published version of the manuscript.

Funding

This research was supported by the National Natural Science Foundation of China (grant number 41571159 and 41301581).

Data Availability Statement

Not applicable; the study does not report any data.

Conflicts of Interest

The authors declare no conflict of interest.

References

  1. Fedele, S.; Porter, S. COVID-19 NHS infection control strategy: Errare humanum est, perseverare autem diabolicum. Oral Dis. 2020. [Google Scholar] [CrossRef] [PubMed]
  2. Garg, M.; Maralakunte, M.; Garg, S.; Dhooria, S.; Sehgal, I.; Bhalla, A.S.; Vijayvergiya, R.; Grover, S.; Bhatia, V.; Jagia, P.; et al. The Conundrum of ‘Long-COVID-19’: A Narrative Review. Int. J. Gen. Med. 2021, 14, 2491–2506. [Google Scholar] [CrossRef] [PubMed]
  3. Acharya, S.R.; Moon, D.H.; Shin, Y.C. Assessing Attitude Toward COVID-19 Vaccination in South Korea. Front. Psychol. 2021, 12, 6. [Google Scholar] [CrossRef] [PubMed]
  4. de Oliveira, P.M.; Mesquita, L.C.C.; Gkantonas, S.; Giusti, A.; Mastorakos, E. Evolution of spray and aerosol from respiratory releases: Theoretical estimates for insight on viral transmission. Proc. R. Soc. A-Math. Phys. Eng. Sci. 2021, 477, 23. [Google Scholar] [CrossRef] [PubMed]
  5. Wang, C.C.; Prather, K.A.; Sznitman, J.; Jimenez, J.L.; Lakdawala, S.S.; Tufekci, Z.; Marr, L.C. Airborne transmission of respiratory viruses. Science 2021, 373, eabd9149. [Google Scholar] [CrossRef]
  6. Guazzini, A.; Fiorenza, M.; Panerai, G.; Duradoni, M. What Went Wrong? Predictors of Contact Tracing Adoption in Italy during COVID-19 Pandemic. Future Internet 2021, 13, 286. [Google Scholar] [CrossRef]
  7. Kannan, S.; Ali, P.S.S.; Sheeza, A.; Hemalatha, K. COVID-19 (Novel Coronavirus 2019)-recent trends. Eur. Rev. Med. Pharmacol. Sci. 2020, 24, 2006–2011. [Google Scholar]
  8. Buranyi, S. The COVID-19 Catastrophe: What’s Gone Wrong and How to Stop It Happening Again. Nature 2020, 582, 478–479. [Google Scholar] [CrossRef]
  9. Dalton, C.B.; Corbett, S.J.; Katelaris, A.L. COVID-19: Implementing sustainable low cost physical distancing and enhanced hygiene. Med. J. Aust. 2020, 212, 443. [Google Scholar] [CrossRef]
  10. Tu, H.W.; Hu, K.Q.; Zhang, M.; Zhuang, Y.L.; Song, T. Effectiveness of 14 day quarantine strategy: Chinese experience of prevention and control. BMJ 2021, 375, e066121. [Google Scholar] [CrossRef]
  11. Wu, J.; Wang, J.; Nicholas, S.; Maitland, E.; Fan, Q.Y. Application of Big Data Technology for COVID-19 Prevention and Control in China: Lessons and Recommendations. J. Med. Internet Res. 2020, 22, e21980. [Google Scholar] [CrossRef] [PubMed]
  12. Kwekha-Rashid, A.S.; Abduljabbar, H.N.; Alhayani, B. Coronavirus disease (COVID-19) cases analysis using machine-learning applications. Appl. Nanosci. 2021, 1–13. [Google Scholar] [CrossRef] [PubMed]
  13. Martinez-Velazquez, R.; Tobon, V.D.P.; Sanchez, A.; El Saddik, A.; Petriu, E. A Machine Learning Approach as an Aid for Early COVID-19 Detection. Sensors 2021, 21, 4202. [Google Scholar] [CrossRef] [PubMed]
  14. Alshammari, F.S. A Mathematical Model to Investigate the Transmission of COVID-19 in the Kingdom of Saudi Arabia. Comput. Math. Method Med. 2020, 2020, 13. [Google Scholar] [CrossRef] [PubMed]
  15. Lar, S.U.; Liao, X.F. An initiative for a classified bibliography on TCP/IP congestion control. J. Netw. Comput. Appl. 2013, 36, 126–133. [Google Scholar] [CrossRef]
  16. Li, C.T.; Cheng, J.C.P.; Chen, K.Y. Top 10 technologies for indoor positioning on construction sites. Autom. Constr. 2020, 118, 23. [Google Scholar] [CrossRef]
  17. Yousif, M.; Hewage, C.; Nawaf, L. IoT Technologies during and Beyond COVID-19: A Comprehensive Review. Future Internet 2021, 13, 105. [Google Scholar] [CrossRef]
  18. Kim, K.; Li, S.N.; Heydariaan, M.; Smaoui, N.; Gnawali, O.; Suh, W.; Suh, M.J.; Kim, J.I. Feasibility of LoRa for Smart Home Indoor Localization. Appl. Sci. 2021, 11, 415. [Google Scholar] [CrossRef]
  19. Luo, B.Q.; Yao, Y.D.; Sun, Z.X. Performance Analysis Models of BLE Neighbor Discovery: A Survey. IEEE Internet Things J. 2021, 8, 8734–8746. [Google Scholar] [CrossRef]
  20. Shi, C.Q.; Niu, X.Y.; Li, T.; Li, S.; Huang, C.J.; Niu, Q. Exploring Fast Fingerprint Construction Algorithm for Unmodulated Visible Light Indoor Localization. Sensors 2020, 20, 7245. [Google Scholar] [CrossRef]
  21. Gandhi, R.T.; Lynch, J.B.; del Rio, C. Mild or Moderate COVID-19. N. Engl. J. Med. 2020, 383, 1757–1766. [Google Scholar] [CrossRef] [PubMed]
  22. Tian, W.M.; Zhang, N.; Jin, R.H.; Feng, Y.M.; Wang, S.Y.; Gao, S.X.; Gao, R.Q.; Wu, G.Z.; Tian, D.; Tan, W.J.; et al. Immune suppression in the early stage of COVID-19 disease. Nat. Commun. 2020, 11, 5859. [Google Scholar] [CrossRef] [PubMed]
  23. Morens, D.M.; Fauci, A.S. Emerging Pandemic Diseases: How We Got to COVID-19. Cell 2020, 182, 1077–1092. [Google Scholar] [CrossRef] [PubMed]
  24. Huang, L.Z.; Chen, Y.Q.; Xiao, J.; Luo, W.S.; Li, F.; Wang, Y.; Wang, Y.L.; Wang, Y.F. Progress in the Research and Development of Anti-COVID-19 Drugs. Front. Public Health 2020, 8, 365. [Google Scholar] [CrossRef] [PubMed]
  25. Leask, J.; Carlson, S.J.; Attwell, K.; Clark, K.K.; Kaufman, J.; Hughes, C.; Frawley, J.; Cashman, P.; Seal, H.; Wiley, K.; et al. Communicating with patients and the public about COVID-19 vaccine safety: Recommendations from the Collaboration on Social Science and Immunisation. Med. J. Aust. 2021, 215, 9. [Google Scholar] [CrossRef]
  26. Alsunaidi, S.J.; Almuhaideb, A.M.; Ibrahim, N.M.; Shaikh, F.S.; Alqudaihi, K.S.; Alhaidari, F.A.; Khan, I.U.; Aslam, N.; Alshahrani, M.S. Applications of Big Data Analytics to Control COVID-19 Pandemic. Sensors 2021, 21, 2282. [Google Scholar] [CrossRef]
  27. Ghaleb, T.A.; Bin-Thalab, R.A.; Alselwi, G.A.A. How Internet of Things responds to the COVID-19 pandemic. PeerJ Comput. Sci. 2021, 7, e776. [Google Scholar] [CrossRef]
  28. Agbehadji, I.E.; Awuzie, B.O.; Ngowi, A.B.; Millham, R.C. Review of Big Data Analytics, Artificial Intelligence and Nature-Inspired Computing Models towards Accurate Detection of COVID-19 Pandemic Cases and Contact Tracing. Int. J. Environ. Res. Public Health 2020, 17, 5330. [Google Scholar] [CrossRef]
  29. D’Angelo, D.; Sinopoli, A.; Napoletano, A.; Gianola, S.; Castellini, G.; del Monaco, A.; Fauci, A.J.; Latina, R.; Iacorossi, L.; Salomone, K.; et al. Strategies to exiting the COVID-19 lockdown for workplace and school: A scoping review. Saf. Sci. 2021, 134, 105067. [Google Scholar] [CrossRef]
  30. Kaiser, S.A.; Christianson, A.J.; Narayanan, R.M. Global positioning system processing methods for GPS passive coherent location. IET Radar Sonar Navig. 2017, 11, 1406–1416. [Google Scholar] [CrossRef]
  31. Tang, Y.W.; Hao, H.J.; Zhou, J.; Lin, Y.X.; Dong, Z.Z. Research on outdoor AGV precise navigation based on BDS/INS data fusion. J. Intell. Fuzzy Syst. 2021, 41, 4295–4306. [Google Scholar] [CrossRef]
  32. Deng, Z.L.; Yu, Y.P.; Yuan, X.; Wan, N.; Yang, L. Situation and Development Tendency of Indoor Positioning. China Commun. 2013, 10, 42–55. [Google Scholar] [CrossRef]
  33. Zhu, W.; Zeng, Z.; Yang, Q.; Zhao, X.; Zhang, J. Research on indoor positioning algorithm based on BP neural network. In Proceedings of the 2021 International Conference on Electronic Materials and Information Engineering (EMIE 2021), Xi’an, China, 9–11 April 2021. [Google Scholar]
  34. Song, W.; Lee, H.; Lee, S.H.; Choi, M.H.; Hong, M. Implementation of Android Application for Indoor Positioning System with Estimote BLE Beacons. J. Internet Technol. 2018, 19, 871–878. [Google Scholar] [CrossRef]
  35. Yadav, R.K.; Bhattarai, B.; Gang, H.S.; Pyun, J.Y. Trusted K Nearest Bayesian Estimation for Indoor Positioning System. IEEE Access 2019, 7, 51484–51498. [Google Scholar] [CrossRef]
  36. Zhu, X.M.; Yi, J.J.; Cheng, J.Y.; He, L. Adapted Error Map Based Mobile Robot UWB Indoor Positioning. IEEE Trans. Instrum. Meas. 2020, 69, 6336–6350. [Google Scholar] [CrossRef]
  37. Cheng, C.H.; Syu, S.J. Improving area positioning in ZigBee sensor networks using neural network algorithm. Microsyst. Technol. Micro-Nanosyst. Inf. Storage Process. Syst. 2021, 27, 1419–1428. [Google Scholar] [CrossRef]
  38. Bernardini, F.; Buffi, A.; Fontanelli, D.; Macii, D.; Magnago, V.; Marracci, M.; Motroni, A.; Nepa, P.; Tellini, B. Robot-Based Indoor Positioning of UHF-RFID Tags: The SAR Method with Multiple Trajectories. IEEE Trans. Instrum. Meas. 2021, 70, 1–15. [Google Scholar] [CrossRef]
  39. Lim, J.; Lee, C.; Seol, D.-M.; Jung, S.; Lee, S. TOA Based Indoor Positioning Algorithm in NLOS Environments. J. Position. Navig. Timing 2021, 10, 121–130. [Google Scholar] [CrossRef]
  40. Bergen, M.H.; Jin, X.; Guerrero, D.; Chaves, H.; Fredeen, N.V.; Holzman, J.F. Design and Implementation of an Optical Receiver for Angle-of-Arrival-Based Positioning. J. Lightwave Technol. 2017, 35, 3877–3885. [Google Scholar] [CrossRef]
  41. Wang, M.; Chen, Z.; Zhou, Z.; Fu, J.L.; Qiu, H.B. Analysis of the Applicability of Dilution of Precision in the Base Station Configuration Optimization of Ultrawideband Indoor TDOA Positioning System. IEEE Access 2020, 8, 225076–225087. [Google Scholar] [CrossRef]
  42. Li, F.; Liu, M.; Zhang, Y.; Shen, W.M. A Two-Level WiFi Fingerprint-Based Indoor Localization Method for Dangerous Area Monitoring. Sensors 2019, 19, 4243. [Google Scholar] [CrossRef] [PubMed] [Green Version]
  43. Zhou, R.; Huang, Y.M.; Li, Z.Q. Wi-Fi Fingerprinting using SVM Classification and Regression. Adhoc Sens. Wirel. Netw. 2016, 34, 161–189. [Google Scholar]
  44. Chauhan, V.K.; Dahiya, K.; Sharma, A. Problem formulations and solvers in linear SVM: A review. Artif. Intell. Rev. 2019, 52, 803–855. [Google Scholar] [CrossRef]
  45. Zhang, X.; Zhang, S.; Huai, S. Low-Power Indoor Positioning Algorithm Based on iBeacon Network. Complexity 2021, 2021, 8475339. [Google Scholar] [CrossRef]
  46. Maghdid, H.S.; Ghafoor, K.Z.; Al-Talabani, A.; Sadiq, A.S.; Singh, P.K.; Rawat, D.B. Enabling accurate indoor localization for different platforms for smart cities using a transfer learning algorithm. Internet Technol. Lett. 2020, 5, e200. [Google Scholar] [CrossRef]
  47. Li, D.; Lei, Y.K. Deep Learning for Fingerprint-Based Outdoor Positioning via LTE Networks. Sensors 2019, 19, 5180. [Google Scholar] [CrossRef] [Green Version]
  48. Tran, H.Q.; Ha, C. High Precision Weighted Optimum K-Nearest Neighbors Algorithm for Indoor Visible Light Positioning Applications. IEEE Access 2020, 8, 114597–114607. [Google Scholar] [CrossRef]
  49. Raheja, S. An intuitionistic based novel approach to highest response ratio next CPU scheduler. Intell. Decis. Technol. 2019, 13, 523–536. [Google Scholar] [CrossRef]
  50. Wang, M.; Chen, W.; Ephremides, A. Real-Time Reconstruction of a Counting Process through First-Come-First-Serve Queue Systems. IEEE Trans. Inf. Theory 2020, 66, 4547–4562. [Google Scholar] [CrossRef]
  51. addin Al-maweri, N.; Samsudin, K.; Rokhani, F.Z. Runtime CPU scheduler customization framework for a flexible mobile operating system. In Proceedings of the 2009 IEEE Student Conference on Research and Development (SCOReD 2009), Serdang, Malaysia, 16–18 November 2009; pp. 85–88. [Google Scholar]
  52. Pradhan, A.; Mahinthakumar, G. Finding all-pairs shortest path for a large-scale transportation network using parallel Floyd-Warshall and parallel Dijkstra algorithms. J. Comput. Civ. Eng. 2013, 27, 263–273. [Google Scholar] [CrossRef]
  53. Jin, X.B.; Jeremiah, R.J.R.; Su, T.L.; Bai, Y.T.; Kong, J.L. The New Trend of State Estimation: From Model-Driven to Hybrid-Driven Methods. Sensors 2021, 21, 2085. [Google Scholar] [CrossRef] [PubMed]
  54. Singh, A.K. Major Development under Gaussian Filtering Since Unscented Kalman Filter. IEEE-CAA J. Autom. Sin. 2020, 7, 1308–1325. [Google Scholar] [CrossRef]
  55. Yang, S.; Wang, R.K.; Zhao, W.J.; Ke, Y.Z. 3D Intelligent Scissors for Dental Mesh Segmentation. Comput. Math. Method Med. 2020, 2020, 12. [Google Scholar] [CrossRef] [PubMed] [Green Version]
  56. Khalilov, M.; Timoveev, A. Performance analysis of CUDA, OpenACC and OpenMP programming models on TESLA V100 GPU. In Proceedings of the 4th International Conference on Computer Simulation in Physics and Beyond (CSP 2020), Moscow, Russia, 12–16 October 2020. [Google Scholar]
  57. Tang, Y.X.; Zhang, Y.Q.; Chen, H. A parallel shortest path algorithm based on graph-partitioning and iterative correcting. Comput. Syst. Sci. Eng. 2009, 24, 351–360. [Google Scholar]
  58. Martin, P.J.; Torres, R.; Gavilanes, A. CUDA solutions for the sssp problem. In Proceedings of the 9th International Conference on Computational Science (ICCS 2009), Baton Rouge, LA, USA, 25–27 May 2009; pp. 904–913. [Google Scholar]
  59. Cheng, Z.J.; Zhan, Z.; Xue, M.; Zheng, P.; Lyu, J.; Ma, J.; Zhang, X.D.; Luo, W.; Huang, H.; Zhang, Y.; et al. Public Health Measures and the Control of COVID-19 in China. Clin. Rev. Allergy Immunol. 2021, 1–16. [Google Scholar] [CrossRef] [PubMed]
Figure 1. The structure of the system.
Futureinternet 14 00040 g001
Figure 2. The establishment of RSSI fingerprint database.
Futureinternet 14 00040 g002
Figure 3. An example multi-graph.
Futureinternet 14 00040 g003
Figure 4. A graph about number limits.
Futureinternet 14 00040 g004
Figure 5. Dynamic congestion control.
Futureinternet 14 00040 g005
Figure 6. Divide the enclosed space into grids. “H” means high risk level, and “M” means medium risk level.
Futureinternet 14 00040 g006
Figure 7. An example for risk level changes.
Futureinternet 14 00040 g007
Figure 8. At each point, the tested errors were averaged. The y-axis is the average error.
Futureinternet 14 00040 g008
Figure 9. Perform location queries at a fixed point.
Futureinternet 14 00040 g009
Figure 10. Predicted locations obtained during walking.
Futureinternet 14 00040 g010
Table 1. Symbol table of the algorithm.
NameAbbreviation
Waiting Timew
Service times
Response Ratior
Modified Waiting Timef(w)
Modified Service Timef(s)
Table 2. Information about bookings.
Person NameBooking TimeService Time
A12:001 min
B12:014 min
C12:026 min
D12:040.5 min
Table 3. Process of the example in Table 2.
ABCD
12:00InNot ArrivedNot ArrivedNot Arrived
12:01LeftInNot ArrivedNot Arrived
12:02LeftInWaitingNot Arrived
12:03LeftInWaitingNot Arrived
12:04LeftInWaitingWaiting
12:05LeftLeftWaiting (r = 1.35)In (r = 1.59)
Table 4. The principles of risk level changes.
TExtremely HighHighMedium
0 < t 1   h Extremely HighHighMedium
1 < t 6   h HighMediumLow
6   h t < 1   day MediumLowLow
t 1   day MediumLowLow
Table 5. Speedup effects of different scales of a graph.
Graph ScaleSpeedup RatioIs Parallel Algorithm Faster
(10, 40)0.674No
(50, 200)1.158Yes
(200, 1000)1.645Yes
(1000, 5000)2.421Yes
(5000, 25,000)2.499Yes
Publisher’s Note: MDPI stays neutral with regard to jurisdictional claims in published maps and institutional affiliations.

