Article

Ambalytics: A Scalable and Distributed System Architecture Concept for Bibliometric Network Analyses

1
Institute of Clinical Epidemiology and Biometry, University of Würzburg, 97080 Würzburg, Germany
2
Institute of Databases and Information Systems, Ulm University, 89081 Ulm, Germany
*
Author to whom correspondence should be addressed.
Future Internet 2021, 13(8), 203; https://doi.org/10.3390/fi13080203
Submission received: 31 May 2021 / Revised: 30 July 2021 / Accepted: 30 July 2021 / Published: 4 August 2021
(This article belongs to the Special Issue Towards Convergence of Internet of Things and Cyber-Physical Systems)

Abstract

:
A deep understanding about a field of research is valuable for academic researchers. In addition to technical knowledge, this includes knowledge about subareas, open research questions, and social communities (networks) of individuals and organizations within a given field. With bibliometric analyses, researchers can acquire quantitatively valuable knowledge about a research area by using bibliographic information on academic publications provided by bibliographic data providers. Bibliometric analyses include the calculation of bibliometric networks to describe affiliations or similarities of bibliometric entities (e.g., authors) and group them into clusters representing subareas or communities. Calculating and visualizing bibliometric networks is a nontrivial and time-consuming data science task that requires highly skilled individuals. In addition to domain knowledge, researchers must often provide statistical knowledge and programming skills or use software tools having limited functionality and usability. In this paper, we present the ambalytics bibliometric platform, which reduces the complexity of bibliometric network analysis and the visualization of results. It accompanies users through the process of bibliometric analysis and eliminates the need for individuals to have programming skills and statistical knowledge, while preserving advanced functionality, such as algorithm parameterization, for experts. As a proof-of-concept, and as an example of bibliometric analyses outcomes, the calculation of research fronts networks based on a hybrid similarity approach is shown. Being designed to scale, ambalytics makes use of distributed systems concepts and technologies. It is based on the microservice architecture concept and uses the Kubernetes framework for orchestration. This paper presents the initial building block of a comprehensive bibliometric analysis platform called ambalytics, which aims at a high usability for users as well as scalability.

1. Introduction

The overall goal of science is to gather insights about reality through observation and experimentation and to predict events based on natural laws, i.e., to produce new knowledge about aspects of reality. Such knowledge is mainly articulated through the publication of documents, such as articles published in academic journals. In addition to the full text, those documents contain bibliographic information that helps to locate and categorize them, e.g., the date when a document was published or its authors. Bibliographic information on academic publications is made available by bibliographic data providers.
This information is utilized by a quantitative approach for literature analysis, which is denoted with bibliometric analysis [1]. While traditional literature reviews are a time-consuming and manual task that only provides insights into a field of research on a sample basis, researchers can conduct a bibliometric analysis of a field of research to acquire quantitatively profound knowledge in a rather short period of time. It is valuable—often indispensable—for academic researchers to have a deep understanding of a field of research in a quick and efficient manner, even if the body of knowledge encompasses a vast number of research works.
In addition to technical knowledge, this also includes knowledge about subareas, open research questions, and social communities (networks) of individuals and organizations. This knowledge then helps researchers to position themselves within the field, find new collaboration partners, and find open problems to work on. Furthermore, bibliographic information is used to calculate metrics that influence the evaluation of the academic output of individuals, institutes, universities, and countries.
Bibliometric analyses are a data science method. As with most data science methods, it requires the individuals applying it to have three skills: statistical knowledge, programming skills, and domain knowledge [2]. However, not every academic researcher can have all of these skills at the same time. In addition, conducting bibliometric analyses are time-consuming without the help of capable software. Consequently, there is a demand for software systems providing comprehensive bibliometric analysis functionality. These systems, in the best case, pose a high usability, while not demanding programming skills and deep statistical knowledge [3].
To the best of our knowledge, there is a lack of such tools. Either tools require statistical knowledge and programming skills [4], or they focus on certain bibliometric analysis techniques—and thus do not provide comprehensive functionalities [5,6,7], they do not support a wide range of data providers [8], they do not cover a wide range of academic fields [9], or they do not much consider usability aspects [10].
Toward the goal of filling this gap, we developed ambalytics, a web-based platform that simplifies conducting bibliometric network analyses and the visualization of results through the automation of parts of the required data science process. Additionally, it accompanies users through bibliometric analyses and eliminates the need for individuals to have programming skills and statistical knowledge, while preserving advanced functionality such as algorithm parameterization. As a proof-of-concept, the calculation of research fronts networks is implemented using Microsoft Academic as a bibliographic data provider [11].
Being designed to scale, ambalytics makes use of distributed systems concepts and technologies. It is based on the microservice architecture concept and uses the Kubernetes framework for orchestration. In this work, ambalytics is presented in more detail for the first time to convey its basic mode of action and how this can contribute to conduct bibliometric analyses more easily:
  • A technical description of the generation process of hybrid research fronts is presented, which can then be used as a development blueprint for other calculation opportunities of bibliometric analyses.
  • A derivation of user stories and functional requirements based on interviews is provided to better show the needs of the interested users.
  • A computing schema to support ad hoc as well as batch-oriented bibliometric analysis tasks is presented and discussed.
  • A system architecture concept to support scalable and distributed bibliometric analyses is presented.
To conclude, this paper illustrates the first prototype of ambalytics, which constitutes our initial building block of a comprehensive bibliometric analysis platform that goes beyond bibliometric networks, offers support for various data providers, considers usability, and is scalable.
The remainder of this paper is organized as follows: in Section 2, relevant background information is provided, while Section 3 presents the overall concept of ambalytics. Section 4 discusses the currently achieved status of ambalytics, including related works, whereas Section 5 concludes the paper.

2. Bibliometric Analysis

New scientific knowledge is mainly communicated through the publication of documents, e.g., through articles in scientific journals or patent specifications. In addition to the full text, these documents also contain bibliographic information that helps to categorize and find them [1]. Figure 1 shows an exemplary conference proceeding’s publication with its bibliographic information (orange) and its full text (gray). The publication contains bibliographic information, such as the name of the conference, the paper title, information about the authors, the abstract, the publication date, keywords and references. The references, in turn, constitute a list of other publications, which the publication in question cited.
Definition and Classification: Bibliographic information about documents may be analyzed statistically: Bibliometrics is the research domain that concerns itself with the statistical analysis of bibliographic information. If bibliometric methods are applied to bibliographic information originating from academic publications, the term scientometrics is used sometimes. A generalization of bibliometrics is informetrics, a research domain that addresses the quantitative analysis of communication processes in general. Another subdomain of informetrics that analyses internet data is webometrics [1]. The subdomain of bibliometrics that defines a quantitative approach for literature research is called bibliometric analysis [13]. Within this work, the term bibliometric analysis (or bibliometric analyses) is used whenever statistical methods to analyze bibliographic information of academic publications are discussed.
Applications: Bibliometric methods are applied in multiple areas. According to [14], a bibliometric analysis is part of the methodology used to evaluate research, e.g., influencing how university rankings are calculated. In order to evaluate research, bibliometric indicators for the productivity, impact, and cooperation of scientists, institutions, and countries are used. The evaluation results form an impartial, quantitative basis of decision-making, e.g., justifying decisions regarding academic project funding.
Bibliometric concepts are also implemented in the field of information retrieval, a field of research that is dealing with “finding material (usually documents) of an unstructured nature (usually text) that satisfies an information need from within extensive collections” [15]. Bibliometric analyses help to discover the structure and dynamics of science itself, also known as the science of science [1]. In addition to these applications, new applications arose, for which bibliometric analyses are used, e.g., to detect future developments in fields of research [16] or for technology foresight [17].
Results and Limitations: By conducting bibliometric analyses, new knowledge can be acquired, such as:
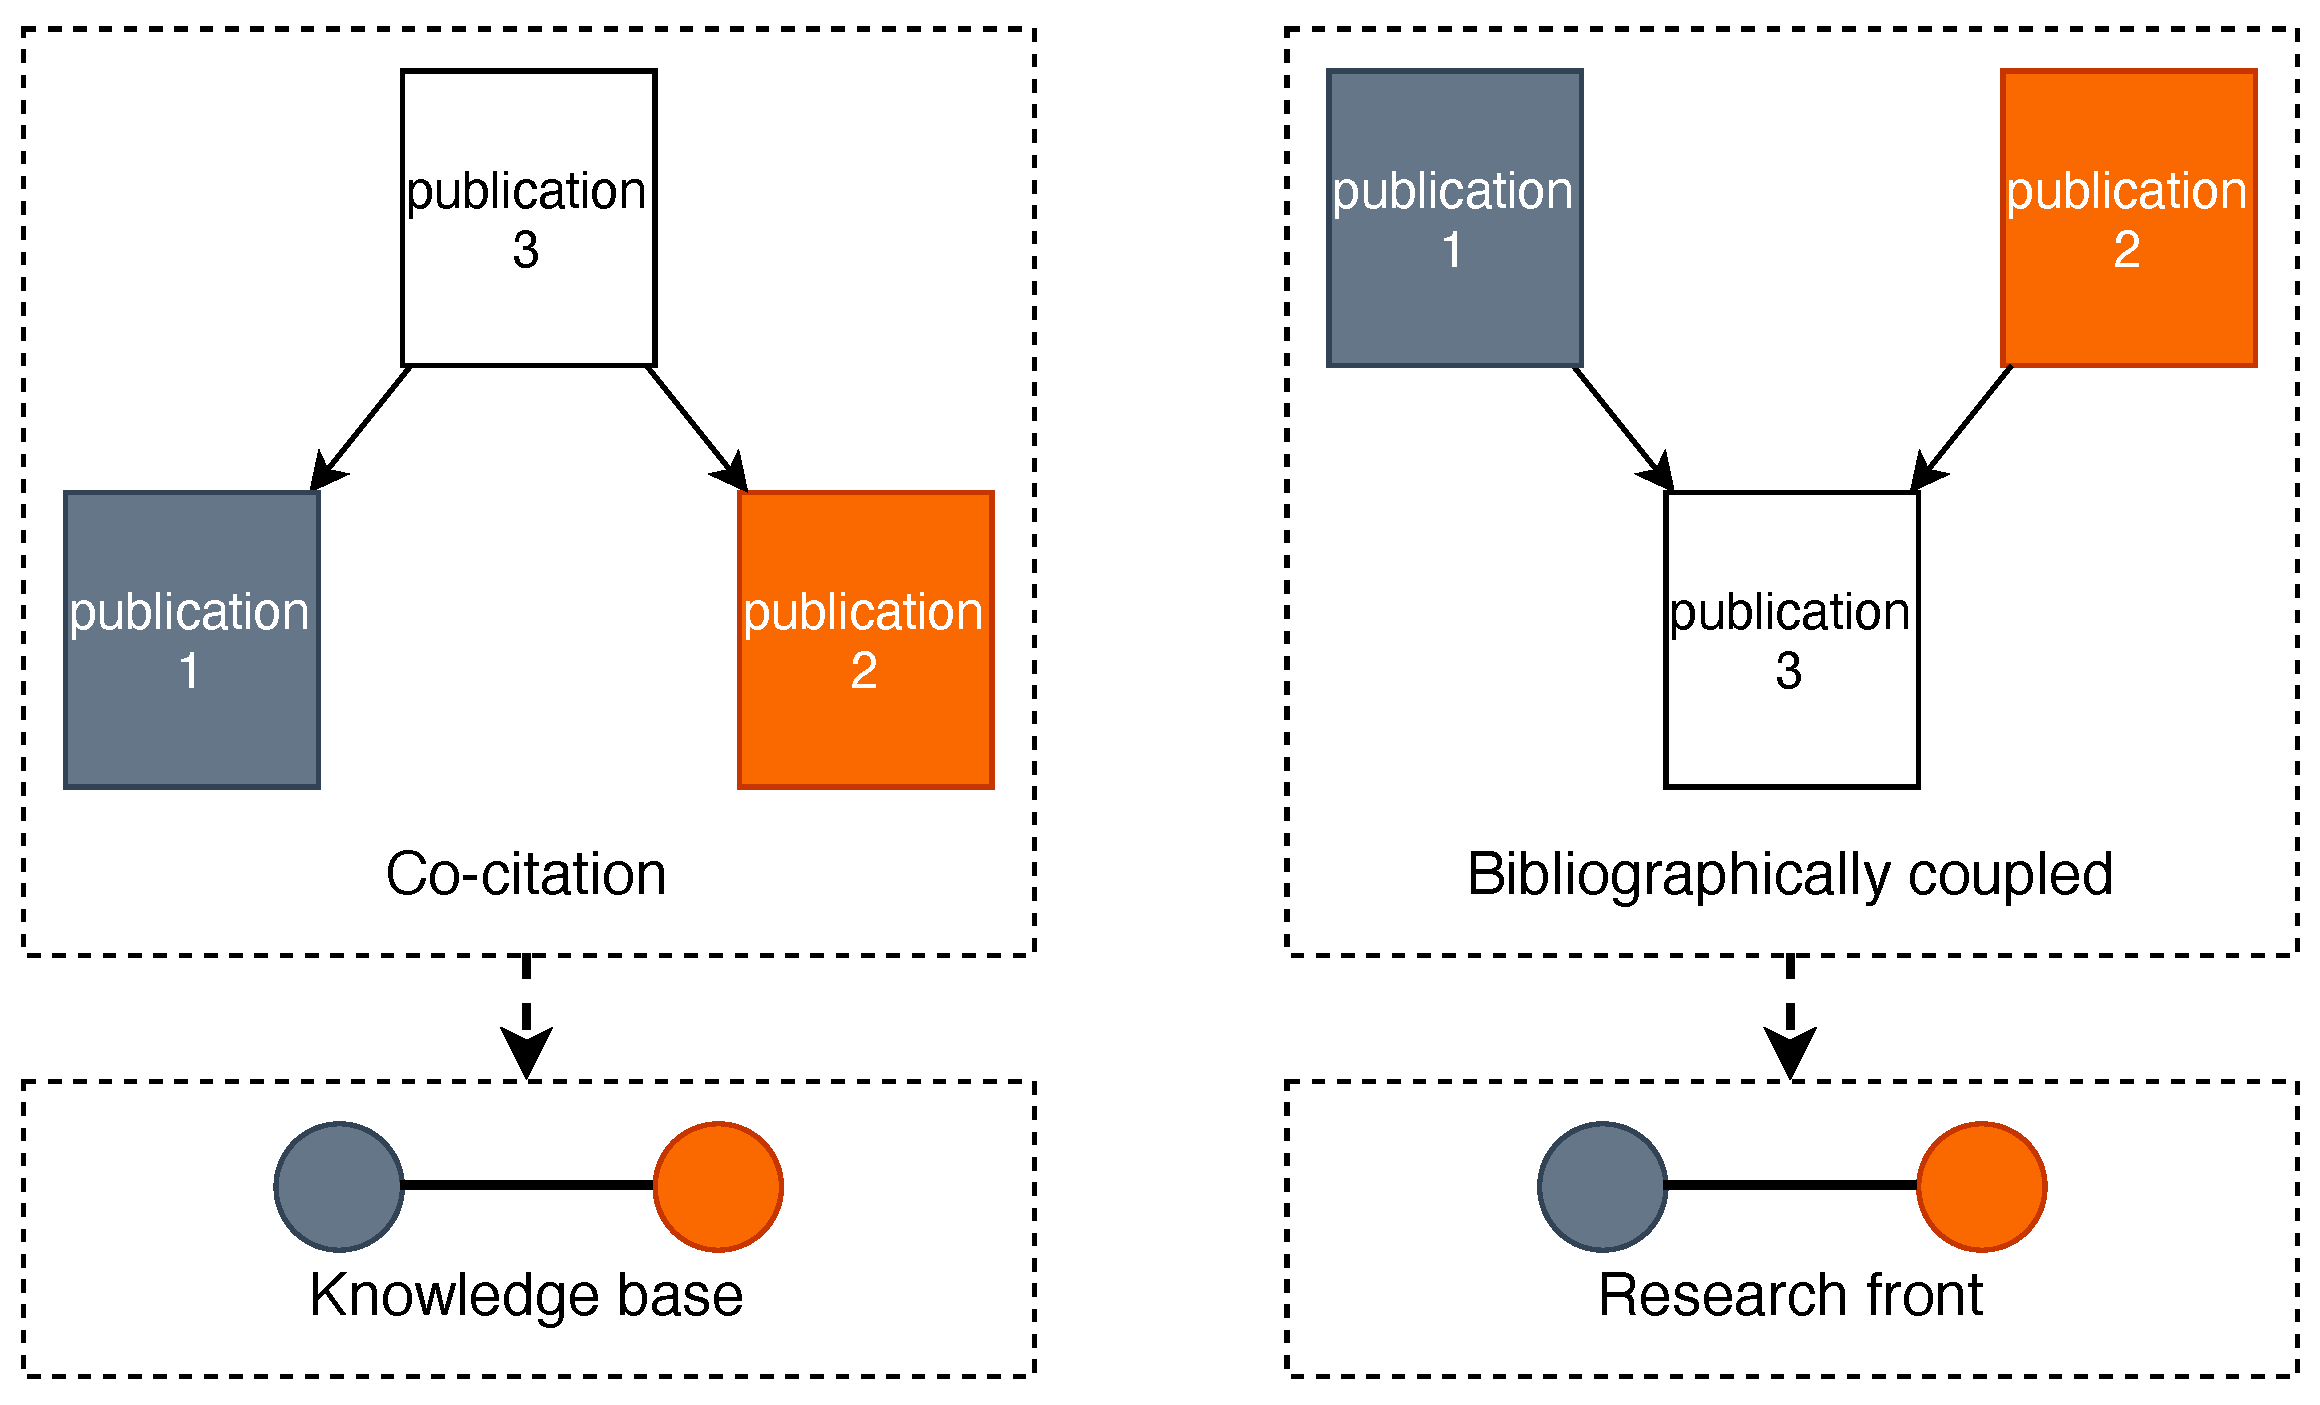
  • Knowledge Bases: Groups of academic publications in a field of research on which the field is based on.
  • Research Fronts: Groups of academic publications in a field of research that concern themselves with similar unsolved research problems.
  • Classics: Academic publications that are outstanding and have a great impact on a field of research.
  • Field Players: Authors, organizations, or countries significantly contributing to a field of research, and thereby their cooperation dynamics can be analyzed.
On the other hand, the interpretation of bibliometric analyses results is limited by several factors [16]:
  • Hidden Knowledge: Scientific knowledge is not always published in the form of academic publications or even published at all. Furthermore, qualitative findings, such as expert opinions, are often not taken into account by bibliometric analyses.
  • Dataset Creation: Every bibliometric analysis is based on a dataset of documents that has to be acquired in some way. Typically, publication databases are queried, and the results are extracted. The query terms used for data collection affect bibliometric analyses results.
  • Time Delay: The data available in publication databases is a snapshot of academic knowledge, which does not fully represent the current state of the art, as it takes up to two years for research findings to be published and listed in those databases.
  • Publish or Perish: As the number of publications and citations have some influence on the evaluation of authors and institutions, a co-authorship might not reflect actual collaborations [1]. In addition, self-citations and citations in review publications may not be content-specific.
While bibliometric analyses are also concerned with statistical distributions, models, and indicators, the focus of this work is set to bibliometric networks.

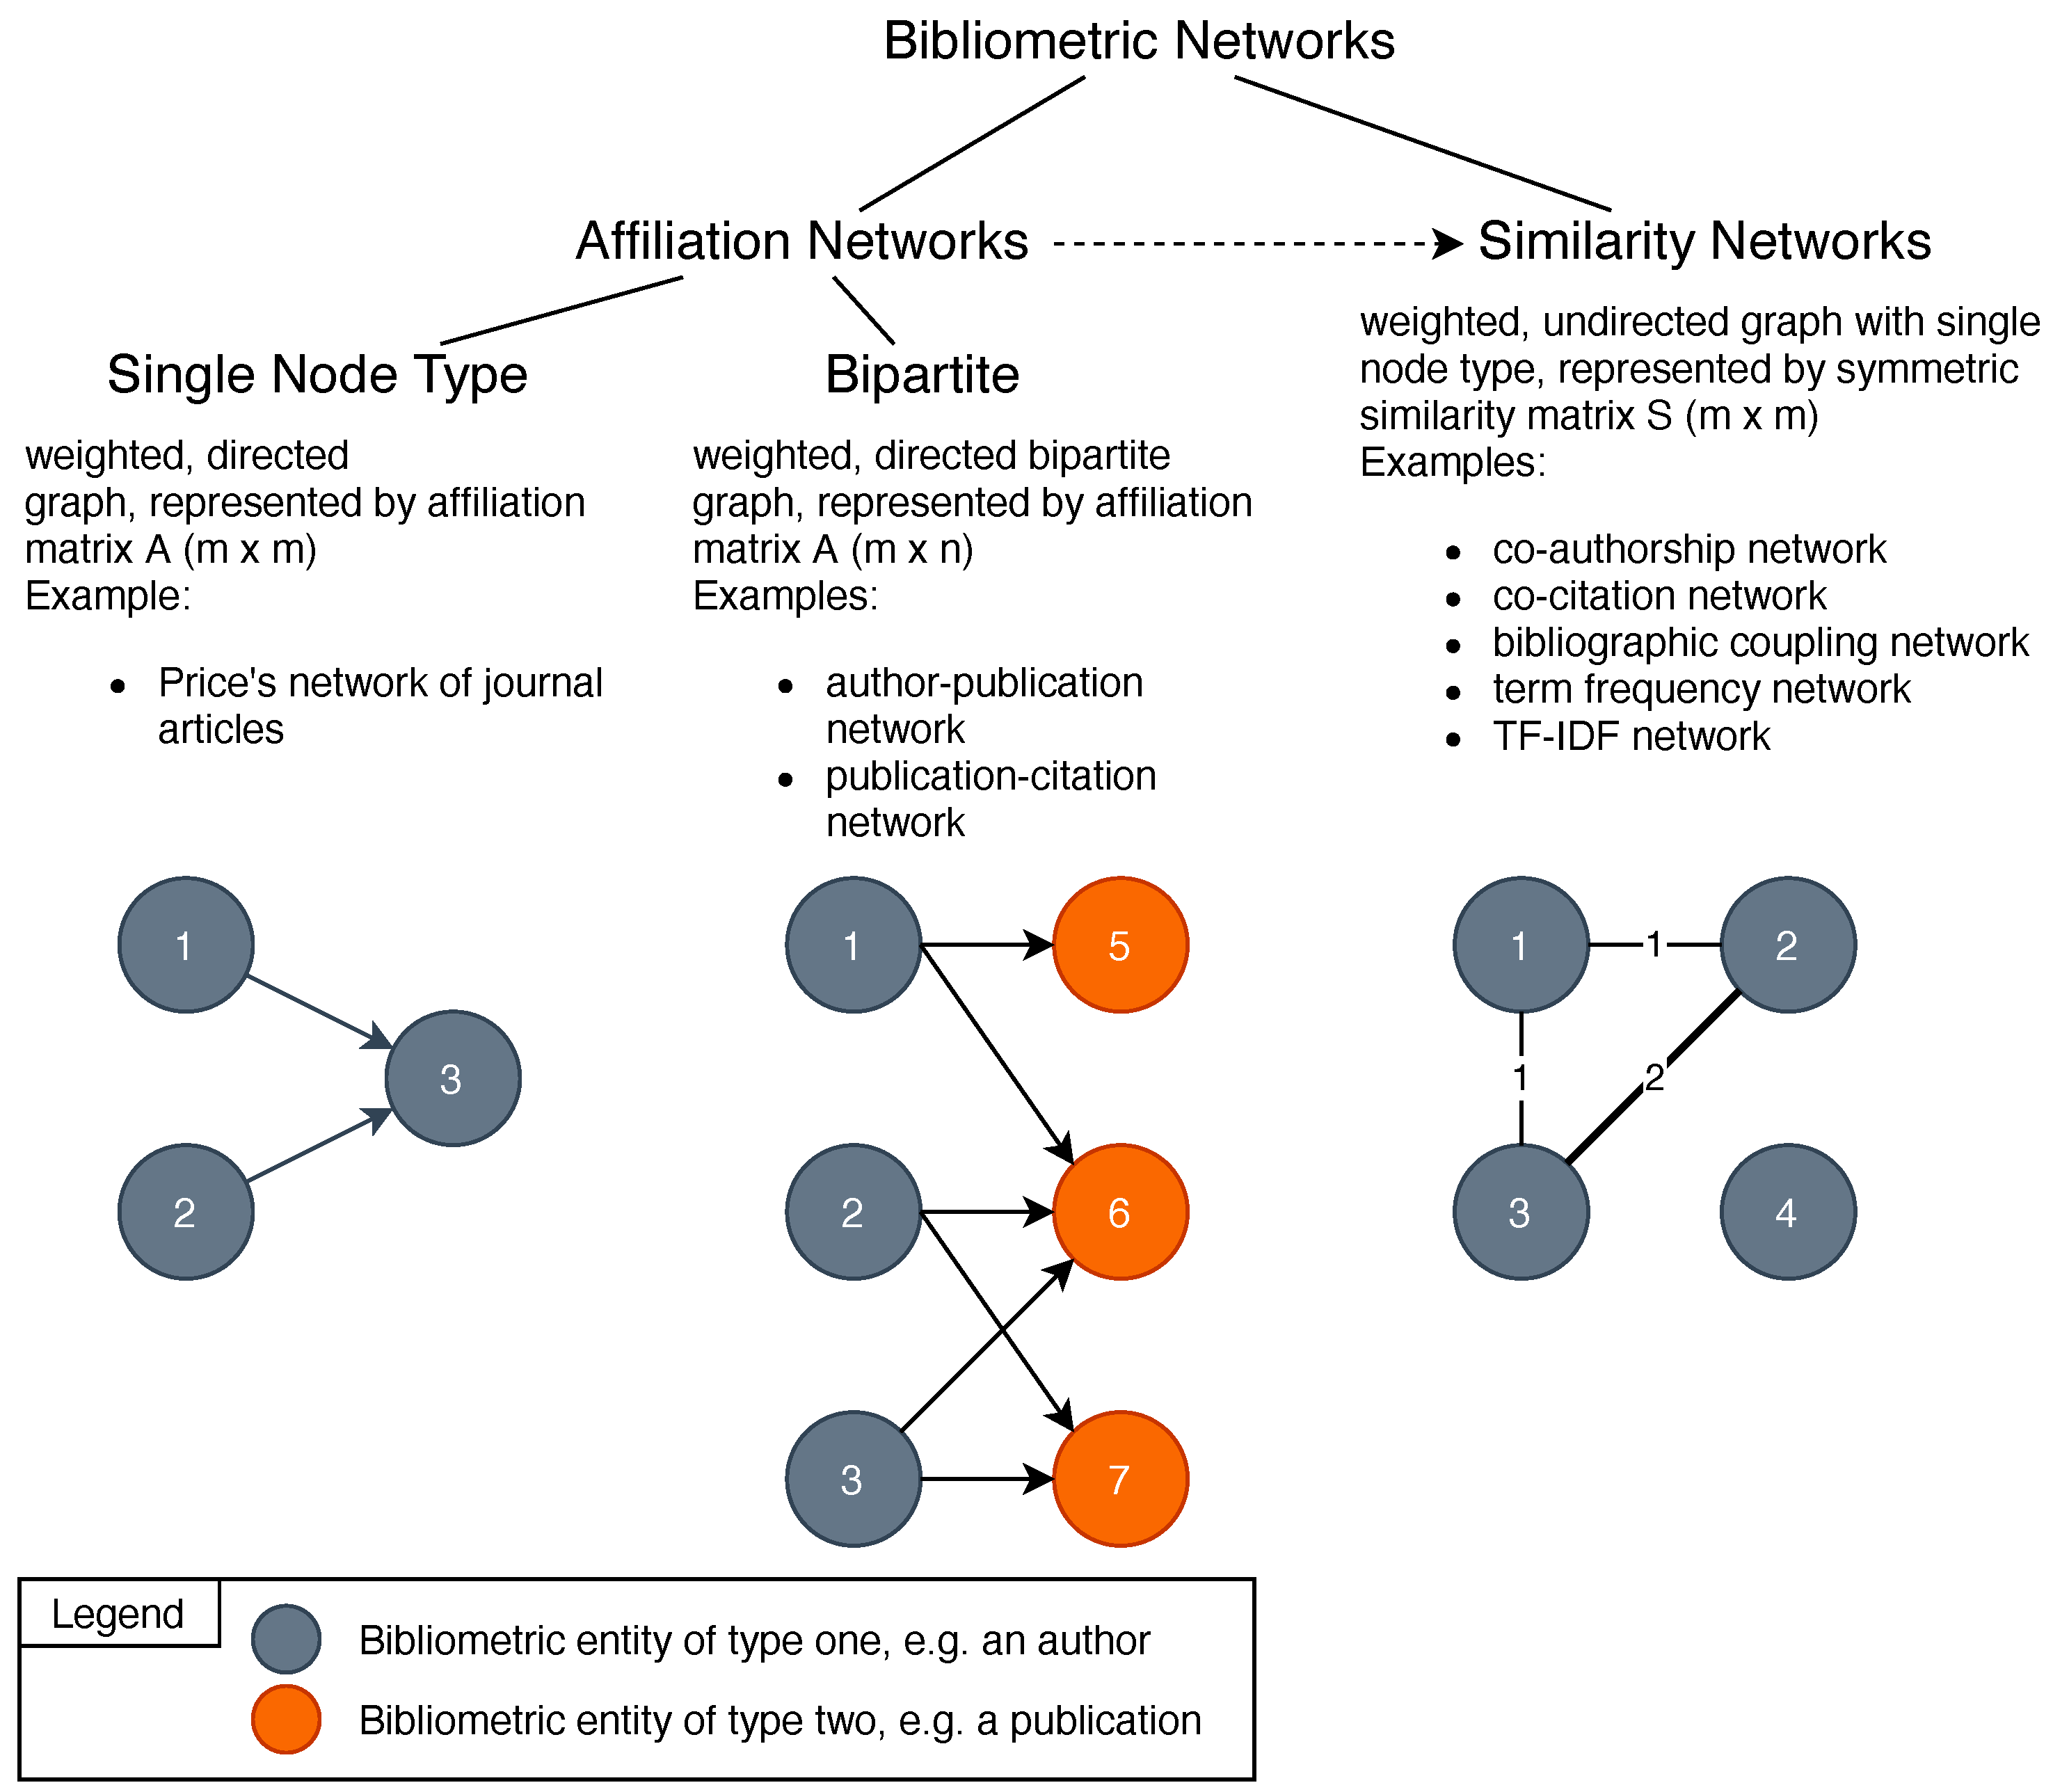
2.1. Bibliometric Networks

Among others, bibliometric analyses deal with networks of bibliographic entities. Bibliometric networks describe affiliations or similarities of bibliographic entities, such as academic publications, authors, journals, institutions, countries, or keywords, and are used to find groups of similar entities and relations to other entities or groups. In 1965, Price [18] investigated the citation behavior of journal articles and started the field of bibliometric networks by depicting a network of journal articles.
A minimalistic example of an article network is shown in Figure 2. Price’s network shows journal articles as nodes and citations among the articles (sometimes also called references, but used synonymously here) as directed edges, i.e., there is an edge from node one to node two if node one cites node two. In case of the shown network, articles one and two both cite article three. Mathematically, an article network can be represented by the adjacency matrix of its underlying directed graph.
Based on the idea of [18], different bibliometric networks arose. In general, there are two groups of bibliometric networks: affiliation networks and similarity networks (see Figure 2). Affiliation networks describe the membership of bibliographic entities, while similarity networks express similarities between bibliographic entities.
Affiliation networks are represented by a weighted, directed graph whose nodes represent bibliographic entities of any type. Most common are bipartite affiliation networks, which depict a bipartite graph, i.e., there are only two types of nodes in the graph, and nodes of the same type must not be directly connected. A bipartite graph can be represented by a matrix A of size m × n , with m denoting the number of nodes of type one and n denoting the number of nodes of type two. The entry a i j of A yields the value of the affiliation from the i t h node of type one to the j t h node of type two.
Bipartite affiliation networks are named after their entity types, e.g., in an author–publication network, the nodes either depict an author or a publication, while the edges represent an affiliation from an author to a publication or vice versa. An intuitive example of such an affiliation is an edge in the graph from an author to a publication if the author has written the publication. Price’s network of journal articles can be considered a special type of affiliation network with articles as the only entity type occurring in the network.
In contrast, similarity networks are weighted, undirected graphs. Every node of the graph represents an entity of the same type, e.g., all nodes represent authors. The nodes are connected by weighted, undirected edges, depicting the similarity between the connected nodes. These similarities are calculated by using a similarity measure expressing the similarity of two bibliographic entities. A similarity network is represented by its similarity matrix S, being the graphs’ adjacency matrix of size m × m , with m depicting the number of nodes of the graph. Each entry s i j of S describes the similarity between node i and node j. As adjacency matrices are quadratic, the graph of a similarity network is undirected, and S is symmetric.
Dependent on the bibliographic entity type, different similarity measures can be used. An example of a similarity measure for authors is co-authorship. The co-authorship between two authors is defined by the number of academic publications they have published together. In order to measure the similarity of publications, co-citation and bibliographic coupling are commonly used, as well as some lexical measures.
A co-citation of two publications is given if both publications are cited by a third publication, while two publications are bibliographically coupled if one or more citations of them are similar [1]. Similarity networks are named after the similarity measure used to calculate the similarities, e.g., a co-authorship network is a network whose nodes represent authors and whose edges represent their similarity based on the co-authorship measure.
Many similarity networks can be calculated based on a bipartite affiliation network. Consider a bipartite similarity network with m nodes of entity type one and n nodes of entity type two. As stated above, such a network is represented by the matrix A of size m × n . A similarity network for entity type one can be calculated by S 1 = A A T and a similarity network for entity type two by S 2 = A T A [1].

Publication Networks

Every bibliometric network that contains academic publications as nodes is considered to be a publication network. For publications, the affiliation network is described by a binary matrix A p c of size m × n , with m denoting the number of publications of a given dataset, and n, denoting the amount of disjoint citations that are listed in the publications. Every entry a i j yields whether the publication i has cited the citation j or not. A co-citation of two publications is given if both publications are cited by a third publication [1] (see Figure 3). The two publications are then considered a knowledge base [13]. In a co-citation network, the similarity matrix S c c is calculated by S c c = A p c T A p c with size n × n [1].
Bibliographic coupling is another similarity measure for academic publications. If one or more citations of two publications are similar, the two publications are considered bibliographically coupled [1] (see Figure 3). Bibliographically coupled publications form a research front [13]. To compute a bibliographic coupling network, the same bipartite graph and, thus, matrix A p c as for co-citation networks is used; however, the similarity matrix S b c is given by S b c = A p c A p c T with size m × m [1].
In addition to those two similarity measures, which are based on the citations of publications, lexical measures can be used to define the similarity of publications. Lexical measures compare the textual content of publications, such as their title, keywords, abstract, and full text. If two publications contain the same word, they are connected by the latter. In information retrieval theory, term occurrences in documents are described by a document-feature-matrix (DFM) A t f whose entry a i j yields a term frequency, i.e., how often publication i contains word j.
As a DFM has the same properties as an affiliation matrix of a publication-word network, A t f can be used to describe this affiliation network. The similarity matrix of the term frequency network is then given by S t f = A t f A t f T [1]. In order to optimize the results, special characters and stop words in publication texts may be removed, and the remaining words may be compressed before A t f is created [13].
Lexical similarity measures pose a problem that needs to be addressed: simple counting of words (which is done when creating a DFM) favors those words that often occur within many publications, which may be counterproductive, as those words may not reflect an interesting similarity between publications. Intuitively, more meaningful are words that often occur in only a few publications. To account for this problem, the term frequency-inverse document frequency (TF-IDF) measure can be used [19]. Let m be the number of publications and n the number of disjoint words, which occur in any of the m publications, W a matrix of size m × n with entries w i j and I D F a vector of length n. The inverse document frequency (IDF) is defined as [19]:
I D F j = l o g ( n a i j )
and the entries of the TF-IDF matrix W are defined as
w i j = a i j I D F j
Given the IDF, an improved lexical similarity measure can be used to create a TF-IDF network by calculating its similarity S t f i d f = W W T .

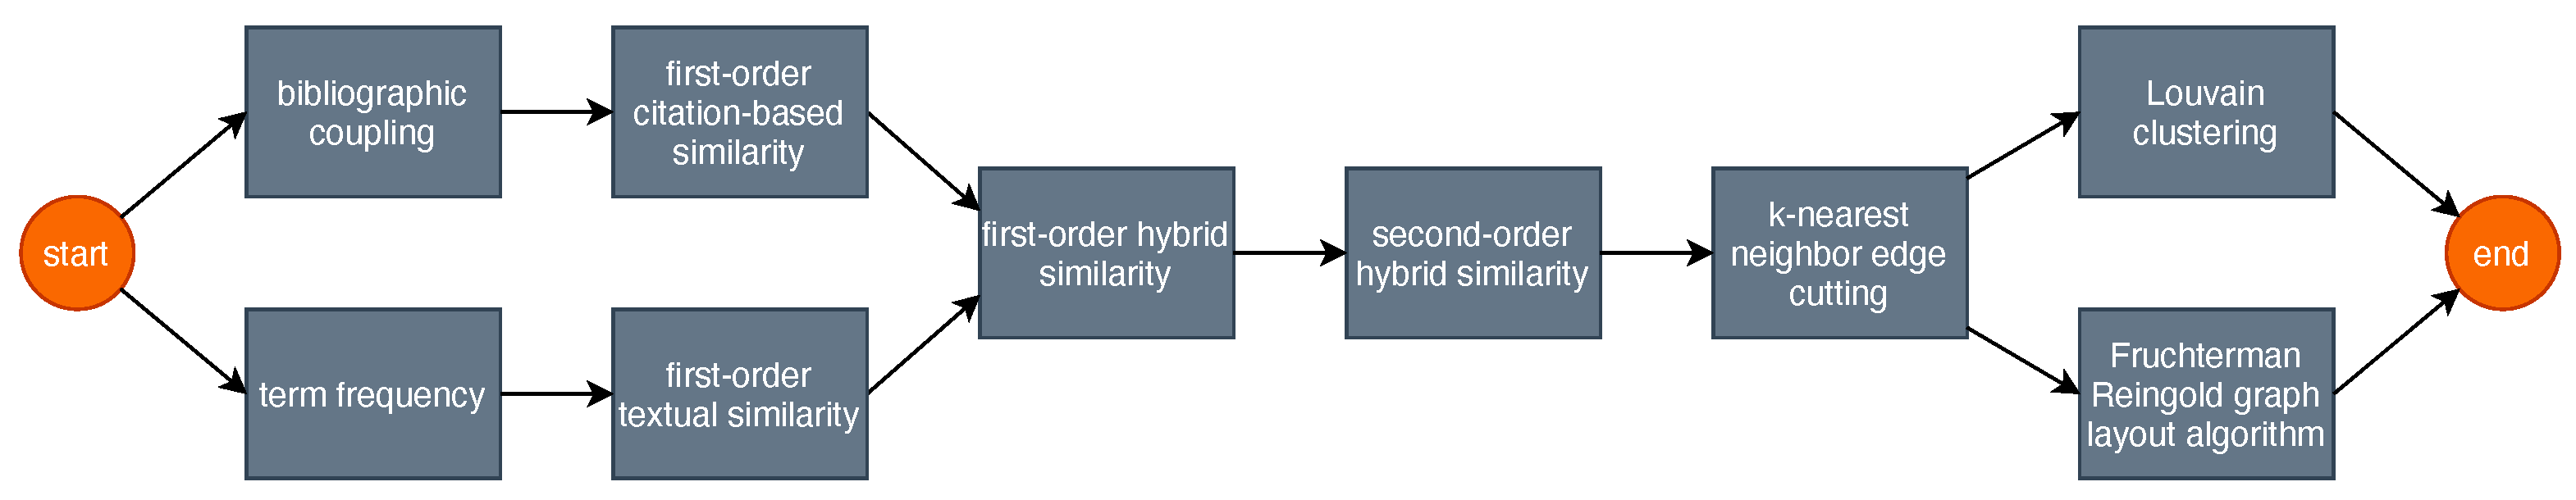
2.2. Computing Hybrid Research Fronts

Academic researchers are interested in obtaining an overview over current research fronts in their field of research [13]. As stated previously, research fronts consist of academic publications, which are linked through their citations. Here, the term research front is used in a more general way, i.e., to describe an upcoming field of research or topic that is formed from similar publications. Bibliometric techniques can be used to find these research fronts.
Following this, the idea is to find groups of academic publications that are similar in that they deal with similar research problems. As introduced in the previous section, similarity networks of academic publications express similarities between academic publications. On the basis of those similarities, groups of publications (clusters) can be formed and visualized. As a dataset typically contains several thousand publications, the visualization of the found clusters becomes challenging, and this must be addressed.
One approach to find research fronts based on publication similarity networks is described in the following (see Figure 4) [13,17,20]. As a similarity measure, a citation-based measure is combined with a lexical measure. As a citation-based measure, bibliographic coupling is combined with TF-IDF by treating citations of a publication the same way as terms, resulting in a document–citation-matrix D C M ( 0 ) [20]. As a lexical measure, TF-IDF is applied to the terms occurring in the title, abstract, and keyword list of a publication, resulting in a weighted document–term-matrix D T M ( 0 ) [20].
Salton and McGills’ [21] cosine measure is then applied to both matrices resulting in first-order similarity matrices D C M ( 1 ) and D T M ( 1 ) , which hold similarities that are normalized to the range [ 0 , 1 ] . The similarity matrices are first-order similarity matrices, as two documents are considered similar in the first order if they are both similar to a third document. Similarly, two “documents are similar in the second-order, if they are both similar to a third document in the first order” [17]. Next, the first-order similarity matrices are reduced to a first-order hybrid similarity matrix H S ( 1 ) by applying Glänzel and Thijs’ method [22] of calculating hybrid similarities by a linear combination of the angles of D C M ( 1 ) and D T M ( 1 ) . To obtain a second-order hybrid similarity matrix, H S ( 2 ) , Saltons and McGills’ cosine measure is applied to H S ( 1 ) as well [20].
Furthermore, k-nearest neighbor edge cutting is applied to H S ( 2 ) , i.e., only the k edges with the k-largest weights per row and column are retained, resulting in the sparse matrix S M . By edge cutting, the computation time of the following algorithms can be significantly reduced. Based on S M , topical communities are computed using the Louvain method (see Section 2.3). Concurrently, a graph layout can be computed, and the result is a publication similarity network that can be visualized, for example, by utilizing force-directed graph drawing algorithms. An example of a graph visualization that has been computed with the 3D variant of the Fruchterman–Reingold algorithm is given in Figure 5, in which hybrid research fronts are visualized.

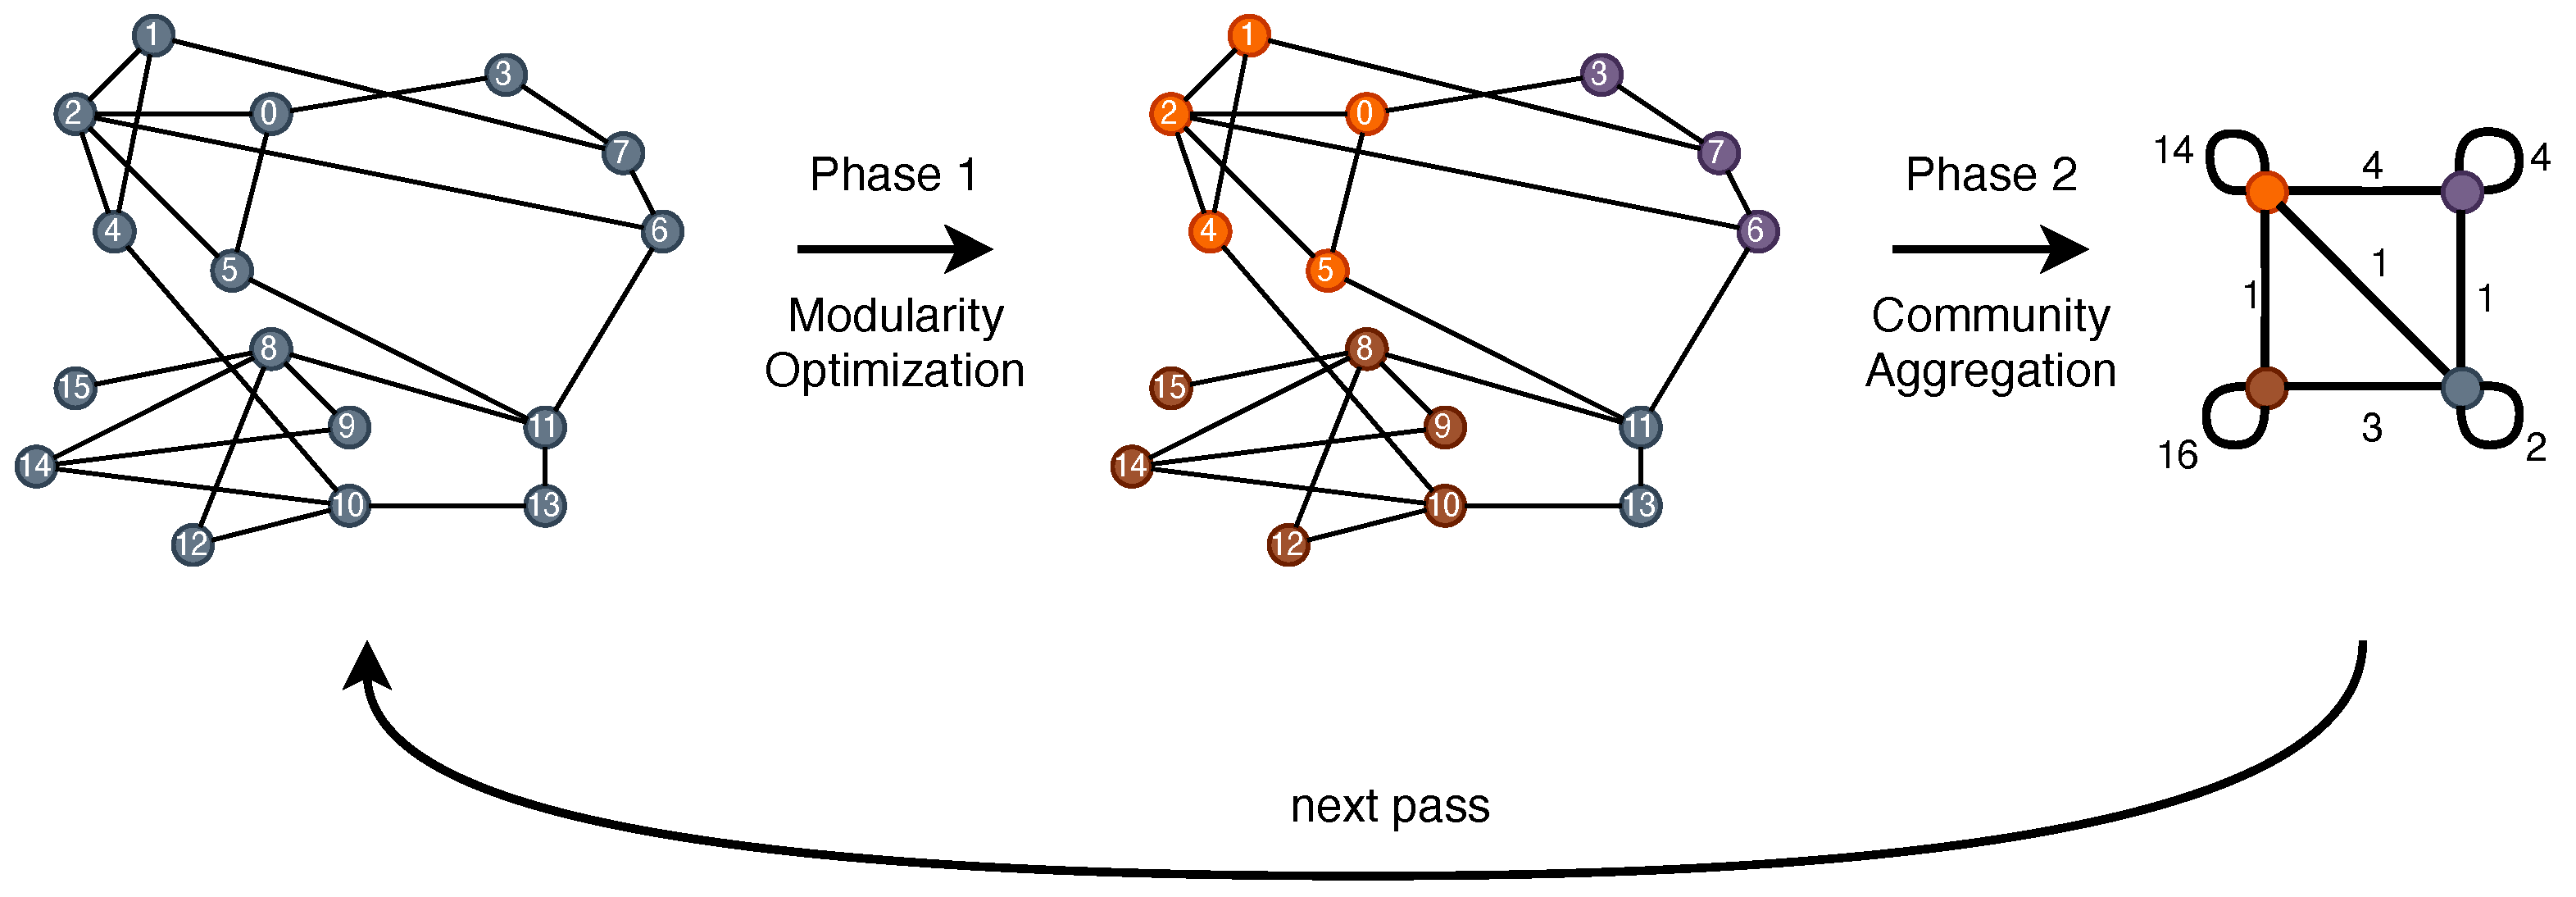
2.3. The Louvain Algorithm for Community Detection in Graphs

Structured data “where graphs are the fundamental structural representation of the data” [23] is called graph data. The goal of a cluster analysis is to extract structure from seemingly unstructured data [24] by putting similar data points into groups, so-called clusters. The idea is that data points within a cluster are alike, while data points from different clusters are not alike. In order to measure the distance or similarity between any two data points, a distance or similarity measure has to be defined for the given dataset [25].
There are different clustering methods, such as hierarchical-, partitioning-, fuzzy-, probabilistic-, and neuronal clustering. In hierarchical clustering, data points of a dataset are not partitioned into a fixed number of clusters. Instead, a series of partitions are computed. In every step of the series, the number of clusters may be decreased in the case of agglomerative clustering or increased in divisive clustering [25]. The Louvain method used within this work is a hierarchical clustering algorithm.
Community detection in graphs is closely related to graph clustering. While graph clustering is the more general concept of dividing a graph into multiple groups so that they share similarities, community detection in graphs depicts the sub-problem of finding groups of nodes having high interconnection among each other while having few connections to other nodes outside the group. Often, sparse connections are assumed for community detection [26]. The main characteristic of community detection is that the clusters (in this case, they are called communities) are not formed based on a similarity measure, defined for each pair of data points, as it is the case for standard cluster algorithms, but based on edge density [27].
The average edge density of a graph is the ratio of the total amount of edges in the graph and the maximum number of possible edges. The intra-cluster edge density of a cluster is the ratio of the number of edges inside the cluster and the number of possible edges inside the cluster. The inter-cluster edge density of a cluster is the ratio of the number of edges running from nodes of the cluster to the rest of the graph and the number of possible edges running from nodes of the cluster to the rest of the graph [27].
There is no formal definition of a community. However, the intra-cluster edge density inside a community should be larger than the average edge density, and the inter-cluster edge density should be smaller than the average edge density. Under this condition, a subgraph qualifies as a community. Consequently, community discovery aims to find a graph partition such that there are a high number of edges inside the communities and few edges going from nodes inside the communities to nodes outside the communities. More formally, the goal is to achieve large intra-cluster edge densities at small inter-cluster edge densities for a given graph partition [27].
A metric for measuring intra-cluster edge density versus inter-cluster edge density is called modularity, and is a scalar value between −1 and 1. For weighted graphs, i.e., the edges of the graph have weights, the modularity is defined as
Q = 1 m i , j ω i j k i k j m δ ( c i , c j )
with
m = i , j ω i j k i = j ω i j δ ( c i , c j ) = 1 , if c i = c j 0 , otherwise
where ω i j is the weight of the edge going from node i to node j, m is the sum over all weights in the network, k x is the sum of all weights of the edges at node i, and c i is the community node i is assigned to. In the case of a weighted graph, the goal of community detection can be reformulated to the problem of maximizing the modularity of a given graph [28].
As exact modularity maximization is computationally hard, an approximation algorithm is needed to deal with large graphs. One such approximation algorithm that implements modularity maximization for weighted graphs is the Louvain algorithm. This is an agglomerative clustering method, as communities are formed by merging similar nodes, and thus it is an unsupervised data mining method. The authors of the algorithm suggest that the complexity is linear on sparse graphs [28].
The algorithm consists of two phases, which are repeated iteratively (see Figure 6). The initial state is a weighted graph of n nodes where each node forms its community. In the first phase, for each node, all its j neighbors are considered. The gain in modularity is calculated for all neighbors when node i would leave its community and would join the community of node j. The node i is then placed into the community where the modularity gain is maximal, on the condition that the modularity gain is positive.
Otherwise, the node i stays in its community. This is applied repeatably for all nodes until no further gain in modularity can be achieved [28]. In the second phase, a new graph is created, having the communities formed in phase one as its nodes. The weight of an edge between two nodes in the new graph is calculated by summing up the weights of the edges between their communities. Similarly, the weights of the edges between nodes in the same community are summed up, and the result is used as the weight of a self-loop edge.
After the second phase, the next pass is done. Following this, the algorithm starts again with the first phase by replacing the initial graph with the one formed in phase two. This is repeated until no additional modularity gain is achieved, i.e., by finding the local maximum modularity. After each repetition of the two phases, a graph of communities is created, holding fewer but larger communities from repetition to repetition. Finally, every data point is assigned to a community [28].
An example visualization of a similarity network is shown in Figure 7. It shows 3000 academic publications. Each color represents a community, computed by the Louvain method. The (x,y) coordinates of the publications were computed with the Fruchterman–Reingold algorithm, which was run for 100 iterations. Every cluster is a research front candidate, e.g., it could depict an upcoming topic of research. With this technique, research fronts may be identified that were not known by the researcher previously.

2.4. Bibliometric Analysis Process

In order to identify relevant research fronts in the area of equipment maintenance systems, [13] provided a bibliometric analysis process that can be followed, consisting of ten steps. Based on this process, the Knowledge Discovery in Databases (KDD) process, the workflow given in [29], and the statements given by an expert interview, a general-purpose process of bibliometric analysis is provided in the following (see Figure 8).
At the start of a bibliometric analysis, its goals have to be set (1), i.e., the type of results that are expected must be defined, e.g., finding research fronts and knowledge bases. Next, a dataset has to be collected (2). Therefore, one or many data sources need to be selected. Frequently used bibliographic data providers are Web of Science, Google Scholar (scholar.google.com (accessed on 6 May 2021)), Scopus (scopus.com (accessed on 6 May 2021)), Microsoft Academic (academic.microsoft.com (accessed on 6 May 2021)), and Science Direct (sciencedirect.com (accessed on 6 May 2021)). This step also includes the definition of query strings that are used to find publications in the databases.
Then, the raw data needs to be extracted from these databases. Afterward, the data are preprocessed (3). This usually encompasses data cleansing, e.g., removing duplicates and incomplete records, enriching the dataset with data from further information sources, and, in the case that multiple data sources are used, merging the raw data. Based on the defined goals, some bibliometric algorithms are selected and executed to compute (4) and visualize (5) the results. In the end, the results must be interpreted (6).
As in the KDD process, it is possible and may be necessary to go back a step at any time in the process. For example, when visualizing research fronts with the Fruchterman–Reingold algorithm, the parameter of the number of iterations has to be set. If the first parameter selection leads to an unsatisfying visualization, it may be adjusted and rerun. Furthermore, having finished a bibliometric analysis, it may be done again at some point in the future to keep track of the field of research.
In the introduction, two important aspects were discussed. First, we delineated how bibliometric analyses essentially work and what aspects, including limitations, must be considered when creating a technical solution. As shown, for this work, we focus on the calculation of hybrid research fronts (important part of bibliometric networks), and therefore the important aspects are conveyed. Based on this, we discussed how hybrid research fronts are supported by ambalytics.
This means that the essential procedure to calculate them is presented, see Figure 4. Then, we show how the procedure is incorporated by ambalytics, see Figure 8. As for many other domains [30], the shown principle can be considered as the standard operating procedure (SOP) in this context. SOPs, in turn, are a powerful instrument to see in a comparable way how parts of a system work. In the following, we demonstrate how ambalytics technically implements the SOP of hybrid research fronts.

3. Ambalytics Bibliometric Platform

In order to enable the calculation of hybrid research fronts and make their creation available to non-technical users, a web-based system architecture was created. In the following, the goals, challenges, and requirements for the architecture are described. Then, the concrete concept and its technical implementation are described. To obtain a better understanding of the general needs and demands of users, a survey was conducted, which is described in this section at first.

3.1. Objectives and Challenges

Based on a qualitative user survey with 21 participants, the following objectives were identified in developing a solution for bibliometric analyses:
The system should provide an easy-to-use and web-based interface. It should provide the entire process of creating a bibliometric analysis as an integrated solution. This includes, in particular, the search and provision of a bibliometric dataset to be analyzed, the automatic application of bibliometric analyses to the dataset, a visual representation of the results of the analysis, and easy ways to export the results in various data formats. In particular, the creation of hybrid research fronts for the identification and grouping of thematically related publications should be supported.
In this context, particular challenges arise for the technical implementation of the objectives. First, bibliometric data are made available by various providers. However, in order to calculate high-quality bibliometric networks, citations of the identified publications are needed. The latter are only provided by a few providers. In addition, many of the providers are very expensive, especially when utilizing their application programming interfaces. Another challenge is the efficient computation of bibliometric networks.
As these networks are to be created based on a dataset that is, in turn, created based on a user-specific search, they cannot be computed in advance, but must be able to be created on the fly after the dataset has been created. Since the creation of hybrid research fronts involves the generation of large adjacency matrices and large document frequency matrices, the speed of generation depends on efficient implementation and is limited by available hardware capacity, particularly by the available memory.

3.2. User Stories

The overall goal is to create a solution to analyze bibliometric datasets in order to determine research actors as well as emerging research topics and challenges. A bibliometric analysis follows a process consisting of (1) defining the goals of the bibliometric analysis, (2) collecting data, (3) preprocessing data, (4) data analysis, (5) visualization of analysis results, and (6) interpreting the results. A more detailed view on this process is given in Section 2.4.
Aligned with this process, the goal is to create a system that supports the user to accomplish steps (3), (4), and (5) of the process. Support for more steps could be added in the future, but is not considered within this work as this would exceed the boundaries of this paper. System users are considered to be researchers or individuals in charge of research management at any level. For such a user, there are six user stories (US) defined:
  • A user searches for scientific publications and other bibliometric entities. For this purpose, they are able to search the entities in full text.
  • A user inspects a publication in the search results and uses additional information, such as the abstract, references and citations and their number, and a link to the publisher’s website.
  • A user wants to compute and visualize a bibliometric network. For example, they want to find out emerging topics in research covered by the search result. Therefore, the user creates a publication similarity network.
  • Having calculated a bibliometric network, a user is not satisfied with the result. He or she adjusts the search query, reruns the computation, and inspects the updated visualization.
  • Calculation of a bibliometric network may take some time. Following this, a user starts the calculation of multiple networks, which are expected to be computed in parallel. Thus, they do not have to wait until they have been computed sequentially. While waiting for the calculations to finish, they explore the search results by inspecting some entities.
  • A user interrupts his work on a bibliometric analysis in their office and continues their work at a later point in time with a different computer.

3.3. Requirements Analysis

In general, the development focus is on a platform (1) that provides an easy-to-use user interface, (2) where available resources can be scaled easily and quickly, so that the platform is available for a more significant number of users, and (3) that offers a flexible structure that can be extended with additional services. In order to elicit technical requirements for implementing the platform, functional requirements were derived based on the presented user stories. Table 1 lists the identified functional requirements by name with a summary and a rationale [31].

3.4. Software Architecture
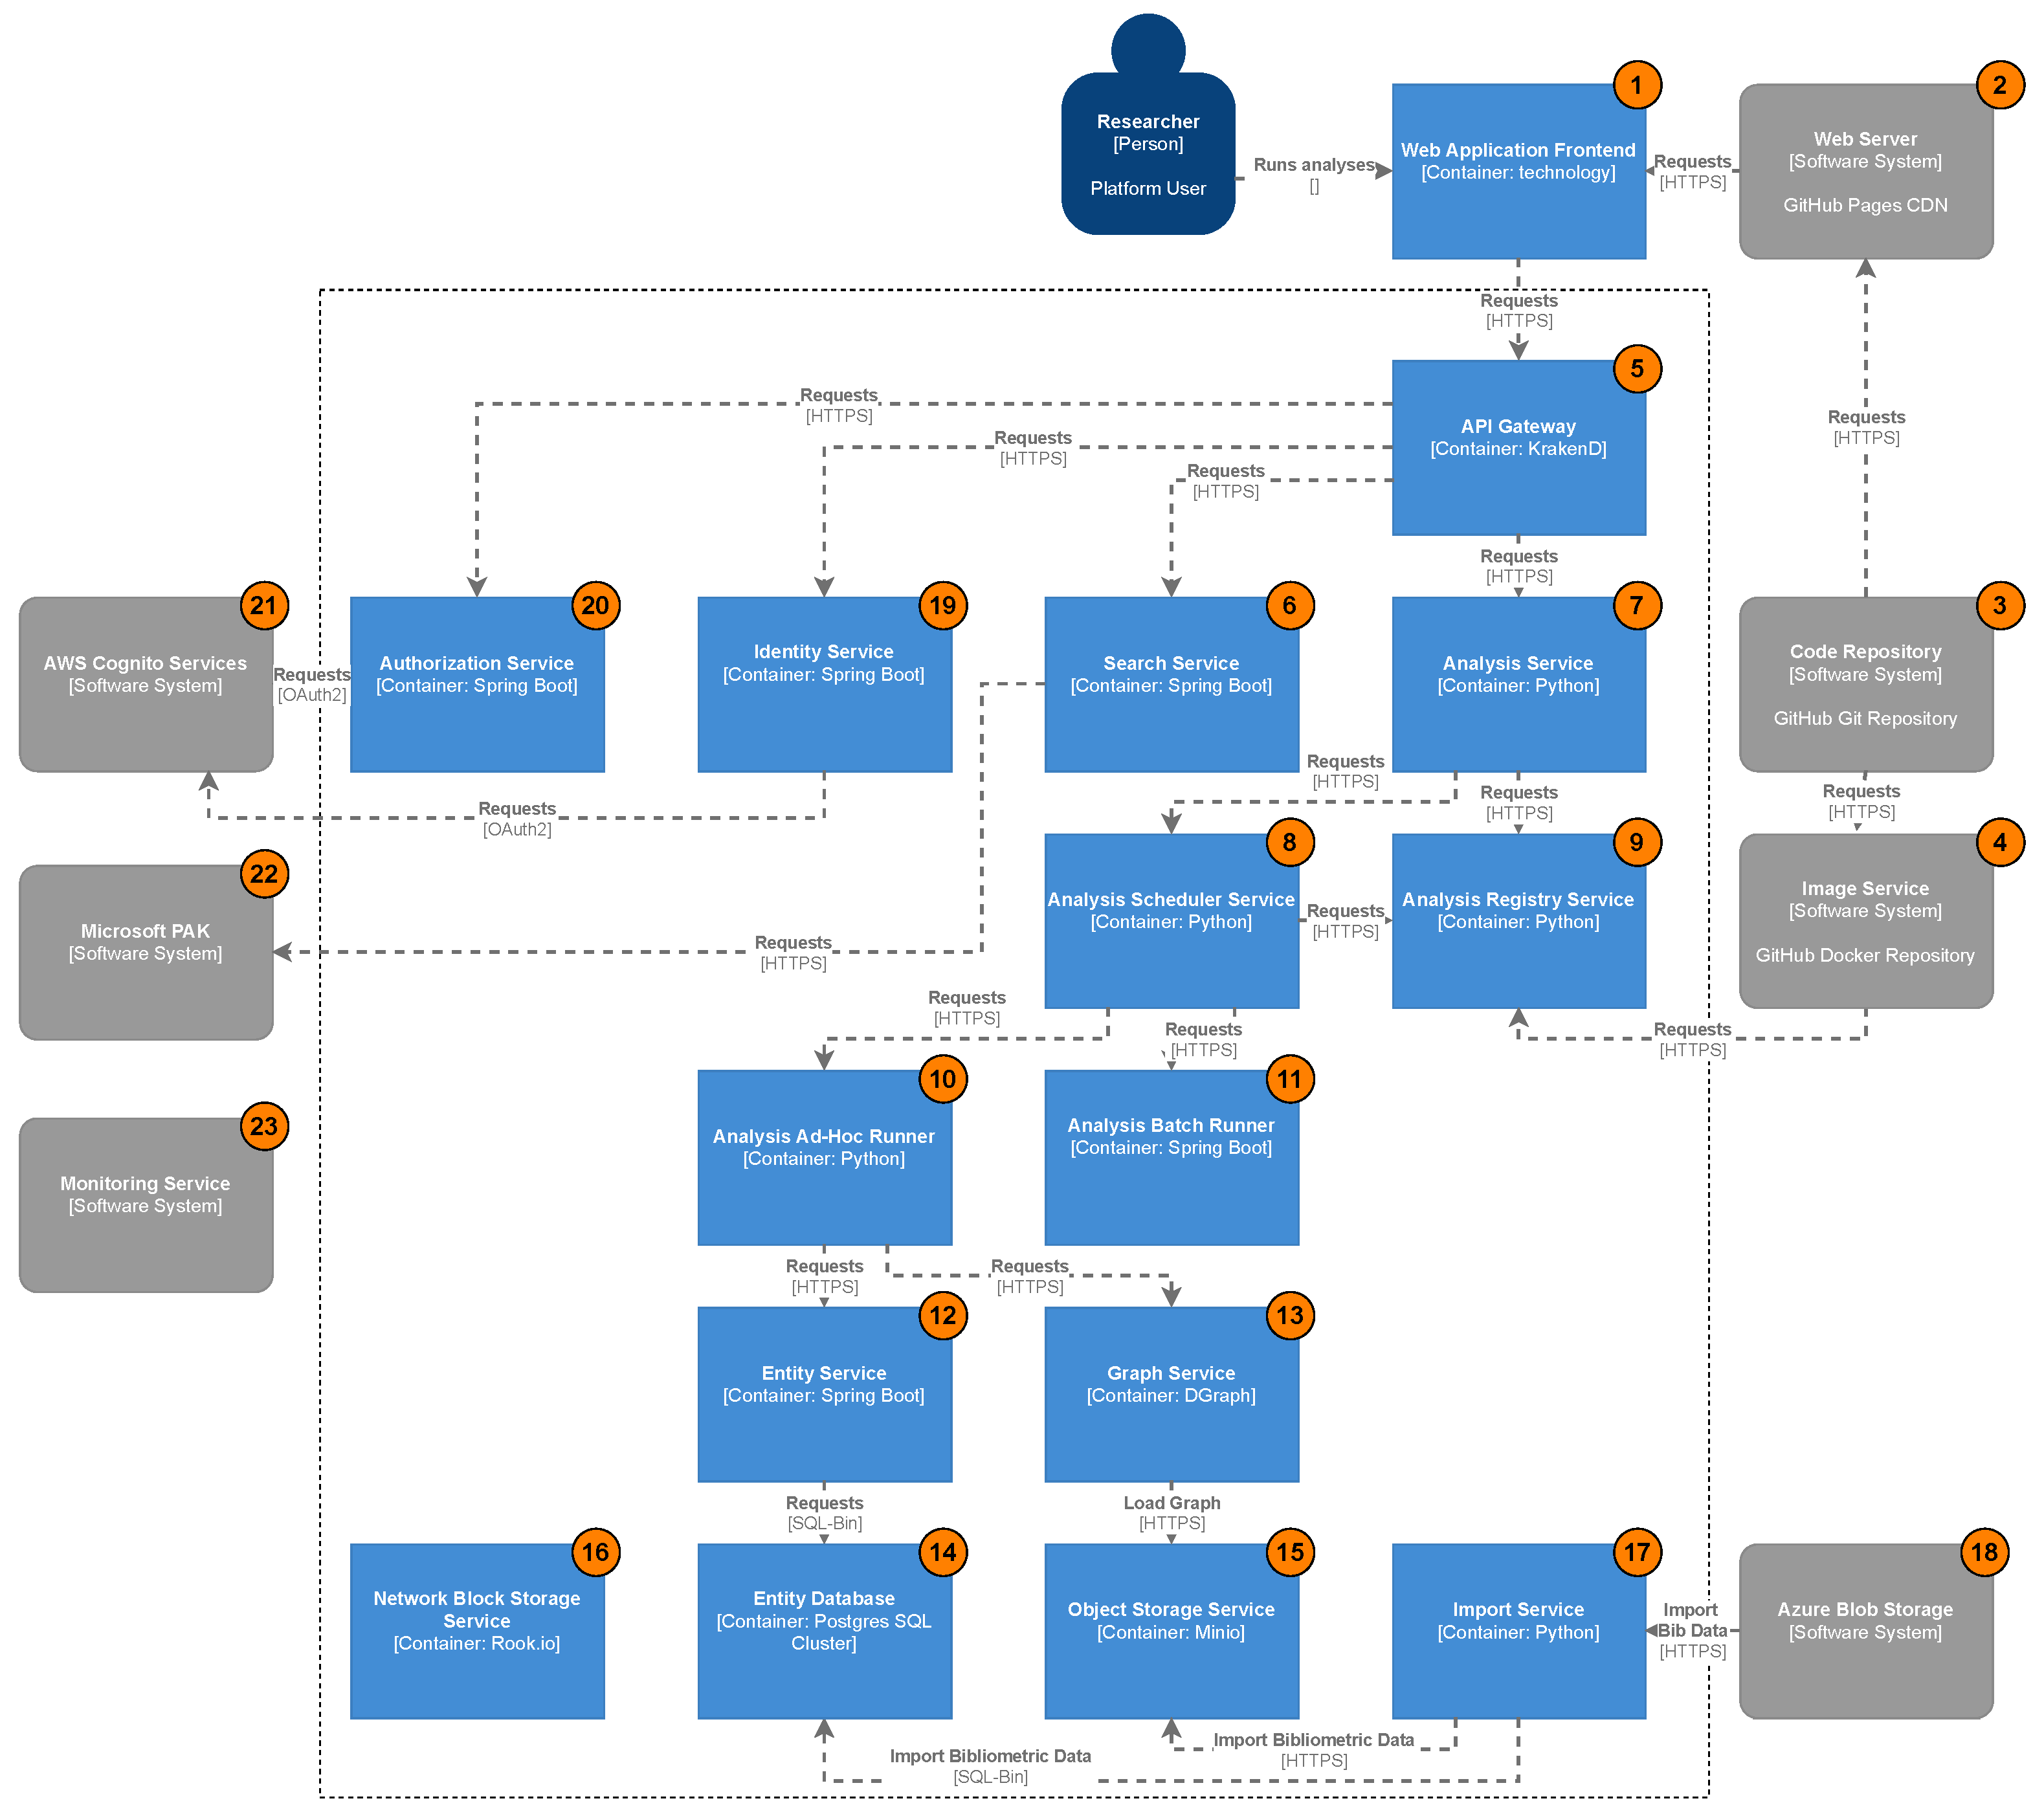
In the following, the developed system architecture is described. The latter is described based on the C4 model, which meets the requirements of the description toward a distributed system [32]. Within the C4 model, there are four layers describing the static view of a software system on different abstraction layers [33]: context, containers, components, and code. The context layer gives a high-level overview of the system as a whole and with other systems it may interact with. In the container layer, the different containers of the system and their relations are depicted. In this model, containers do not necessarily depict containerized applications.
Instead, a container is a deployable unit, such as a server-side web application, a database, a file system, or a microservice. The components layer describes the components inside containers and their interactions. Being optional, the code layer describes the code structure in detail, e.g., supported by class diagrams. Additionally, the C4 model addresses the dynamic behavior and the mapping of system containers to the infrastructure [32].

3.5. System Context

The system context coarsely shows how the system interacts with users and other software systems. Academic researchers are considered the only users of the bibliometric analysis platform as described in Section 3.2. They interact with the system by creating a dataset, exploring the former, running analyses, and viewing results. From the researcher’s point of view, no other providers need to be considered in the system context since their functions are provided transparently via the integrated platform.
Thus, an integrated search function enables the creation of the dataset to be analyzed. Furthermore, the bibliometric analysis platform relies on Amazon AWS (user authentication with AWS Cognito (aws.amazon.com/cognito (accessed on 6 May 2021)) and Microsoft Azure (Microsoft PAK Project Academic Knowledge [11]) services. Microsoft PAK provides a free search API that can be used to search for publications using definable queries (see Section 3.7). Sentry.io (sentry.io (accessed on 6 May 2021)) is used for application performance monitoring.

3.6. System Architecture

The overall system consists of several layers: A hardware layer provides physical computing capacity. Two 16-way Xeon servers, each with 256GB RAM and 8TB SSD storage, were used in the prototypical development. A virtual infrastructure layer abstracts from the physical layer and enables dynamic and programmatic provisioning of system resources. In the prototypical development, a vanilla Kubernetes environment of version 1.18 was used for this purpose (see Section 3.9). All software services are provided and executed in a container layer, which are described in more detail below.
Various services exist on the container layer, such as authentication, search, user management, and execution and provision of the analysis results. Analyses of the ambalytics platform are provided via an Analysis API service (see Figure 9). The latter communicates with an Analysis Scheduler Service that manages the execution of the analyses (e.g., for the runtime lifecycle of analyses containers). All services are expressed as micro-services and run statelessly or statefully (i.e., scheduler service) on the Kubernetes cluster.
In the ambalytics platform, analyses are divided into two types: small analyses that are calculated in an ad hoc manner based on search results as well as analyses that are batch-oriented and applied to a large bibliometric dataset. Available analyses are registered as Docker containers in the Analysis Registry Service and can be instantiated and executed by the Ad-hoc Runner Service. The data to be analyzed can include either a list of bibliometric entities that can be loaded from an entity service or a subgraph that can be computed using a graph service. Both services are explained in more detail in Section 3.7.
Analyses performed on large datasets, such as bibliometric analyses across the entire medical field, may contain millions of publications and may run based on a big data computing cluster framework. Apache Spark is used for the prototypical implementation, which, in turn, is deployed in Kubernetes. For large-scale analytics over Apache Spark, the Analysis Batch Runner runs analytics over SparkContext in runtime containers. The latter communicates with Spark Cluster Manager. Bibliometric data is provided for Apache Spark Cluster via an Object Storage Service (see below).

3.7. System Containers
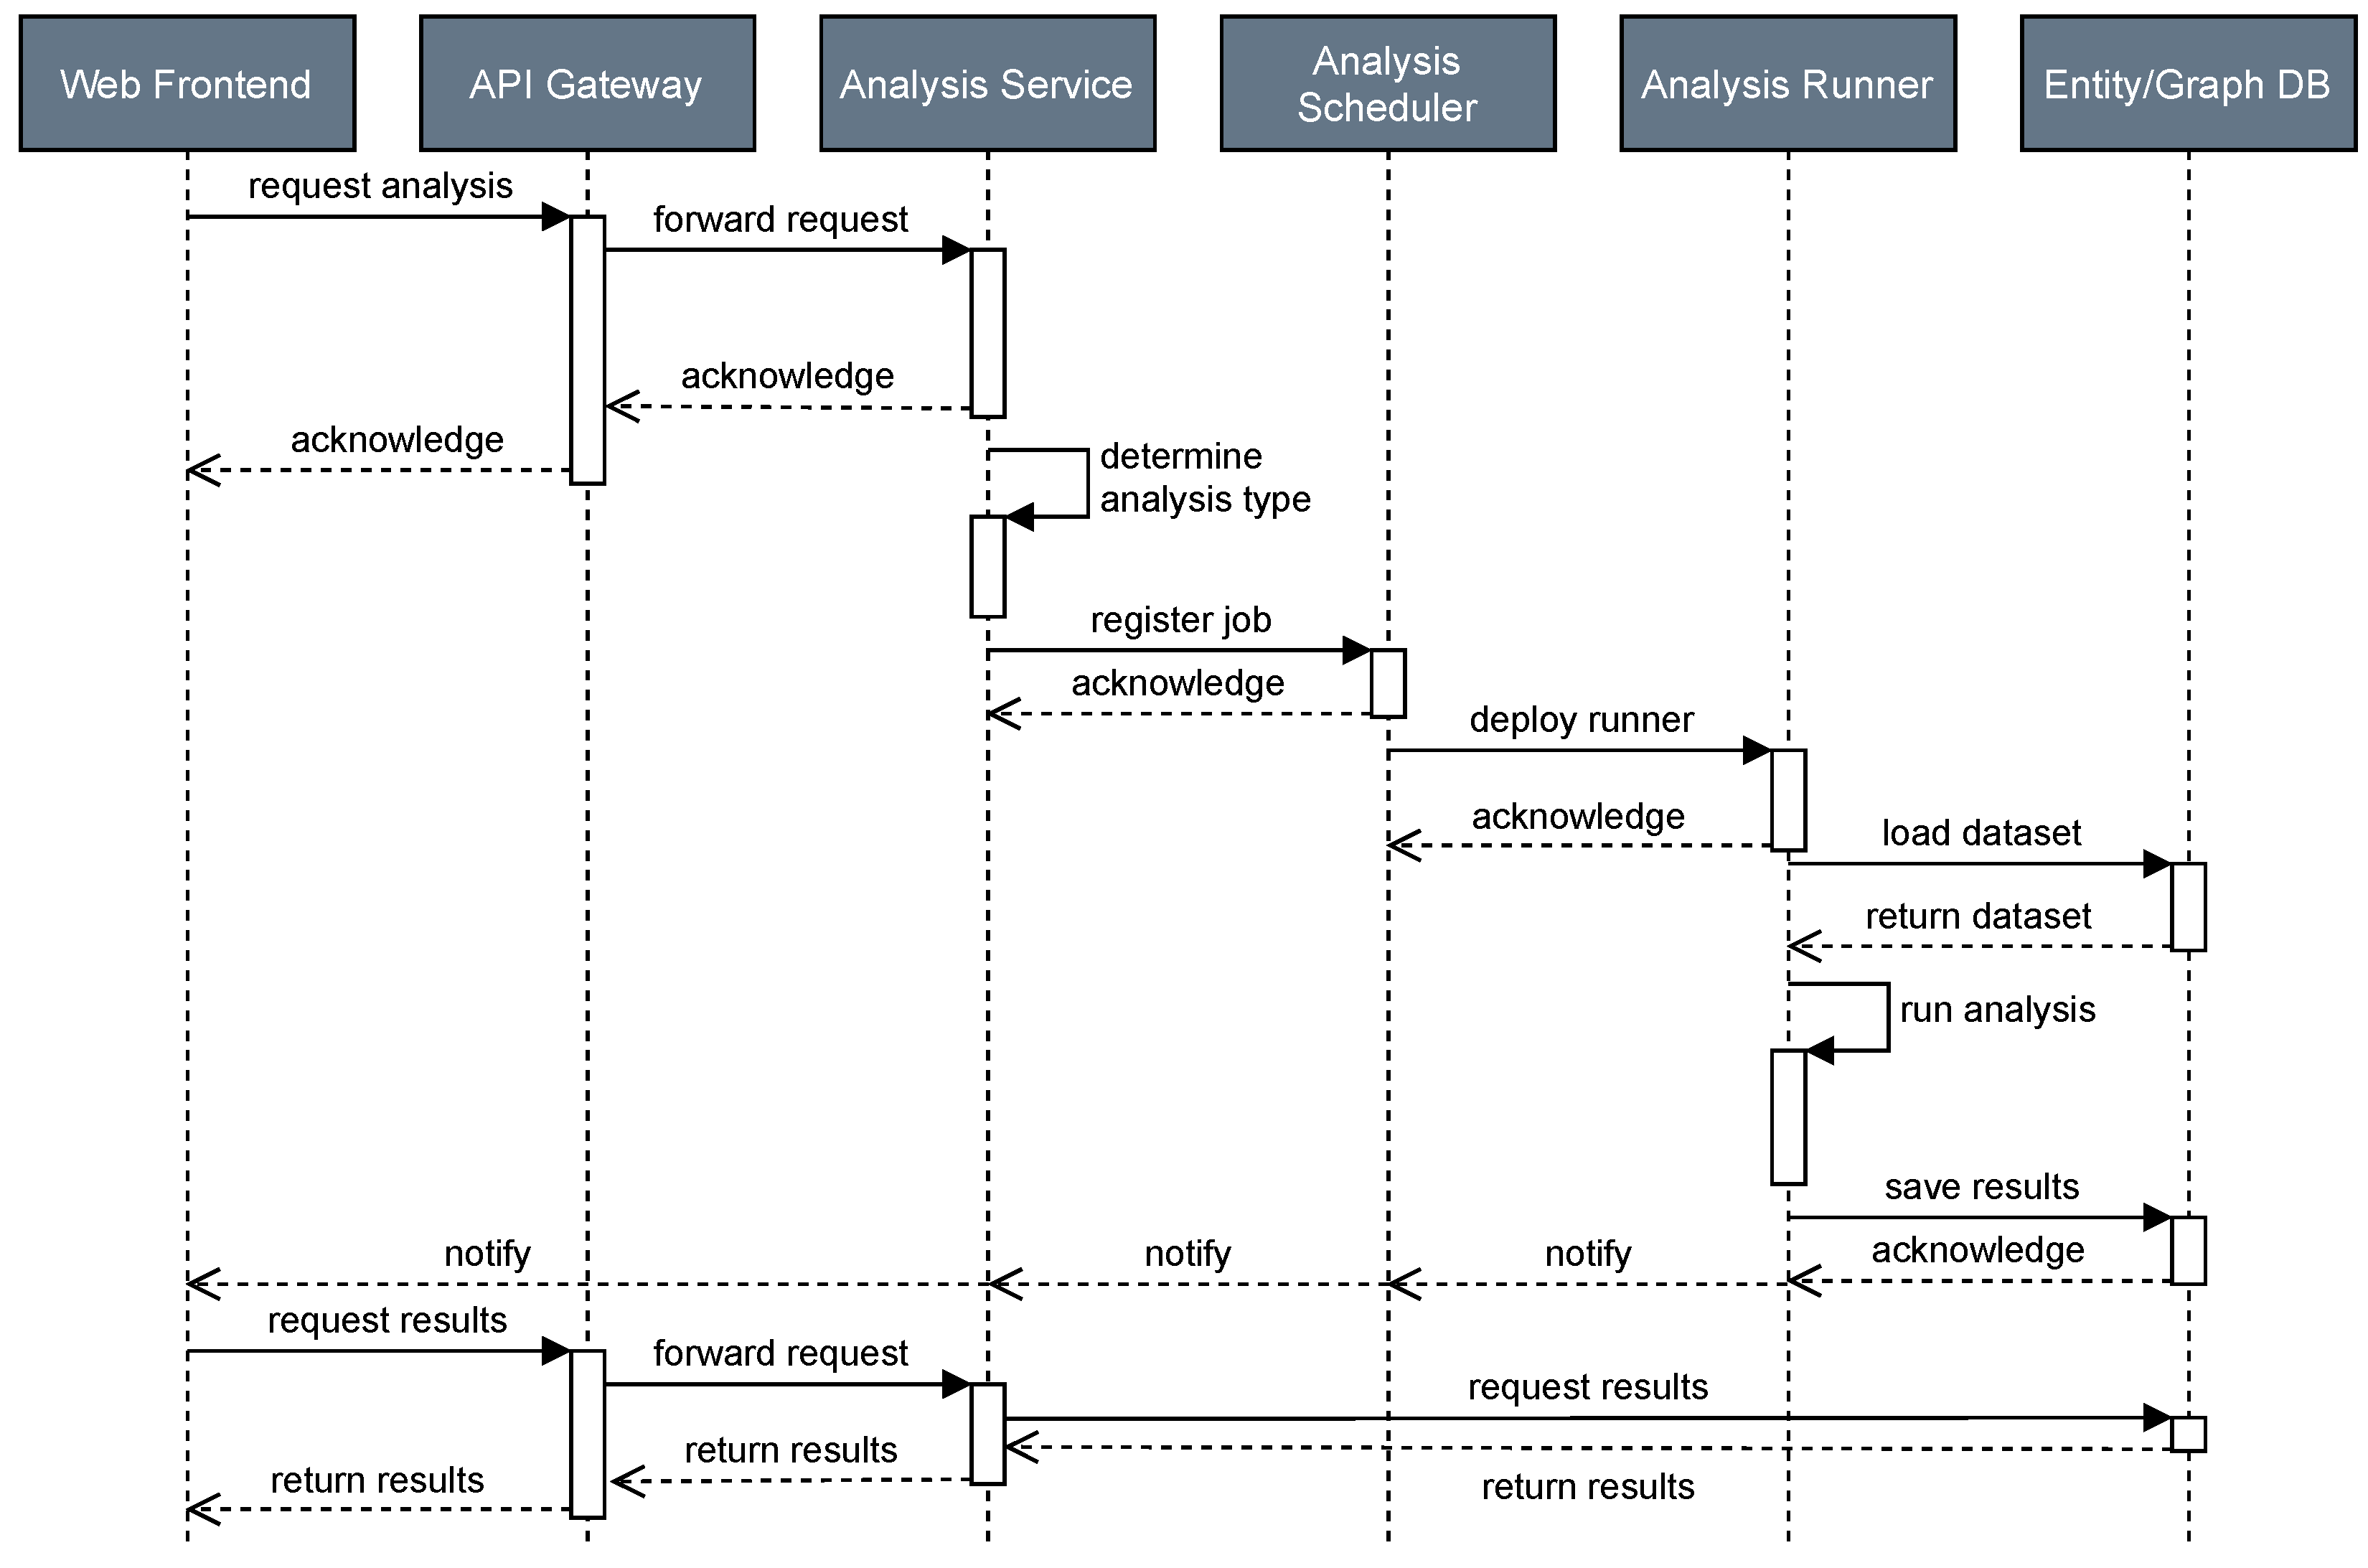
The bibliometric analysis platform is a software system that consists of 15 containers, seven external services, and a web application front-end (see Figure 10).
The web application front-end (1) is the only part the user directly interacts with. The web application front-end runs in the web browser of the user’s machine and provides the system’s functionality to the user through a graphical UI. The web application is implemented based on Vue3 (vuejs.org (accessed on 6 May 2021)), and is served by a web server (2) delivering the static content of the front-end, for which GitHub pages are used as a fast and distributed web server.
Source code of the individual services as well as the web front-end are stored in a code repository (3), i.e., using GitHub repositories. With the help of the GitHub Actions automation service, defined workflows perform various actions when the source code changes, such as code checking, unit tests, end-to-end tests, or Docker container builds. The latter are stored in an image service (4), i.e., GitHub Docker repositories, and can be loaded and executed within the Kubernetes execution environment. For example, the analysis registry service requests docker images for registered ad hoc analyses from the image service. The individual container builds services that are described below.
An API gateway (5) serves as a load balancer for requests to the respective services, defines the corresponding endpoints, ensures SSL transport encryption, and verifies login tokens for restricted API endpoints. KrakenD (krakend.io (accessed on 6 May 2021)), a stateless, distributed, and high-performance open source implementation is used for this purpose.
A search service offers possibilities to search for publications, authors, affiliations, and fields of studies based on different types of queries. Queries are defined using a domain-specific language (DSL) and support logical operands, such as “AND” or “OR”, searching by various fields (such as names and identifiers, such as the Microsoft Academic ID or DOI, aso.), and defining sorting. The search service is a container implemented in Java based on Spring Boot and uses the Microsoft PAK service or its own ElasticSearch cluster as a search source. For the prototypical implementation, the service of Microsoft Academic has proven itself since it allows a sufficient number of queries and the dataset is kept up-to-date, in contrast to the search cluster.
In order to generate bibliometric subgraphs as well as lexical analysis, a large number of queries are required, and the resulting amount of data can be several hundred megabytes. For this reason, the ambalytics platform uses two additional databases: an Entity Service (12), which stores and makes available bibliometric entities in a relational manner known from relational databases with corresponding indexes, and a Graph Service (13), which provides a complete copy of the Microsoft Academic graph using an in-memory database.
For example, the Entity Service provides analysis containers for bibliometric entities, such as authors or publications, upon request using a set of identifiers. The service enables the entities needed for lexical analysis on abstracts stored for publications to be made available quickly. A Entity Database (14), developed as Postgres SQL cluster, is used as the relational database, and the data is stored in block storage, provided by a locally mounted, fast enterprise SSD storage.
The Graph Service, in turn, provides graph storage using the DGraph (dgraph.io (accessed on 6 May 2021)) implementation, the Graph Service provides methods for breadth- and depth-first search within the bibliometric graph. The graph is retrieved at service startup from a Object Storage Service (15) (implemented with minio.io (min.io (accessed on 6 May 2021))) and kept in-memory. This allows, for example, the retrieval of a subgraph with a depth-first search of 3 and 5000 resulting publications in under 500 ms.
Other services, such as a collection service, omitted for clarity, can store data using a Network Block Storage Service implemented with rook (rook.io (accessed on 6 May 2021)). Following the persistence layer layout, the business logic for data retrieval and object manipulation is kept isolated, as suggested by the microservice architecture design principle.
Bibliometric analyses are offered via the Analysis Service (7), which offers actions to create work tasks being sent to the Analysis Scheduler Service (8) for processing. Each work task can be described by a directed-acyclic graph (DAG) containing jobs as nodes and their dependencies as directed edges. The work scheduler handles coordinated batch processing of work tasks. It initiates the processing of jobs by sending them to the Ad-hoc Runner (10) for processing. Depending on the kind of job, a runner container that is registered in the Analysis Registry Service (9) is instantiated for job execution. While the Analysis Scheduler Service keeps track of the job computation progress, the Ad-hoc Runner keeps track of work task progress.
Once a bibliometric network is calculated, the container stops executing. The analysis runner directly communicates with the bibliometric databases, rather than respective APIs suggested by the microservice principle, due to performance reasons. During execution, runners inform the Scheduler Service about their progress.
User authentication and authorization is realized by providing an identity service (19). This is needed to secure the system- and bibliographic API as well as the web server. It provides authenticated users with a token the web application front-end can use to access the APIs and the web server. When presenting a token to an application, the application can ask the authorization application to verify that the presented token is indeed valid. User and token information is stored in the user database (21). The authorization application can be implemented using Spring Security (spring.io/projects/spring-security (accessed on 3 August 2021)). Finally, a Monitoring Service (23) monitors application performance and collects log data and error reports.
As Kubernetes is used to provide an infrastructure to orchestrate the system containers, its Jobs API is used for scheduling jobs to available resources, i.e., it starts containerized runners on Kubernetes nodes. The Job API is integrated into the Kubernetes API server and, consequently, uses the Kubernetes built-in database etcd for storing jobs. Etcd is a distributed, reliable key-value store designed for distributed systems. Jobs can be created that consist of one or multiple pods, typically containing one container, which are then scheduled onto nodes for execution.
The rationale behind technology choices is given in Section 4. In general, Java and Spring Boot (spring.io (accessed on 6 May 2021)) are used to implement microservices for business logic, and Python is used for analysis-related implementations, such as Analysis Containers for research front generation.

3.8. Process View

In addition to the static structure of a software system, its dynamic behavior is covered by the C4 model by providing process descriptions of container interactions. In the following, the processes of the functional requirement for computing and visualizing bibliometric networks are shown. The process of bibliometric network computation is an asynchronous task that is executed by the Ad-hoc Runner (see Figure 11). If the user wants to run a computation of a bibliometric network, the web front-end posts an analysis description to the Analysis Service describing the analysis type and its parameter settings.
The parameter settings are already configured and do not need to be defined by the user. After determining the type of analysis, i.e., ad hoc or batch, a job is created by calling the respective Analysis Scheduler, together with the analysis description. An Analysis Runner is deployed on a Kubernetes pod. The runner loads the required bibliometric data from the entity and graph database and computes the analysis. The results are then cached, and the web front-end is notified about completion and requests the results. Finally, the bibliometric networks can be visualized.

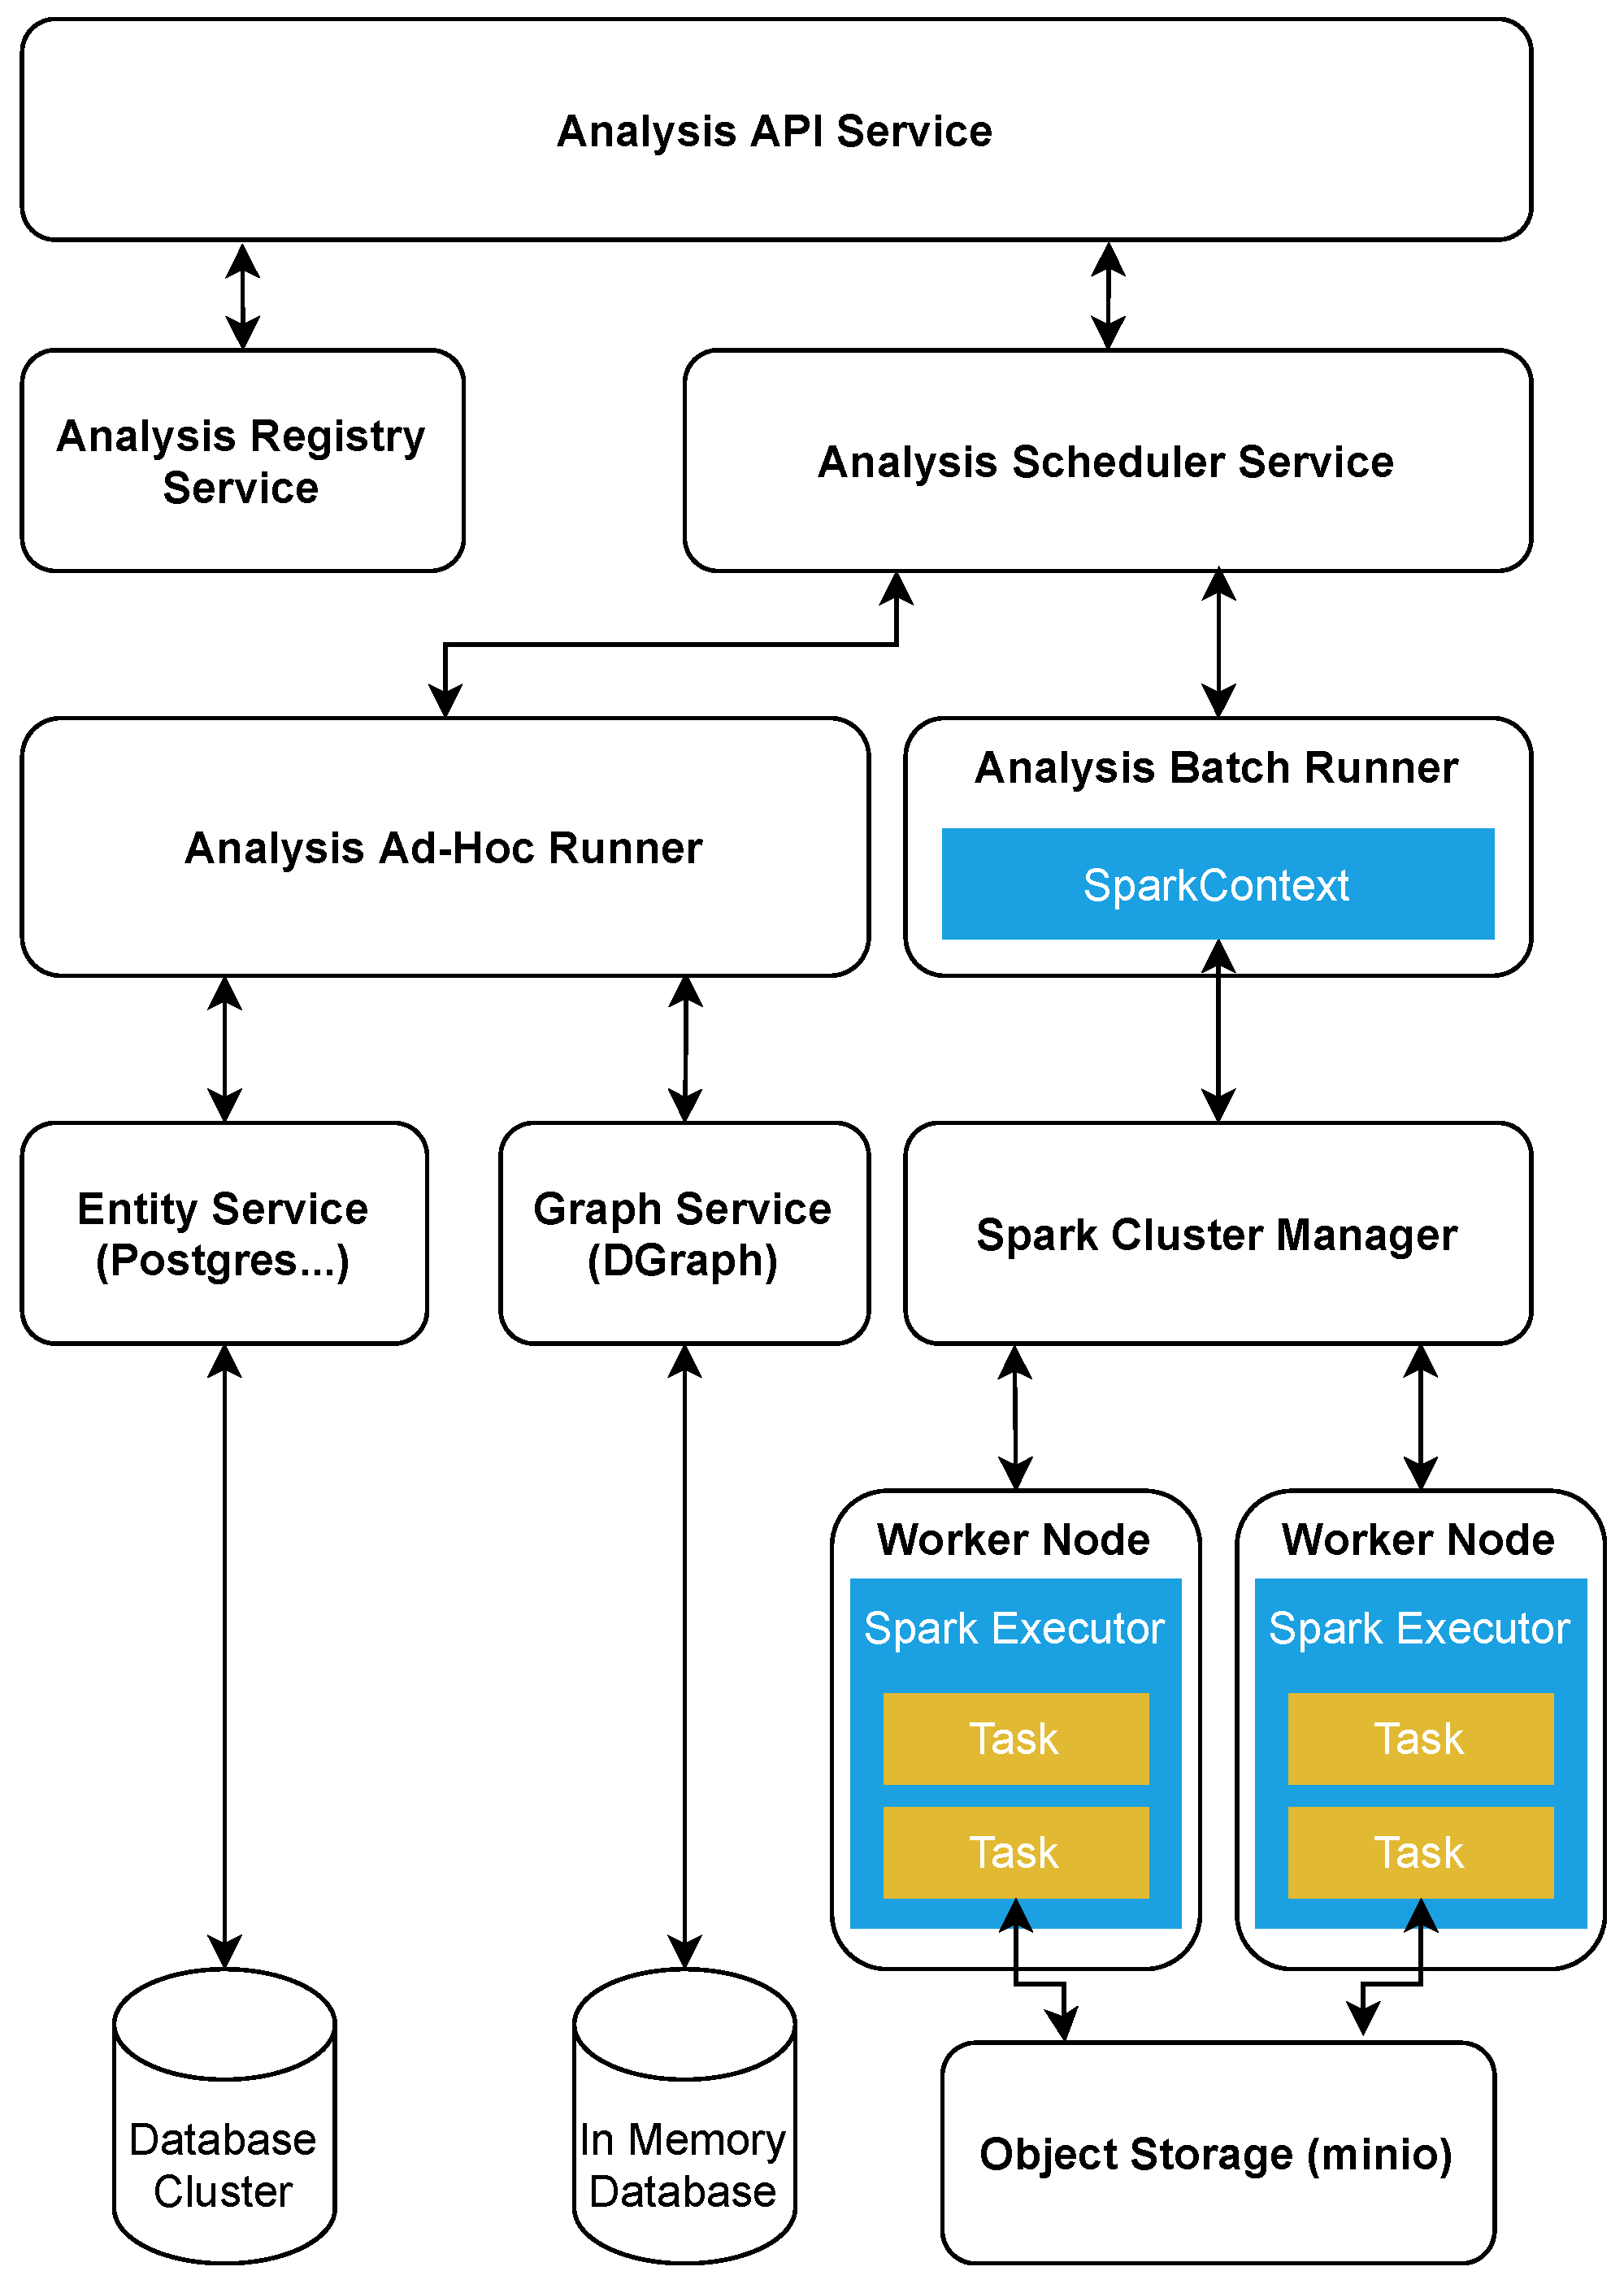
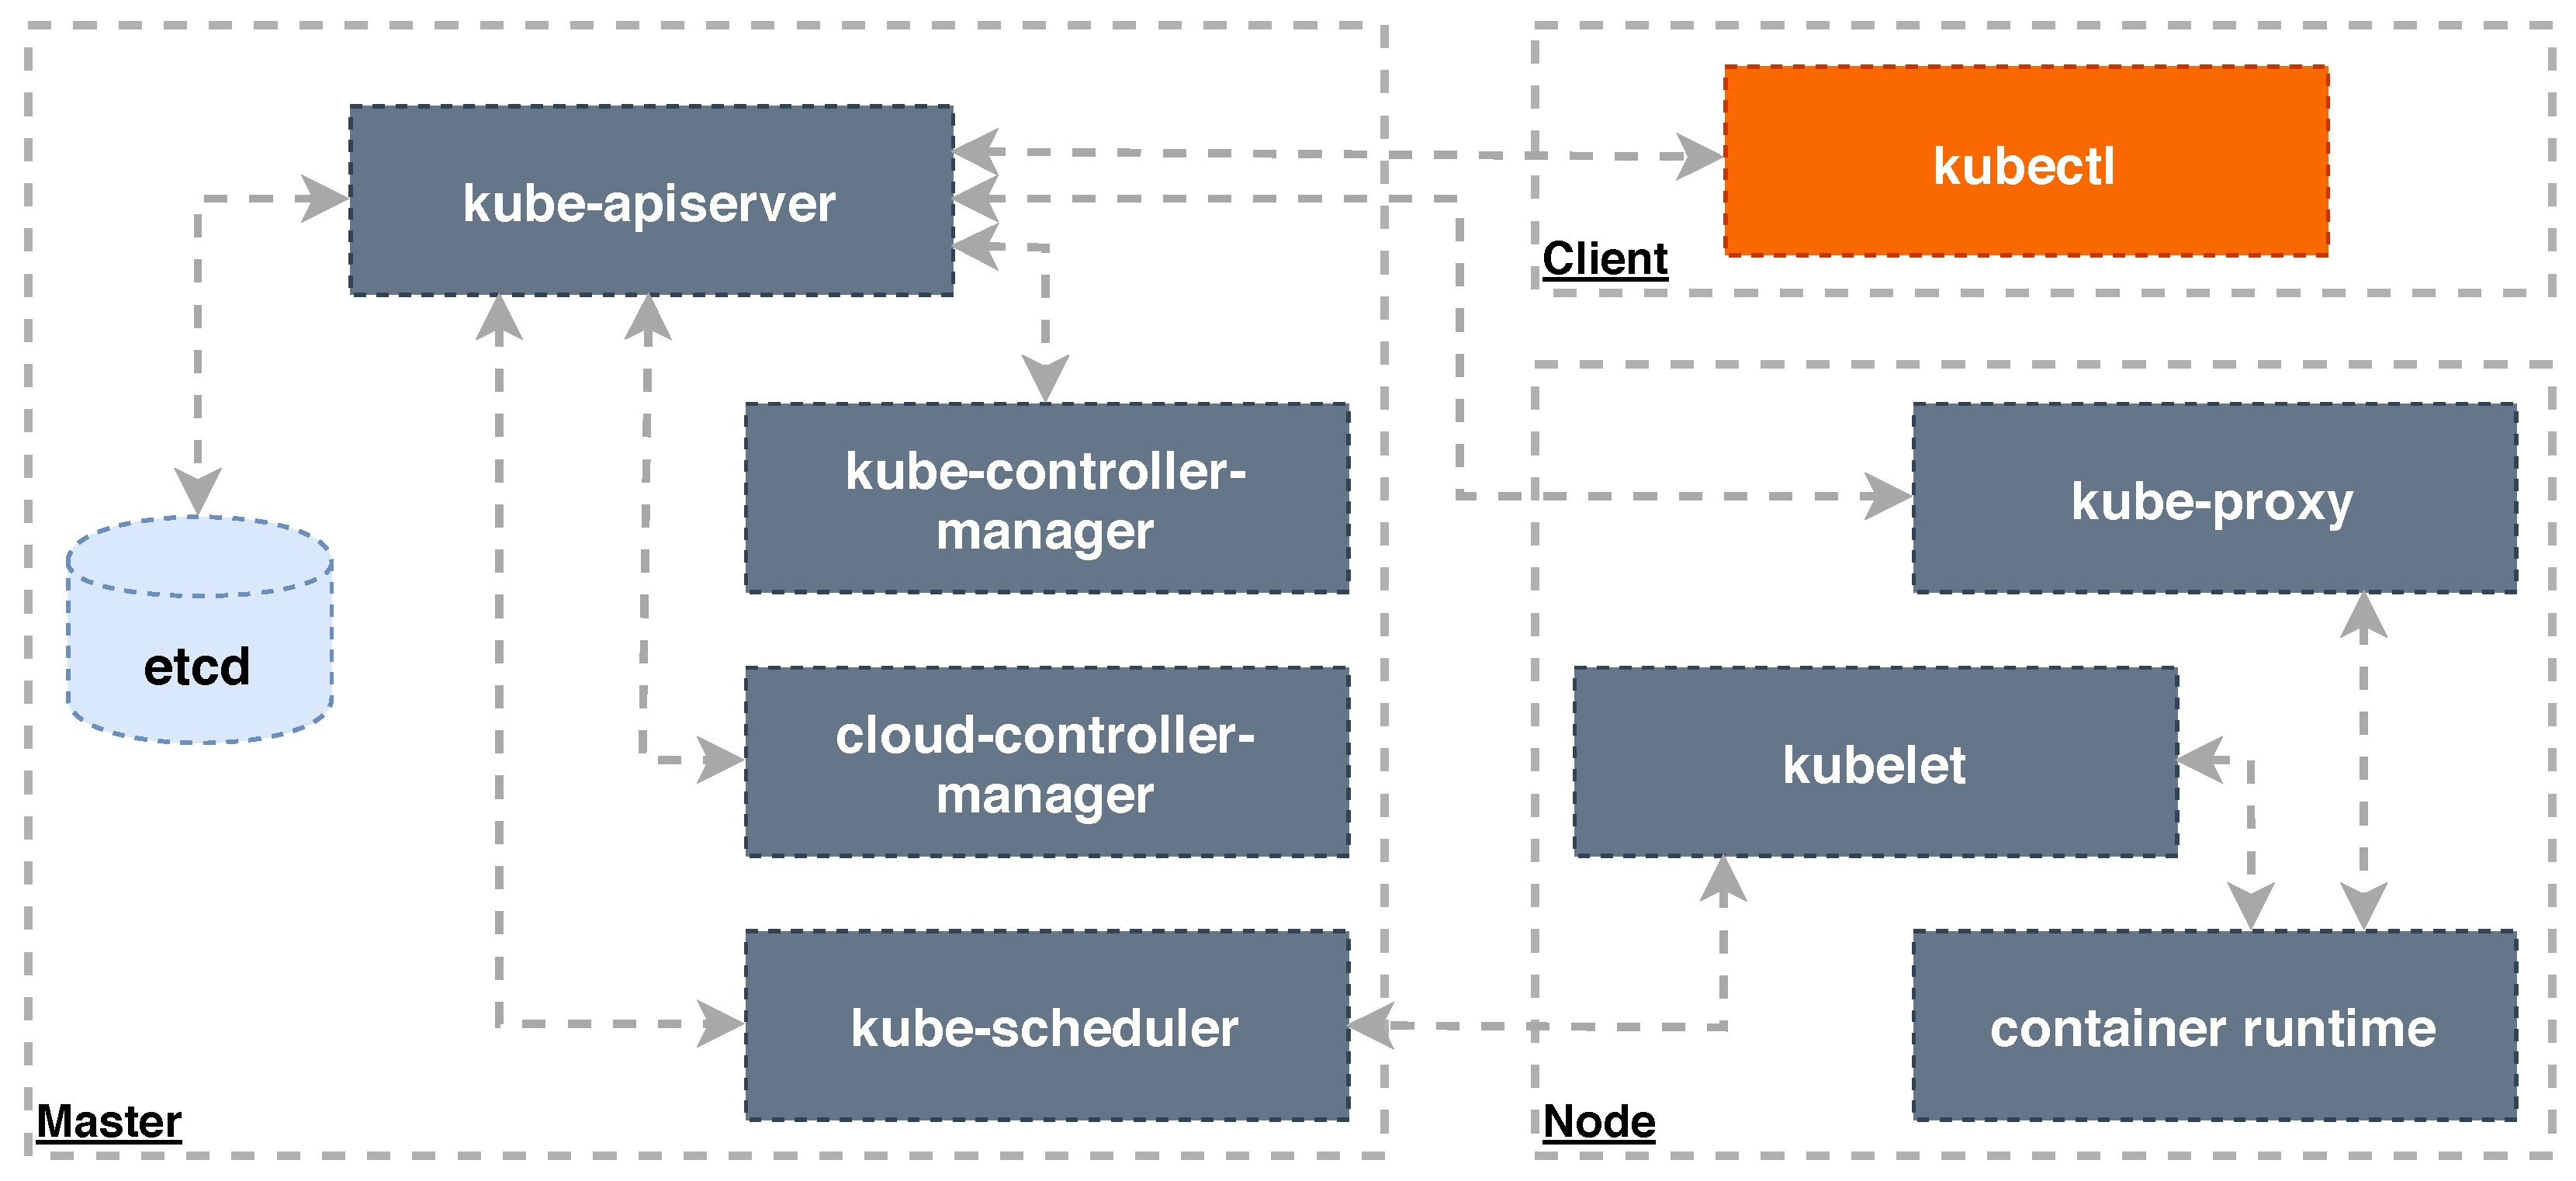
3.9. Infrastructure View
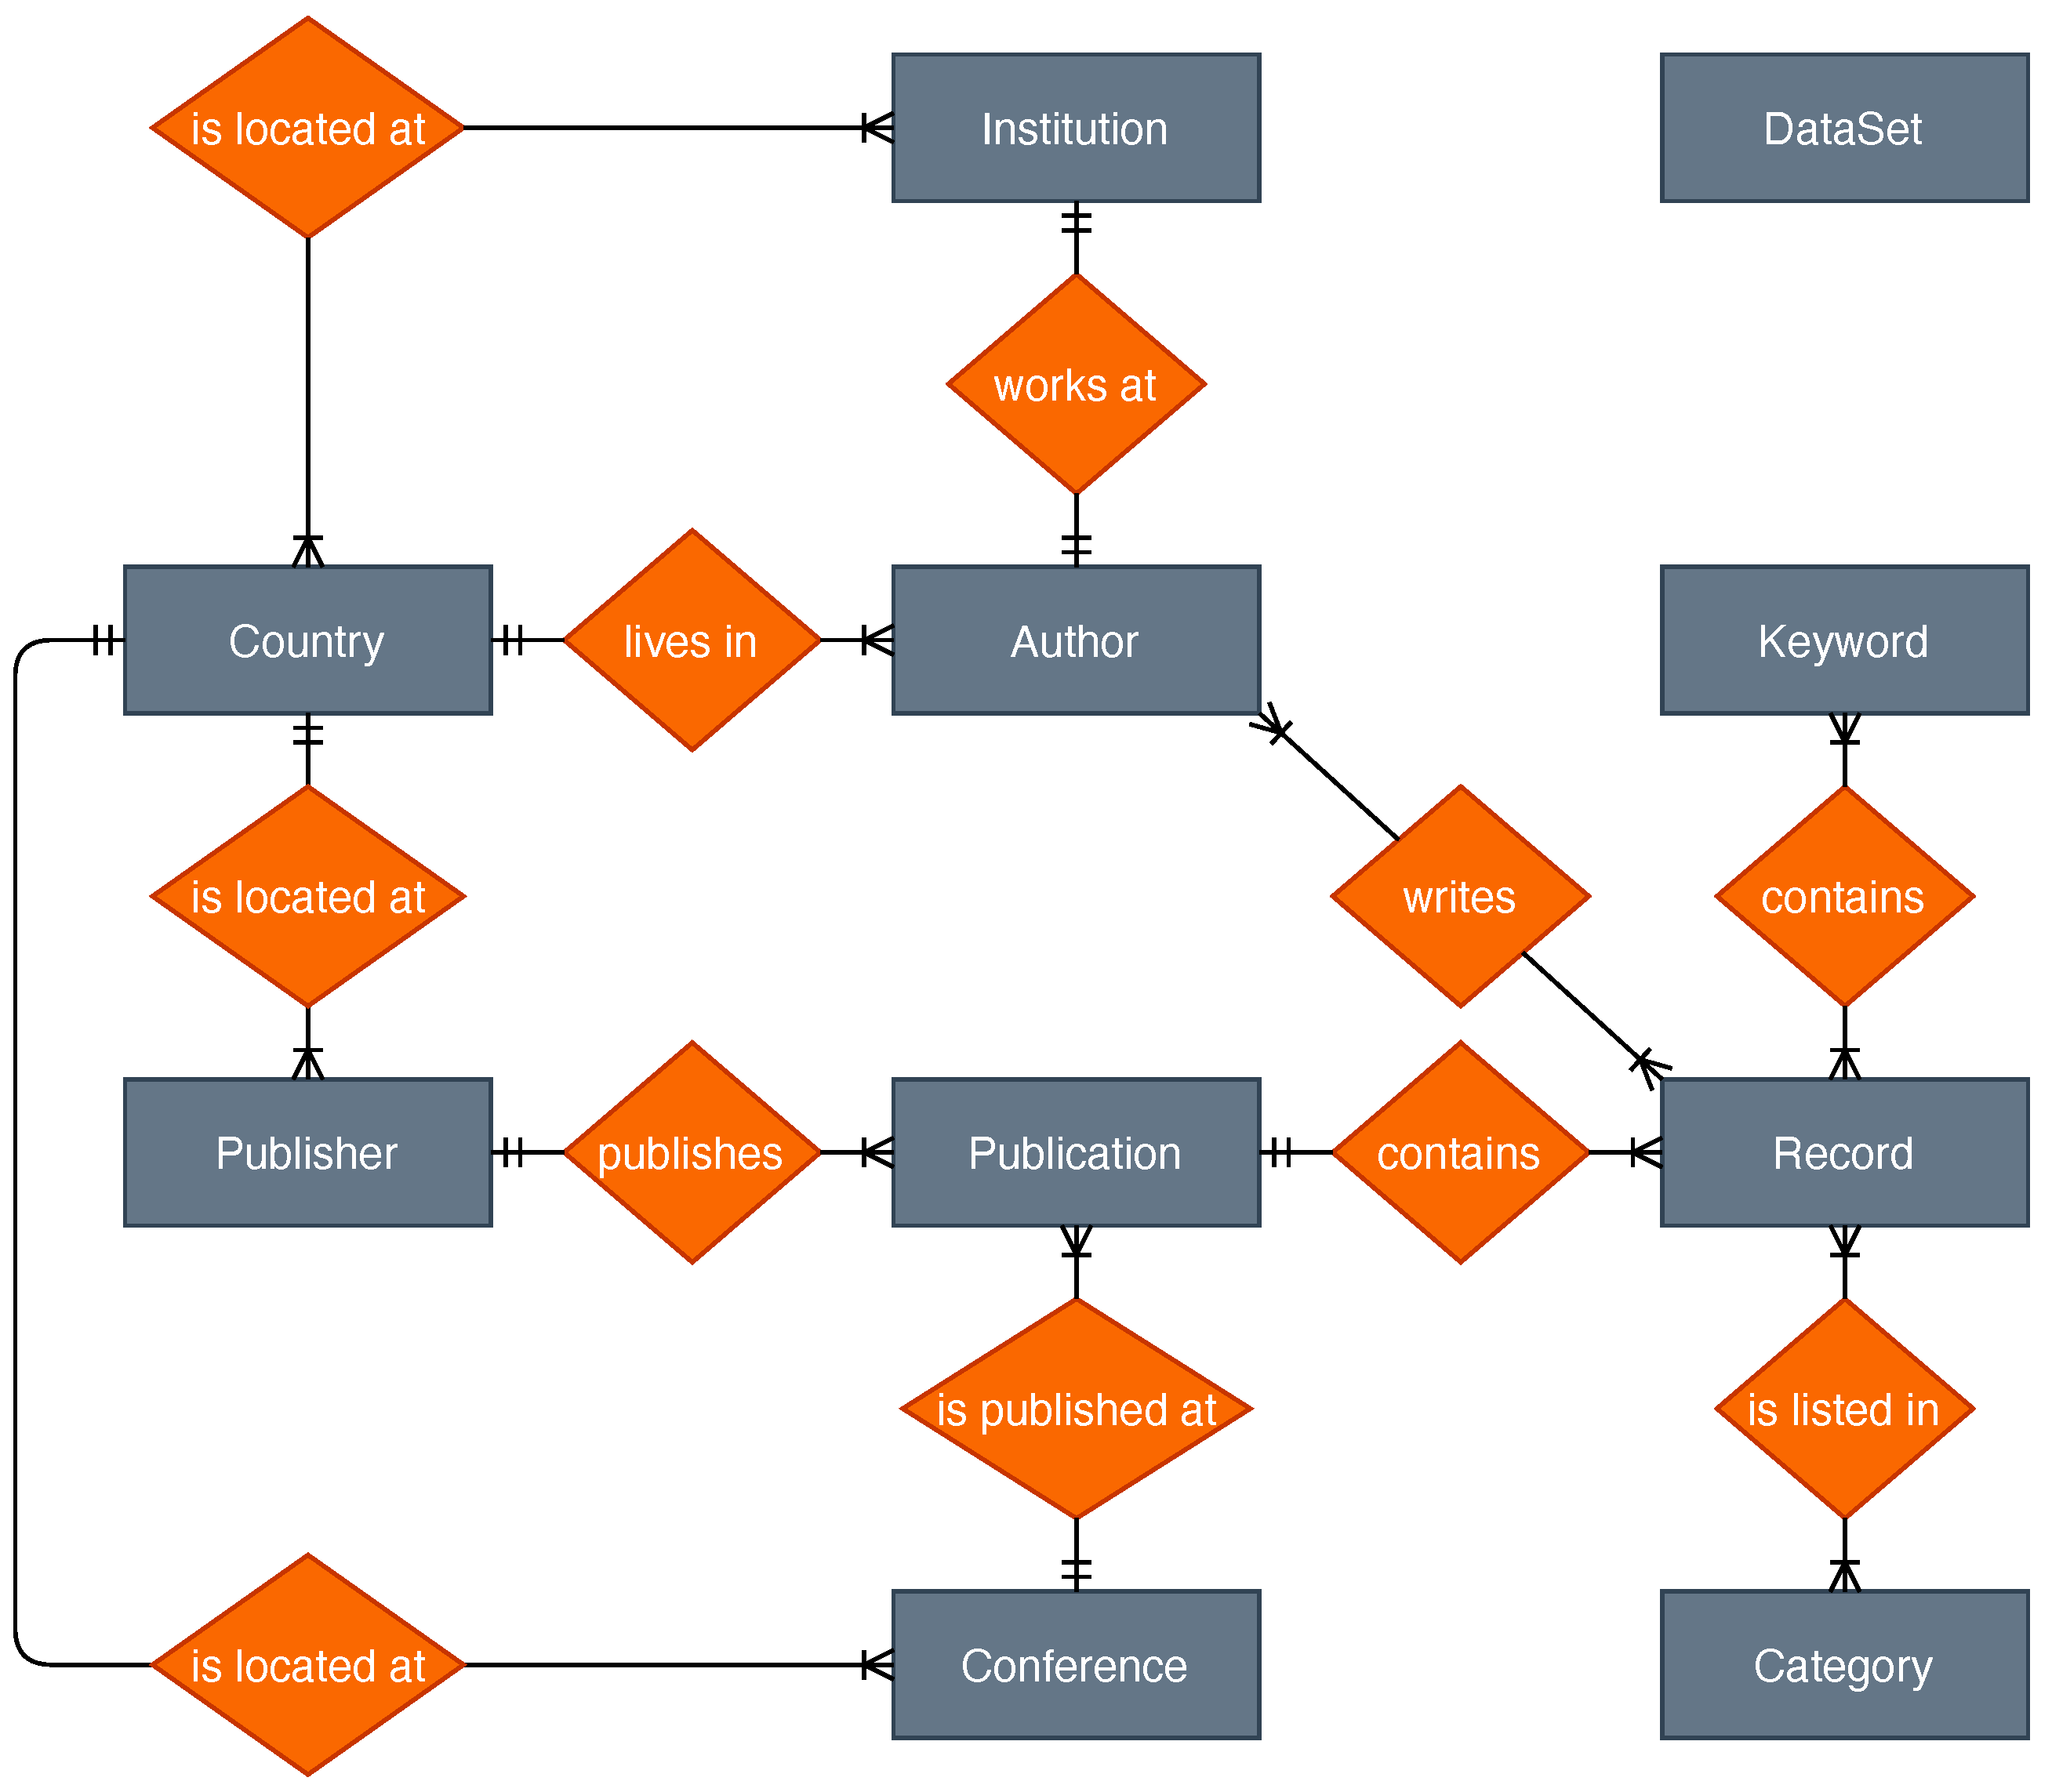
Following the microservice architecture principle, the infrastructure concept is to containerize system components and use a cloud orchestrator to orchestrate containerized microservices to cloud resources. For containerization, the container runtime Docker (docker.com/products/container-runtime (accessed on 6 May 2021)) is used. The portability requirement is met by using Docker containers, as they run on Linux-based operating systems. As a cloud orchestration tool, Kubernetes is used.
Kubernetes is an “open-source system for automating deployment, scaling, and management of containerized applications” [34]. It was initially developed by Google and was donated to the Cloud Native Computing Foundation (CNCF) as its first project [35]. It consists of several components being split up in master and node components [36]. An overview of the software components of Kubernetes is given in Figure 12.
The master components control the cluster and are responsible for moving the cluster toward the desired state. There are five master components: the kube-apiserver, etcd, kube-scheduler, kube-controller-manager and cloud-controller-manager. The kube-apiserver serves as the Kubernetes API, acting as the endpoint to cloud operators. Kubernetes provides the kubectl command line interface (CLI) to interact comfortably with the Kubernetes API from a client machine. Etcd is a key value store that stores all cluster control data, as Kubernetes objects [36].
The kube-scheduler is aware of any Kubernetes object being stored in etcd and triggers actions to adjust the cluster as soon as objects are created, updated, or deleted. Kubernetes offers a set of controllers, each having different specific tasks; for example, a node controller watches all nodes in the cluster and informs when nodes go down. Another example is the replication controller maintaining the desired number of container replications. These controllers are managed by the kube-controller-manager. In addition, the cloud-controller-manager runs controllers handling cloud resources, e.g., a volume controller for creating persistent volumes [36].
On the node side, there are three components running on every node: the kubelet, the kube-proxy, and a container runtime. The agent that makes sure that pods run on a node is called the kubelet, while the kube-proxy is a network proxy implementing some network features—for example, request forwarding. The container runtime component runs the containers [36].

3.10. Data Model

Bibliometric entities are provided by the Entity Service and the Graph Service as well as the Search Service and represent bibliometric data, such as publications, authors, and keywords. System entities are all non-bibliographic entities of the system’s data model, e.g., user, project, and visualization. To provide a focus, only the bibliometric data model is discussed in more detail below. The bibliographic data model is shown in Figure 13 through an extended entity relationship (EER) model using Martin’s notation. Entity attributes are not shown in the diagrams. The data model contains ten bibliometric entity types: Institution, Country, Author, Keyword, Publisher, Publication, Record, Conference, and Category.
An Institution represents an academic institute or firm that is located in a Country and employs researchers, which are named as Author in the data model. An author lives in a country and is (co)author of Records. A record represents an academic publication, such as an article in a journal, a paper in a conference proceeding, or any other academic document. In contrast, a Publication can contain multiple records. Journal and conference proceedings are examples of a publication.
In case of conference proceedings, the publication is published at a Conference, located in a country. A publication is published by a Publisher being based in a country. Typically, a record comes with some Keywords and Categories that are listed in its metadata.

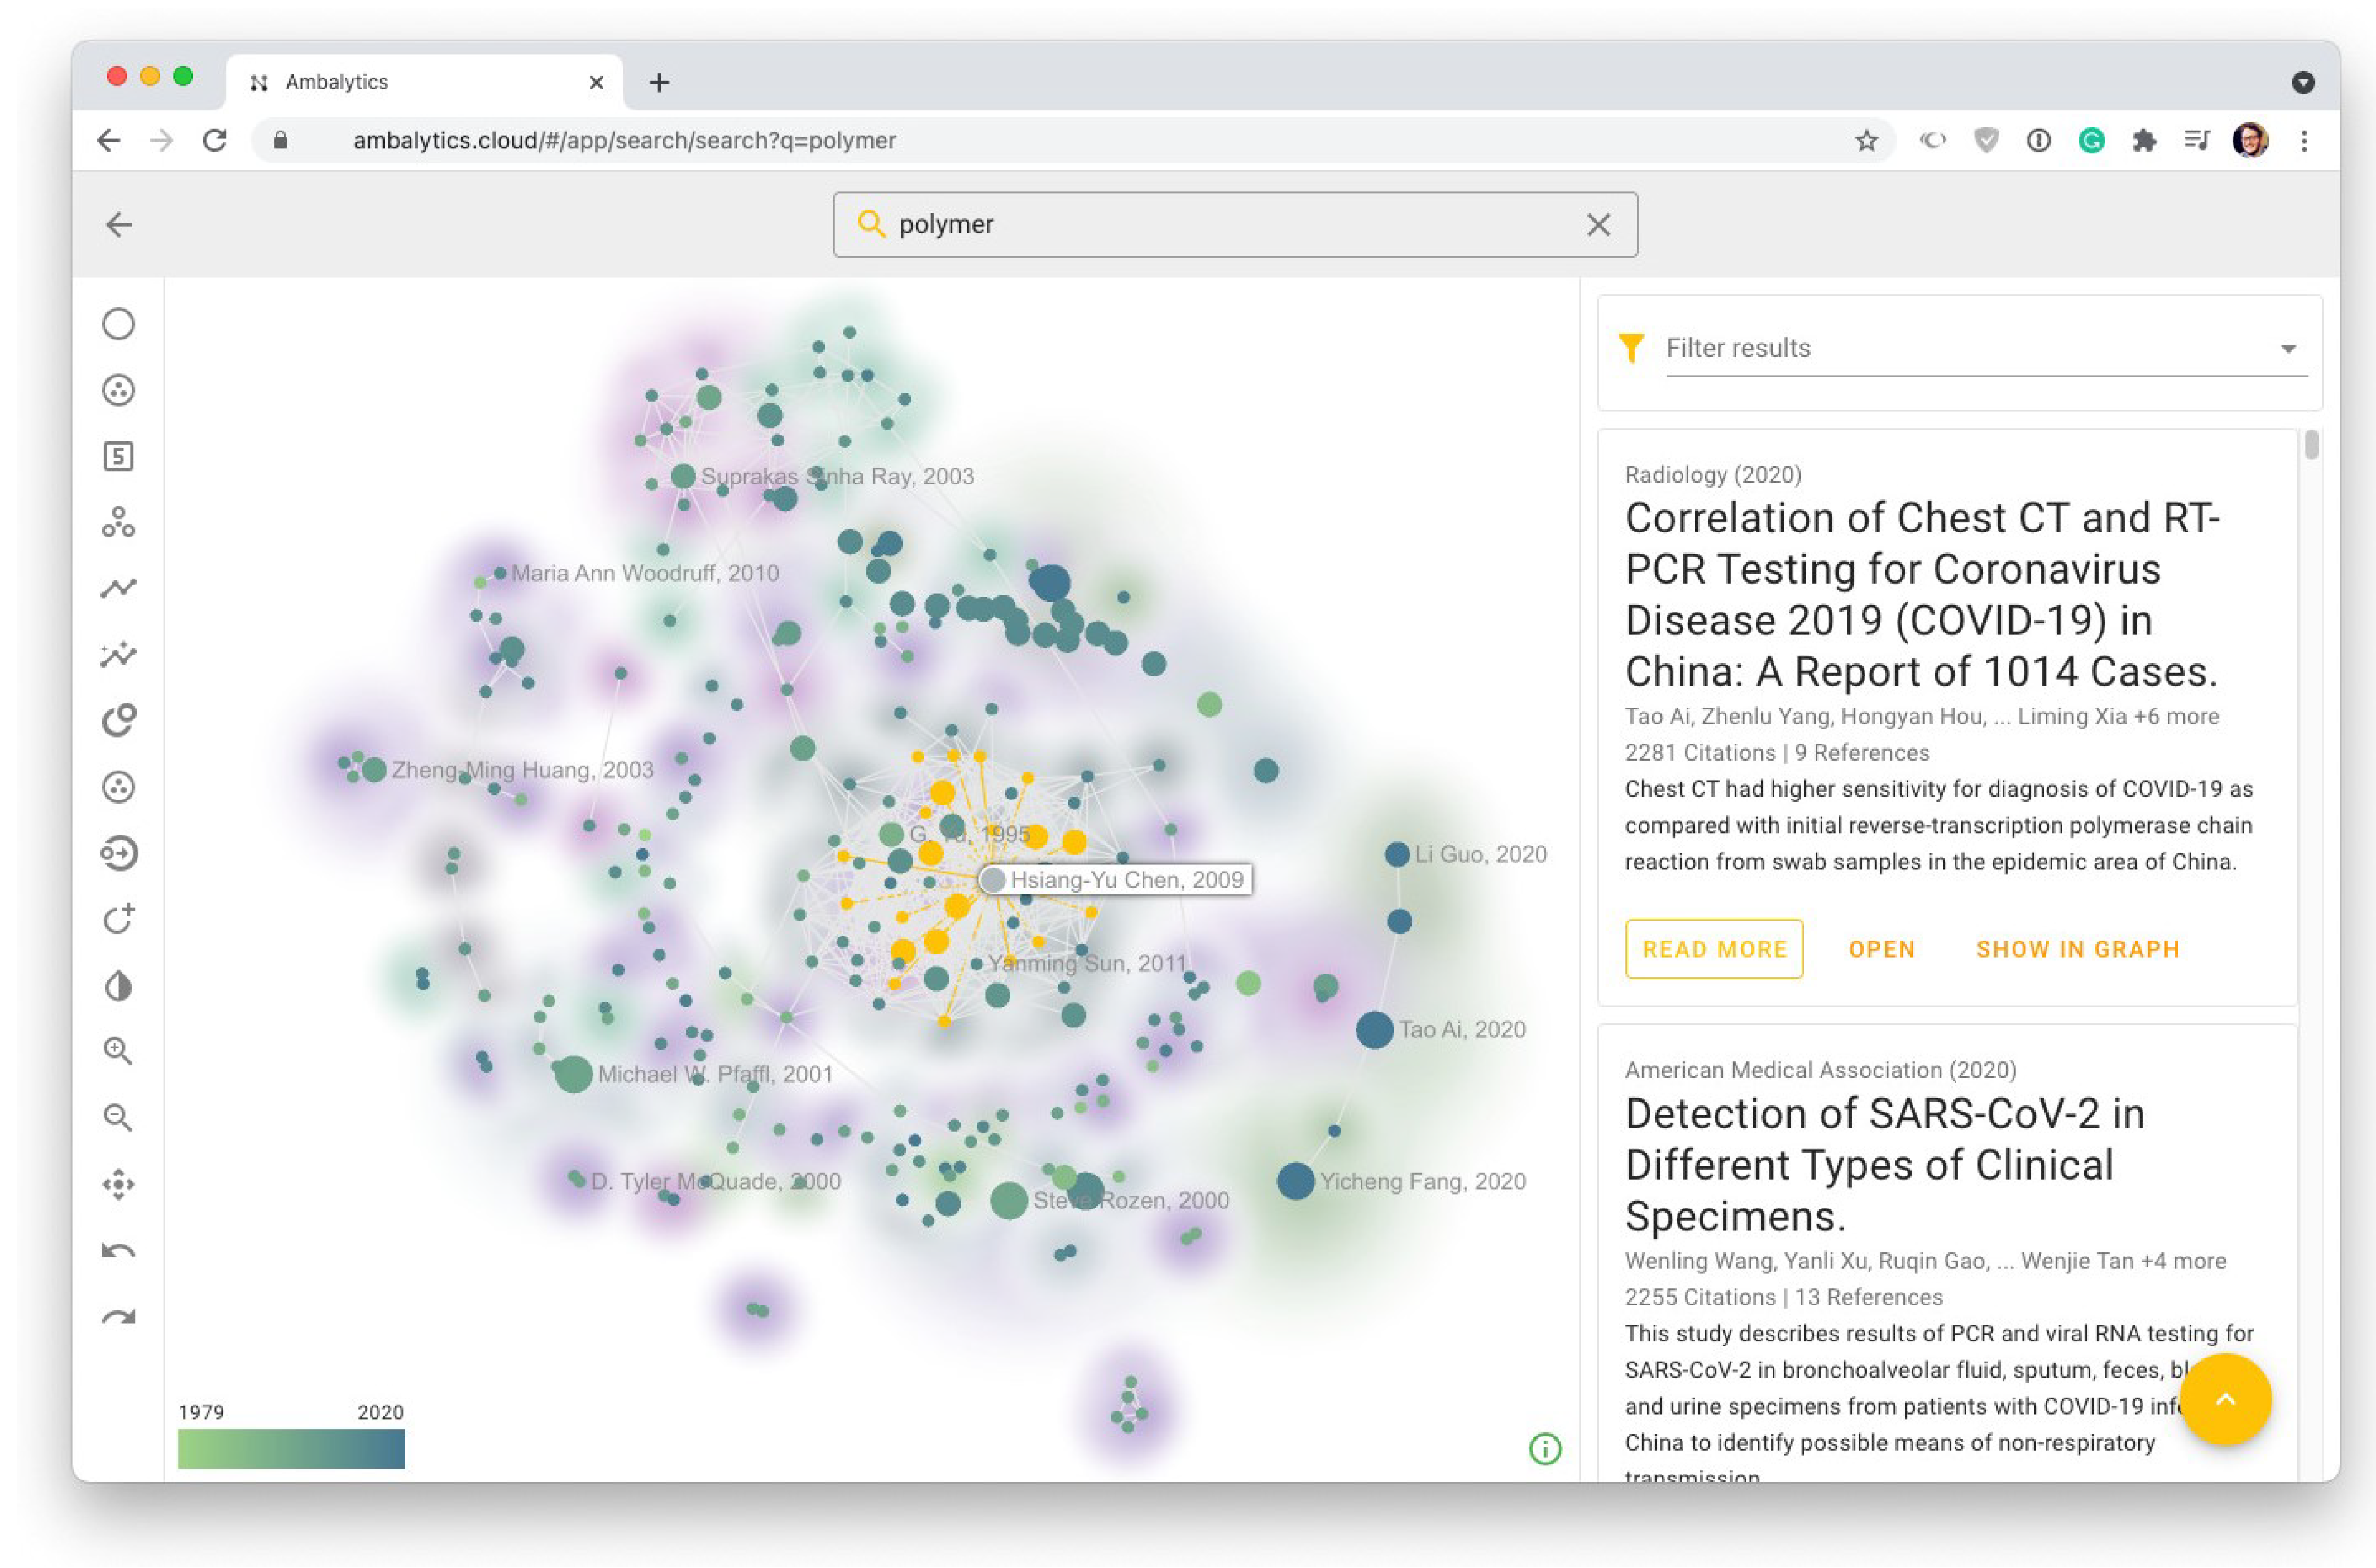
3.11. User Interface

Generally, the system allows the execution of bibliometric analyses based on a set of bibliometric entities. When starting to use the system, the user enters a search query on the system’s start page. The query is processed, and the search result is presented to the user (see Figure 14). In order to obtain detailed insights, a list view per bibliographic entity is available including a text search with which the user can search for entities. For example, in case of publications, when selecting a record in the list, a detail view provides information about the publication containing the title, authors, keywords, categories, publisher, the abstract, and citation metrics.
Furthermore, found publications are displayed as an interactive graph. Immediately after the search results are displayed, a citation graph is shown with publications as nodes and direct citations as edges between the nodes. In addition, a Hybrid Similarity Graph is calculated in the background that can be activated in a toolbar after the calculations have been completed.
A Hybrid Similarity Graph shows similarities between the respective publications as distance. The closer two publications are actually presented, the more thematically similar they are. A Hybrid Similarity Graph also displays the individual calculated communities with the help of background colors and allows a quick visual inspection of the structure of search results. Clicking on a node displays additional information as a pop-over and shows the corresponding publication in the results list.
The graph rendering web component uses WebGL for fast rendering of nodes and edges using the graphics card of the respective device [38]. For this purpose, the sigma.js (sigmajs.org (accessed on 6 May 2021)) framework was used as a basis and completely rewritten in terms of the rendering performance and display options (drop shadows for displaying communities and touch functions). Existing graph rendering frameworks usually use an HTML5 canvas to render graphs and offer a below-average user experience with about 1000 nodes and 2000 edges. The developed graph component runs smoothly on commodity hardware and a modern browser supporting WebGL up to 20,000 elements with an average of 25 frames per second.
In this part of the work, two important aspects were discussed. At first, a user survey identified that the calculation of hybrid research fronts is actually demanded by most users, which was the reason to first implement it with the ambalytics platform. Furthermore, it was revealed that users crave an easy-to-use system. On top of these two findings, general requirements and user stories could be identified for a technical solution on bibliometric analyses.
Following the identification of requirements, the architecture and operating principles of ambalytics were shown and how they provide research fronts as well as an easy-to-use access to the system. The essential parts, in turn, constitute the technology stack, the system containers, and the developed data model, which were all presented in detail. Through a flexible system design (see Figure 10), the goals of creating a scalable and easy-to-use system are addressed. With respect to the shown screenshot in Figure 14, which depicts a calculated research front, we propose that ambalytics can be further developed to an appealing system that is able to fulfill the demands of users.
However, in-depth studies on the usability as well as the scalability are necessary to confirm this. Despite the need of further studies for ambalytics, general considerations on architectures and insights on the operating principles are needed in the context of bibliometric analyses, which was emphasized by a recent review of bibliometric analysis software tools [39]. For all of the discussed works in [39], no system insights were provided, and neither was an emphasis put on usability or scalability. In addition, most existing tools focus on particular aspects rather than creating integrated infrastructures. Although ambalytics must reveal in future works whether its architecture can fulfill this integrated view, we consider the discussion of a system architecture like that shown for ambalytics as an important preliminary step.

4. Results and Discussion

During the creation of the system, several issues emerged. With the goal of creating a scalable system, the complexity of distributed systems must be added to the list of challenges, and the wide variety of premature cloud technologies make architectural and technological decisions nontrivial. In addition, retrieving bibliometric data automatically from existing providers is a real challenge due to the fact that there is a lack of affordable bibliometric APIs. In addition, the range of bibliometric programming frameworks can be considered relatively small. In order to understand the decisions and choices made during development of the software architecture, the rationales behind architectural decisions and technological selections are further explained.

4.1. Architectural Decisions

After searching for and the evaluation of bibliographic data providers, it became clear that there is a lack of freely accessible, public APIs for bibliometric data retrieval. In addition, the established databases, such as Scopus or Web of Science, limit the use of their bibliometric data for software-as-a-service approaches. Their APIs are also costly, and the allowed number of exported elements is limited. This led to the design decision not to rely on such APIs but instead to set up our own databases and services for bibliometric data.
For this purpose, the bibliometric data available under the Open Data Commons license from Microsoft Academic was revealed to be suitable. These data are updated every 2 to 4 weeks and also made available in Microsoft Azure. The Microsoft Academic Graph (MAG) is generated automatically using crawlers and other services and, in addition to the bibliometric entities, also provides data on related publications and offers broad support for other languages and the writing systems, such as Cyrillic and traditional Chinese.
Compared to other bibliometric data providers, such as Web of Science or Scopus, MAG offers a considerable scope with over 260 million publications (as of 2021-05-28). However, it lags somewhat behind the two classical services in terms of data quality, e.g., duplicate detection, according to the authors of [40]. A study from 2021 confirms MAG’s high coverage and quality, including of non-English academic writings [41].
The microservice architecture suggests to vertically split the persistence layer and data model to provide an independent persistence layer and data model per microservice. Bibliometric datasets generated for analysis are large in size, e.g., a single dataset may contain up to 100,000 records. Furthermore, a bibliometric dataset depicts a graph that may be analyzed using graph algorithms, which may run faster on graph databases compared to relational databases due to the nature how relations are stored in a graph database.
The latter pose a significantly better performance on string matching [42], which is needed to provide a fast-string search of bibliographic data to the user. For these reasons, graph-based computations, such as breadth-first and depth-first searches, are performed on an in-memory graph database that holds a subset of the bibliometric entity attributes. In contrast, classical retrieval operations on the whole dataset are performed on a relational database cluster using indexed attributes (e.g., a unique MAG entity id) and SQL joins.
Full-text search operations, for example, on the title and abstract of publications, are performed based on specially optimized query strategies (e.g., fuzzy or proximity queries) and index structures of a search engine, such as suffix trees or directed acyclic word graphs [43]. For the implementation of the ambalytics prototype, the external Microsoft PAK service was used. Alternatively, a separate search cluster instance based on ElasticSearch could have been used (see Section 3.7).

4.2. Technological Selection

Bibliometric analyses are computed by the analysis ad hoc runner container. For implementation, Apache Spark (spark.apache.org (accessed on 6 May 2021)), bibliometrix, and custom implementation in Python were considered as candidates. Apache Spark “is a unified analytics engine for large-scale data processing” [44], while bibliometrix is a R package that implements many bibliometric analyses. Initially, Apache Spark was tested by implementing the term frequency algorithm as an example.
The algorithm compares the similarity of records by the words given in their abstracts resulting in a similarity matrix. It took 10.0 minutes to compute the term frequency of 1000 records with Apache Spark on a 2.6 GHz 6-Core Intel Core i7 with 6.2 GB RAM. In bibliometrix, all analyses are not implemented in a parallelizable way, which means that, for example, only one processor core is used for calculations. This led to the decision not to use Apache Spark or bibliometrix and to instead implement bibliometric analysis in Python for ad hoc analysis, as speed is critical for smooth display of bibliometric networks in the web front end and numeric frameworks are well established in the Python ecosystem.
The Spring framework was chosen for implementation as it comes with many required functionalities, such as providing an interface for the implementation of a REST API, an interface for accessing the Java persistence API, and an implementation of an OAuth2 authorization server.
Docker is selected as the runtime container, since it is the de facto standard for application containerization. For cloud orchestration, Kubernetes was chosen, as it is an open source product with great popularity (65.5k stars on Github in April 2020) and stability (initial release: 7 June 2014). KrakenD was chosen for realizing the API gateway, as it is suitable for distributed runtime setting in Kubernetes.
For work scheduling, Apache Airflow (airflow.apache.org (accessed on 6 May 2021)) was considered. After investigation and a proof-of-concept implementation, we determined that Apache Airflow did not meet the requirements of ad hoc work scheduling and execution. Instead, it is used for regularly running work tasks that are scheduled by time [45].
Due to the lack of tools providing ad hoc work scheduling, the work scheduler has to be implemented from scratch based on lock-free Single-Producer/Single-Consumer (SPSC) queues [46]. For job scheduling, Kubernetes Job API was selected as it provides container-based batch processing and dynamic scaling of compute and memory resources based on per job defined resource requirements. Furthermore, it fits to the infrastructure concept, as Kubernetes is already used for orchestration.

4.3. Related Work

Comparable to ambalytics, bibliometric tools exist as desktop programs, programming libraries, and web-based solutions, which are presented and delimited in the following [47]. A tabular overview of the tools can be found in Appendix A. In addition, a recent work also summarizes existing tools in a comparative manner [39].
Bibliometric tools, such as CiteNetExplorer [5], Citespace [48], SciMAT [49], and VOSViewer [6] provide bibliometric analyses as a desktop application. They support the creation of bibliometric networks, but not the creation of hybrid research fronts networks and cannot be easily scaled due to their technical implementation, in contrast to ambalytics. In addition, these tools require manual parameterization of the analyses.
In addition, bibliometric programming frameworks exist for the programming languages Python (Tethne (github.com/diging/tethne (accessed on 11 June 2021)), Bibliotool [50], metaknowledge [51]), and R (bibliometrix [4]). They can be used to generate bibliometric networks; however, the computation for most of these frameworks is not implemented in parallel.
In addition, programming skills are required. The respective analyses can be flexibly parameterized, but this requires extensive knowledge in dealing with bibliometric analyses. The presented bibliometric tools and the programming frameworks have in common that bibliometric data, in contrast to the seamless and automated integration in ambalytics, have to be exported manually from a bibliometric data provider and, subsequently, imported into the respective tool.
Furthermore, web-based solutions exist that use bibliometric or comparable analyses. CoCites (cocites.com (accessed on 11 June 2021)) calculates co-citations of publications and is a browser plugin that displays a button below recognized publications for standard publication search engines, like Google Scholar (scholar.google.com (accessed on 11 June 2021)) and PubMed [52]. The number of found co-citations is displayed. A click on the button leads to a list of co-citations. CoCites only supports the calculation of co-citations and does not offer any other functions in addition to the publication list.
ConnectedPapers (connectedpapers.com (accessed on 11 June 2021)) is a website that displays thematically similar publications as a graph based on a publication using co-citation and bibliographic coupling. In contrast to the ambalytics platform, only an initial single seed of a publication is supported instead of a full-text search. Furthermore, ConnectedPapers does not offer the possibility to customize the applied algorithm. The graph component is limited to the display of fewer than 50 nodes. In contrast to ambalytics, an HTML5 canvas is used, which leads to a (1) frame rate below 20 per second and (2) noticeable delays when panning and zooming the graph, even with a set of 50 nodes. According to its information, SemanticScholar is used as bibliometric data provider [53]. However, there is no information on the infrastructure structure or used technologies provided.
Inciteful (inciteful.xyz (accessed on 11 June 2021)), similar to ConnectedPapers, generates a publication graph based on a single seed publication and subsequent deep search. Inciteful is programmed in Rust and does not use a scalable infrastructure. The Microsoft Academic Graph is used as the bibliometric data source, the web-based interface is programmed in React (reactjs.org (accessed on 11 June 2021)) and presents publication abstracts from SemanticScholar.
Similarity between two publications is calculated using the Adamic/Adar algorithm: It is defined as the sum of the inverse log degree centrality of the common neighbors of two nodes [54]. An advantage of Adamic/Adar is its time complexity of O ( E ) with E be the number of edges, respectively the number of citations. Thus, it is faster than calculating hybrid research fronts, whose time complexity is O ( V 2 ) with V be the number of publications. However, the similarities computed with Adamic/Adar are less accurate than the hybrid similarities used by ambalytics, partly due to the lack of lexical analysis and partly due to the locally bounded similarity measure computed with Adamic/Adar.
Ambalytics combines the following features of the presented approaches: (1) a web-based implementation that can be easily used by inexperienced users, (2) features to calculate of hybrid research fronts, and (3) a description of a flexible architecture concept. A recently presented up-to-date review of existing tools [39] also revealed no other approach that combines these three aspects. In particular, the presentation of architectures is less considered so far.
We are fully aware that (1) usability studies and (2) scalability experiments are needed in future works to confirm that the developed architecture of ambalytics actually fulfills the intended goals. We therefore consider the shown concept and its capabilities only as the first and preliminary step of an integrated system that enables users to create bibliometric analyses more easily and with a high expressiveness in terms of literature coverage.

5. Conclusions

Bibliometric analyses are a quantitative approach for literature analysis and help researchers to keep track of their field of research. Furthermore, research managers can use it to quantify academic output. Until now, conducting bibliometric analyses required highly skilled individuals with statistical knowledge and programming skills. Consequently, to make these methods available for a broader audience, the complexity of the application of bibliometric analyses should be reduced. Software systems can help to achieve this goal. However, available tools either require mathematical and programming skills or do not offer comprehensive functionality simultaneously.
This paper contributes ambalytics, a microservice platform that is capable of calculating research fronts networks (as the first calculation on top of the presented architecture) in a scalable manner and embodies a foundation for a system that meets the demands for a platform capable of feature-rich bibliometric analyses. Based on a software requirement specification, the system’s concept was presented. Due to its distributed nature, different microservices and containers are the foundation of the system, which are deployed in a Kubernetes environment.
Various containers for computing bibliometric networks, such as research fronts networks and the application of community detection algorithms, have been implemented. The execution of analyses containers was orchestrated by using Kubernetes Jobs. Bibliometric data is made available via different data structures in a runtime-optimized way, which enables fast search results on bibliometric subgraphs.
The system is designed to be scalable and extensible, for example, to support further bibliometric network calculations and bibliometric methods. However, several technical issues are still open and require further research. For example, to support complex multi-step analyses, a scheduler implementing coordinated batch processing, on top of the existing Kubernetes Job API, is needed. Furthermore, investigations are needed to improve the overall performance by adding multi-core or GPU implementations for computation-intensive analyses.
Additionally, support for further bibliographic data providers may be added, and other data sources may be integrated. Finally, the web-based interface must be continuously evolved, e.g., by a feature creating reports on research trends. We also plan to develop a mobile application that will provide an integrated visualization of publication graphs. More importantly, two studies must be conducted. One to evaluate the usability of the system and one that investigates the performance of the system in terms of scalability.
As discussed, ambalytics is only the first step toward a powerful tool that fulfills the intended goals of an easy-to-use system; however, we consider the creation of a flexible architecture as an important step. Since we were able to realize the calculation of hybrid research fronts as the first implemented feature on top of the architecture, ambalytics and its overall design appear promising.

Author Contributions

Conceptualization, K.K. and M.G.; data curation, M.G.; writing—original draft preparation, K.K.; writing—review and editing, R.P., M.G. and M.R.; supervision, R.P. and M.R. All authors have read and agreed to the published version of the manuscript.

Funding

This research received no external funding.

Data Availability Statement

Data sharing is not applicable to this article.

Conflicts of Interest

The authors declare no conflict of interest.

Abbreviations

The following abbreviations are used in this manuscript:
APIApplication Programming Interface
CLICommand Line Interface
DAGDirected Acyclic Graph
DOIDocument Object Identifier
DFMDocument Feature Matrix
DSLDomain Specific Language
EERExtended Entity Relationship
FRFunctional Requirement
HSHybrid Similarity Matrix
IDIdentifier
KDDKnowledge Discovery in Databases
MAGMicrosoft Academic Graph
RESTREpresentational State Transfer
TF/IDFTerm Frequency/Inverse Document Frequency
UCUse Case
USUser Story

Appendix A. Overview of Bibliometric Tools

Table A1. Tool overview.
AspectCitespaceCitNetExplorerSciMATVOSViewer
DeveloperCollege of Computing and Informatics, Drexel UniversityCentre for Science and Technology Studies, Leiden UniversityResearch Group Soft Computing and Intelligent Information Systems, University of GranadaCentre for Science and Technology Studies, Leiden University
Primary Use CaseTrends Visualization with Bibliometric AnalysisBibliometric Analysis and VisualizationBibliometric Analysis and VisualizationBibliometric Analysis and Visualization
Application Type/ ArchitectureDesktopDesktopDesktopDesktop
Programming LanguagesJavaJavaJavaJava
Automatic Data Retrieval
Pre−ProcessingTime slicing, data and networks reductionData reductionDe-duplication, time slicing, data reduction
Bibliometric Data SourceWoS, Scopus, CrossRef, Dimensions, PubMed, arXiv, customWoS, customWoS, Scopus, PubMed, customWoS, Scopus, PubMed
Initial SeedDatasetDatasetDatasetDataset
Network AnalysisCitation, Co-citation, Bibliographic couplingCitationCitation, Co-citation, Bibliographic couplingCitation, Co-citation, Bibliographic coupling
Community Detection++++
Lexical Analysis++
GraphVisualization++++
− = not available, + = available/supported, N/A = not applicable.
Table A2. Tool overview.
AspectTethneBibliometrixBibliotoolsMetaknowledge
DeveloperDigital Innovation Group, Arizona State UniversityCommunity-driven, Department of Economics and Management, Università della Campania Luigi VanvitelliSébastian GrauwinNetlab, University of Waterloo
Primary Use CaseProgramming Library for Bibliometric AnalysisProgramming Library for Bibliometric AnalysisProgramming Library for Bibliometric AnalysisProgramming Library for Bibliometric Analysis
Application Type/ArchitectureProgramming LibraryProgramming LibraryProgramming Library, Desktop (BiblioMaps)Programming Library
Programming
Languages
PythonRPythonPython
Automatic Data Retrieval
Pre-Processing+Data and networks reduction
BibliometricData SourceWoS, JSTOR, ScopusWoS, Scopus, Dimensions, Cochrane, PubMedWoS, ScopusWoS, Scopus, PubMed
Initial SeedDatasetDatasetDatasetDataset
Network AnalysisCitation, Co-citation, Bibliographic couplingCitation, Co-citation, Bibliographic couplingCitation, Co-citation, Bibliographic couplingCitation, Co-citation, Bibliographic coupling
CommunityDetection++
Lexical Analysis+
GraphVisualizationplot− (with Bibliomaps)-
− = not available, + = available/supported, N/A = not applicable.
Table A3. Tool overview.
AspectCoCitesConnectedPapersIncitefulAmbalytics
DeveloperRollins School of Public Health of Emory University, AtlantaTel Aviv UniversityunknownInstitute of Databases and Information Systems, Ulm University and Institute of Clinical Epidemiology and Biometry, University of Würzburg
Primary Use CaseDiscovery of related publicationsDiscovery of related publicationsDiscovery of related publicationsPublication search, discovery of related publications, bibliometric analysis
Application Type/ArchitectureBrowser Plugin/unknownWeb-based/unknownWeb-based/unknownWeb-based/Micro-service architecture + Kubernetes
Programming LanguagesunknownunknownRust, React.jsJava, Python, Vue.js
Automatic Data Retrieval++++
Pre-ProcessingN/AunknownunknownDe-duplication, data and networks reduction
BibliometricData SourceNIH Open Citation Collection (NIH-OCC)SemanticScholarMicrosoft Academic, SemanticScholarMicrosoft Academic (WoS, Scopus, PubMed planned)
Initial SeedSingle PublicationSingle PublicationSingle Publication, extensibleIncluded keyword-based search: Single Publication, extensible
Network AnalysisCo-citationCombination of Co-citation and bibliographic couplingCitation, Co-citationCitation, Co-citation, bibliographic coupling
CommunityDetection+
Lexical Analysis+
GraphVisualization++
− = not available, + = available/supported, N/A = not applicable.

References

  1. Havemann, F. Einführung in die Bibliometrie; Gesellschaft für Wissenschaftsforschung: Berlin, Germany, 2009. [Google Scholar]
  2. Ozdemir, S. Principles of Data Science; Packt Publishing: Birmingham, UK, 2016. [Google Scholar]
  3. Göster, M. Citarics—A Microservice Platform for Bibliometric Network Analysis and Visualization. Master’s Thesis, Ulm University, Ulm, Germany, 2020. [Google Scholar]
  4. Aria, M.; Cuccurullo, C. bibliometrix: An R-tool for Comprehensive Science Mapping Analysis. J. Informetr. 2017, 11, 959–975. [Google Scholar] [CrossRef]
  5. Van Eck, N.J.; Waltman, L. CitNetExplorer: A New Software Tool for Analyzing and Visualizing Citation Networks. J. Informetr. 2014, 8, 802–823. [Google Scholar] [CrossRef] [Green Version]
  6. Van Eck, N.J.; Waltman, L. VOSviewer Manual. Available online: https://www.vosviewer.com/documentation/Manual_VOSviewer_1.6.8.pdf (accessed on 11 June 2021).
  7. Persson, O.; Danell, R.; Schneider, J.W. How to Use Bibexcel for Various Types of Bibliometric Analysis. In Celebrating Scholarly Communication Studies: A Festschrift for Olle Persson at his 60th Birthday; International Society for Scientometrics and Informetrics: Berlin, Germany, 2009; Volume 5, pp. 9–24. [Google Scholar]
  8. Knutas, A.; Hajikhani, A.; Salminen, J.; Ikonen, J.; Porras, J. Cloud-Based Bibliometric Analysis Service for Systematic Mapping Studies. In Proceedings of the 16th International Conference on Computer Systems and Technologies, Dublin, Ireland, 25–26 June 2015; pp. 184–191. [Google Scholar]
  9. Zammit, A.; Penza, K.; Haddod, F.; Abela, C.; Azzopardi, J. ACE: Big Data Approach to Scientific Collaboration Patterns Analysis. In Proceedings of the Scientometrics and Enabling Decentralised Scholarly Communication, Portorož, Slovenia, 28 May 2017; Volume 1878. [Google Scholar]
  10. Cyberinfrastructure for Network Science Center, Indiana University at Bloomington. Sci2 Tool. 2009. Available online: https://sci2.cns.iu.edu/ (accessed on 6 May 2021).
  11. Sinha, A.; Shen, Z.; Song, Y.; Ma, H.; Eide, D.; Hsu, B.J.; Wang, K. An Overview of Microsoft Academic Service (MAS) and Applications. In Proceedings of the 24th International Conference on World Wide Web, Florence, Italy, 18–22 May 2015; pp. 243–246. [Google Scholar]
  12. Weber, B.; Reichert, M.; Rinderle-Ma, S. Change Patterns and Change Support Features—Enhancing Flexibility in Process-aware Information Systems. Data Knowl. Eng. 2008, 66, 438–466. [Google Scholar] [CrossRef] [Green Version]
  13. Hoppenstedt, B.; Pryss, R.; Stelzer, B.; Meyer-Brötz, F.; Kammerer, K.; Treß, A.; Reichert, M. Techniques and Emerging Trends for State of the Art Equipment Maintenance Systems—A Bibliometric Analysis. Appl. Sci. 2018, 8, 916. [Google Scholar] [CrossRef] [Green Version]
  14. Ellegaard, O.; Wallin, J.A. The Bibliometric Analysis of Scholarly Production: How Great is the Impact? Scientometrics 2015, 105, 1809–1831. [Google Scholar] [CrossRef] [Green Version]
  15. Manning, C.D.; Raghavan, P.; Schütze, H. An Introduction to Information Retrieval; Cambridge University Press: Cambridge, UK, 2008. [Google Scholar]
  16. Stelzer, B.; Meyer-Brötz, F.; Schiebel, E.; Brecht, L. Combining the Scenario Technique With Bibliometrics for Technology Foresight: The Case of Personalized Medicine. Technol. Forecast. Soc. Chang. 2015, 98, 137–156. [Google Scholar] [CrossRef]
  17. Meyer-Brötz, F. A Bibliometric Technique for Quantitative Technology Foresight. Ph.D. Thesis, Universität Ulm, Ulm, Germany, 2019. [Google Scholar] [CrossRef]
  18. Price, D.J.D.S. Networks of Scientific Papers. Science 1965, 149, 510–515. [Google Scholar] [CrossRef] [PubMed]
  19. Tokunaga, T.; Makoto, I. Text Categorization Based on Weighted Inverse Document Frequency; Special Interest Groups and Information Process Society of Japan: Tokyo, Japan, 1994; pp. 33–39. [Google Scholar]
  20. Meyer-Brötz, F.; Schiebel, E.; Brecht, L. Experimental Evaluation of Parameter Settings in Calculation of Hybrid Similarities: Effects of First- and Second-order Similarity, Edge Cutting, and Weighting Factors. Scientometrics 2017, 111, 1307–1325. [Google Scholar] [CrossRef]
  21. Salton, G.; Buckley, C. Term-Weighting Approaches in Automatic Text Retrieval. Inf. Process. Manag. 1988, 24, 513–523. [Google Scholar] [CrossRef] [Green Version]
  22. Glänzel, W.; Thijs, B. Using ‘Core Documents’ for the Representation of Clusters and Topics. Scientometrics 2011, 88, 297–309. [Google Scholar] [CrossRef]
  23. Herman, I.; Melancon, G.; Marshall, M.S. Graph Visualization and Navigation in Information Visualization: A Survey. IEEE Trans. Vis. Comput. Graph. 2000, 6, 24–43. [Google Scholar] [CrossRef] [Green Version]
  24. Cabena, P.; Hadjinian, P.; Stadler, R.; Verhees, J.; Zanasi, A. Discovering Data Mining: From Concept to Implementation; Prentice-Hall, Inc.: Hoboken, NJ, USA, 1998. [Google Scholar]
  25. Everitt, B.; Landau, S.; Leese, M.; Stahl, D. Cluster Analysis; Wiley Series in Probability and Statistics; Wiley: Hoboken, NJ, USA, 2011. [Google Scholar]
  26. Guidotti, R.; Coscia, M. On the Equivalence Between Community Discovery and Clustering. In Smart Objects and Technologies for Social Good; Springer: Cham, Switzerland, 2018; pp. 342–352. [Google Scholar]
  27. Fortunato, S. Community Detection in Graphs. Phys. Rep. 2010, 486, 75–174. [Google Scholar] [CrossRef] [Green Version]
  28. Blondel, V.D.; Guillaume, J.L.; Lambiotte, R.; Lefebvre, E. Fast Unfolding of Communities in Large Networks. J. Stat. Mech. Theory Exp. 2008, 2008, P10008. [Google Scholar] [CrossRef] [Green Version]
  29. Cobo, M.J.; López-Herrera, A.G.; Herrera-Viedma, E.; Herrera, F. Science Mapping Software tools: Review, Analysis, and Cooperative Study Among Tools. J. Am. Soc. Inf. Sci. Technol. 2011, 62, 1382–1402. [Google Scholar] [CrossRef]
  30. Kortgen, A.; Niederprüm, P.; Bauer, M. Implementation of an evidence-based “standard operating procedure” and outcome in septic shock. Crit. Care Med. 2006, 34, 943–949. [Google Scholar] [CrossRef]
  31. Stellman, A.; Greene, J. Applied Software Project Management; O’Reilly: Newton, MA, USA, 2006. [Google Scholar]
  32. Richards, M.; Ford, N. Fundamentals of Software Architecture: An Engineering Approach; O’Reilly: Newton, MA, USA, 2020. [Google Scholar]
  33. Brown, S. Software Architecture for Developers. Available online: http://static.codingthearchitecture.com/sddconf2014-software-architecture-for-developers-extract.pdf (accessed on 6 May 2021).
  34. Linux Foundation. Kubernetes. 2020. Available online: https://kubernetes.io/ (accessed on 6 May 2021).
  35. Linux Foundation. Cloud Native Computing Foundation. 2020. Available online: https://www.cncf.io/ (accessed on 6 May 2021).
  36. Linux Foundation. Kubernetes Documentation. 2020. Available online: https://kubernetes.io/docs/ (accessed on 6 May 2021).
  37. Ushio, T. Kubernetes in Three Diagrams. 2018. Available online: https://medium.com/@tsuyoshiushio/kubernetes-in-three-diagrams-6aba8432541c (accessed on 6 May 2021).
  38. Matsuda, K.; Lea, R. WebGL Programming Guide: Interactive 3D Graphics Programming with WebGL; Addison-Wesley: Boston, MA, USA, 2013. [Google Scholar]
  39. Moral Muñoz, J.A.; Herrera Viedma, E.; Santisteban Espejo, A.; Cobo, M.J. Software Tools for Conducting Bibliometric Analysis in Science: An up-to-Date Review. 2020. Available online: http://hdl.handle.net/10498/22857 (accessed on 7 July 2021).
  40. Hug, S.E.; Ochsner, M.; Brändle, M.P. Citation Analysis with Microsoft Academic. Scientometrics 2017, 111, 371–378. [Google Scholar] [CrossRef] [Green Version]
  41. Visser, M.; van Eck, N.J.; Waltman, L. Large-scale Comparison of Bibliographic Data Sources: Scopus, Web of Science, Dimensions, Crossref, and Microsoft Academic. Quant. Sci. Stud. 2021, 2, 20–41. [Google Scholar] [CrossRef]
  42. Vicknair, C.; Macias, M.; Zhao, Z.; Nan, X.; Chen, Y.; Wilkins, D. A Comparison of a Graph Database and a Relational Database: A Data Provenance Perspective. In Proceedings of the 48th Annual Southeast Regional Conference, Oxford, MS, USA, 15–17 April 2010. [Google Scholar] [CrossRef]
  43. Meyer, U.; Sanders, P. Algorithms for Memory Hierarchies: Advanced Lectures; Springer Science & Business Media: Berlin/Heidelberg, Germany, 2003; Volume 2625. [Google Scholar]
  44. Apache Software Foundation. Apache Spark. 2020. Available online: https://spark.apache.org/ (accessed on 6 May 2021).
  45. White, C. Why Not Airflow? 2020. Available online: https://medium.com/the-prefect-blog/why-not-airflow-4cfa423299c4 (accessed on 6 May 2021).
  46. Aldinucci, M.; Danelutto, M.; Kilpatrick, P.; Meneghin, M.; Torquati, M. An Efficient Unbounded Lock-free Queue for Multi-core Systems. In European Conference on Parallel Processing; Springer: Berlin/Heidelberg, Germany, 2012; pp. 662–673. [Google Scholar]
  47. Bankar, R.S.; Lihitkar, S.R. Science Mapping and Visualization Tools used for Bibliometric and Scientometric Studies: A Comparative Study. J. Adv. Libr. Sci. 2019, 6, 382–394. [Google Scholar]
  48. Synnestvedt, M.B.; Chen, C.; Holmes, J.H. CiteSpace II: Visualization and Knowledge Discovery in Bibliographic Databases. In Proceedings of the AMIA Annual Symposium Proceedings. American Medical Informatics Association, Washington, DC, USA, 22–26 October 2005; Volume 2005, p. 724. [Google Scholar]
  49. Cobo, M.J.; López-Herrera, A.G.; Herrera-Viedma, E.; Herrera, F. SciMAT: A New Science Mapping Analysis Software Tool. J. Am. Soc. Inf. Sci. Technol. 2012, 63, 1609–1630. [Google Scholar] [CrossRef]
  50. Grauwin, S.; Jensen, P. Mapping Scientific Institutions. Scientometrics 2011, 89, 943–954. [Google Scholar] [CrossRef] [Green Version]
  51. McLevey, J.; McIlroy-Young, R. Introducing metaknowledge: Software for Computational Research in Information Science, Network Analysis, and Science of Science. J. Informetr. 2017, 11, 176–197. [Google Scholar] [CrossRef]
  52. Roberts, R.J. PubMed Central: The GenBank of the Published Literature. 2001. Available online: https://www.pnas.org/content/98/2/381.full (accessed on 6 May 2021).
  53. Ammar, W.; Groeneveld, D.; Bhagavatula, C.; Beltagy, I.; Crawford, M.; Downey, D.; Dunkelberger, J.; Elgohary, A.; Feldman, S.; Ha, V.; et al. Construction of the Literature Graph in Semantic Scholar. arXiv 2018, arXiv:1805.02262. [Google Scholar]
  54. Adamic, L.A.; Adar, E. Friends and Neighbors on the Web. Soc. Netw. 2003, 25, 211–230. [Google Scholar] [CrossRef] [Green Version]
Figure 1. Example conference proceedings publication highlighting bibliographic metadata [12].
Futureinternet 13 00203 g001
Figure 2. Bibliometric networks—overview.
Futureinternet 13 00203 g002
Figure 3. Co-citation and bibliographic coupling [13].
Futureinternet 13 00203 g003
Figure 4. The process of computing and visualizing research fronts.
Futureinternet 13 00203 g004
Figure 5. 3D Fruchterman–Reingold visualization of bibliographic data.
Futureinternet 13 00203 g005
Figure 6. Steps of the Louvain algorithm, adapted from [28].
Futureinternet 13 00203 g006
Figure 7. Example research fronts network.
Futureinternet 13 00203 g007
Figure 8. Bibliometric analysis process.
Futureinternet 13 00203 g008
Figure 9. Analysis schema.
Futureinternet 13 00203 g009
Figure 10. System containers and their relations within the software architecture.
Futureinternet 13 00203 g010
Figure 11. UML sequence diagram for “bibliometric networks computation”.
Futureinternet 13 00203 g011
Figure 12. Kubernetes architecture components, adapted from [37].
Futureinternet 13 00203 g012
Figure 13. System data model: bibliographic entities.
Futureinternet 13 00203 g013
Figure 14. Search results page with graph visualization.
Futureinternet 13 00203 g014
Table 1. Functional requirements.
NameSummaryRationale
Search for Bibliometric EntitiesCreate a dataset by executing a search query.In order to execute a bibliometric analysis, a dataset containing bibliometric entities is needed.
Provide Bibliometric EntitiesProvide an interface to retrieve bibliometric entities.The use of bibliometric entities and their attributes, such as the abstract of a publication, is a prerequisite for performing a full-text search and computing hybrid similarity networks.
Results Search and SortingProvide an interface to search for bibliographic entity attributes in search results.It is essential to have a capable text search within search results as it typically consists of several hundred or thousand publications.
Descriptive StatisticsCompute descriptive metrics of the given search result.Users are interested in search result descriptive metrics, such as a time-based distribution, to orient themselves and obtain an overview.
Bibliometric Networks ComputationCreate bipartite or similarity graphs of bibliometric entities.A user wants to use bibliometric networks to obtain a better overview of a research field, find related publications, or identify research trends.
Visualization of Analysis ResultsComputed descriptive statistics and bibliometric networks have to be visualized.Appropriate visualizations are appealing and provide fast insights to a user.
Parallel Execution of Computation-intensive TasksDistribute computation-intensive tasks, such as network calculations, across processes and computing hardware.Parallel computations are required to ensure high speed in the creation of bibliometric networks.
Publisher’s Note: MDPI stays neutral with regard to jurisdictional claims in published maps and institutional affiliations.

