
Optical Methods for Non-Invasive Determination of Skin Penetration: Current Trends, Advances, Possibilities, Prospects, and Translation into In Vivo Human Studies

Abstract
:
1. Introduction
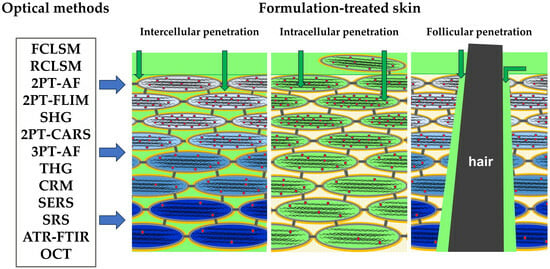
2. Skin Barrier Function and Penetration Pathways
3. Confocal Laser Scanning Microscopy (CLSM)
3.1. CLSM in Skin Morphology Imaging
3.2. Fluorescence CLSM (FCLSM)—Skin Penetration Studies
3.3. Reflectance CLSM (RCLSM)—Skin Penetration Studies
3.4. CLSM—Advantages, Limitations, and Applied Substance Requirements
4. Multi-Photon Tomography (MPT)
4.1. Two-Photon Tomography (2PT) in Skin Morphology Imaging
4.2. 2PT-AF—Skin Penetration Studies
4.3. 2PT-FLIM—Skin Penetration Studies
4.4. SHG—Skin Penetration Studies
4.5. 2PT-CARS—Skin Penetration Studies
4.6. Three-Photon Tomography (3PT) in Skin Imaging and Penetration Studies
4.7. MPT—Advantages, Limitations, and Applied Substance Requirements
5. Confocal Raman Micro-Spectroscopy (CRM)
5.1. CRM in Chemical Skin Research
5.2. “Tracking Specific Raman Band” Method—Skin Penetration Studies
5.3. “Non-Restricted Multiple Least Squares Fit” Method—Skin Penetration Studies
5.4. “Partial Least Squares Regression” Method—Skin Penetration Studies
5.5. “Gaussian-Function-Based Decomposition” Method—Skin Penetration Studies
5.6. “Non-Negative Matrix Factorization” Method—Skin Penetration Studies
5.7. “Tailored Multivariate Curve Resolution–Alternating Least Squares” Method—Skin Penetration Studies
5.8. CRM—Advantages, Limitations, and Applied Substance Requirements
6. Surface-Enhanced Raman Scattering (SERS) Microscopy
6.1. SERS—Skin Penetration Studies
6.2. SERS—Advantages, Limitations, and Applied Substance Requirements
7. Stimulated Raman Scattering (SRS) Microscopy
7.1. SRS—Skin Penetration Studies
7.2. SRS—Advantages, Limitations, and Applied Substance Requirements
8. Optical Coherence Tomography (OCT)
8.1. OCT—Skin Penetration Studies
8.2. OCT—Advantages, Limitations, and Applied Substance Requirements
9. Conclusions and Future Prospects
Funding
Conflicts of Interest
Abbreviations
| 2PT | two-photon tomography |
| 3PT | three photon tomography |
| AF | autofluorescence |
| APIs | active pharmaceutical ingredients |
| ATR-FTIR | attenuated total reflectance Fourier-transform infrared |
| BMDP-D | deuterated betamethasone dipropionate |
| CARS | coherent anti-Stokes Raman scattering |
| CLSM | confocal laser scanning microscopy |
| CRM | confocal Raman micro-spectroscopy |
| DMSO | dimethyl sulfoxide |
| EPR | electron paramagnetic resonance |
| FCIs | functional cosmetic ingredients |
| FCLSM | fluorescence confocal laser scanning microscopy |
| FITC | fluorescein 5-isothiocyanate |
| FLIM | fluorescence lifetime imaging |
| FCLSM | fluorescence confocal laser scanning microscopy |
| FP | fingerprint (400–2200 cm−1 spectral region) |
| FTIR-PAS | Fourier-transform infrared photoacoustic spectroscopy |
| HWN | high wavenumber (2500–4000 cm−1 spectral region) |
| LDA | linear discriminant analysis |
| MPT | multi-photon tomography |
| NAD(P)H | nicotinamide adenine dinucleotide phosphate |
| NMF | non-restricted multiple least squares fit |
| NMF molecules | natural moisturizing factor molecules |
| NNMF | non-negative matrix factorization |
| OCT | optical coherence tomography |
| PCA | principal component analysis |
| PCA | 3-(Carboxy)-2,2,5,5-tetramethyl-1-pyrrolidinyloxy |
| PLSR | partial least squares regression |
| RCLSM | reflectance confocal laser scanning microscopy |
| RCM | reflectance confocal microscopy |
| RCLSM | reflectance confocal laser scanning microscopy |
| RS | Raman spectroscopy |
| SC | stratum corneum |
| SERS | surface-enhanced Raman scattering |
| SHG | second-harmonic generation |
| Skin-PAMPA | skin parallel artificial membrane permeability assay |
| SRS | stimulated Raman scattering |
| TEMPO | 2,2,6,6-Tetramethylpiperidin-1-yl)oxyl |
| TED-FTIR | thermal emission decay–Fourier-transform infrared |
| TERS | tip-enhanced Raman spectroscopy |
| TEWL | transepidermal water loss |
| THG | third-harmonic generation |
| tMCR-ALS | tailored multivariate curve resolution–alternating least squares |
| UV/VIS | ultraviolet/visible (light) |
| ω1PEF | frequency of one-photon-excited fluorescence |
| ω2PEF | frequency of two-photon-excited fluorescence |
| ω3PEF | frequency of three-photon-excited fluorescence |
| ωaS | frequency of anti-Stokes scattering light |
| ωp | frequency of probe laser beam |
| ωR | frequency of Rayleigh scattering light |
| ωS | frequency of Stokes scattering light |
References
- Tampucci, S.; Burgalassi, S.; Chetoni, P.; Monti, D. Cutaneous Permeation and Penetration of Sunscreens: Formulation Strategies and In Vitro Methods. Cosmetics 2018, 5, 1. [Google Scholar] [CrossRef]
- Pavlou, P.; Siamidi, A.; Vlachou, M.; Varvaresou, A. UV Filters and Their Distribution on the Skin through Safe, Non-Penetrating Vehicles. J. Cosmet. Sci. 2021, 72, 298–324. [Google Scholar] [PubMed]
- Lane, M.E. Skin Penetration Enhancers. Int. J. Pharm. 2013, 447, 12–21. [Google Scholar] [CrossRef] [PubMed]
- Williams, A.C.; Barry, B.W. Penetration Enhancers. Adv. Drug Deliv. Rev. 2012, 64, 128–137. [Google Scholar] [CrossRef]
- Liu, L.; Zhao, W.; Ma, Q.; Gao, Y.; Wang, W.; Zhang, X.; Dong, Y.; Zhang, T.; Liang, Y.; Han, S.; et al. Functional Nano-Systems for Transdermal Drug Delivery and Skin Therapy. Nanoscale Adv. 2023, 5, 1527–1558. [Google Scholar] [CrossRef]
- Krutmann, J.; Liu, W.; Li, L.; Pan, X.; Crawford, M.; Sore, G.; Seite, S. Pollution and Skin: From Epidemiological and Mechanistic Studies to Clinical Implications. J. Dermatol. Sci. 2014, 76, 163–168. [Google Scholar] [CrossRef]
- Araviiskaia, E.; Berardesca, E.; Bieber, T.; Gontijo, G.; Sanchez Viera, M.; Marrot, L.; Chuberre, B.; Dreno, B. The Impact of Airborne Pollution on Skin. J. Eur. Acad. Dermatol. Venereol. 2019, 33, 1496–1505. [Google Scholar] [CrossRef]
- Tran, P.T.; Tawornchat, P.; Kleuser, B.; Lohan, S.B.; Schleusener, J.; Meinke, M.C.; Darvin, M.E. Red- and Near-Infrared-Excited Autofluorescence as a Marker for Acute Oxidative Stress in Skin Exposed to Cigarette Smoke Ex Vivo and In Vivo. Antioxidants 2023, 12, 1011. [Google Scholar] [CrossRef]
- Martic, I.; Jansen-Dürr, P.; Cavinato, M. Effects of Air Pollution on Cellular Senescence and Skin Aging. Cells 2022, 11, 2220. [Google Scholar] [CrossRef]
- Fitoussi, R.; Faure, M.-O.; Beauchef, G.; Achard, S. Human Skin Responses to Environmental Pollutants: A Review of Current Scientific Models. Environ. Pollut. 2022, 306, 119316. [Google Scholar] [CrossRef]
- Gattu, S.; Maibach, H.I. Modest but Increased Penetration through Damaged Skin: An Overview of the in vivo Human Model. Ski. Pharmacol. Physiol. 2010, 24, 2–9. [Google Scholar] [CrossRef] [PubMed]
- Naegel, A.; Heisig, M.; Wittum, G. Detailed Modeling of Skin Penetration—An Overview. Adv. Drug Deliv. Rev. 2013, 65, 191–207. [Google Scholar] [CrossRef] [PubMed]
- Sun, Y.; Brown, M.B.; Prapopoulou, M.; Davey, N.; Adams, R.G.; Moss, G.P. The Application of Stochastic Machine Learning Methods in the Prediction of Skin Penetration. Appl. Soft Comput. 2011, 11, 2367–2375. [Google Scholar] [CrossRef]
- Jung, E.C.; Maibach, H.I. Animal Models for Percutaneous Absorption. In Topical Drug Bioavailability, Bioequivalence, and Penetration; Shah, V.P., Maibach, H.I., Jenner, J., Eds.; Springer: New York, NY, USA, 2014; pp. 21–40. ISBN 978-1-4939-1289-6. [Google Scholar]
- Sutterby, E.; Thurgood, P.; Baratchi, S.; Khoshmanesh, K.; Pirogova, E. Evaluation of in vitro Human Skin Models for Studying Effects of External Stressors and Stimuli and Developing Treatment Modalities. View 2022, 3, 20210012. [Google Scholar] [CrossRef]
- Kourbaj, G.; Gaiser, A.; Bielfeldt, S.; Lunter, D. Assessment of Penetration and Permeation of Caffeine by Confocal Raman Spectroscopy in vivo and Ex Vivo by Tape Stripping. Int. J. Cosmet. Sci. 2022, 45, 14–28. [Google Scholar] [CrossRef]
- Escobar-Chavez, J.J.; Merino-Sanjuán, V.; López-Cervantes, M.; Urban-Morlan, Z.; Piñón-Segundo, E.; Quintanar-Guerrero, D.; Ganem-Quintanar, A. The Tape-Stripping Technique as a Method for Drug Quantification in Skin. J. Pharm. Pharm. Sci. 2008, 11, 104–130. [Google Scholar] [CrossRef] [PubMed]
- Lademann, J.; Meinke, M.C.; Schanzer, S.; Richter, H.; Darvin, M.E.; Haag, S.F.; Fluhr, J.W.; Weigmann, H.J.; Sterry, W.; Patzelt, A. In Vivo Methods for the Analysis of the Penetration of Topically Applied Substances in and through the Skin Barrier. Int. J. Cosmet. Sci. 2012, 34, 551–559. [Google Scholar] [CrossRef]
- Dong, P.; Nikolaev, V.; Kroger, M.; Zoschke, C.; Darvin, M.E.; Witzel, C.; Lademann, J.; Patzelt, A.; Schafer-Korting, M.; Meinke, M.C. Barrier-Disrupted Skin: Quantitative Analysis of Tape and Cyanoacrylate Stripping Efficiency by Multiphoton Tomography. Int. J. Pharm. 2020, 574, 118843. [Google Scholar] [CrossRef]
- Supe, S.; Takudage, P. Methods for Evaluating Penetration of Drug into the Skin: A Review. Ski. Res. Technol. 2021, 27, 299–308. [Google Scholar] [CrossRef]
- Samant, P.P.; Niedzwiecki, M.M.; Raviele, N.; Tran, V.; Mena-Lapaix, J.; Walker, D.I.; Felner, E.I.; Jones, D.P.; Miller, G.W.; Prausnitz, M.R. Sampling Interstitial Fluid from Human Skin Using a Microneedle Patch. Sci. Transl. Med. 2020, 12, eaaw0285. [Google Scholar] [CrossRef]
- Saifullah, K.M.; Faraji Rad, Z. Sampling Dermal Interstitial Fluid Using Microneedles: A Review of Recent Developments in Sampling Methods and Microneedle-Based Biosensors. Adv. Mater. Interfaces 2023, 10, 2201763. [Google Scholar] [CrossRef]
- Iapichino, M.; Maibach, H.; Stoeber, B. Quantification Methods Comparing in vitro and in vivo Percutaneous Permeation by Microneedles and Passive Diffusion. Int. J. Pharm. 2023, 638, 122885. [Google Scholar] [CrossRef]
- Baumann, K.Y.; Church, M.K.; Clough, G.F.; Quist, S.R.; Schmelz, M.; Skov, P.S.; Anderson, C.D.; Tannert, L.K.; Giménez-Arnau, A.M.; Frischbutter, S.; et al. Skin Microdialysis: Methods, Applications and Future Opportunities—An EAACI Position Paper. Clin. Transl. Allergy 2019, 9, 24. [Google Scholar] [CrossRef] [PubMed]
- Klein, A.L.; Lubda, M.; Skov, P.S.; Vogt, A.; Keck, C.M.; Lademann, J.; Beckers, I.; von Hagen, J.; Patzelt, A. Investigation of Transfollicular Caffeine Penetration Using Microdialysis on Ex Vivo Porcine Ear Skin. Eur. J. Pharm. Biopharm. 2020, 157, 1–8. [Google Scholar] [CrossRef] [PubMed]
- Grégoire, S.; Luengo, G.S.; Hallegot, P.; Pena, A.-M.; Chen, X.; Bornschlögl, T.; Chan, K.F.; Pence, I.; Obeidy, P.; Feizpour, A.; et al. Imaging and Quantifying Drug Delivery in Skin–Part 1: Autoradiography and Mass Spectrometry Imaging. Adv. Drug Deliv. Rev. 2020, 153, 137–146. [Google Scholar] [CrossRef]
- Hao, Z. Mini Review: Mass Spectrometry Technology for Molecule Distribution inside Skin. Adv. Res. Derm. Cosmet. 2022, 1, 1004. [Google Scholar] [CrossRef]
- Souza, C.; Maia Campos, P.M.B.G. Development of a HPLC Method for Determination of Four UV Filters in Sunscreen and Its Application to Skin Penetration Studies. Biomed. Chromatogr. 2017, 31, e4029. [Google Scholar] [CrossRef]
- Keck, C.M.; Abdelkader, A.; Pelikh, O.; Wiemann, S.; Kaushik, V.; Specht, D.; Eckert, R.W.; Alnemari, R.M.; Dietrich, H.; Brüßler, J. Assessing the Dermal Penetration Efficacy of Chemical Compounds with the Ex-Vivo Porcine Ear Model. Pharmaceutics 2022, 14, 678. [Google Scholar] [CrossRef] [PubMed]
- Makuch, E.; Nowak, A.; Günther, A.; Pełech, R.; Kucharski, Ł.; Duchnik, W.; Klimowicz, A. Enhancement of the Antioxidant and Skin Permeation Properties of Eugenol by the Esterification of Eugenol to New Derivatives. AMB Express 2020, 10, 187. [Google Scholar] [CrossRef]
- Wartewig, S.; Neubert, R.H. Pharmaceutical Applications of Mid-IR and Raman Spectroscopy. Adv. Drug Deliv. Rev. 2005, 57, 1144–1170. [Google Scholar] [CrossRef]
- Touitou, E.; Meidan, V.M.; Horwitz, E. Methods for Quantitative Determination of Drug Localized in the Skin. J. Control. Release 1998, 56, 7–21. [Google Scholar] [CrossRef] [PubMed]
- Dias, M.; Naik, A.; Guy, R.H.; Hadgraft, J.; Lane, M.E. In Vivo Infrared Spectroscopy Studies of Alkanol Effects on Human Skin. Eur. J. Pharm. Biopharm. 2008, 69, 1171–1175. [Google Scholar] [CrossRef] [PubMed]
- Notingher, I.; Imhof, R.E. Mid-Infrared in vivo Depth-Profiling of Topical Chemicals on Skin. Ski. Res. Technol. 2004, 10, 113–121. [Google Scholar] [CrossRef]
- Lohan, S.B.; Saeidpour, S.; Solik, A.; Schanzer, S.; Richter, H.; Dong, P.; Darvin, M.E.; Bodmeier, R.; Patzelt, A.; Zoubari, G.; et al. Investigation of the Cutaneous Penetration Behavior of Dexamethasone Loaded to Nano-Sized Lipid Particles by EPR Spectroscopy, and Confocal Raman and Laser Scanning Microscopy. Eur. J. Pharm. Biopharm. 2017, 116, 102–110. [Google Scholar] [CrossRef] [PubMed]
- Kocsis, D.; Kichou, H.; Döme, K.; Varga-Medveczky, Z.; Révész, Z.; Antal, I.; Erdő, F. Structural and Functional Analysis of Excised Skins and Human Reconstructed Epidermis with Confocal Raman Spectroscopy and in Microfluidic Diffusion Chambers. Pharmaceutics 2022, 14, 1689. [Google Scholar] [CrossRef]
- Krombholz, R.; Liu, Y.; Lunter, D.J. In-Line and Off-Line Monitoring of Skin Penetration Profiles Using Confocal Raman Spectroscopy. Pharmaceutics 2021, 13, 67. [Google Scholar] [CrossRef] [PubMed]
- Babaie, S.; Charkhpour, M.; Kouhsoltani, M.; Hamishehkar, H.; Paiva-Santos, A.C. Nano-Invasomes for Simultaneous Topical Delivery of Buprenorphine and Bupivacaine for Dermal Analgesia. Exp. Dermatol. 2023. [Google Scholar] [CrossRef] [PubMed]
- Sinkó, B.; Garrigues, T.M.; Balogh, G.T.; Nagy, Z.K.; Tsinman, O.; Avdeef, A.; Takács-Novák, K. Skin–PAMPA: A New Method for Fast Prediction of Skin Penetration. Eur. J. Pharm. Sci. 2012, 45, 698–707. [Google Scholar] [CrossRef]
- Zsikó, S.; Csányi, E.; Kovács, A.; Budai-Szűcs, M.; Gácsi, A.; Berkó, S. Novel In Vitro Investigational Methods for Modeling Skin Permeation: Skin PAMPA, Raman Mapping. Pharmaceutics 2020, 12, 803. [Google Scholar] [CrossRef] [PubMed]
- Gruber, J.V.; Terpak, N.; Massard, S.; Schwartz, A.; Bojanowski, K. Passive Enhancement of Retinol Skin Penetration by Jojoba Oil Measured Using the Skin Parallel Artificial Membrane Permeation Assay (Skin-PAMPA): A Pilot Study. Clin. Cosmet. Investig. Dermatol. 2023, 16, 317–324. [Google Scholar] [CrossRef]
- Pulsoni, I.; Lubda, M.; Aiello, M.; Fedi, A.; Marzagalli, M.; von Hagen, J.; Scaglione, S. Comparison Between Franz Diffusion Cell and a Novel Micro-Physiological System for In Vitro Penetration Assay Using Different Skin Models. SLAS Technol. 2022, 27, 161–171. [Google Scholar] [CrossRef] [PubMed]
- Neupane, R.; Boddu, S.H.S.; Renukuntla, J.; Babu, R.J.; Tiwari, A.K. Alternatives to Biological Skin in Permeation Studies: Current Trends and Possibilities. Pharmaceutics 2020, 12, 152. [Google Scholar] [CrossRef]
- Vogt, A.; Wischke, C.; Neffe, A.T.; Ma, N.; Alexiev, U.; Lendlein, A. Nanocarriers for Drug Delivery into and through the Skin—Do Existing Technologies Match Clinical Challenges? J. Control. Release 2016, 242, 3–15. [Google Scholar] [CrossRef]
- Kemel, K.; Deniset-Besseau, A.; Baillet-Guffroy, A.; Faivre, V.; Dazzi, A.; Laugel, C. Nanoscale Investigation of Human Skin and Study of Skin Penetration of Janus Nanoparticles. Int. J. Pharm. 2020, 579, 119193. [Google Scholar] [CrossRef] [PubMed]
- Momoh, J.; Kapsokalyvas, D.; Vogt, M.; Hak, S.; Kiessling, F.; van Zandvoort, M.; Lammers, T.; Sofias, A.M. Intravital Microscopy for Real-Time Monitoring of Drug Delivery and Nanobiological Processes. Adv. Drug Deliv. Rev. 2022, 189, 114528. [Google Scholar] [CrossRef]
- Zsikó, S.; Csányi, E.; Kovács, A.; Budai-Szűcs, M.; Gácsi, A.; Berkó, S. Methods to Evaluate Skin Penetration In Vitro. Sci. Pharm. 2019, 87, 19. [Google Scholar] [CrossRef]
- Herkenne, C.; Alberti, I.; Naik, A.; Kalia, Y.N.; Mathy, F.-X.; Préat, V.; Guy, R.H. In Vivo Methods for the Assessment of Topical Drug Bioavailability. Pharm. Res. 2008, 25, 87–103. [Google Scholar] [CrossRef]
- Shahinfar, S.; Maibach, H. In Vitro Percutaneous Penetration Test Overview. Front. Pharmacol. 2023, 14, 1102433. [Google Scholar] [CrossRef]
- Proksch, E.; Brandner, J.M.; Jensen, J.M. The Skin: An Indispensable Barrier. Exp. Dermatol. 2008, 17, 1063–1072. [Google Scholar] [CrossRef]
- Choe, C.; Schleusener, J.; Lademann, J.; Darvin, M.E. Age Related Depth Profiles of Human Stratum Corneum Barrier-Related Molecular Parameters by Confocal Raman Microscopy in vivo. Mech. Ageing Dev. 2018, 172, 6–12. [Google Scholar] [CrossRef] [PubMed]
- Van Smeden, J.; Janssens, M.; Gooris, G.S.; Bouwstra, J.A. The Important Role of Stratum Corneum Lipids for the Cutaneous Barrier Function. Biochim. Et Biophys. Acta (BBA)-Mol. Cell Biol. Lipids 2014, 1841, 295–313. [Google Scholar] [CrossRef] [PubMed]
- Basler, K.; Bergmann, S.; Heisig, M.; Naegel, A.; Zorn-Kruppa, M.; Brandner, J.M. The Role of Tight Junctions in Skin Barrier Function and Dermal Absorption. J. Control. Release 2016, 242, 105–118. [Google Scholar] [CrossRef] [PubMed]
- Brandner, J.M.; Kief, S.; Wladykowski, E.; Houdek, P.; Moll, I. Tight Junction Proteins in the Skin. Ski. Pharm. Physiol. 2006, 19, 71–77. [Google Scholar] [CrossRef] [PubMed]
- Gorzelanny, C.; Mess, C.; Schneider, S.W.; Huck, V.; Brandner, J.M. Skin Barriers in Dermal Drug Delivery: Which Barriers Have to Be Overcome and How Can We Measure Them? Pharmaceutics 2020, 12, 684. [Google Scholar] [CrossRef]
- Lademann, J.; Richter, H.; Schanzer, S.; Meinke, M.C.; Darvin, M.E.; Schleusener, J.; Carrer, V.; Breuckmann, P.; Patzelt, A. Follicular Penetration of Nanocarriers Is an Important Penetration Pathway for Topically Applied Drugs. Hautarzt 2019, 70, 185–192. [Google Scholar] [CrossRef]
- Patzelt, A.; Antoniou, C.; Sterry, W.; Lademann, J. Skin Penetration from the inside to the Outside: A Review. Drug Discov. Today Dis. Mech. 2008, 5, e229–e235. [Google Scholar] [CrossRef]
- Zhang, L.; Dong, Z.; Liu, W.; Wu, X.; He, H.; Lu, Y.; Wu, W.; Qi, J. Novel Pharmaceutical Strategies for Enhancing Skin Penetration of Biomacromolecules. Pharmaceuticals 2022, 15, 877. [Google Scholar] [CrossRef] [PubMed]
- Wilke, K.; Wepf, R.; Keil, F.J.; Wittern, K.-P.; Wenck, H.; Biel, S.S. Are Sweat Glands an Alternate Penetration Pathway? Understanding the Morphological Complexity of the Axillary Sweat Gland Apparatus. Ski. Pharmacol. Physiol. 2005, 19, 38–49. [Google Scholar] [CrossRef]
- Lademann, J.; Richter, H.; Knorr, F.; Patzelt, A.; Darvin, M.E.; Ruhl, E.; Cheung, K.Y.; Lai, K.K.; Renneberg, R.; Mak, W.C. Triggered Release of Model Drug from AuNP-Doped BSA Nanocarriers in Hair Follicles Using IRA Radiation. Acta Biomater. 2016, 30, 388–396. [Google Scholar] [CrossRef]
- Bos, J.D.; Meinardi, M.M.H.M. The 500 Dalton Rule for the Skin Penetration of Chemical Compounds and Drugs. Exp. Dermatol. 2000, 9, 165–169. [Google Scholar] [CrossRef] [PubMed]
- Benson, H.A.E.; Namjosh, S. Proteins and Peptides: Strategies for Delivery to and across the Skin. J. Pharm. Sci. 2008, 97, 3591–3610. [Google Scholar] [CrossRef] [PubMed]
- Patzelt, A.; Richter, H.; Knorr, F.; Schafer, U.; Lehr, C.M.; Dahne, L.; Sterry, W.; Lademann, J. Selective Follicular Targeting by Modification of the Particle Sizes. J. Control. Release 2011, 150, 45–48. [Google Scholar] [CrossRef] [PubMed]
- Nielsen, J.B.; Benfeldt, E.; Holmgaard, R. Penetration through the Skin Barrier. Ski. Barrier Funct. 2016, 49, 103–111. [Google Scholar] [CrossRef]
- Binder, L.; Mazál, J.; Petz, R.; Klang, V.; Valenta, C. The Role of Viscosity on Skin Penetration from Cellulose Ether-Based Hydrogels. Ski. Res. Technol. 2019, 25, 725–734. [Google Scholar] [CrossRef] [PubMed]
- Schafer, N.; Balwierz, R.; Biernat, P.; Ochędzan-Siodłak, W.; Lipok, J. Natural Ingredients of Transdermal Drug Delivery Systems as Permeation Enhancers of Active Substances through the Stratum Corneum. Mol. Pharm. 2023, 20, 3278–3297. [Google Scholar] [CrossRef]
- Alkilani, A.Z.; Nasereddin, J.; Hamed, R.; Nimrawi, S.; Hussein, G.; Abo-Zour, H.; Donnelly, R.F. Beneath the Skin: A Review of Current Trends and Future Prospects of Transdermal Drug Delivery Systems. Pharmaceutics 2022, 14, 1152. [Google Scholar] [CrossRef]
- Zaid Alkilani, A.; McCrudden, M.T.C.; Donnelly, R.F. Transdermal Drug Delivery: Innovative Pharmaceutical Developments Based on Disruption of the Barrier Properties of the Stratum Corneum. Pharmaceutics 2015, 7, 438–470. [Google Scholar] [CrossRef]
- Golovynskyi, S.; Golovynska, I.; Stepanova, L.I.; Datsenko, O.I.; Liu, L.; Qu, J.; Ohulchanskyy, T.Y. Optical Windows for Head Tissues in Near-Infrared and Short-Wave Infrared Regions: Approaching Transcranial Light Applications. J. Biophotonics 2018, 11, e201800141. [Google Scholar] [CrossRef]
- Chinnathambi, S.; Shirahata, N. Recent Advances on Fluorescent Biomarkers of Near-Infrared Quantum Dots for in vitro and in vivo Imaging. Sci. Technol. Adv. Mater. 2019, 20, 337–355. [Google Scholar] [CrossRef]
- Guesmi, K.; Abdeladim, L.; Tozer, S.; Mahou, P.; Kumamoto, T.; Jurkus, K.; Rigaud, P.; Loulier, K.; Dray, N.; Georges, P.; et al. Dual-Color Deep-Tissue Three-Photon Microscopy with a Multiband Infrared Laser. Light. Sci. Appl. 2018, 7, 12. [Google Scholar] [CrossRef]
- Ashtikar, M.A.; Verma, D.D.; Fahr, A. Confocal Microscopy for Visualization of Skin Penetration. In Percutaneous Penetration Enhancers Drug Penetration into/through the Skin: Methodology and General Considerations; Dragicevic, N., Maibach, H.I., Eds.; Springer: Berlin/Heidelberg, Germany, 2017; pp. 255–281. ISBN 978-3-662-53270-6. [Google Scholar]
- Alvarez-Roman, R.; Naik, A.; Kalia, Y.N.; Fessi, H.; Guy, R.H. Visualization of Skin Penetration Using Confocal Laser Scanning Microscopy. Eur. J. Pharm. Biopharm. 2004, 58, 301–316. [Google Scholar] [CrossRef]
- Braghiroli, N.F.; Sugerik, S.; de Freitas, L.A.R.; Oliviero, M.; Rabinovitz, H. The Skin through Reflectance Confocal Microscopy—Historical Background, Technical Principles, and Its Correlation with Histopathology. An. Bras. Dermatol. 2022, 97, 697–703. [Google Scholar] [CrossRef]
- Lee, T.; Senyuk, B.; Trivedi, R.P.; Smalyukh, I.I. Optical Microscopy of Soft Matter Systems. In Fluids, Colloids and Soft Materials; John Wiley & Sons, Ltd.: Hoboken, NJ, USA, 2016; pp. 165–185. ISBN 978-1-119-22051-0. [Google Scholar]
- Shirshin, E.A.; Yakimov, B.P.; Darvin, M.E.; Omelyanenko, N.P.; Rodionov, S.A.; Gurfinkel, Y.I.; Lademann, J.; Fadeev, V.V.; Priezzhev, A.V. Label-Free Multiphoton Microscopy: The Origin of Fluorophores and Capabilities for Analyzing Biochemical Processes. Biochemistry 2019, 84, S69–S88. [Google Scholar] [CrossRef] [PubMed]
- Infante, V.H.P.; Bennewitz, R.; Kröger, M.; Meinke, M.C.; Darvin, M.E. Human Glabrous Skin Contains Crystallized Urea Dendriform Structures in the Stratum Corneum Which Affect the Hydration Levels. Exp. Dermatol. 2023. [Google Scholar] [CrossRef]
- Ilie, M.A.; Caruntu, C.; Lupu, M.; Lixandru, D.; Tampa, M.; Georgescu, S.-R.; Bastian, A.; Constantin, C.; Neagu, M.; Zurac, S.A.; et al. Current and Future Applications of Confocal Laser Scanning Microscopy Imaging in Skin Oncology (Review). Oncol. Lett. 2019, 17, 4102–4111. [Google Scholar] [CrossRef] [PubMed]
- Guida, S.; Arginelli, F.; Farnetani, F.; Ciardo, S.; Bertoni, L.; Manfredini, M.; Zerbinati, N.; Longo, C.; Pellacani, G. Clinical Applications of In Vivo and Ex Vivo Confocal Microscopy. Appl. Sci. 2021, 11, 1979. [Google Scholar] [CrossRef]
- Ilie, M.A.; Caruntu, C.; Lixandru, D.; Tampa, M.; Georgescu, S.-R.; Constantin, M.-M.; Constantin, C.; Neagu, M.; Zurac, S.A.; Boda, D. In Vivo Confocal Laser Scanning Microscopy Imaging of Skin Inflammation: Clinical Applications and Research Directions (Review). Exp. Ther. Med. 2019, 17, 1004–1011. [Google Scholar] [CrossRef] [PubMed]
- Darvin, M.E.; Richter, H.; Zhu, Y.J.; Meinke, M.C.; Knorr, F.; Gonchukov, S.A.; Koenig, K.; Lademann, J. Comparison of in Vivo and Ex Vivo Laser Scanning Microscopy and Multiphoton Tomography Application for Human and Porcine Skin Imaging. Quantum Electron. 2014, 44, 646–651. [Google Scholar] [CrossRef]
- Ulrich, M.; Klemp, M.; Darvin, M.E.; Konig, K.; Lademann, J.; Meinke, M.C. In Vivo Detection of Basal Cell Carcinoma: Comparison of a Reflectance Confocal Microscope and a Multiphoton Tomograph. J. Biomed. Opt. 2013, 18, 61229. [Google Scholar] [CrossRef]
- Shahriari, N.; Grant-Kels, J.M.; Rabinovitz, H.; Oliviero, M.; Scope, A. Reflectance Confocal Microscopy: Principles, Basic Terminology, Clinical Indications, Limitations, and Practical Considerations. J. Am. Acad. Dermatol. 2021, 84, 1–14. [Google Scholar] [CrossRef]
- Schleusener, J.; Lademann, J.; Darvin, M.E. Depth-Dependent Autofluorescence Photobleaching Using 325, 473, 633, and 785 Nm of Porcine Ear Skin Ex Vivo. J. Biomed. Opt. 2017, 22, 91503. [Google Scholar] [CrossRef] [PubMed]
- Darvin, M.E.; Brandt, N.N.; Lademann, J. Photobleaching as a Method of Increasing the Accuracy in Measuring Carotenoid Concentration in Human Skin by Raman Spectroscopy. Opt. Spectrosc. 2010, 109, 205–210. [Google Scholar] [CrossRef]
- Borisova, E.; Pavlova, P.; Pavlova, E.; Troyanova, P.; Avramov, L. Optical Biopsy of Human Skin–A Tool for Cutaneous Tumours’ Diagnosis. Int. J. Bioautom. 2012, 16, 53. [Google Scholar]
- Chen, Y.; Wang, S.; Zhang, F. Near-Infrared Luminescence High-Contrast in vivo Biomedical Imaging. Nat. Rev. Bioeng. 2023, 1, 60–78. [Google Scholar] [CrossRef]
- Yakimov, B.P.; Shirshin, E.A.; Schleusener, J.; Allenova, A.S.; Fadeev, V.V.; Darvin, M.E. Melanin Distribution from the Dermal-Epidermal Junction to the Stratum Corneum: Non-Invasive in vivo Assessment by Fluorescence and Raman Microspectroscopy. Sci. Rep. 2020, 10, 14374. [Google Scholar] [CrossRef] [PubMed]
- Alvarez-Román, R.; Naik, A.; Kalia, Y.N.; Guy, R.H.; Fessi, H. Skin Penetration and Distribution of Polymeric Nanoparticles. J. Control. Release 2004, 99, 53–62. [Google Scholar] [CrossRef] [PubMed]
- Cao, Y.; Wang, C.; Yang, S.; Li, Y.; Yang, X.; Zhang, C.; Ma, J.; Xu, J. Fluorescence Staining and Confocal Laser Scanning Microscopy Study of Hydrogen-Bonded Poly(Vinylpyrrolidone)/Poly(Acrylic Acid) Film. Colloids Surf. A Physicochem. Eng. Asp. 2011, 392, 83–87. [Google Scholar] [CrossRef]
- Svenskaya, Y.I.; Genina, E.A.; Parakhonskiy, B.V.; Lengert, E.V.; Talnikova, E.E.; Terentyuk, G.S.; Utz, S.R.; Gorin, D.A.; Tuchin, V.V.; Sukhorukov, G.B. A Simple Non-Invasive Approach toward Efficient Transdermal Drug Delivery Based on Biodegradable Particulate System. ACS Appl. Mater. Interfaces 2019, 11, 17270–17282. [Google Scholar] [CrossRef]
- Patzelt, A.; Lademann, J.; Richter, H.; Darvin, M.E.; Schanzer, S.; Thiede, G.; Sterry, W.; Vergou, T.; Hauser, M. In Vivo Investigations on the Penetration of Various Oils and Their Influence on the Skin Barrier. Skin Res. Technol. 2012, 18, 364–369. [Google Scholar] [CrossRef] [PubMed]
- Busch, L.; Hanuschik, A.M.; Avlasevich, Y.; Darm, K.; Hochheiser, E.F.; Kohler, C.; Idelevich, E.A.; Becker, K.; Rotsch, P.; Landfester, K.; et al. Advanced Skin Antisepsis: Application of UVA-Cleavable Hydroxyethyl Starch Nanocapsules for Improved Eradication of Hair Follicle-Associated Microorganisms. Pharmaceutics 2023, 15, 609. [Google Scholar] [CrossRef]
- Fuchs, C.S.K.; Ortner, V.K.; Mogensen, M.; Philipsen, P.A.; Haedersdal, M. Transfollicular Delivery of Gold Microparticles in Healthy Skin and Acne Vulgaris, Assessed by in vivo Reflectance Confocal Microscopy and Optical Coherence Tomography. Lasers Surg. Med. 2019, 51, 430–438. [Google Scholar] [CrossRef] [PubMed]
- Subongkot, T.; Charernsriwilaiwat, N.; Chanasongkram, R.; Rittem, K.; Ngawhirunpat, T.; Opanasopit, P. Development and Skin Penetration Pathway Evaluation Using Confocal Laser Scanning Microscopy of Microemulsions for Dermal Delivery Enhancement of Finasteride. Pharmaceutics 2022, 14, 2784. [Google Scholar] [CrossRef] [PubMed]
- Try, C.; Abdel-Mottaleb, M.M.A.; Béduneau, A.; Moulari, B.; Pazart, L.; Vidal, C.; Brunotte, G.; Castelain, F.; Lamprecht, A.; Humbert, P.; et al. Polymeric Nanoparticles’ Accumulation in Atopic Dermatitis: Clinical Comparison between Healthy, Non-Lesional, and Lesional Skin. Pharmaceutics 2023, 15, 1927. [Google Scholar] [CrossRef] [PubMed]
- Simonetti, O.; Kempenaar, J.A.; Ponec, M.; Hoogstraate, A.J.; Bialik, W.; Schrijvers, A.H.G.J.; Boddé, H.E. Visualization of Diffusion Pathways across the Stratum Corneum of Native and In-Vitro-Reconstructed Epidermis by Confocal Laser Scanning Microscopy. Arch Derm. Res 1995, 287, 465–473. [Google Scholar] [CrossRef]
- Grams, Y.Y.; Bouwstra, J.A. Penetration and Distribution of Three Lipophilic Probes in vitro in Human Skin Focusing on the Hair Follicle. J. Control. Release 2002, 83, 253–262. [Google Scholar] [CrossRef]
- Verma, D.D.; Verma, S.; Blume, G.; Fahr, A. Liposomes Increase Skin Penetration of Entrapped and Non-Entrapped Hydrophilic Substances into Human Skin: A Skin Penetration and Confocal Laser Scanning Microscopy Study. Eur. J. Pharm. Biopharm. 2003, 55, 271–277. [Google Scholar] [CrossRef]
- Zaytsev, S.M.; Svenskaya, Y.I.; Lengert, E.V.; Terentyuk, G.S.; Bashkatov, A.N.; Tuchin, V.V.; Genina, E.A. Optimized Skin Optical Clearing for Optical Coherence Tomography Monitoring of Encapsulated Drug Delivery through the Hair Follicles. J. Biophotonics 2020, 13, e201960020. [Google Scholar] [CrossRef]
- Prow, T.W.; Monteiro-Riviere, N.A.; Inman, A.O.; Grice, J.E.; Chen, X.; Zhao, X.; Sanchez, W.H.; Gierden, A.; Kendall, M.A.F.; Zvyagin, A.V.; et al. Quantum Dot Penetration into Viable Human Skin. Nanotoxicology 2012, 6, 173–185. [Google Scholar] [CrossRef]
- Perevedentseva, E.; Ali, N.; Karmenyan, A.; Skovorodkin, I.; Prunskaite-Hyyryläinen, R.; Vainio, S.; Cheng, C.-L.; Kinnunen, M. Optical Studies of Nanodiamond-Tissue Interaction: Skin Penetration and Localization. Materials 2019, 12, 3762. [Google Scholar] [CrossRef]
- Limón, D.; Fábrega, M.J.; Calpena, A.C.; Badia, J.; Baldomà, L.; Pérez-García, L. Multifunctional Serine Protease Inhibitor-Coated Water-Soluble Gold Nanoparticles as a Novel Targeted Approach for the Treatment of Inflammatory Skin Diseases. Bioconjug. Chem. 2018, 29, 1060–1072. [Google Scholar] [CrossRef]
- Khabir, Z.; Partalis, C.; Panchal, J.V.; Deva, A.; Khatri, A.; Garcia-Bennett, A. Enhanced Skin Penetration of Cannabidiol Using Organosilane Particles as Transdermal Delivery Vehicles. Pharmaceutics 2023, 15, 798. [Google Scholar] [CrossRef]
- Otberg, N.; Richter, H.; Knuttel, A.; Schaefer, H.; Sterry, W.; Lademann, J. Laser Spectroscopic Methods for the Characterization of Open and Closed Follicles. Laser Phys. Lett. 2004, 1, 46–49. [Google Scholar] [CrossRef]
- Jacobi, U.; Waibler, E.; Bartoll, J.; Schulze, P.; Sterry, W.; Lademann, J. In Vivo Determination of Doxorubicin and Its Metabolites within the Skin Using Laser Scanning Microscopy. Laser Phys. Lett. 2004, 1, 100–103. [Google Scholar] [CrossRef]
- Jacobi, U.; Waibler, E.; Schulze, P.; Sehouli, J.; Oskay-Özcelik, G.; Schmook, T.; Sterry, W.; Lademann, J. Release of Doxorubicin in Sweat: First Step to Induce the Palmar-Plantar Erythrodysesthesia Syndrome? Ann. Oncol. 2005, 16, 1210–1211. [Google Scholar] [CrossRef] [PubMed]
- Darvin, M.E.; Lademann, J.; von Hagen, J.; Lohan, S.B.; Kolmar, H.; Meinke, M.C.; Jung, S. Carotenoids in Human Skin In Vivo: Antioxidant and Photo-Protectant Role against External and Internal Stressors. Antioxidants 2022, 11, 1451. [Google Scholar] [CrossRef] [PubMed]
- Lademann, J.; Richter, H.; Patzelt, A.; Meinke, M.C.; Gross, I.; Grether-Beck, S.; Krutmann, J.; Frazier, L.; Darvin, M.E. Laser Scanning Microscopy for Control of Skin Decontamination Efficacy from Airborne Particulates Using Highly Absorbent Textile Nanofiber Material in Combination with PEG-12 Dimethicone. Ski. Res. Technol. 2020, 26, 558–563. [Google Scholar] [CrossRef]
- Lademann, J.; Patzelt, A.; Darvin, M.; Richter, H.; Antoniou, C.; Sterry, W.; Koch, S. Application of Optical Non-Invasive Methods in Skin Physiology. Laser Phys. Lett. 2008, 5, 335–346. [Google Scholar] [CrossRef]
- Pereira, M.N.; Nogueira, L.L.; Cunha-Filho, M.; Gratieri, T.; Gelfuso, G.M. Methodologies to Evaluate the Hair Follicle-Targeted Drug Delivery Provided by Nanoparticles. Pharmaceutics 2023, 15, 2002. [Google Scholar] [CrossRef]
- Alnasif, N.; Zoschke, C.; Fleige, E.; Brodwolf, R.; Boreham, A.; Rühl, E.; Eckl, K.-M.; Merk, H.-F.; Hennies, H.C.; Alexiev, U.; et al. Penetration of Normal, Damaged and Diseased Skin—An in vitro Study on Dendritic Core–Multishell Nanotransporters. J. Control. Release 2014, 185, 45–50. [Google Scholar] [CrossRef]
- Suarasan, S.; Craciun, A.-M.; Licarete, E.; Focsan, M.; Magyari, K.; Astilean, S. Intracellular Dynamic Disentangling of Doxorubicin Release from Luminescent Nanogold Carriers by Fluorescence Lifetime Imaging Microscopy (FLIM) under Two-Photon Excitation. ACS Appl. Mater. Interfaces 2019, 11, 7812–7822. [Google Scholar] [CrossRef]
- Yamada, M.; Tayeb, H.; Wang, H.; Dang, N.; Mohammed, Y.H.; Osseiran, S.; Belt, P.J.; Roberts, M.S.; Evans, C.L.; Sainsbury, F.; et al. Using Elongated Microparticles to Enhance Tailorable Nanoemulsion Delivery in Excised Human Skin and Volunteers. J. Control. Release 2018, 288, 264–276. [Google Scholar] [CrossRef] [PubMed]
- Dunn, K.W.; Young, P.A. Principles of Multiphoton Microscopy. Nephron Exp. Nephrol. 2006, 103, e33–e40. [Google Scholar] [CrossRef]
- König, K. Clinical Multiphoton Tomography. J. Biophotonics 2008, 1, 13–23. [Google Scholar] [CrossRef]
- Szyc, L.; Scharlach, C.; Haenssle, H.; Fink, C. In Vivo Two-Photon-Excited Cellular Fluorescence of Melanin, NAD(P)H, and Keratin Enables an Accurate Differential Diagnosis of Seborrheic Keratosis and Pigmented Cutaneous Melanoma. JBO 2021, 26, 075002. [Google Scholar] [CrossRef] [PubMed]
- Klemp, M.; Meinke, M.C.; Weinigel, M.; Rowert-Huber, H.J.; Konig, K.; Ulrich, M.; Lademann, J.; Darvin, M.E. Comparison of Morphologic Criteria for Actinic Keratosis and Squamous Cell Carcinoma Using in vivo Multiphoton Tomography. Exp. Derm. 2016, 25, 218–222. [Google Scholar] [CrossRef]
- König, K. Review: Clinical in vivo Multiphoton FLIM Tomography. Methods Appl. Fluoresc. 2020, 8, 034002. [Google Scholar] [CrossRef]
- Stracke, F.; Weiss, B.; Lehr, C.-M.; König, K.; Schaefer, U.F.; Schneider, M. Multiphoton Microscopy for the Investigation of Dermal Penetration of Nanoparticle-Borne Drugs. J. Investig. Dermatol. 2006, 126, 2224–2233. [Google Scholar] [CrossRef]
- Weinigel, M.; Breunig, H.G.; Kellner-Hofer, M.; Buckle, R.; Darvin, M.E.; Klemp, M.; Lademann, J.; Konig, K. In Vivo Histology: Optical Biopsies with Chemical Contrast Using Clinical Multiphoton/Coherent Anti-Stokes Raman Scattering Tomography. Laser Phys. Lett. 2014, 11, 55601. [Google Scholar] [CrossRef]
- Wang, H.; Lee, A.M.D.; Frehlick, Z.; Lui, H.; McLean, D.I.; Tang, S.; Zeng, H. Perfectly Registered Multiphoton and Reflectance Confocal Video Rate Imaging of in vivo Human Skin. J. Biophoton. 2013, 6, 305–309. [Google Scholar] [CrossRef] [PubMed]
- Breunig, H.G.; Weinigel, M.; Buckle, R.; Kellner-Hofer, M.; Lademann, J.; Darvin, M.E.; Sterry, W.; Konig, K. Clinical Coherent Anti-Stokes Raman Scattering and Multiphoton Tomography of Human Skin with a Femtosecond Laser and Photonic Crystal Fiber. Laser Phys. Lett. 2013, 10, 025604. [Google Scholar] [CrossRef]
- Alexiev, U.; Volz, P.; Boreham, A.; Brodwolf, R. Time-Resolved Fluorescence Microscopy (FLIM) as an Analytical Tool in Skin Nanomedicine. Eur. J. Pharm. Biopharm. 2017, 116, 111–124. [Google Scholar] [CrossRef] [PubMed]
- Huck, V.; Gorzelanny, C.; Thomas, K.; Getova, V.; Niemeyer, V.; Zens, K.; Unnerstall, T.R.; Feger, J.S.; Fallah, M.A.; Metze, D.; et al. From Morphology to Biochemical State–Intravital Multiphoton Fluorescence Lifetime Imaging of Inflamed Human Skin. Sci. Rep. 2016, 6, 22789. [Google Scholar] [CrossRef]
- Suhling, K.; Hirvonen, L.M.; Levitt, J.A.; Chung, P.-H.; Tregidgo, C.; Le Marois, A.; Rusakov, D.A.; Zheng, K.; Ameer-Beg, S.; Poland, S.; et al. Fluorescence Lifetime Imaging (FLIM): Basic Concepts and Some Recent Developments. Med. Photonics 2015, 27, 3–40. [Google Scholar] [CrossRef]
- Pena, A.-M.; Decencière, E.; Brizion, S.; Sextius, P.; Koudoro, S.; Baldeweck, T.; Tancrède-Bohin, E. In Vivo Melanin 3D Quantification and Z-Epidermal Distribution by Multiphoton FLIM, Phasor and Pseudo-FLIM Analyses. Sci. Rep. 2022, 12, 1642. [Google Scholar] [CrossRef] [PubMed]
- Shirshin, E.A.; Gurfinkel, Y.I.; Priezzhev, A.V.; Fadeev, V.V.; Lademann, J.; Darvin, M.E. Two-Photon Autofluorescence Lifetime Imaging of Human Skin Papillary Dermis in vivo: Assessment of Blood Capillaries and Structural Proteins Localization. Sci. Rep. 2017, 7, 1171. [Google Scholar] [CrossRef]
- Kroger, M.; Scheffel, J.; Nikolaev, V.V.; Shirshin, E.A.; Siebenhaar, F.; Schleusener, J.; Lademann, J.; Maurer, M.; Darvin, M.E. In Vivo Non-Invasive Staining-Free Visualization of Dermal Mast Cells in Healthy, Allergy and Mastocytosis Humans Using Two-Photon Fluorescence Lifetime Imaging. Sci. Rep. 2020, 10, 14930. [Google Scholar] [CrossRef]
- Kröger, M.; Scheffel, J.; Shirshin, E.A.; Schleusener, J.; Meinke, M.C.; Lademann, J.; Maurer, M.; Darvin, M.E. Label-Free Imaging of M1 and M2 Macrophage Phenotypes in the Human Dermis in vivo Using Two-Photon Excited FLIM. eLife 2022, 11, e72819. [Google Scholar] [CrossRef]
- Stringari, C.; Abdeladim, L.; Malkinson, G.; Mahou, P.; Solinas, X.; Lamarre, I.; Brizion, S.; Galey, J.-B.; Supatto, W.; Legouis, R.; et al. Multicolor Two-Photon Imaging of Endogenous Fluorophores in Living Tissues by Wavelength Mixing. Sci. Rep. 2017, 7, 3792. [Google Scholar] [CrossRef]
- Liu, L.; Yang, Q.; Zhang, M.; Wu, Z.; Xue, P. Fluorescence Lifetime Imaging Microscopy and Its Applications in Skin Cancer Diagnosis. J. Innov. Opt. Health Sci. 2019, 12, 1930004. [Google Scholar] [CrossRef]
- König, K.; Breunig, H.G.; Bückle, R.; Kellner-Höfer, M.; Weinigel, M.; Büttner, E.; Sterry, W.; Lademann, J. Optical Skin Biopsies by Clinical CARS and Multiphoton Fluorescence/SHG Tomography. Laser Phys. Lett. 2011, 8, 465. [Google Scholar] [CrossRef]
- König, A.; König, K. Reflectance Confocal Microscopy of Human Skin Using near Infrared Femtosecond Laser Pulses. In Proceedings of the Multiphoton Microscopy in the Biomedical Sciences XXII, San Francisco, CA, USA, 3 March 2022; SPIE: Bellingham, WA, USA, 2022; Volume 11965, pp. 14–20. [Google Scholar]
- Koehler, M.J.; Speicher, M.; Lange-Asschenfeldt, S.; Stockfleth, E.; Metz, S.; Elsner, P.; Kaatz, M.; König, K. Clinical Application of Multiphoton Tomography in Combination with Confocal Laser Scanning Microscopy for in vivo Evaluation of Skin Diseases. Exp. Dermatol. 2011, 20, 589–594. [Google Scholar] [CrossRef] [PubMed]
- König, K.; Ehlers, A.; Stracke, F.; Riemann, I. In Vivo Drug Screening in Human Skin Using Femtosecond Laser Multiphoton Tomography. Ski. Pharmacol. Physiol. 2006, 19, 78–88. [Google Scholar] [CrossRef] [PubMed]
- Yu, B.; Blankschtein, D.; Langer, R.; Dong, C.-Y.; So, P.T.C. In Vitro Visualization and Quantification of Oleic Acid Induced Changes in Transdermal Transport Using Two-Photon Fluorescence Microscopy. J. Investig. Dermatol. 2001, 117, 16–25. [Google Scholar] [CrossRef] [PubMed]
- Yu, B.; Langer, R.; Blankschtein, D.; Kim, K.H.; So, P.T.C. Visualization of Oleic Acid-Induced Transdermal Diffusion Pathways Using Two-Photon Fluorescence Microscopy. J. Investig. Dermatol. 2003, 120, 448–455. [Google Scholar] [CrossRef]
- Grewal, B.S.; Naik, A.; Irwin, W.J.; Gooris, G.; de Grauw, C.J.; Gerritsen, H.G.; Bouwstra, J.A. Transdermal Macromolecular Delivery: Real-Time Visualisation of Iontophoretic and Chemically Enhanced Transport Using Two-Photon Excitation Microscopy. Pharm. Res. 2000, 17, 788–795. [Google Scholar] [CrossRef]
- Labouta, H.I.; Kraus, T.; El-Khordagui, L.K.; Schneider, M. Combined Multiphoton Imaging-Pixel Analysis for Semiquantitation of Skin Penetration of Gold Nanoparticles. Int. J. Pharm. 2011, 413, 279–282. [Google Scholar] [CrossRef]
- Zvyagin, A.V.; Zhao, X.; Gierden, A.; Sanchez, W.; Ross, J.A.; Roberts, M.S. Imaging of Zinc Oxide Nanoparticle Penetration in Human Skin in vitro and in vivo. J. Biomed. Opt. 2008, 13, 064031. [Google Scholar] [CrossRef]
- Schenke-Layland, K.; Riemann, I.; Damour, O.; Stock, U.A.; König, K. Two-Photon Microscopes and in vivo Multiphoton Tomographs—Powerful Diagnostic Tools for Tissue Engineering and Drug Delivery. Adv. Drug Deliv. Rev. 2006, 58, 878–896. [Google Scholar] [CrossRef] [PubMed]
- Vergou, T.; Patzelt, A.; Schanzer, S.; Meinke, M.C.; Weigmann, H.J.; Thiede, G.; Sterry, W.; Lademann, J.; Darvin, M.E. Methods for the Evaluation of the Protective Efficacy of Sunscreen Products. Ski. Pharmacol. Physiol. 2013, 26, 30–35. [Google Scholar] [CrossRef]
- Mouras, R.; Rischitor, G.; Downes, A.; Salter, D.; Elfick, A. Nonlinear Optical Microscopy for Drug Delivery Monitoring and Cancer Tissue Imaging. J. Raman Spectrosc. 2010, 41, 848–852. [Google Scholar] [CrossRef]
- Alhibah, M.; Kröger, M.; Schanzer, S.; Busch, L.; Lademann, J.; Beckers, I.; Meinke, M.C.; Darvin, M.E. Penetration Depth of Propylene Glycol, Sodium Fluorescein and Nile Red into the Skin Using Non-Invasive Two-Photon Excited FLIM. Pharmaceutics 2022, 14, 1790. [Google Scholar] [CrossRef]
- Darvin, M.E.; Konig, K.; Kellner-Hoefer, M.; Breunig, H.G.; Werncke, W.; Meinke, M.C.; Patzelt, A.; Sterry, W.; Lademann, J. Safety Assessment by Multiphoton Fluorescence/Second Harmonic Generation/Hyper-Rayleigh Scattering Tomography of ZnO Nanoparticles Used in Cosmetic Products. Ski. Pharmacol. Physiol. 2012, 25, 219–226. [Google Scholar] [CrossRef] [PubMed]
- Roberts, M.S.; Dancik, Y.; Prow, T.W.; Thorling, C.A.; Lin, L.L.; Grice, J.E.; Robertson, T.A.; König, K.; Becker, W. Non-Invasive Imaging of Skin Physiology and Percutaneous Penetration Using Fluorescence Spectral and Lifetime Imaging with Multiphoton and Confocal Microscopy. Eur. J. Pharm. Biopharm. 2011, 77, 469–488. [Google Scholar] [CrossRef]
- Zhu, Y.; Choe, C.S.; Ahlberg, S.; Meinke, M.C.; Alexiev, U.; Lademann, J.; Darvin, M.E. Penetration of Silver Nanoparticles into Porcine Skin Ex Vivo Using Fluorescence Lifetime Imaging Microscopy, Raman Microscopy, and Surface-Enhanced Raman Scattering Microscopy. J. Biomed. Opt. 2015, 20, 051006. [Google Scholar] [CrossRef]
- König, K.; Raphael, A.P.; Lin, L.; Grice, J.E.; Soyer, H.P.; Breunig, H.G.; Roberts, M.S.; Prow, T.W. Applications of Multiphoton Tomographs and Femtosecond Laser Nanoprocessing Microscopes in Drug Delivery Research. Adv. Drug Deliv. Rev. 2011, 63, 388–404. [Google Scholar] [CrossRef] [PubMed]
- Jeong, S.; Hermsmeier, M.; Osseiran, S.; Yamamoto, A.; Nagavarapu, U.; Chan, K.F.; Evans, C.L. Visualization of Drug Distribution of a Topical Minocycline Gel in Human Facial Skin. Biomed. Opt. Express BOE 2018, 9, 3434–3448. [Google Scholar] [CrossRef]
- Jeong, S.; Greenfield, D.A.; Hermsmeier, M.; Yamamoto, A.; Chen, X.; Chan, K.F.; Evans, C.L. Time-Resolved Fluorescence Microscopy with Phasor Analysis for Visualizing Multicomponent Topical Drug Distribution within Human Skin. Sci. Rep. 2020, 10, 5360. [Google Scholar] [CrossRef] [PubMed]
- Alex, A.; Frey, S.; Angelene, H.; Neitzel, C.D.; Li, J.; Bower, A.J.; Spillman, D.R., Jr.; Marjanovic, M.; Chaney, E.J.; Medler, J.L.; et al. In Situ Biodistribution and Residency of a Topical Anti-inflammatory Using Fluorescence Lifetime Imaging Microscopy. Br. J. Dermatol. 2018, 179, 1342–1350. [Google Scholar] [CrossRef] [PubMed]
- Bird, D.K.; Schneider, A.L.; Watkinson, A.C.; Finnin, B.; Smith, T.A. Navigating Transdermal Diffusion with Multiphoton Fluorescence Lifetime Imaging. J. Microsc. 2008, 230, 61–69. [Google Scholar] [CrossRef]
- Witting, M.; Boreham, A.; Brodwolf, R.; Vávrová, K.; Alexiev, U.; Friess, W.; Hedtrich, S. Interactions of Hyaluronic Acid with the Skin and Implications for the Dermal Delivery of Biomacromolecules. Mol. Pharm. 2015, 12, 1391–1401. [Google Scholar] [CrossRef]
- Roberts, M.S.; Roberts, M.J.; Robertson, T.A.; Sanchez, W.; Thörling, C.; Zou, Y.; Zhao, X.; Becker, W.; Zvyagin, A.V. In Vitro and in vivo Imaging of Xenobiotic Transport in Human Skin and in the Rat Liver. J. Biophotonics 2008, 1, 478–493. [Google Scholar] [CrossRef] [PubMed]
- Leite-Silva, V.R.; Le Lamer, M.; Sanchez, W.Y.; Liu, D.C.; Sanchez, W.H.; Morrow, I.; Martin, D.; Silva, H.D.; Prow, T.W.; Grice, J.E.; et al. The Effect of Formulation on the Penetration of Coated and Uncoated Zinc Oxide Nanoparticles into the Viable Epidermis of Human Skin in vivo. Eur. J. Pharm. Biopharm. 2013, 84, 297–308. [Google Scholar] [CrossRef]
- Liu, D.C.; Raphael, A.P.; Sundh, D.; Grice, J.E.; Soyer, H.P.; Roberts, M.S.; Prow, T.W. The Human Stratum Corneum Prevents Small Gold Nanoparticle Penetration and Their Potential Toxic Metabolic Consequences. J. Nanomater. 2012, 2012, 721706. [Google Scholar] [CrossRef]
- Kröger, M.; Schleusener, J.; Lademann, J.; Meinke, M.C.; Jung, S.; Darvin, M.E. Tattoo Pigments Are Localized Intracellularly in the Epidermis and Dermis of Fresh and Old Tattoos: In Vivo Study Using Two-Photon Excited Fluorescence Lifetime Imaging. Dermatology 2023, 239, 478–493. [Google Scholar] [CrossRef]
- Limcharoen, B.; Toprangkobsin, P.; Kroger, M.; Darvin, M.E.; Sansureerungsikul, T.; Rujwaree, T.; Wanichwecharungruang, S.; Banlunara, W.; Lademann, J.; Patzelt, A. Microneedle-Facilitated Intradermal Proretinal Nanoparticle Delivery. Nanomaterials 2020, 10, 368. [Google Scholar] [CrossRef]
- Pena, A.-M.; Chen, X.; Pence, I.J.; Bornschlögl, T.; Jeong, S.; Grégoire, S.; Luengo, G.S.; Hallegot, P.; Obeidy, P.; Feizpour, A.; et al. Imaging and Quantifying Drug Delivery in Skin–Part 2: Fluorescence Andvibrational Spectroscopic Imaging Methods. Adv. Drug Deliv. Rev. 2020, 153, 147–168. [Google Scholar] [CrossRef]
- Mohammed, Y.H.; Holmes, A.; Haridass, I.N.; Sanchez, W.Y.; Studier, H.; Grice, J.E.; Benson, H.A.E.; Roberts, M.S. Support for the Safe Use of Zinc Oxide Nanoparticle Sunscreens: Lack of Skin Penetration or Cellular Toxicity after Repeated Application in Volunteers. J. Investig. Dermatol. 2019, 139, 308–315. [Google Scholar] [CrossRef]
- Kuo, T.-R.; Wu, C.-L.; Hsu, C.-T.; Lo, W.; Chiang, S.-J.; Lin, S.-J.; Dong, C.-Y.; Chen, C.-C. Chemical Enhancer Induced Changes in the Mechanisms of Transdermal Delivery of Zinc Oxide Nanoparticles. Biomaterials 2009, 30, 3002–3008. [Google Scholar] [CrossRef] [PubMed]
- Cheng, J.-X.; Xie, X.S. Coherent Anti-Stokes Raman Scattering Microscopy: Instrumentation, Theory, and Applications. J. Phys. Chem. B 2004, 108, 827–840. [Google Scholar] [CrossRef]
- Strachan, C.J.; Windbergs, M.; Offerhaus, H.L. Pharmaceutical Applications of Non-Linear Imaging. Int. J. Pharm. 2011, 417, 163–172. [Google Scholar] [CrossRef]
- Heuke, S.; Vogler, N.; Meyer, T.; Akimov, D.; Kluschke, F.; Röwert-Huber, H.-J.; Lademann, J.; Dietzek, B.; Popp, J. Multimodal Mapping of Human Skin. Br. J. Dermatol. 2013, 169, 794–803. [Google Scholar] [CrossRef] [PubMed]
- Jung, Y.; Tam, J.; Ray Jalian, H.; Rox Anderson, R.; Evans, C.L. Longitudinal, 3D In Vivo Imaging of Sebaceous Glands by Coherent Anti-Stokes Raman Scattering Microscopy: Normal Function and Response to Cryotherapy. J. Investig. Dermatol. 2015, 135, 39–44. [Google Scholar] [CrossRef] [PubMed]
- Lee, E.-S.; Kim, S.; Lee, S.-W.; Jung, J.; Lee, S.H.; Na, H.-W.; Kim, H.-J.; Hong, Y.D.; Park, W.S.; Lee, T.G.; et al. Molecule-Resolved Visualization of Particulate Matter on Human Skin Using Multimodal Nonlinear Optical Imaging. Int. J. Mol. Sci. 2021, 22, 5199. [Google Scholar] [CrossRef]
- Evans, C.L.; Xie, X.S. Coherent Anti-Stokes Raman Scattering Microscopy: Chemical Imaging for Biology and Medicine. Annu. Rev. Anal. Chem. 2008, 1, 883–909. [Google Scholar] [CrossRef] [PubMed]
- Iachina, I.; Eriksson, A.H.; Bertelsen, M.; Petersson, K.; Jansson, J.; Kemp, P.; Engell, K.M.; Brewer, J.R.; Nielsen, K.T. Dissolvable Microneedles for Transdermal Drug Delivery Showing Skin Penetration and Modified Drug Release. Eur. J. Pharm. Sci. 2023, 182, 106371. [Google Scholar] [CrossRef]
- Evans, C.L.; Potma, E.O.; Puoris’haag, M.; Côté, D.; Lin, C.P.; Xie, X.S. Chemical Imaging of Tissue in vivo with Video-Rate Coherent Anti-Stokes Raman Scattering Microscopy. Proc. Natl. Acad. Sci. USA 2005, 102, 16807–16812. [Google Scholar] [CrossRef]
- Choe, C.; Lademann, J.; Darvin, M.E. Depth Profiles of Hydrogen Bound Water Molecule Types and Their Relation to Lipid and Protein Interaction in the Human Stratum Corneum in vivo. Analyst 2016, 141, 6329–6337. [Google Scholar] [CrossRef]
- Sarri, B.; Chen, X.; Canonge, R.; Grégoire, S.; Formanek, F.; Galey, J.-B.; Potter, A.; Bornschlögl, T.; Rigneault, H. In Vivo Quantitative Molecular Absorption of Glycerol in Human Skin Using Coherent Anti-Stokes Raman Scattering (CARS) and Two-Photon Auto-Fluorescence. J. Control. Release 2019, 308, 190–196. [Google Scholar] [CrossRef]
- Xiao, Y.; Deng, P.; Zhao, Y.; Yang, S.; Li, B. Three-Photon Excited Fluorescence Imaging in Neuroscience: From Principles to Applications. Front. Neurosci. 2023, 17, 1085682. [Google Scholar] [CrossRef]
- Chen, X.; Pan, Y.; Qiu, P.; Wang, K. Deep-Skin Third-Harmonic Generation (THG) Imaging in vivo Excited at the 2200 Nm Window. J. Innov. Opt. Health Sci. 2023, 16, 2243004. [Google Scholar] [CrossRef]
- König, K. Multiphoton Microscopy in Life Sciences. J. Microsc. 2000, 200, 83–104. [Google Scholar] [CrossRef]
- Jin, C.; Liang, F.; Wang, J.; Wang, L.; Liu, J.; Liao, X.; Rees, T.W.; Yuan, B.; Wang, H.; Shen, Y.; et al. Rational Design of Cyclometalated Iridium(III) Complexes for Three-Photon Phosphorescence Bioimaging. Angew. Chem. 2020, 132, 16121–16125. [Google Scholar] [CrossRef]
- Lee, S.; Lee, J.H.; Wang, T.; Jang, W.H.; Yoon, Y.; Kim, B.; Jun, Y.W.; Kim, M.J.; Kim, K.H. Three-Photon Tissue Imaging Using Moxifloxacin. Sci. Rep. 2018, 8, 9415. [Google Scholar] [CrossRef] [PubMed]
- Ni, H.; Xu, Z.; Li, D.; Chen, M.; Tang, B.Z.; Qian, J. Aggregation-Induced Emission Luminogen for in vivo Three-Photon Fluorescence Lifetime Microscopic Imaging. J. Innov. Opt. Health Sci. 2019, 12, 1940005. [Google Scholar] [CrossRef]
- Weigelin, B.; Bakker, G.-J.; Friedl, P. Intravital Third Harmonic Generation Microscopy of Collective Melanoma Cell Invasion. IntraVital 2012, 1, 32–43. [Google Scholar] [CrossRef]
- Wang, S.; Xi, W.; Cai, F.; Zhao, X.; Xu, Z.; Qian, J.; He, S. Three-Photon Luminescence of Gold Nanorods and Its Applications for High Contrast Tissue and Deep In Vivo Brain Imaging. Theranostics 2015, 5, 251–266. [Google Scholar] [CrossRef] [PubMed]
- Tong, L.; Cobley, C.M.; Chen, J.; Xia, Y.; Cheng, J.-X. Bright Three-Photon Luminescence from Gold/Silver Alloyed Nanostructures for Bioimaging with Negligible Photothermal Toxicity. Angew. Chem. Int. Ed. 2010, 49, 3485–3488. [Google Scholar] [CrossRef]
- He, M.; Park, H.; Niu, G.; Xia, Q.; Zhang, H.; Tang, B.Z.; Qian, J. Lipid Droplets Imaging with Three-Photon Microscopy. J. Innov. Opt. Health Sci. 2023, 16, 2250033. [Google Scholar] [CrossRef]
- Pakhomov, A.A.; Efremova, A.V.; Kononevich, Y.N.; Ionov, D.S.; Maksimova, M.A.; Volodin, A.D.; Korlyukov, A.A.; Dubinets, N.O.; Martynov, V.I.; Ivanov, A.A.; et al. NIR-I Fluorescent Probes Based on Distyryl-BODIPYs with Two-Photon Excitation in NIR-II Window. ChemPhotoChem 2023, 7, e202200324. [Google Scholar] [CrossRef]
- Caspers, P.J.; Lucassen, G.W.; Carter, E.A.; Bruining, H.A.; Puppels, G.J. In Vivo Confocal Raman Microspectroscopy of the Skin: Noninvasive Determination of Molecular Concentration Profiles. J. Investig. Derm. 2001, 116, 434–442. [Google Scholar] [CrossRef]
- Darvin, M.E.; Meinke, M.C.; Sterry, W.; Lademann, J. Optical Methods for Noninvasive Determination of Carotenoids in Human and Animal Skin. J. Biomed. Opt. 2013, 18, 61230. [Google Scholar] [CrossRef] [PubMed]
- Franzen, L.; Windbergs, M. Applications of Raman Spectroscopy in Skin Research--From Skin Physiology and Diagnosis up to Risk Assessment and Dermal Drug Delivery. Adv. Drug Deliv. Rev. 2015, 89, 91–104. [Google Scholar] [CrossRef]
- Yakimov, B.P.; Venets, A.V.; Schleusener, J.; Fadeev, V.V.; Lademann, J.; Shirshin, E.A.; Darvin, M.E. Blind Source Separation of Molecular Components of the Human Skin in vivo: Non-Negative Matrix Factorization of Raman Microspectroscopy Data. Analyst 2021, 146, 3185–3196. [Google Scholar] [CrossRef]
- Darvin, M.E.; Schleusener, J.; Lademann, J.; Choe, C.-S. Current Views on Noninvasive in vivo Determination of Physiological Parameters of the Stratum Corneum Using Confocal Raman Microspectroscopy. Ski. Pharmacol. Physiol. 2022, 35, 125–136. [Google Scholar] [CrossRef] [PubMed]
- Caspers, P.J.; Williams, A.C.; Carter, E.A.; Edwards, H.G.M.; Barry, B.W.; Bruining, H.A.; Puppels, G.J. Monitoring the Penetration Enhancer Dimethyl Sulfoxide in Human Stratum Corneum in vivo by Confocal Raman Spectroscopy. Pharm. Res. 2002, 19, 1577–1580. [Google Scholar] [CrossRef]
- Pudney, P.D.; Melot, M.; Caspers, P.J.; Van Der Pol, A.; Puppels, G.J. An in Vivo Confocal Raman Study of the Delivery of Trans Retinol to the Skin. Appl. Spectrosc. 2007, 61, 804–811. [Google Scholar] [CrossRef] [PubMed]
- Lunter, D.; Daniels, R. Confocal Raman Microscopic Investigation of the Effectiveness of Penetration Enhancers for Procaine Delivery to the Skin. J. Biomed. Opt. 2014, 19, 126015. [Google Scholar] [CrossRef]
- Choe, C.; Lademann, J.; Darvin, M.E. Analysis of Human and Porcine Skin in vivo/Ex Vivo for Penetration of Selected Oils by Confocal Raman Microscopy. Ski. Pharmacol. Physiol. 2015, 28, 318–330. [Google Scholar] [CrossRef]
- Dos Santos, L.; Tellez, C.A.; Sousa, M.P.J.; Azoia, N.G.; Cavaco-Paulo, A.M.; Martin, A.A.; Favero, P.P. In Vivo Confocal Raman Spectroscopy and Molecular Dynamics Analysis of Penetration of Retinyl Acetate into Stratum Corneum. Spectrochim. Acta A 2017, 174, 279–285. [Google Scholar] [CrossRef]
- Tippavajhala, V.K.; de Oliveira Mendes, T.; Martin, A.A. In Vivo Human Skin Penetration Study of Sunscreens by Confocal Raman Spectroscopy. AAPS PharmSciTech 2018, 19, 753–760. [Google Scholar] [CrossRef] [PubMed]
- Laing, S.; Bielfeldt, S.; Wilhelm, K.P.; Obst, J. Confocal Raman Spectroscopy as a Tool to Measure the Prevention of Skin Penetration by a Specifically Designed Topical Medical Device. Ski. Res. Technol. 2019, 25, 578–586. [Google Scholar] [CrossRef]
- Krombholz, R.; Lunter, D. A New Method for In-Situ Skin Penetration Analysis by Confocal Raman Microscopy. Molecules 2020, 25, 4222. [Google Scholar] [CrossRef]
- He, Y.F.; Wu, W.H.; Li, J.; Liu, Y.T.; Qu, Z.H.; Liu, Y.H. In Vivo Raman Spectroscopy Study on the Stimulation Mechanism of Surfactant. Ski. Res. Technol. 2020, 26, 898–904. [Google Scholar] [CrossRef]
- Lademann, J.; Caspers, P.J.; van der Pol, A.; Richter, H.; Patzelt, A.; Zastrow, L.; Darvin, M.; Sterry, W.; Fluhr, J.W. In Vivo Raman Spectroscopy Detects Increased Epidermal Antioxidative Potential with Topically Applied Carotenoids. Laser Phys. Lett. 2009, 6, 76–79. [Google Scholar] [CrossRef]
- Jung, N.; Namjoshi, S.; Mohammed, Y.; Grice, J.E.; Benson, H.A.E.; Raney, S.G.; Roberts, M.S.; Windbergs, M. Application of Confocal Raman Microscopy for the Characterization of Topical Semisolid Formulations and Their Penetration into Human Skin Ex Vivo. Pharm. Res. 2022, 39, 935–948. [Google Scholar] [CrossRef]
- Liu, Y.; Lunter, D.J. Confocal Raman Spectroscopy at Different Laser Wavelengths in Analyzing Stratum Corneum and Skin Penetration Properties of Mixed PEGylated Emulsifier Systems. Int. J. Pharm. 2022, 616, 121561. [Google Scholar] [CrossRef] [PubMed]
- Iliopoulos, F.; Tang, C.F.; Li, Z.; Rahma, A.; Lane, M.E. Confocal Raman Spectroscopy for Assessing Bioequivalence of Topical Formulations. Pharmaceutics 2023, 15, 1075. [Google Scholar] [CrossRef] [PubMed]
- Essendoubi, M.; Gobinet, C.; Reynaud, R.; Angiboust, J.F.; Manfait, M.; Piot, O. Human Skin Penetration of Hyaluronic Acid of Different Molecular Weights as Probed by Raman Spectroscopy. Ski. Res. Technol. 2016, 22, 55–62. [Google Scholar] [CrossRef]
- Choe, C.; Schleusener, J.; Lademann, J.; Darvin, M.E. In Vivo Confocal Raman Microscopic Determination of Depth Profiles of the Stratum Corneum Lipid Organization Influenced by Application of Various Oils. J. Dermatol. Sci. 2017, 87, 183–191. [Google Scholar] [CrossRef] [PubMed]
- Choe, C.; Schleusener, J.; Choe, S.; Ri, J.; Lademann, J.; Darvin, M.E. Stratum Corneum Occlusion Induces Water Transformation towards Lower Bonding State: A Molecular Level in vivo Study by Confocal Raman Microspectroscopy. Int. J. Cosmet. Sci. 2020, 42, 482–493. [Google Scholar] [CrossRef] [PubMed]
- Schleusener, J.; Salazar, A.; von Hagen, J.; Lademann, J.; Darvin, M.E. Retaining Skin Barrier Function Properties of the Stratum Corneum with Components of the Natural Moisturizing Factor—A Randomized, Placebo-Controlled Double-Blind In Vivo Study. Molecules 2021, 26, 1649. [Google Scholar] [CrossRef] [PubMed]
- Franzen, L.; Anderski, J.; Windbergs, M. Quantitative Detection of Caffeine in Human Skin by Confocal Raman Spectroscopy—A Systematic in vitro Validation Study. Eur. J. Pharm. Biopharm. 2015, 95, 110–116. [Google Scholar] [CrossRef] [PubMed]
- Caspers, P.J.; Nico, C.; Bakker Schut, T.C.; Sterke, J.; Pudney, P.D.A.; Curto, P.R.; Illand, A.; Puppels, G.J. Method to Quantify the in vivo Skin Penetration of Topically Applied Materials Based on Confocal Raman Spectroscopy. Transl. Biophotonics 2019, 1. [Google Scholar] [CrossRef]
- Alonso, C.; Carrer, V.; Barba, C.; Coderch, L. Caffeine Delivery in Porcine Skin: A Confocal Raman Study. Arch. Derm. Res. 2018, 310, 657–664. [Google Scholar] [CrossRef] [PubMed]
- Choe, C.; Schleusener, J.; Ri, J.; Choe, S.; Kim, P.; Lademann, J.; Darvin, M.E. Quantitative Determination of Concentration Profiles of Skin Components and Topically Applied Oils by Tailored Multivariate Curve Resolution-Alternating Least Squares Using in vivo Confocal Raman Micro-Spectroscopy. J. Biophotonics 2023, 16, e202200219. [Google Scholar] [CrossRef]
- Iliopoulos, F.; Caspers, P.J.; Puppels, G.J.; Lane, M.E. Franz Cell Diffusion Testing and Quantitative Confocal Raman Spectroscopy: In Vitro-in vivo Correlation. Pharmaceutics 2020, 12, 887. [Google Scholar] [CrossRef]
- Franzen, L.; Selzer, D.; Fluhr, J.W.; Schaefer, U.F.; Windbergs, M. Towards Drug Quantification in Human Skin with Confocal Raman Microscopy. Eur. J. Pharm. Biopharm. 2013, 84, 437–444. [Google Scholar] [CrossRef] [PubMed]
- Broding, H.C.; van der Pol, A.; de Sterke, J.; Monsé, C.; Fartasch, M.; Brüning, T. In Vivo Monitoring of Epidermal Absorption of Hazardous Substances by Confocal Raman Micro-Spectroscopy. JDDG J. Dtsch. Dermatol. Ges. 2011, 9, 618–627. [Google Scholar] [CrossRef] [PubMed]
- Elderderi, S.; Bonnier, F.; Perse, X.; Byrne, H.J.; Yvergnaux, F.; Chourpa, I.; Elbashir, A.A.; Munnier, E. Label-Free Quantification of Nanoencapsulated Piperonyl Esters in Cosmetic Hydrogels Using Raman Spectroscopy. Pharmaceutics 2023, 15, 1571. [Google Scholar] [CrossRef] [PubMed]
- Pena-Rodríguez, E.; García-Berrocoso, T.; Vázquez Fernández, E.; Otero-Espinar, F.J.; Abian, J.; Fernández-Campos, F. Monitoring Dexamethasone Skin Biodistribution with Ex Vivo MALDI-TOF Mass Spectrometry Imaging and Confocal Raman Microscopy. Int. J. Pharm. 2023, 636, 122808. [Google Scholar] [CrossRef]
- Bashkatov, A.N.; Genina, E.A.; Kochubey, V.I.; Tuchin, V.V. Optical Properties of Human Skin, Subcutaneous and Mucous Tissues in the Wavelength Range from 400 to 2000 Nm. J. Phys. D Appl. Phys. 2005, 38, 2543–2555. [Google Scholar] [CrossRef]
- Darvin, M.E.; Schleusener, J.; Parenz, F.; Seidel, O.; Krafft, C.; Popp, J.; Lademann, J. Confocal Raman Microscopy Combined with Optical Clearing for Identification of Inks in Multicolored Tattooed Skin in vivo. Analyst 2018, 143, 4990–4999. [Google Scholar] [CrossRef] [PubMed]
- Sdobnov, A.Y.; Darvin, M.E.; Schleusener, J.; Lademann, J.; Tuchin, V.V. Hydrogen Bound Water Profiles in the Skin Influenced by Optical Clearing Molecular Agents-Quantitative Analysis Using Confocal Raman Microscopy. J. Biophotonics 2019, 12, e201800283. [Google Scholar] [CrossRef] [PubMed]
- Kang, Y.; Zhang, F.Y. Image of the Distribution Profile of Targets in Skin by Raman Spectroscopy-Based Multivariate Analysis. Ski. Res. Technol. 2022, 28, 402–409. [Google Scholar] [CrossRef]
- Schleusener, J.; Carrer, V.; Patzelt, A.; Guo, S.; Bocklitz, T.; Coderch, L.; Lademann, J.; Darvin, M.E. Confocal Raman Imaging of Skin Sections Containing Hair Follicles Using Classical Least Squares Regression and Multivariate Curve Resolution-Alternating Least Squares. Quantum Electron. 2019, 49, 6–12. [Google Scholar] [CrossRef]
- Caspers, P.J.; Lucassen, G.W.; Puppels, G.J. Combined In Vivo Confocal Raman Spectroscopy and Confocal Microscopy of Human Skin. Biophys. J. 2003, 85, 572–580. [Google Scholar] [CrossRef]
- Leitgeb, R.A.; Baumann, B. Multimodal Optical Medical Imaging Concepts Based on Optical Coherence Tomography. Front. Phys. 2018, 6, 114. [Google Scholar] [CrossRef]
- Waszczuk, L.; Ogien, J.; Perrot, J.-L.; Dubois, A. Co-Localized Line-Field Confocal Optical Coherence Tomography and Confocal Raman Microspectroscopy for Three-Dimensional High-Resolution Morphological and Molecular Characterization of Skin Tissues Ex Vivo. Biomed. Opt. Express BOE 2022, 13, 2467–2487. [Google Scholar] [CrossRef] [PubMed]
- Vogt, A.; Rancan, F.; Ahlberg, S.; Nazemi, B.; Choe, C.S.; Darvin, M.E.; Hadam, S.; Blume-Peytavi, U.; Loza, K.; Diendorf, J.; et al. Interaction of Dermatologically Relevant Nanoparticles with Skin Cells and Skin. Beilstein J. Nanotechnol. 2014, 5, 2363–2373. [Google Scholar] [CrossRef]
- Ryabchykov, O.; Popp, J.; Bocklitz, T. Fusion of MALDI Spectrometric Imaging and Raman Spectroscopic Data for the Analysis of Biological Samples. Front. Chem. 2018, 6, 257. [Google Scholar] [CrossRef]
- Ri, J.S.; Choe, S.H.; Schleusener, J.; Lademann, J.; Choe, C.S.; Darvin, M.E. In Vivo Tracking of DNA for Precise Determination of the Stratum Corneum Thickness and Superficial Microbiome Using Confocal Raman Microscopy. Ski. Pharmacol. Physiol. 2020, 33, 30–37. [Google Scholar] [CrossRef]
- Liu, Y.; Lunter, D.J. Profiling Skin Penetration Using PEGylated Emulsifiers as Penetration Enhancers via Confocal Raman Spectroscopy and Fluorescence Spectroscopy. Eur. J. Pharm. Biopharm. 2021, 166, 1–9. [Google Scholar] [CrossRef]
- Choe, C.; Choe, S.; Schleusener, J.; Lademann, J.; Darvin, M.E. Modified Normalization Method in in vivo Stratum Corneum Analysis Using Confocal Raman Microscopy to Compensate Nonhomogeneous Distribution of Keratin. J. Raman Spectrosc. 2019, 50, 945–957. [Google Scholar] [CrossRef]
- Binder, L.; Valenta, C.; Lunter, D. Determination of Skin Penetration Profiles by Confocal Raman Microspectroscopy: Evaluation of Interindividual Variability and Interlab Comparability. J. Raman Spectrosc. 2020, 51, 1037–1043. [Google Scholar] [CrossRef]
- Xu, F.; Zhu, J.; Zhang, Z.; Li, S.; He, Y.; Dong, Y.; Zhan, X. In Vivo Evaluation of the Skin Penetration and Efficacy of Ceramide Nanomulsions by Confocal Raman Spectroscopy. 2023. Available online: https://ssrn.com/abstract=4458382 (accessed on 28 June 2023).
- Mujica Ascencio, S.; Choe, C.; Meinke, M.C.; Muller, R.H.; Maksimov, G.V.; Wigger-Alberti, W.; Lademann, J.; Darvin, M.E. Confocal Raman Microscopy and Multivariate Statistical Analysis for Determination of Different Penetration Abilities of Caffeine and Propylene Glycol Applied Simultaneously in a Mixture on Porcine Skin Ex Vivo. Eur. J. Pharm. Biopharm. 2016, 104, 51–58. [Google Scholar] [CrossRef] [PubMed]
- Tosato, M.G.; Orallo, D.E.; Ali, S.M.; Churio, M.S.; Martin, A.A.; Dicelio, L. Confocal Raman Spectroscopy: In Vivo Biochemical Changes in the Human Skin by Topical Formulations under UV Radiation. J. Photoch. Photobio. B 2015, 153, 51–58. [Google Scholar] [CrossRef] [PubMed]
- Infante, V.; Campos, P.M.; Gaspar, L.R.; Darvin, M.E.; Schleusener, J.; Rangel, K.C.; Meinke, M.C.; Lademann, J. Safety and Efficacy of Combined Essential Oils for the Skin Barrier Properties: In Vitro, Ex Vivo and Clinical Studies. Int. J. Cosmet. Sci. 2022, 44, 118–130. [Google Scholar] [CrossRef] [PubMed]
- Egawa, M.; Sato, Y. In Vivo Evaluation of Two Forms of Urea in the Skin by Raman Spectroscopy after Application of Urea-Containing Cream. Ski. Res. Technol. 2015, 21, 259–264. [Google Scholar] [CrossRef]
- Davies, M.A. Cleansing-Induced Changes in Skin Measured by in vivo Confocal Raman Spectroscopy. Ski. Res. Technol. 2020, 26, 30–38. [Google Scholar] [CrossRef]
- Zhang, Y.; Kung, C.-P.; Iliopoulos, F.; Sil, B.C.; Hadgraft, J.; Lane, M.E. Dermal Delivery of Niacinamide—In Vivo Studies. Pharmaceutics 2021, 13, 726. [Google Scholar] [CrossRef]
- Garvie-Cook, H.; Hoppel, M.; Guy, R.H. Raman Spectroscopic Tools to Probe the Skin–(Trans)Dermal Formulation Interface. Mol. Pharm. 2022, 19, 4010–4016. [Google Scholar] [CrossRef]
- Darvin, M.E.; Fluhr, J.W.; Caspers, P.; van der Pool, A.; Richter, H.; Patzelt, A.; Sterry, W.; Lademann, J. In Vivo Distribution of Carotenoids in Different Anatomical Locations of Human Skin: Comparative Assessment with Two Different Raman Spectroscopy Methods. Exp. Dermatol. 2009, 18, 1060–1063. [Google Scholar] [CrossRef]
- Gautam, R.; Vanga, S.; Ariese, F.; Umapathy, S. Review of Multidimensional Data Processing Approaches for Raman and Infrared Spectroscopy. EPJ Tech. Instrum. 2015, 2, 8. [Google Scholar] [CrossRef]
- Kichou, H.; Munnier, E.; Dancik, Y.; Kemel, K.; Byrne, H.J.; Tfayli, A.; Bertrand, D.; Soucé, M.; Chourpa, I.; Bonnier, F. Estimating the Analytical Performance of Raman Spectroscopy for Quantification of Active Ingredients in Human Stratum Corneum. Molecules 2022, 27, 2843. [Google Scholar] [CrossRef] [PubMed]
- Miloudi, L.; Bonnier, F.; Bertrand, D.; Byrne, H.J.; Perse, X.; Chourpa, I.; Munnier, E. Quantitative Analysis of Curcumin-Loaded Alginate Nanocarriers in Hydrogels Using Raman and Attenuated Total Reflection Infrared Spectroscopy. Anal. Bioanal. Chem. 2017, 409, 4593–4605. [Google Scholar] [CrossRef] [PubMed]
- Meksiarun, P.; Maeda, Y.; Hiroi, T.; Andriana, B.B.; Sato, H. Analysis of the Effects of Dietary Fat on Body and Skin Lipids of Hamsters by Raman Spectroscopy. Analyst 2015, 140, 4238–4244. [Google Scholar] [CrossRef]
- Choe, C.S.; Lademann, J.; Darvin, M.E. Gaussian-Function-Based Deconvolution Method to Determine the Penetration Ability of Petrolatum Oil into in vivo Human Skin Using Confocal Raman Microscopy. Laser Phys. 2014, 24, 105601. [Google Scholar] [CrossRef]
- Choe, C.; Lademann, J.; Darvin, M.E. Confocal Raman Microscopy for Investigating the Penetration of Various Oils into the Human Skin in vivo. J. Derm. Sci. 2015, 79, 176–178. [Google Scholar] [CrossRef] [PubMed]
- Choe, C.S.; Ri, J.S.; Choe, S.H.; Kim, P.S.; Lademann, J.; Schleusener, J.; Darvin, M.E. TMCR-ALS Method for the Determination of Water Concentration Profiles in the Stratum Corneum of Untreated and Treated Skin in vivo. J. Raman Spectrosc. 2022, 53, 1731–1738. [Google Scholar] [CrossRef]
- Choe, C.S.; Pak, G.J.; Ascencio, S.M.; Darvin, M.E. Quantification of Skin Penetration of Caffeine and Propylene Glycol Applied Topically in a Mixture by TMCR-ALS of Depth-Resolved Raman Spectra. J. Biophotonics 2023, e202300146. [Google Scholar] [CrossRef]
- Jaumot, J.; de Juan, A.; Tauler, R. MCR-ALS GUI 2.0: New Features and Applications. Chemom. Intell. Lab. 2015, 140, 1–12. [Google Scholar] [CrossRef]
- Zhang, L.S.; Cambron, T.; Niu, Y.Q.; Xu, Z.G.; Su, N.; Zheng, H.Y.; Wei, K.; Ray, P. MCR Approach Revealing Protein, Water, and Lipid Depth Profile in Atopic Dermatitis Patients’ Stratum Corneum via in vivo Confocal Raman Spectroscopy. Anal. Chem. 2019, 91, 2784–2790. [Google Scholar] [CrossRef] [PubMed]
- Bonnist, E.Y.M.; Gorce, J.-P.; Mackay, C.; Pendlington, R.U.; Pudney, P.D.A. Measuring the Penetration of a Skin Sensitizer and Its Delivery Vehicles Simultaneously with Confocal Raman Spectroscopy. Ski. Pharmacol. Physiol. 2011, 24, 274–283. [Google Scholar] [CrossRef] [PubMed]
- Essendoubi, M.; Alsamad, F.; Noel, P.; Meunier, M.; Scandolera, A.; Sandre, J.; Manfait, M.; Gobinet, C.; Reynaud, R.; Piot, O. Combining Raman Imaging and MCR-ALS Analysis for Monitoring Retinol Permeation in Human Skin. Ski. Res. Technol. 2021, 27, 1100–1109. [Google Scholar] [CrossRef]
- Lust, A.; Strachan, C.J.; Veski, P.; Aaltonen, J.; Heinämäki, J.; Yliruusi, J.; Kogermann, K. Amorphous Solid Dispersions of Piroxicam and Soluplus®: Qualitative and Quantitative Analysis of Piroxicam Recrystallization during Storage. Int. J. Pharm. 2015, 486, 306–314. [Google Scholar] [CrossRef]
- Darvin, M.E.; Choe, C.; Schleusener, J.; Choe, S.; Lademann, J. Response to Comment by Puppels et al. on “A Modification for the Calculation of Water Depth Profiles in Oil-Treated Skin by in vivo Raman Microscopy”. J. Biophotonics 2020, 13, e2460. [Google Scholar] [CrossRef]
- Choe, C.; Schleusener, J.; Choe, S.; Lademann, J.; Darvin, M.E. A Modification for the Calculation of Water Depth Profiles in Oil-Treated Skin by in vivo Confocal Raman Microscopy. J. Biophotonics 2020, 13, e201960106. [Google Scholar] [CrossRef]
- Avsievich, T.; Zhu, R.; Popov, A.P.; Yatskovskiy, A.; Popov, A.A.; Tikhonowsky, G.; Pastukhov, A.I.; Klimentov, S.; Bykov, A.; Kabashin, A.; et al. Impact of Plasmonic Nanoparticles on Poikilocytosis and Microrheological Properties of Erythrocytes. Pharmaceutics 2023, 15, 1046. [Google Scholar] [CrossRef]
- Li, Q.; Huo, H.; Wu, Y.; Chen, L.; Su, L.; Zhang, X.; Song, J.; Yang, H. Design and Synthesis of SERS Materials for In Vivo Molecular Imaging and Biosensing. Adv. Sci. 2023, 10, 2202051. [Google Scholar] [CrossRef]
- Dyakonov, P.; Mironovich, K.; Svyakhovskiy, S.; Voloshina, O.; Dagesyan, S.; Panchishin, A.; Suetin, N.; Bagratashvili, V.; Timashev, P.; Shirshin, E.; et al. Carbon Nanowalls as a Platform for Biological SERS Studies. Sci. Rep. 2017, 7, 13352. [Google Scholar] [CrossRef]
- Kneipp, K.; Wang, Y.; Kneipp, H.; Perelman, L.T.; Itzkan, I.; Dasari, R.; Feld, M.S. Single Molecule Detection Using Surface-Enhanced Raman Scattering (SERS). Phys. Rev. Lett. 1997, 78, 1667–1670. [Google Scholar] [CrossRef]
- Jeništová, A.; Loula, M.; Mestek, O.; Ulbrich, P.; Matějka, P. The Effect of Silver Nanoparticles on the Penetration Properties of the Skin and Quantification of Their Permeation through Skin Barrier. J. Nanoparticle Res. 2020, 22, 332. [Google Scholar] [CrossRef]
- Xiong, H.; Guo, Z.; Zhong, H.; Ji, Y. Monitoring the Penetration and Accumulation of Gold Nanoparticles in Rat Skin Ex Vivo Using Surface-Enhanced Raman Scattering Spectroscopy. J. Innov. Opt. Health Sci. 2016, 9, 1650026. [Google Scholar] [CrossRef]
- Register, J.K.; Fales, A.M.; Wang, H.-N.; Norton, S.J.; Cho, E.H.; Boico, A.; Pradhan, S.; Kim, J.; Schroeder, T.; Wisniewski, N.A.; et al. In Vivo Detection of SERS-Encoded Plasmonic Nanostars in Human Skin Grafts and Live Animal Models. Anal. Bioanal. Chem. 2015, 407, 8215–8224. [Google Scholar] [CrossRef]
- Koh, E.H.; Lee, W.-C.; Choi, Y.-J.; Moon, J.-I.; Jang, J.; Park, S.-G.; Choo, J.; Kim, D.-H.; Jung, H.S. A Wearable Surface-Enhanced Raman Scattering Sensor for Label-Free Molecular Detection. ACS Appl. Mater. Interfaces 2021, 13, 3024–3032. [Google Scholar] [CrossRef] [PubMed]
- Weng, G.; Yang, J.; Li, J.; Zhu, J.; Zhao, J. Ag Triangle Nanoplates Assembled on PVC/SEBS Membrane as Flexible SERS Substrates for Skin Cortisol Sensing. Spectrochim. Acta Part A Mol. Biomol. Spectrosc. 2023, 303, 123154. [Google Scholar] [CrossRef]
- Shi, S.; Wang, Y.; Mei, R.; Zhao, X.; Liu, X.; Chen, L. Revealing Drug Release and Diffusion Behavior in Skin Interstitial Fluid by Surface-Enhanced Raman Scattering Microneedles. J. Mater. Chem. B 2023, 11, 3097–3105. [Google Scholar] [CrossRef] [PubMed]
- Mei, R.; Wang, Y.; Zhao, X.; Shi, S.; Wang, X.; Zhou, N.; Shen, D.; Kang, Q.; Chen, L. Skin Interstitial Fluid-Based SERS Tags Labeled Microneedles for Tracking of Peritonitis Progression and Treatment Effect. ACS Sens. 2023, 8, 372–380. [Google Scholar] [CrossRef]
- Park, J.E.; Yonet-Tanyeri, N.; Vander Ende, E.; Henry, A.-I.; Perez White, B.E.; Mrksich, M.; Van Duyne, R.P. Plasmonic Microneedle Arrays for in Situ Sensing with Surface-Enhanced Raman Spectroscopy (SERS). Nano Lett. 2019, 19, 6862–6868. [Google Scholar] [CrossRef] [PubMed]
- Ashtikar, M.; Langelüddecke, L.; Fahr, A.; Deckert, V. Tip-Enhanced Raman Scattering for Tracking of Invasomes in the Stratum Corneum. Biochim. Biophys. Acta (BBA)-Gen. Subj. 2017, 1861, 2630–2639. [Google Scholar] [CrossRef]
- Mizuguchi, T.; Knight, C.T.; Asanuma, M.; Goto, M.; Ninomiya, M.; Takahashi, S.; Akaboshi, H.; Egawa, M.; Ozeki, Y. Three-Dimensional Analysis of Water Dynamics in Human Skin by Stimulated Raman Scattering. J. Phys. Chem. B 2023, 127, 4952–4958. [Google Scholar] [CrossRef] [PubMed]
- Drutis, D.M.; Hancewicz, T.M.; Pashkovski, E.; Feng, L.; Mihalov, D.; Holtom, G.R.; Ananthapadmanabhan, K.P.; Xie, X.S.; Misra, M. Three-Dimensional Chemical Imaging of Skin Using Stimulated Raman Scattering Microscopy. JBO 2014, 19, 111604. [Google Scholar] [CrossRef] [PubMed]
- Freudiger, C.W.; Min, W.; Saar, B.G.; Lu, S.; Holtom, G.R.; He, C.; Tsai, J.C.; Kang, J.X.; Xie, X.S. Label-Free Biomedical Imaging with High Sensitivity by Stimulated Raman Scattering Microscopy. Science 2008, 322, 1857–1861. [Google Scholar] [CrossRef]
- Tipping, W.J.; Lee, M.; Serrels, A.; Brunton, V.G.; Hulme, A.N. Stimulated Raman Scattering Microscopy: An Emerging Tool for Drug Discovery. Chem. Soc. Rev. 2016, 45, 2075–2089. [Google Scholar] [CrossRef] [PubMed]
- Wei, L.; Hu, F.; Shen, Y.; Chen, Z.; Yu, Y.; Lin, C.-C.; Wang, M.C.; Min, W. Live-Cell Imaging of Alkyne-Tagged Small Biomolecules by Stimulated Raman Scattering. Nat. Methods 2014, 11, 410–412. [Google Scholar] [CrossRef] [PubMed]
- Jones, R.R.; Hooper, D.C.; Zhang, L.; Wolverson, D.; Valev, V.K. Raman Techniques: Fundamentals and Frontiers. Nanoscale Res. Lett. 2019, 14, 231. [Google Scholar] [CrossRef]
- Lunter, D.; Klang, V.; Kocsis, D.; Varga-Medveczky, Z.; Berkó, S.; Erdő, F. Novel Aspects of Raman Spectroscopy in Skin Research. Exp. Dermatol. 2022, 31, 1311–1329. [Google Scholar] [CrossRef]
- Tsikritsis, D.; Legge, E.J.; Belsey, N.A. Practical Considerations for Quantitative and Reproducible Measurements with Stimulated Raman Scattering Microscopy. Analyst 2022, 147, 4642–4656. [Google Scholar] [CrossRef] [PubMed]
- Genchi, L.; Laptenok, S.P.; Liberale, C. Background Signals in Stimulated Raman Scattering Microscopy and Current Solutions to Avoid Them. Adv. Phys. X 2023, 8, 2176258. [Google Scholar] [CrossRef]
- Belsey, N.A.; Garrett, N.L.; Contreras-Rojas, L.R.; Pickup-Gerlaugh, A.J.; Price, G.J.; Moger, J.; Guy, R.H. Evaluation of Drug Delivery to Intact and Porated Skin by Coherent Raman Scattering and Fluorescence Microscopies. J. Control. Release 2014, 174, 37–42. [Google Scholar] [CrossRef]
- Saar, B.G.; Contreras-Rojas, L.R.; Xie, X.S.; Guy, R.H. Imaging Drug Delivery to Skin with Stimulated Raman Scattering Microscopy. Available online: https://pubs.acs.org/doi/pdf/10.1021/mp200122w (accessed on 28 June 2023).
- Ito, T.; Iguchi, R.; Matsuoka, F.; Nishi, Y.; Ogihara, T.; Misawa, K. Label-Free Skin Penetration Analysis Using Time-Resolved, Phase-Modulated Stimulated Raman Scattering Microscopy. Biomed. Opt. Express BOE 2021, 12, 6545–6557. [Google Scholar] [CrossRef]
- Iguchi, R.; Nishi, Y.; Ogihara, T.; Ito, T.; Matsuoka, F.; Misawa, K. Time-Course Quantitative Mapping of Caffeine within the Epidermis, Using High-Contrast Pump–Probe Stimulated Raman Scattering Microscopy. Ski. Res. Technol. 2022, 28, 47–53. [Google Scholar] [CrossRef]
- Feizpour, A.; Marstrand, T.; Bastholm, L.; Eirefelt, S.; Evans, C.L. Label-Free Quantification of Pharmacokinetics in Skin with Stimulated Raman Scattering Microscopy and Deep Learning. J. Investig. Dermatol. 2021, 141, 395–403. [Google Scholar] [CrossRef] [PubMed]
- Wanjiku, B.; Yamamoto, K.; Klossek, A.; Schumacher, F.; Pischon, H.; Mundhenk, L.; Rancan, F.; Judd, M.M.; Ahmed, M.; Zoschke, C.; et al. Qualifying X-ray and Stimulated Raman Spectromicroscopy for Mapping Cutaneous Drug Penetration. Anal. Chem. 2019, 91, 7208–7214. [Google Scholar] [CrossRef] [PubMed]
- Tiwari, N.; Osorio-Blanco, E.R.; Sonzogni, A.; Esporrín-Ubieto, D.; Wang, H.; Calderón, M. Nanocarriers for Skin Applications: Where Do We Stand? Angew. Chem. Int. Ed. 2022, 61, e202107960. [Google Scholar] [CrossRef]
- Goel, A.; Tsikritsis, D.; Belsey, N.A.; Pendlington, R.; Glavin, S.; Chen, T. Measurement of Chemical Penetration in Skin Using Stimulated Raman Scattering Microscopy and Multivariate Curve Resolution-Alternating Least Squares. Spectrochim. Acta Part A Mol. Biomol. Spectrosc. 2023, 296, 122639. [Google Scholar] [CrossRef]
- Saar, B.G.; Freudiger, C.W.; Reichman, J.; Stanley, C.M.; Holtom, G.R.; Xie, X.S. Video-Rate Molecular Imaging in vivo with Stimulated Raman Scattering. Science 2010, 330, 1368–1370. [Google Scholar] [CrossRef]
- Lin, P.; Ni, H.; Li, H.; Vickers, N.A.; Tan, Y.; Gong, R.; Bifano, T.; Cheng, J.-X. Volumetric Chemical Imaging in vivo by a Remote-Focusing Stimulated Raman Scattering Microscope. Opt. Express OE 2020, 28, 30210–30221. [Google Scholar] [CrossRef] [PubMed]
- Liao, C.-S.; Wang, P.; Huang, C.Y.; Lin, P.; Eakins, G.; Bentley, R.T.; Liang, R.; Cheng, J.-X. In Vivo and in Situ Spectroscopic Imaging by a Handheld Stimulated Raman Scattering Microscope. ACS Photonics 2017, 5, 947–954. [Google Scholar] [CrossRef]
- Kuzma, B.A.; Tu, D.; Goss, A.; Iliopoulos, F.; Slade, J.B.; Wiatrowski, A.; Feizpour, A.; Evans, C.L. Instantaneous Topical Drug Quantification Using a 3D Printed Microfluidic Device and Coherent Raman Imaging. OpenNano 2023, 12, 100151. [Google Scholar] [CrossRef]
- Fercher, A.F.; Drexler, W.; Hitzenberger, C.K.; Lasser, T. Optical Coherence Tomography-Principles and Applications. Rep. Prog. Phys. 2003, 66, 239. [Google Scholar] [CrossRef]
- Fercher, A.F. Optical Coherence Tomography–Development, Principles, Applications. Z. Med. Phys. 2010, 20, 251–276. [Google Scholar] [CrossRef]
- Kim, J.; Brown, W.; Maher, J.R.; Levinson, H.; Wax, A. Functional Optical Coherence Tomography: Principles and Progress. Phys. Med. Biol. 2015, 60, R211. [Google Scholar] [CrossRef] [PubMed]
- Wan, B.; Ganier, C.; Du-Harpur, X.; Harun, N.; Watt, F.M.; Patalay, R.; Lynch, M.D. Applications and Future Directions for Optical Coherence Tomography in Dermatology. Br. J. Dermatol. 2021, 184, 1014–1022. [Google Scholar] [CrossRef]
- Acharya, N.; Melanthota, S.K.; Khokhar, M.; Chakrabarti, S.; Gopal, D.; Mallya, D.S.; Mazumder, N. Types of Optical Coherence Tomography for Cancer Diagnosis: A Systematic Review. J.-BPE 2022, 8, 010201. [Google Scholar] [CrossRef]
- Sattler, E.C.; Kästle, R.; Welzel, J. Optical Coherence Tomography in Dermatology. JBO 2013, 18, 061224. [Google Scholar] [CrossRef] [PubMed]
- Aneesh, A.; Považay, B.; Hofer, B.; Popov, S.V.; Glittenberg, C.; Binder, S.; Drexler, W. Multispectral in vivo Three-Dimensional Optical Coherence Tomography of Human Skin. JBO 2010, 15, 026025. [Google Scholar] [CrossRef]
- Zagaynova, E.V.; Shirmanova, M.V.; Kirillin, M.Y.; Khlebtsov, B.N.; Orlova, A.G.; Balalaeva, I.V.; Sirotkina, M.A.; Bugrova, M.L.; Agrba, P.D.; Kamensky, V.A. Contrasting Properties of Gold Nanoparticles for Optical Coherence Tomography: Phantom, in vivo Studies and Monte Carlo Simulation. Phys. Med. Biol. 2008, 53, 4995. [Google Scholar] [CrossRef] [PubMed]
- Liu, L.; Gardecki, J.A.; Nadkarni, S.K.; Toussaint, J.D.; Yagi, Y.; Bouma, B.E.; Tearney, G.J. Imaging the Subcellular Structure of Human Coronary Atherosclerosis Using Micro–Optical Coherence Tomography. Nat. Med. 2011, 17, 1010–1014. [Google Scholar] [CrossRef] [PubMed]
- Federici, A.; da Costa, H.S.G.; Ogien, J.; Ellerbee, A.K.; Dubois, A. Wide-Field, Full-Field Optical Coherence Microscopy for High-Axial-Resolution Phase and Amplitude Imaging. Appl. Opt. AO 2015, 54, 8212–8220. [Google Scholar] [CrossRef]
- Ogien, J.; Daures, A.; Cazalas, M.; Perrot, J.-L.; Dubois, A. Line-Field Confocal Optical Coherence Tomography for Three-Dimensional Skin Imaging. Front. Optoelectron. 2020, 13, 381–392. [Google Scholar] [CrossRef]
- Dubois, A.; Xue, W.; Levecq, O.; Bulkin, P.; Coutrot, A.-L.; Ogien, J. Mirau-Based Line-Field Confocal Optical Coherence Tomography. Opt. Express OE 2020, 28, 7918–7927. [Google Scholar] [CrossRef]
- Svenskaya, Y.I.; Lengert, E.V.; Tarakanchikova, Y.V.; Muslimov, A.R.; Saveleva, M.S.; Genina, E.A.; Radchenko, I.L.; Stepanova, L.A.; Vasin, A.V.; Sukhorukov, G.B.; et al. Non-Invasive Transcutaneous Influenza Immunization Using Vaccine-Loaded Vaterite Particles. J. Mater. Chem. B 2023, 11, 3860–3870. [Google Scholar] [CrossRef] [PubMed]
- Kirillin, M.Y.; Shirmanova, M.V.; Sirotkina, M.A.; Bugrova, M.; Khlebtsov, B.N.; Zagainova, E.V. Contrasting Properties of Gold Nanoshells and Titanium Dioxide Nanoparticles for Optical Coherence Tomography Imaging of Skin: Monte Carlo Simulations and in vivo Study. JBO 2009, 14, 021017. [Google Scholar] [CrossRef] [PubMed]
- Seeni, R.Z.; Yu, X.; Chang, H.; Chen, P.; Liu, L.; Xu, C. Iron Oxide Nanoparticle-Powered Micro-Optical Coherence Tomography for in Situ Imaging the Penetration and Swelling of Polymeric Microneedles in the Skin. ACS Appl. Mater. Interfaces 2017, 9, 20340–20347. [Google Scholar] [CrossRef] [PubMed]
- Donnelly, R.F.; Garland, M.J.; Morrow, D.I.J.; Migalska, K.; Singh, T.R.R.; Majithiya, R.; Woolfson, A.D. Optical Coherence Tomography Is a Valuable Tool in the Study of the Effects of Microneedle Geometry on Skin Penetration Characteristics and In-Skin Dissolution. J. Control. Release 2010, 147, 333–341. [Google Scholar] [CrossRef] [PubMed]


| Optical Method | Imaging Method (2D/3D) | Screening Depth, µm | Lateral/Axial Resolution | Penetration of Non-Particulate Substances | Penetration of Particulate Substances | Possibility to Quantify the Substances Used | |
|---|---|---|---|---|---|---|---|
| FCLSM | in vivo | Yes | ≈100 µm | <1 µm/ <5 µm | Yes 1,2 (low sensitivity) | Yes 1,2 (low sensitivity) | Yes [73] |
| ex vivo | Yes | ||||||
| RCLSM | in vivo | Yes | ≈150 µm | No | Yes (low sensitivity) | No | |
| ex vivo | Yes | ||||||
| 2PT-AF | in vivo | Yes | ≈150 µm | <1 µm/ <2 µm | Yes 2 (low sensitivity) | Yes 2 (low sensitivity) | No |
| ex vivo | Yes | ||||||
| 2PT-FLIM | in vivo | Yes | Yes 3 (high sensitivity) | Yes 3 (high sensitivity) | |||
| ex vivo | Yes | ||||||
| SHG | in vivo | Yes | No | Yes (high sensitivity) | |||
| ex vivo | Yes | ||||||
| 2PT-CARS | in vivo | Yes | Yes (low sensitivity) 4 | Yes (low sensitivity) 4 | |||
| ex vivo | Yes | ||||||
| 3PT | in vivo | Yes | <900 µm | <1 µm/ <2 µm | No | No | No |
| ex vivo | Yes | ||||||
| CRM | in vivo | No 5 | ≈50 µm | <5 µm | Yes (high sensitivity) | Yes (high sensitivity) | Yes [207,209] |
| ex vivo | Yes | ||||||
| SERS | in vivo | No 5 | ≈50 µm | <5 µm | No 6 | Yes 7 (high sensitivity) | No |
| ex vivo | Yes | ||||||
| SRS | in vivo | Yes | ≈150 µm | <2 µm | Yes (high sensitivity) 4 | Yes (high sensitivity) 4 | Yes [160] |
| ex vivo | Yes | ||||||
| OCT | in vivo | Yes | <2 mm | <2 µm/ <5 µm | No | Yes (low sensitivity) 8 | No |
| ex vivo | Yes |
Disclaimer/Publisher’s Note: The statements, opinions and data contained in all publications are solely those of the individual author(s) and contributor(s) and not of MDPI and/or the editor(s). MDPI and/or the editor(s) disclaim responsibility for any injury to people or property resulting from any ideas, methods, instructions or products referred to in the content. |
© 2023 by the author. Licensee MDPI, Basel, Switzerland. This article is an open access article distributed under the terms and conditions of the Creative Commons Attribution (CC BY) license (https://creativecommons.org/licenses/by/4.0/).
Share and Cite
Darvin, M.E. Optical Methods for Non-Invasive Determination of Skin Penetration: Current Trends, Advances, Possibilities, Prospects, and Translation into In Vivo Human Studies. Pharmaceutics 2023, 15, 2272. https://doi.org/10.3390/pharmaceutics15092272
Darvin ME. Optical Methods for Non-Invasive Determination of Skin Penetration: Current Trends, Advances, Possibilities, Prospects, and Translation into In Vivo Human Studies. Pharmaceutics. 2023; 15(9):2272. https://doi.org/10.3390/pharmaceutics15092272
Chicago/Turabian StyleDarvin, Maxim E. 2023. "Optical Methods for Non-Invasive Determination of Skin Penetration: Current Trends, Advances, Possibilities, Prospects, and Translation into In Vivo Human Studies" Pharmaceutics 15, no. 9: 2272. https://doi.org/10.3390/pharmaceutics15092272