Article

Synergistic Sustained Drug-Release System Based on Immobilized Rhamnus frangula L. Phytoextract into Layered Double Hydroxide Covered by Biocompatible Hydrogel

by
Ana-Lorena Neagu
1,2,†,
Anamaria Zaharia
1,†,
Octavian Dumitru Pavel
3,
Alina Tîrşoaga
3,
Iulia Elena Neblea
1,2,
Sorin Viorel Dolana
1,2,
Carmen Elena Ţebrencu
4,5,
Tanta-Verona Iordache
1,
Andrei Sârbu
1,* and
Rodica Zăvoianu
3,*
1
National Institute for Research and Development & Chemistry and Petrochemistry—ICECHIM, Bucharest, Spl. Independentei No. 202, Sector 6, 060021 Bucharest, Romania
2
Department of Bioresources and Polymer Science, Faculty of Chemical Engineering and Biotechnology, University Politehnica of Bucharest, Str. Gh. Polizu No. 1–7, Sector1, 011061 Bucharest, Romania
3
Faculty of Chemistry, Research Center for Catalysts and Catalytic Processes, University of Bucharest, Bd. Regina Elisabeta No. 4-12, S3, 030018 Bucharest, Romania
4
Commercial Society for Medicinal Plant Research and Processing Plantavorelsa, Str. CuzaVoda, 46, Jud. Neamt, 610019 Piatra Neamt, Romania
5
Department of Chemical Sciences, Romanian Academy of Scientists, Str. Ilfov No. 3, S5, 050045 Bucharest, Romania
*
Authors to whom correspondence should be addressed.
These authors contributed equally to this work and are co-first authors.
Pharmaceutics 2023, 15(7), 1888; https://doi.org/10.3390/pharmaceutics15071888
Submission received: 25 May 2023 / Revised: 29 June 2023 / Accepted: 3 July 2023 / Published: 5 July 2023
(This article belongs to the Special Issue Mesoporous Materials for Biomedical Application)

Abstract

:
This work focuses on the synergetic effect obtained by immobilization of Rhamnus frangula L. (RfL) phytoextract in layered double hydroxides (LDHs) matrixes and their subsequent encapsulation into biocompatible hydrogels (HG). In this respect, the LDHs were used as hosts for the immobilization of the phytoextract by a reconstruction method, after which the LDHsRfL were embedded into biocompatible hydrogel (HG) matrixes, based on polyethylene glycol diacrylate (PEGDA), by a radical polymerization reaction. The resulted biocompatible hydrogel composites were characterized by modern methods, while the swelling and rheology measurements revealed that the HG composites steadily improved as the content of RfL phytoextract immobilized on LDHs (LDHsRfL) increased. The following in vitro sustained release of the RfL phytoextract was highlighted by measurements at pH 6.8, in which case the composite HGs with LDHsRfL presented an improved release behavior over the LDHsRfL, thus, underlining the synergistic effect of PEGDA network and LDH particles on the slow-release behavior. The kinetic models used in the RfL release from composite HGs clearly indicate that the release is diffusion controlled in all the cases. The final composite HGs described here may find applications in the pharmaceutical field as devices for the controlled release of drugs.

Graphical Abstract

1. Introduction

The classical drug-delivery systems suffer from some drawbacks, among which the most important is the incapacity to provide a long-sustained drug effect in time [1,2,3]. In order to solve this big drawback and to release the drug in a controlled manner so it is provided efficiently to target affected sites in the human body, many systems were developed based on inorganic nanoparticles [4], carbon nanostructures [5], liposomes [6], polymeric nanoparticles [7], etc. Among these systems, very convenient ones were proved to be layered double hydroxides (LDH), in which the drug is included in the interlayer space, and so its diffusion is slowed [3].
Layered double hydroxides (LDH) are two-dimensional (2D) materials, belonging to the class of hydrotalcite (HT) or anionic clays. LDHs are formed by a bivalent metal ion, M2+ (such as Mg2+, Ca2+, Zn2+, and Ni2+), coordinated to six hydroxyl groups, for which part the bivalent cations are substituted by trivalent cations, M3+ (such as Al3+, Fe3+, Cr3+, and In3+). Such an ion-exchange process results in the formation of positively charged layers, whose net charge is compensated, to maintain global electroneutrality, by the presence of anions that can participate in ion-exchange processes (An−, which can be functional groups such as nitrate, chloride, and sulfate), located between the layers, together with water molecules. Thus, the general formula of a layered double hydroxide can be written in a simplified way as being [M2+1−xM3+x(OH)2]x+[Ax/n]n−·mH2O [8,9]. The LDH compounds possess high loading capacity, biocompatibility, stability, ion-exchanging properties, and a high surface-to-volume ratio which allows for the accommodation of small and large molecules, and, therefore, they found important applications in the modern pharmaceutical field, especially as drug carriers [3,9].
A hydrogel can be defined as a three-dimensional polymer network consisting of a main polymer chain and a hydrophilic functional group. In other words, a hydrogel is a polymeric material presenting the capability to swell and retain a very significant fraction of water within its network, but which is not soluble in water [10]. The stabilization of the hydrogel structure is the result of a cross-linking process, achieved either chemically (usually by covalent bonds) or following physical cross-linking processes [11]. Hydrogels can be formed from natural, synthetic, or semi-synthetic polymers [12,13]. Hydrogel materials are used for sustained drug delivery because they exhibit very good biocompatibility [14], drug protection [15], physicochemical tailor ability [16], and tunable control of the drug release [15]. It is important to mention that hydrogels are stimuli responsive to changes for, example, in pH medium, thanks to the presence of charged hydrophilic groups [17]. Due to all these properties, hydrogels allow the encapsulation of drugs and their slow delivery to the target [18].
The interlayer space of LDH is not closed at the edges, so that the diffusion of the encapsulated drug is rather easy. To slow down the diffusion of drugs, a solution could be the sealing of the edges with another material. Such sealing was proved to be effective in the case of zeolites when a biocompatible hydrogel was used as a sealing material [19]. Usually, the LDH and hydrogel are used for the encapsulation and slow release of synthetic drugs, such as captopril [20], ibuprofen, diclofenac, and indomethacin [21], 5-fluorouracil [19,22], cephalexin [23], etc. Much more seldom, literature and patent data describe the encapsulation of phytoextracts [24]. Therefore, it would be very interesting to produce dietary supplements, knowing that phytoextracts possess very important bioactive properties and usually less toxicity than the synthetic drugs. For instance, the bark of Rhamnus frangula L. contains several anthraquinones derivatives occurring both in free state and as glycosides that could be easily hydrolyzed, which are known to have therapeutic activity as a laxative that increases peristalsis in the large intestine [25].The aim of the present article was to study the encapsulation of a phytoextract of Rhamnus frangula L. in homemade LDHs covered with biocompatible hydrogel, based on polyethylene glycol diacrylate, to make a complex characterization of the new composites and to observe the control release of the phytoextract, in vitro, at pH 6.8, prerequisites being created for an application as dietary supplements in which the sustained bioactive effect of phytoextract is synergistically combined with the mineralization effect of LDH cations (Mg2+, Ca2+, and Fe3+).

2. Materials and Methods

2.1. Materials

Poly(ethylene glycol) diacrylate (PEGDA) with a molecular weight of around 700 g/mol, was purchased from Sigma-Aldrich (St. Louis, MO, USA). Tetramethylethylenediamine (TMEDA) (purity 99%) was supplied by Merck Co. (Darmstadt, Germany) and ammonium persulfate (APS) (purity 98%) was purchased from Peking Chemical Works (Beijing, China). Rhamnus frangula L. phytoextract was provided by our collaborator from Plantavorel (Piatra Neamţ, Romania) and its characteristics are presented in the Supplementary Material. The parameters for the anthrones and derivatives (analytical reference substances) and Frangula cortex-rich extract applied in the quantification experiments are presented in Table S1 and the phytochemical characterization of the Buckthorn bark and of the phytoextract obtained by microwave-assisted extraction is presented in the Table S2. Mg(NO3)2·6H2O, Ca(NO3)2·4H2O, Fe(NO3)3·9H2O, Al(NO3)3·9H2O, NaOH, and Na2CO3 p.a. grade from Merck (Darmstadt, Germany) and distilled water were used for the preparation of LDH-type compounds. Pristine layered double hydroxide (LDHs) and Rhamnus frangula L. (RfL) phytocomplexes incorporated into layered double hydroxide (LDHsRfL), with the characteristics presented in Table S3, were prepared [26,27,28,29,30,31,32,33,34,35], and provided by our collaborators from the University of Bucharest. All chemicals and solvents were used without further purification.

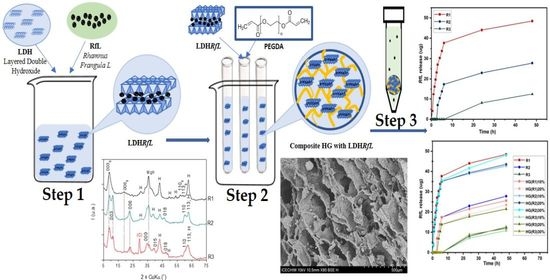
2.2. Synthesis of the LDH Matrix

The LDH synthesis parameters were adapted based on own previous researches [36]. Three LDH compounds with M2+/M3+ molar ratio equal to 2/1 having different compositions of the brucite-type layer (Mg2Fe, Mg2Fe1.8Al0.2, and Mg1.8Ca0.2Fe1.8Al0.2, respectively) and CO32− compensation anions have been prepared using the co-precipitation method at constant pH 10 and high supersaturation. To this aim, the adequate amounts of metal nitrates were dissolved in distilled water up to a concentration of cations equal to 1.5 M, yielding solution A. A basic solution (solution B) was prepared using NaOH and Na2CO3 in order to achieve 1.33 M concentration of CO32− and 1.75 M concentration of NaOH. Solution A and solution B were added simultaneously, under vigorous stirring (500 rpm), in the precipitation reactor which already contained 100 mL distilled water which allowed the immersion of the pH sensor, in order to be able to maintain the pH value at 10 by appropriate adjustment of the feeding rate of the two solutions. After finishing the addition of the nitrate solution, a vertical condenser was mounted on top of the reactor and the gel was aged at 60 °C for 18 h. After aging, the solid was separated by vacuum filtration and washed with distilled water (to remove the NaNO3 formed as byproduct during the co-precipitation) until the conductivity of the washing water fell below 100 μS/cm. The recovered solid was dried at 90 °C for 24 h. Depending on the composition of the brucite-type layer: Mg2Fe, Mg2Fe1.8Al0.2, and Mg1.8Ca0.2Fe1.8Al0.2, respectively, the resulting LDH samples were designated as H1, H2, and H3.

2.3. The Immobilization of RfL Phytocomplex in the LDH Matrix

After drying, the samples H1, H2, and H3 were calcined under air flow at 450 °C, for 18 h, in order to obtain the mixed oxides (C1, C2, and C3) that were used for the immobilization of RfL phytoextract and the reconstruction of the LDH structure. The reconstruction was performed by immersing the mixed oxides in the extractive solution of RfL at a liquid/solid ratio equal to 6/1, over1 h, followed by separation of the resulting solid by filtration and washing with an amount of distilled water equal to the amount of liquid extract used in the reconstruction. Afterwards, the solids designated as R1, R2, and R3 were dried under vacuum at 40 °C for 24 h, and supplied for being incorporated in hydrogel.

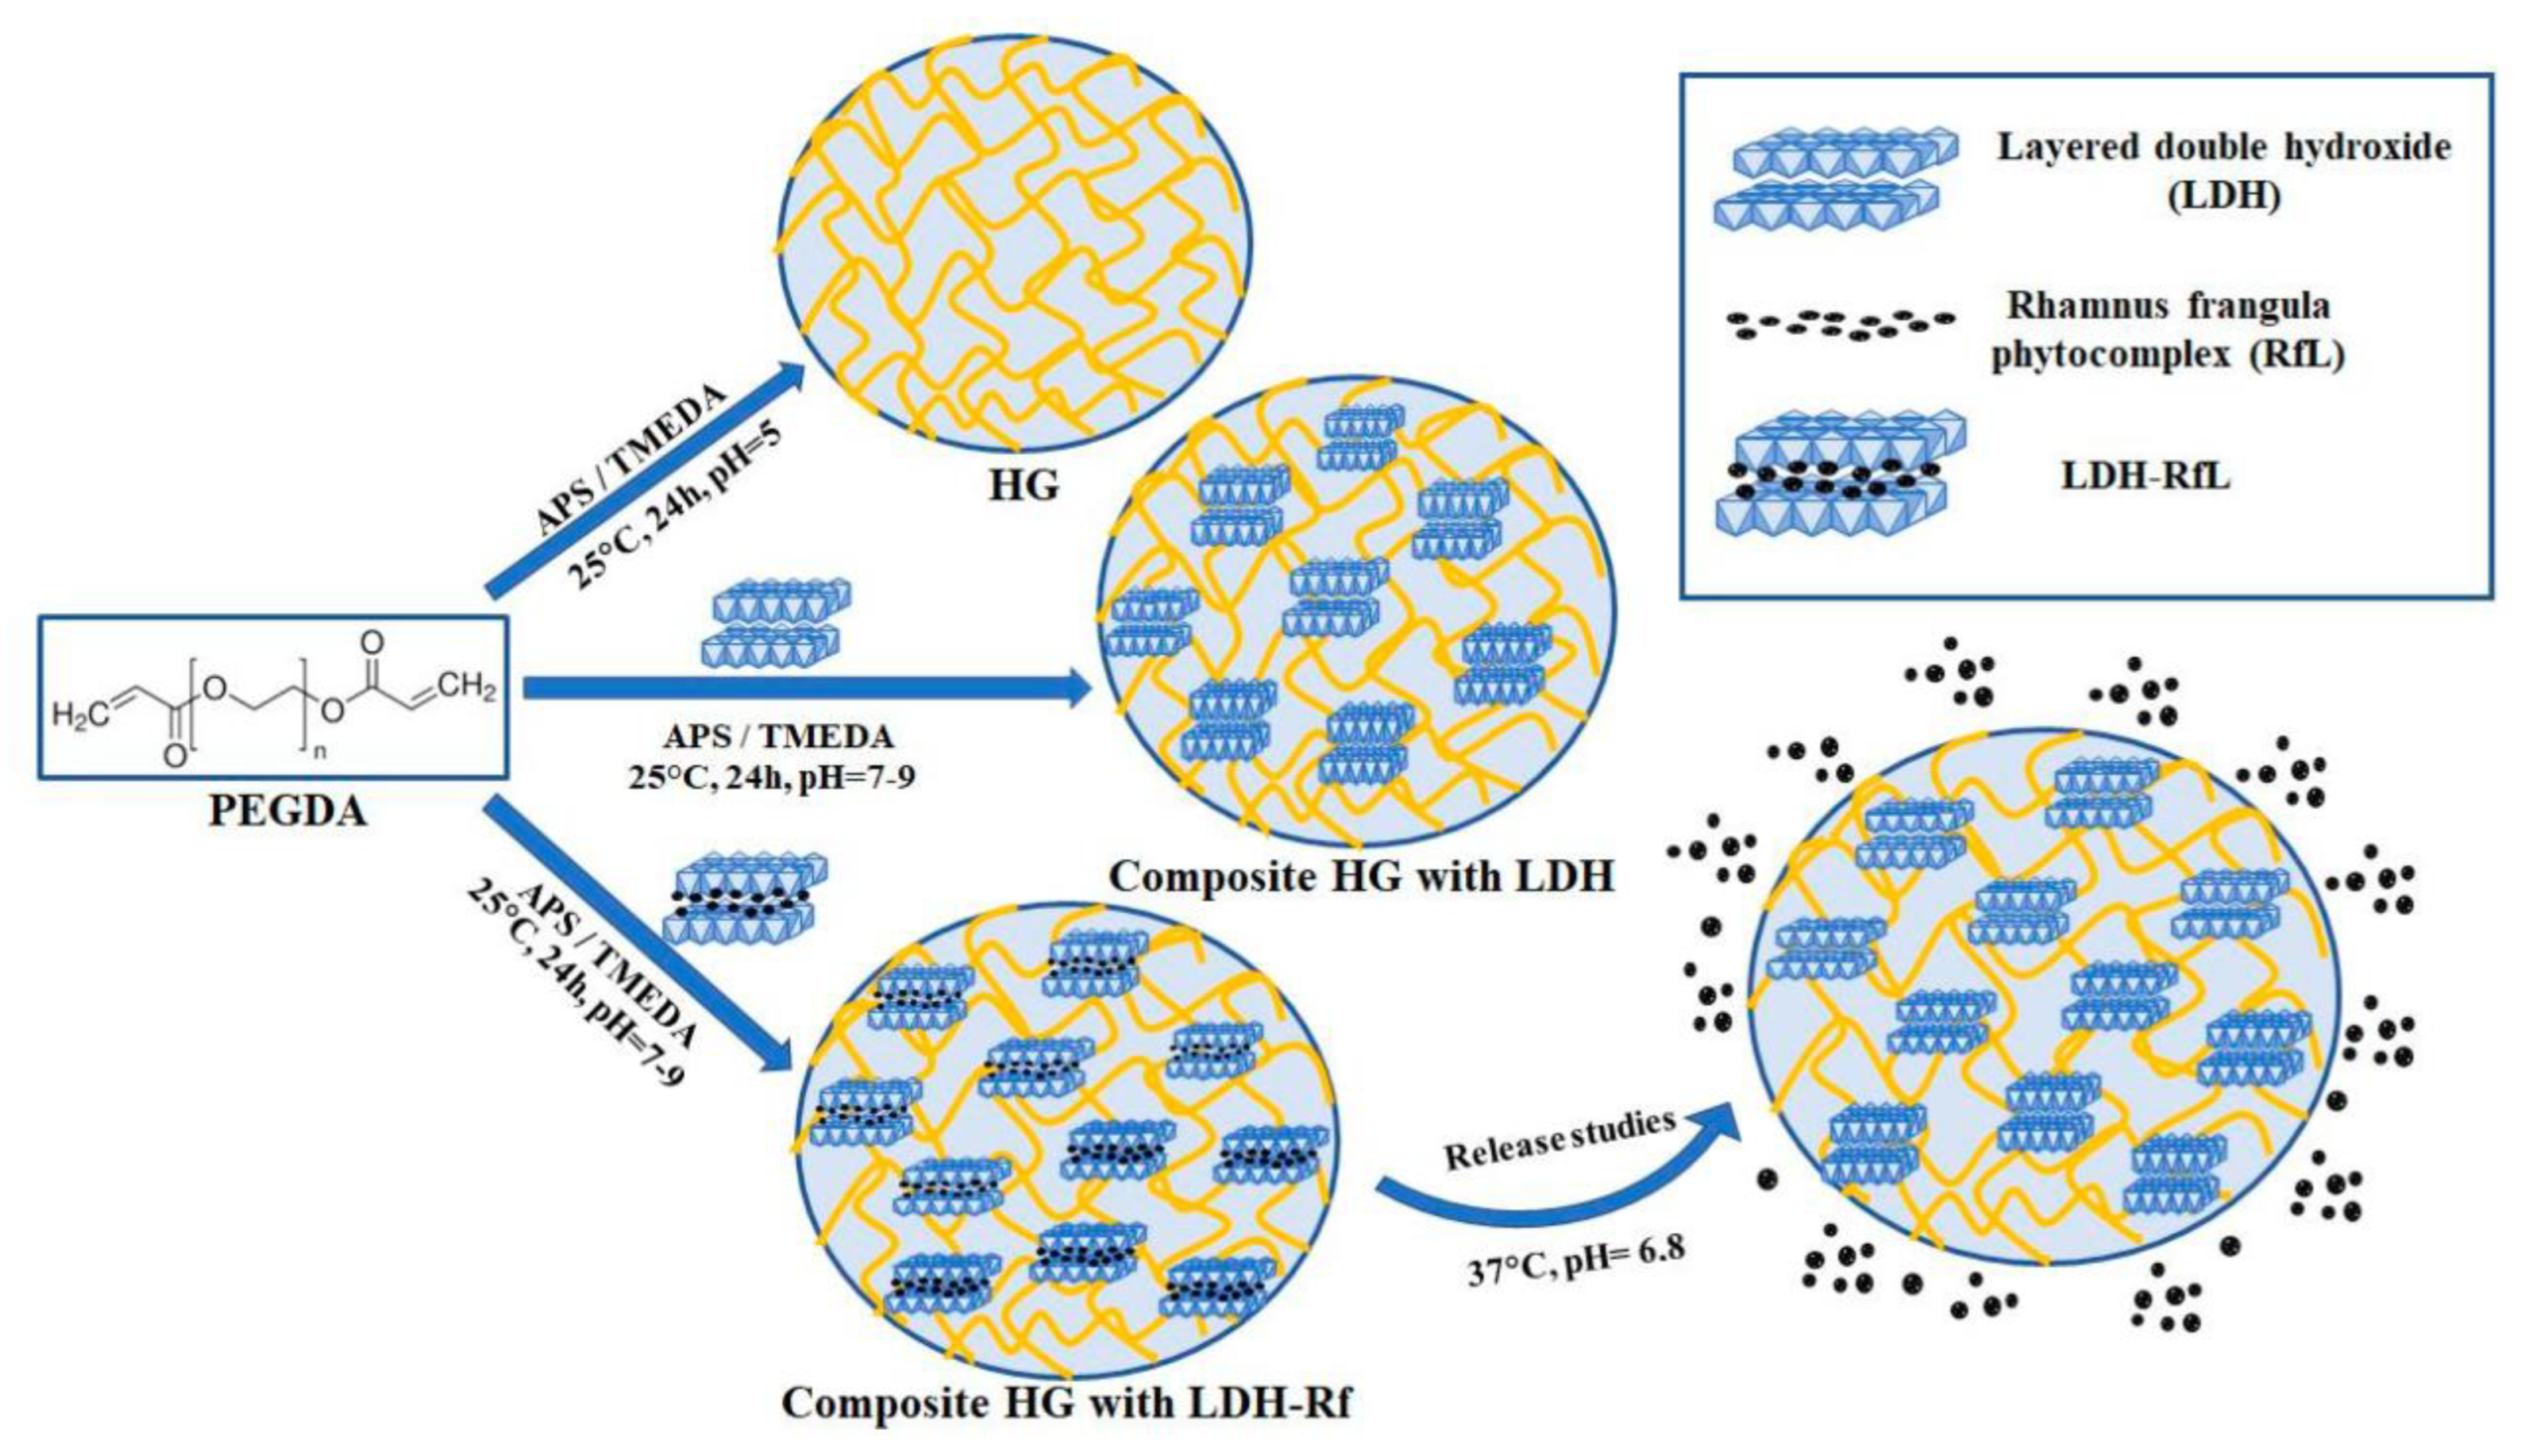
2.4. Synthesis of Nanocomposite Hydrogels Based on PEGDA and LDHs with Immobilized RfL Phytoextract

The composite hydrogels (HGs) synthesis, based on polyethylene glycol diacrylate (PEGDA) and three different types of layered double hydroxide (LDHs) or RfL Phytoextract immobilized in LDHs matrix (LDHsRfL), was performed by in situ radical polymerization, in aqueous media, initiated with ammonium persulfate (APS) and tetramethylethylenediamine (TMEDA) (Figure 1). For this, the calculated quantities of pristine LDHs/LDHsRfL (10, 20, and 30 wt % based on PEGDA) were ultrasonicated in 3 mL distilled water for 30 min. Meanwhile, the aqueous solution corresponding to the calculated quantities of APS oxidant (2 wt % APS based on PEGDA) in distilled water was prepared. Separately, the calculated amounts of PEGDA macromer (10 wt % PEGDA in 5 mL DW) together with the TMEDA catalyst (1 wt % TMEDA based on PEGDA) and 2 mL of distilled water were introduced into glass vials with a diameter of 10 mm. At the end of the ultrasonication time, the LDHs/LDHsRfL suspension was added over the PEGDA and TMEDA reaction mixture and mixed under magnetic stirring for 2 min at 400 rpm and room temperature. The pH of the reaction mixtures was increased from pH = 5 to pH = 7–9, after loading with LDHs/LDHsRfL dispersions. Afterward, the aqueous solution of APS oxidant was also added and the reaction mixture was further homogenized by magnetic stirring for 2 min at 400 rpm and under an inert atmosphere of N2 gas, at room temperature. The vials were sealed with rubber seals and placed at 37 °C, for 24 h. At the end of the reaction, the vials were broken and the obtained composites hydrogels were cut into small disks of approximately 5 mm thickness. For the purification step, these disks were immersed into an excess of distilled water (DW) for seven days at room temperature; the water was changed daily in order to remove the unreacted products. After this purification step, the swollen composite HGs were dried at 40 °C, until they reached a constant weight, obtaining the xerogel [22,37,38]. Furthermore, a simple hydrogel based on PEGDA was prepared as a reference; in this case, the LDSs/LDHsRfL was not added in the polymerization reaction mixture.
The corresponding amounts of PEGDA, APS, TMEDA, and LDSs/LDHsRfL employed in each experiment and the sample codes for the final HGs composites are presented in Table 1.

2.5. Equilibrium Swelling Degree (ESD) Determination

The purified and swollen HG composite-disk from each sample was kept in DW for seven days at 24 °C, the water being changed daily in order to remove the unreacted compounds. After this period, the HG composite was removed from the liquid and the excess of water was wiped with filter paper, and weighed (Whydrogel). It was then dried in an oven (LabTech Vacuum Drying Oven LVO-2030) at 40 °C until it reached a constant weight, and after that the weight of the HG–xerogel disc (Wxerpgel) was determined. The equilibrium swelling degree (ESD) was calculated as the ratio between the amount of water absorbed by the hydrogel during the purification and swelling period and the amount of dry polymer, according to Equation (1).
E S D = w h y d r o g e l w x e r o g e l w x e r o g e l w L D H * 100 , [ g   w a t e r g   x e r o g e l ]
where WLDH is the mass of LDHs and was calculated according to Equation (2):
w L D H = % L D H × w x e r o g e l / 100 , [ g ]
where %LDH is the percent of LDH amount added to the sample, calculated to the amount of PEGDA.
The analysis of the release pattern was performed by fitting the obtained data from the in vitro RfL release into four mathematical models for drug release [1,2,3] as follows:
(I) Zero-order model:
F = k 0 · t
(II) First-order model:
F = 100 · ( 1 e k 1 · t )
(III) Simple Higuchi model:
F = k H · t 0.5
(IV) Linear logarithm form of Korsmeyer–Peppas model:
log M t M = log k + n · l o g ( t )
where F is the amount of drug released in time t, k0 is the zero-order release constant in units of concentration/time, k1 is the first-order release constant, kH is the Higuchi dissolution constant, Mt/M is the fraction of drug released at time t, k is the kinetic constant characteristic of the drug-polymer system, and n is the release coefficient that indicates the type of diffusion mechanism.

2.6. Characterization Methods and Instruments

The structure of the synthesized composite hydrogels was studied by attenuated total reflectance Fourier transformed infrared (ATR-FTIR) spectroscopy, diffuse reflectance UV-Vis (DR-UV-Vis), thermogravimetric analysis/differential thermal gravimetric (TGA/DTG) measurements, X-ray diffraction (XRD), and scanning electron microscopy (SEM).
Identification of functional groups: The attenuated total reflectance Fourier transformed infrared (ATR-FTIR) spectra were recorded with Jasco FT/IR-4700 spectrometer (Jasco, Tokyo, Japan) equipped with diamond crystal. The scanning speed in the spectral domain 4000–400 cm−1 was 128 scans/min, at a resolution of 4 cm−1. The triangle apodization was used for peak fitting.
Identification of structural interactions: Diffuse reflectance UV-Vis (DR-UV-Vis) spectra were recorded in the range 825–225 nm at 0.5 nm data interval and a scan speed of 1000 nm/min using Jasco V-650 spectrometer (Tokyo, Japan) equipped with an integration sphere and spectral on as white reference.
Thermal behaviour of the samples was investigated using a digitally controlled MOM thermal analysis setup (Q-1500D Derivatograph). An amount of 50–70 mg dried sample was placed into an open alumina crucible and heated under static air atmosphere from room temperature to 1000 °C with a heating rate of 5 K/min. Differential thermal analysis (DTA) signal was recorded using alumina powder as standard.
Identification of morphological changes: XRD patterns were obtained on a Shimadzu XRD 7000 diffractometer (from Shimadzu, Kyoto, Japan) using Cu Kα radiation (λ = 1.5418 Å, 40 kV, 40 mA) at a scanning speed of 0.02° min−1 in the 5–75° 2θ range.
The sample appearance: SEM images of the previously swollen and freeze-dried (2.5 Free Zone Labconco freeze dryer) composite hydrogel samples were recorded on the fracture surface using TM4000 plus II, table-top instrument and an acceleration voltage of 10 kV (image signal: BSE). Sample preparation consisted of immobilizing the material on a double-sided carbon tape, and coating with gold (~5 nm, with sputter coater Q150R ES Plus—Quorum) to increase the conductivity.
The rheological measurements were performed on HR 20 Discovery Hybrid Rheometer (TA Instruments, New Castle, DE, USA), using a 40 mm parallel plate geometry. The viscoelastic parameters, such as storage (G′) and loss (G″) moduli, were measured as a function of angular frequency range 0.1–600 rad/s at 1% strain and a constant temperature of 25 °C. Two measurements were taken for each composite hydrogel sample, and the average values and the error were reported.
Slow-release assessment consisted of the evaluation of the amount of RfL phytoextract released from the LDHs and PEGDA–LDHs composite HGs. For this, 0.2 mg of sample were dispersed into 10 mL of media at a pH = 6.8 phosphate buffer solution (prepared by mixing 3 volumes of 0.1 M HCl with 1 volume of a 0.20 M solution of Na3PO4·12H2O and adjusting, with 0.1 M HCl to a pH of 6.8 ± 0.05) whereas the controlled release of RfLphytoextract was monitored using UV–VIS. The UV–Vis analysis for slow-release assessments was performed on Thermo Scientific™ Evolution™ 260 Bio UV–Vis spectrometer (Walthman, MA, USA), by measuring the absorbance of the solution at λ = 340 nm (compounds from the RfL phytoextract absorb at 340 nm). The values were recorded at a temperature of 37 °C in the range of 200–800 nm using 10 mm quartz cuvettes filled with 2 mL of solution. The released amount of RfL phytoextract was determined from the corresponding calibration curve obtained using standard RfL phytoextract solution with known concentrations (Figure S2). The measurements were conducted in duplicate for reproducibility reasons and used to determine RfL phytocomplex-release profile.
The metal content in the solid samples H1, H2, H3, R1, R2, and R3 was determined by inductively coupled plasma atomic emission spectroscopy (ICP-AES), using a Liberty 110 spectrometer from Varian (Palo Alto, CA, USA).

3. Results and Discussion

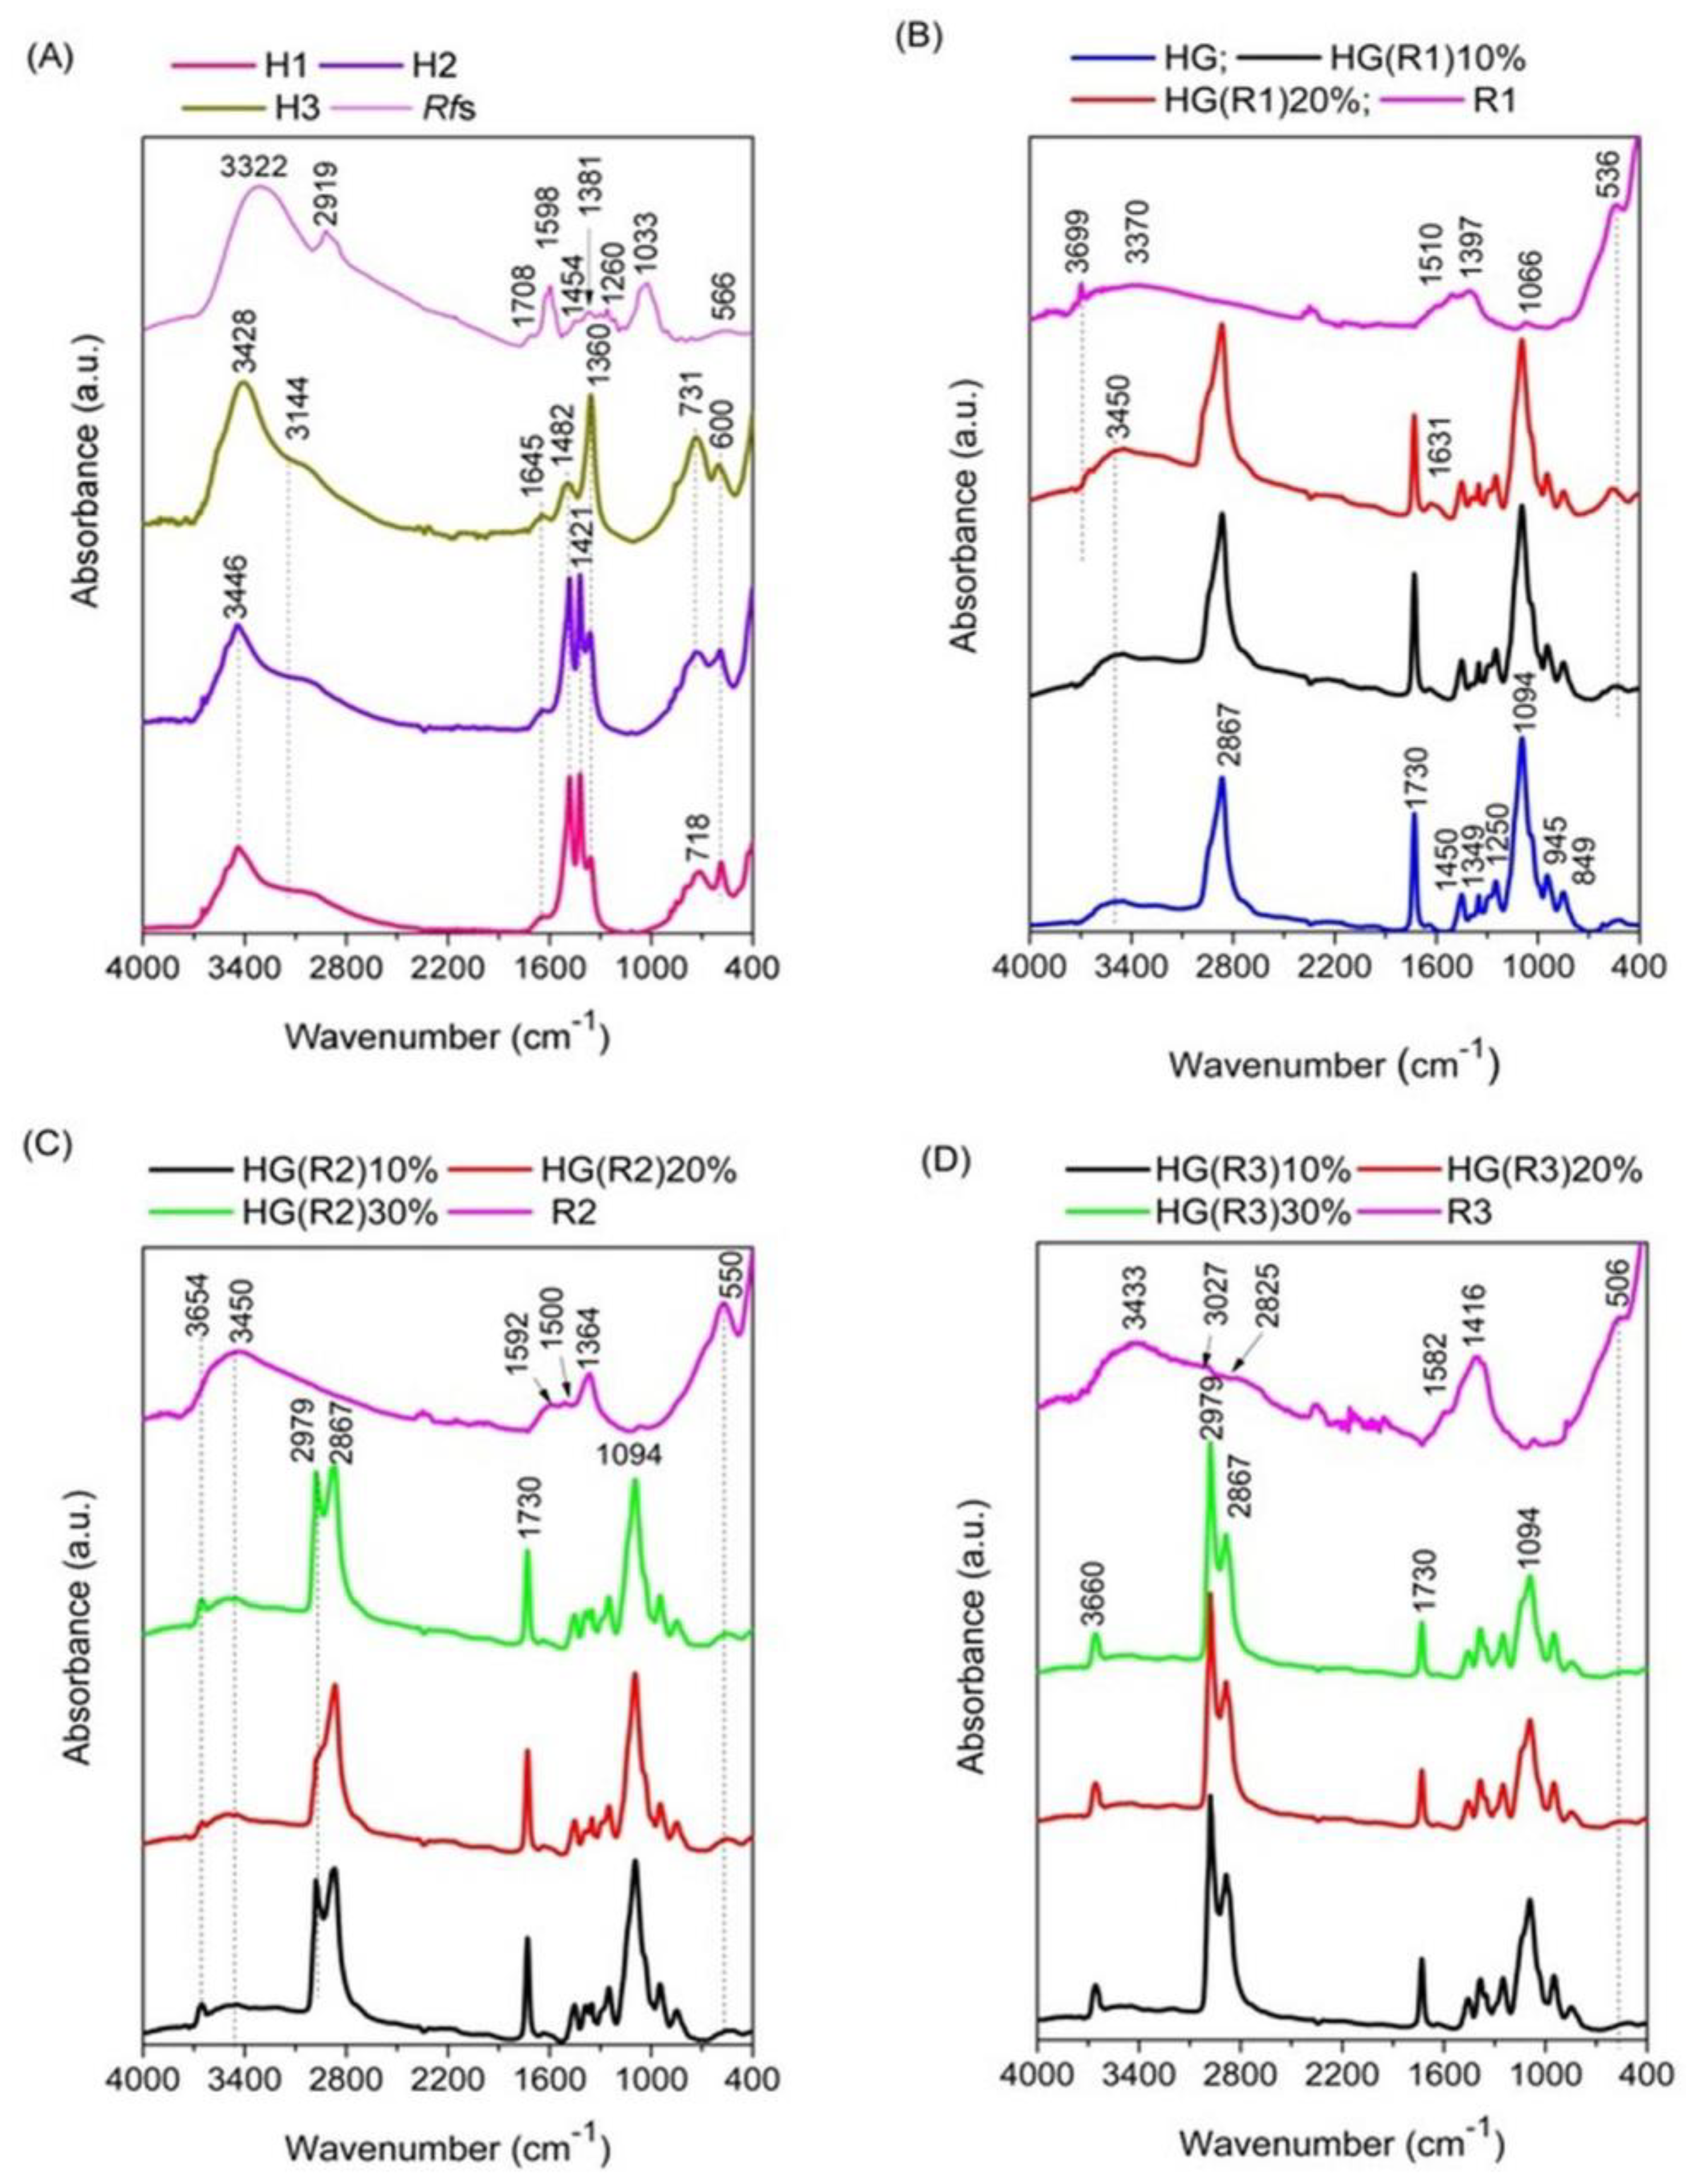
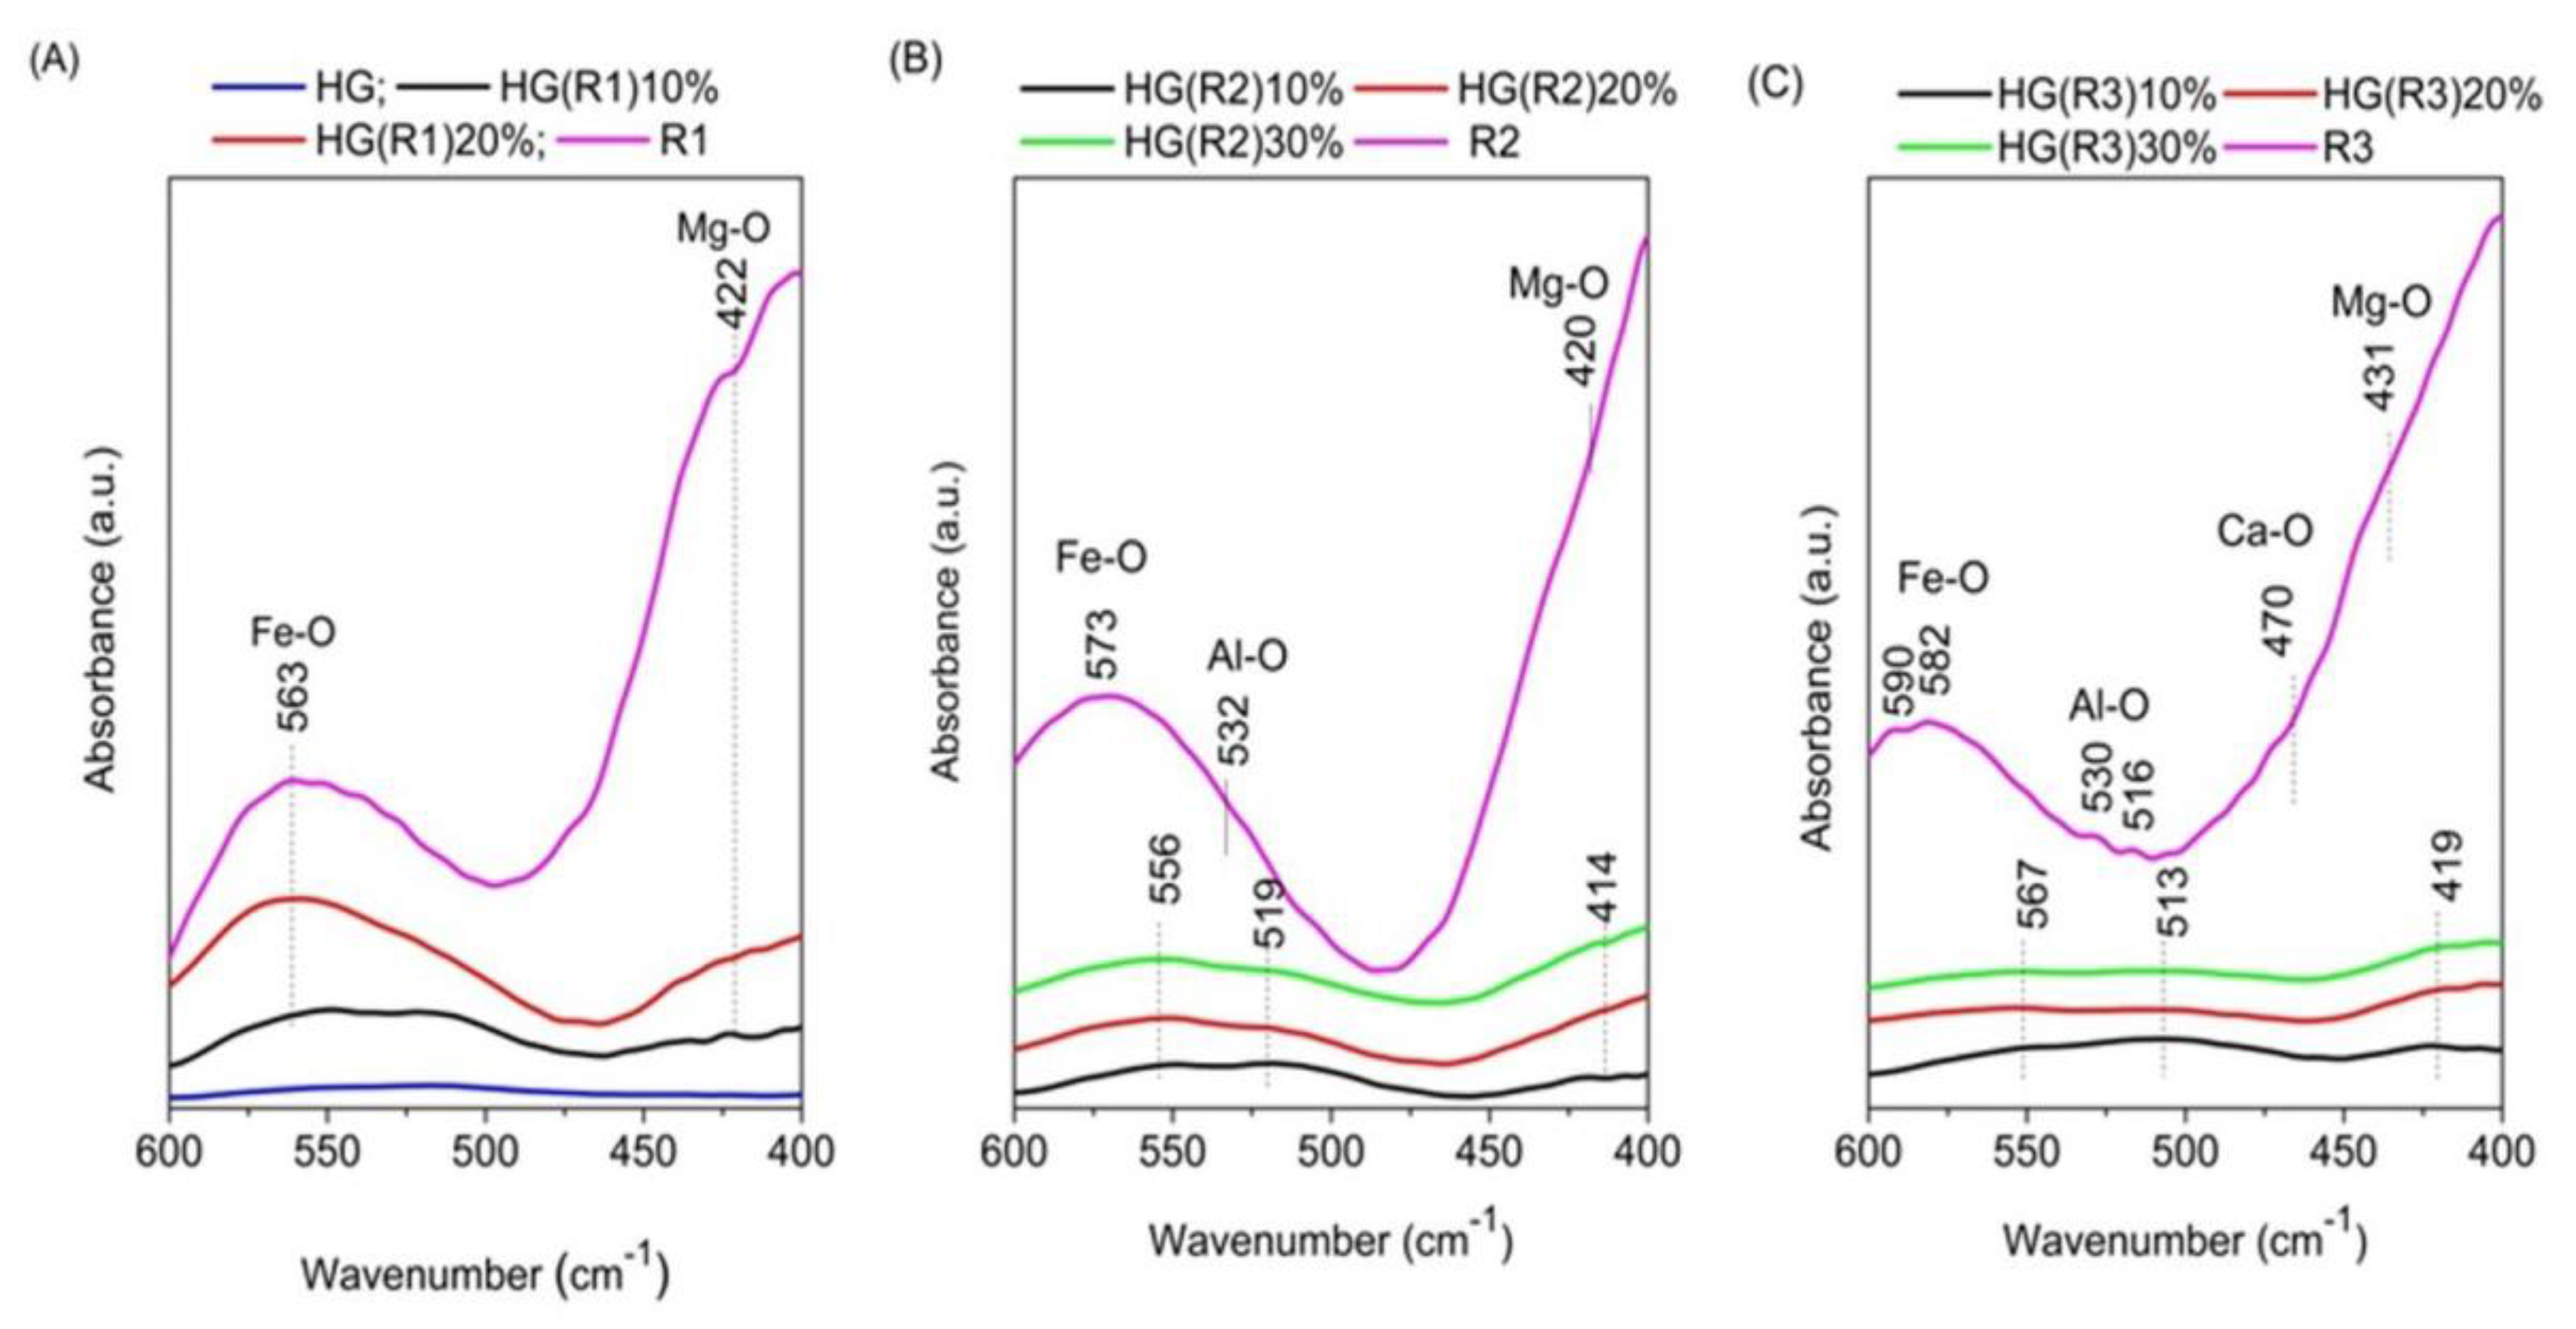
3.1. Identification of the Interactions between the PEGDA Matrix and LDH-RfL by FT-IR Spectroscopy

All ATR-FTIR spectra of the pristine LDH samples, H1-H3 (Figure 2A) show the characteristic absorption maximum for stretching vibrations in OH groups at 3446–3428 cm−1 accompanied by a shoulder at 3144 cm−1 due to the hydrogen bonds created with the carbonate anions located in the interlayer region [36], along with the band for water deformation in the interlayer at 1645 cm−1 and a band characteristic to Fe-O bond stretching vibrations at 600 cm−1 [39]. In the region 1600–1300 cm−1, there are some bands related to the vibrations in the carbonate compensation anions. The spectra of samples without calcium in the brucite-type layer (H1 and H2) show two intense absorption bands at 1482 and 1421 cm−1 and a lower intensity band at 1360 cm−1, while in the spectrum of H3, the most intense band is the bandat 1360 cm−1 which is characteristic of bidentate configuration of the carbonate anion [40], the band at 1482 cm−1 has a lower intensity and the band at 1421 cm−1 is missing. The band appearing in the region 800–600 cm−1 related to M-O-H (M = metal) deformation vibrations [41,42,43] is located differently, depending on the cationic composition of the samples; thus, for the sample containing only Mg(II) and Fe(III) (e.g., H1) the maximum appears at 718 cm−1 while for the other samples the maximum is shifted to higher wavenumbers (731 cm−1). The spectrum of the dried phytoextract Rfs (Figure 2A) shows a broad intense band at 3322 cm−1 (stretching -OH) accompanied by a shoulder at 2919 cm−1 (stretching of aromatic CH), and typical bands for substituted quinones in the fingerprint region [44,45].
In the spectra of the samples R1–R3 obtained after the immobilization of the RfL phytoextract by reconstruction in the LDH matrices (LDHsRfL) (Figure 2B–D), the bands characteristic to the pristine LDH were significantly altered and the bands of RfL cannot be neatly separated from those of the corresponding matrix. However, it may be seen that the position of the maxima is different depending on the cationic composition of the LDH matrix, suggesting that there are specific interactions between the organic phase from the phytoextract and the cations in the brucite-type layer. For all three samples, the most intense band is located in the region characteristic to M-O vibrations below 600 cm−1, suggesting that the reconstruction was incomplete and there are still oxide phases present in the solids. This fact was also indicated by the results of the XRD analysis. The bands in the region 1600–1300 cm−1 where there is an overlapping of the bands characteristic to LDH structures and those characteristic to the phytocomplex have significantly lowerintensity compared to the same region for H1–H3 spectra.The characteristic maxima for the spectrum of the dried hydrogel HG are displayed in Figure 2B. The FTIR spectra of simple hydrogel presented the characteristic peaks of polyethylene glycol diacrylate macromer: stretching vibrations of –CH2– group at around 2880 cm−1 and of C–O–C groupataround 1100 cm−1. Also, the FTIR spectra of HG displayed the characteristic peaks of PEGDA: at 1248 cm−1, characteristic to the O–H stretching vibrations, the peaks around 1350 and 1450 cm−1 characteristic to the C–H wagging and bending of –O-Hand those around 1730 cm−1 and around 1630 cm−1, which are characteristic to the carbonyl group –C=O and to the asymmetric stretching of the −C=C−, from the acrylate group of PEGDA [41]. The encapsulation of R1, R2, and R3 (Figure 2B–D) in the hydrogel maintains the specific peaks of HG, but their intensity varies depending on the amount of LDHsRfL solid incorporated. The cation composition of the brucite-type layer affects differently the reticulation of the hydrogel. After the encapsulation of R1, whose matrix contains only Mg and Fe, there is no splitting of the band at2867 cm−1 of the hydrogel. The encapsulation of R2 (which contains Mg, Fe, and Al) leads to the occuring of two new bands, one intense at 2979 cm−1 and a weak one at 3654 cm−1, while for the encapsulation of R3 (which contains Mg, Ca, Fe, and Al) the new band at 2979 cm−1 is more intense than the bandat 2867 cm−1 and the band that was noticed at 3654 cm−1 for R2 containing composite is shifted to 3660 cm−1 and its intensity is higher. The FTIR spectra support the idea that no new covalent bonds appear during the immobilization of phytoextract in LDHs and, subsequently, in hydrogel.
In order to highlight the modifications of the spectra in the region 600–400 cm−1, where the bands characteristic to M-O vibrations appear, the spectra of hydrogel-encapsulated samples containing different amounts of R1, R2, and R3 were five-fold amplified in that region and represented separately in Figure 3.
As it may be seen in Figure 3A, the neat hydrogel does no present absorption bands in the investigated domain. For all the hydrogel-encapsulated samples the bands are very weak due to the low amount of incorporated LDH-RfL. For the sample R1 which contained only Mg and Fe in the LDH matrix, the positions of the characteristic absorption maxima after its encapsulation in the hydrogel were shifted to lower wavenumbers only at the lowest concentration of R1, suggesting that the new bonds created between R1 and the polymer were very weak. The incorporation of the samples R2 and R3 into the hydrogel leads to the modification of the positions of the maxima characteristic to the neat LDH-RfL samples (Figure 3A,B), suggesting that Al-O and Fe-O bonds are formed with the polyether groups of the polymer.

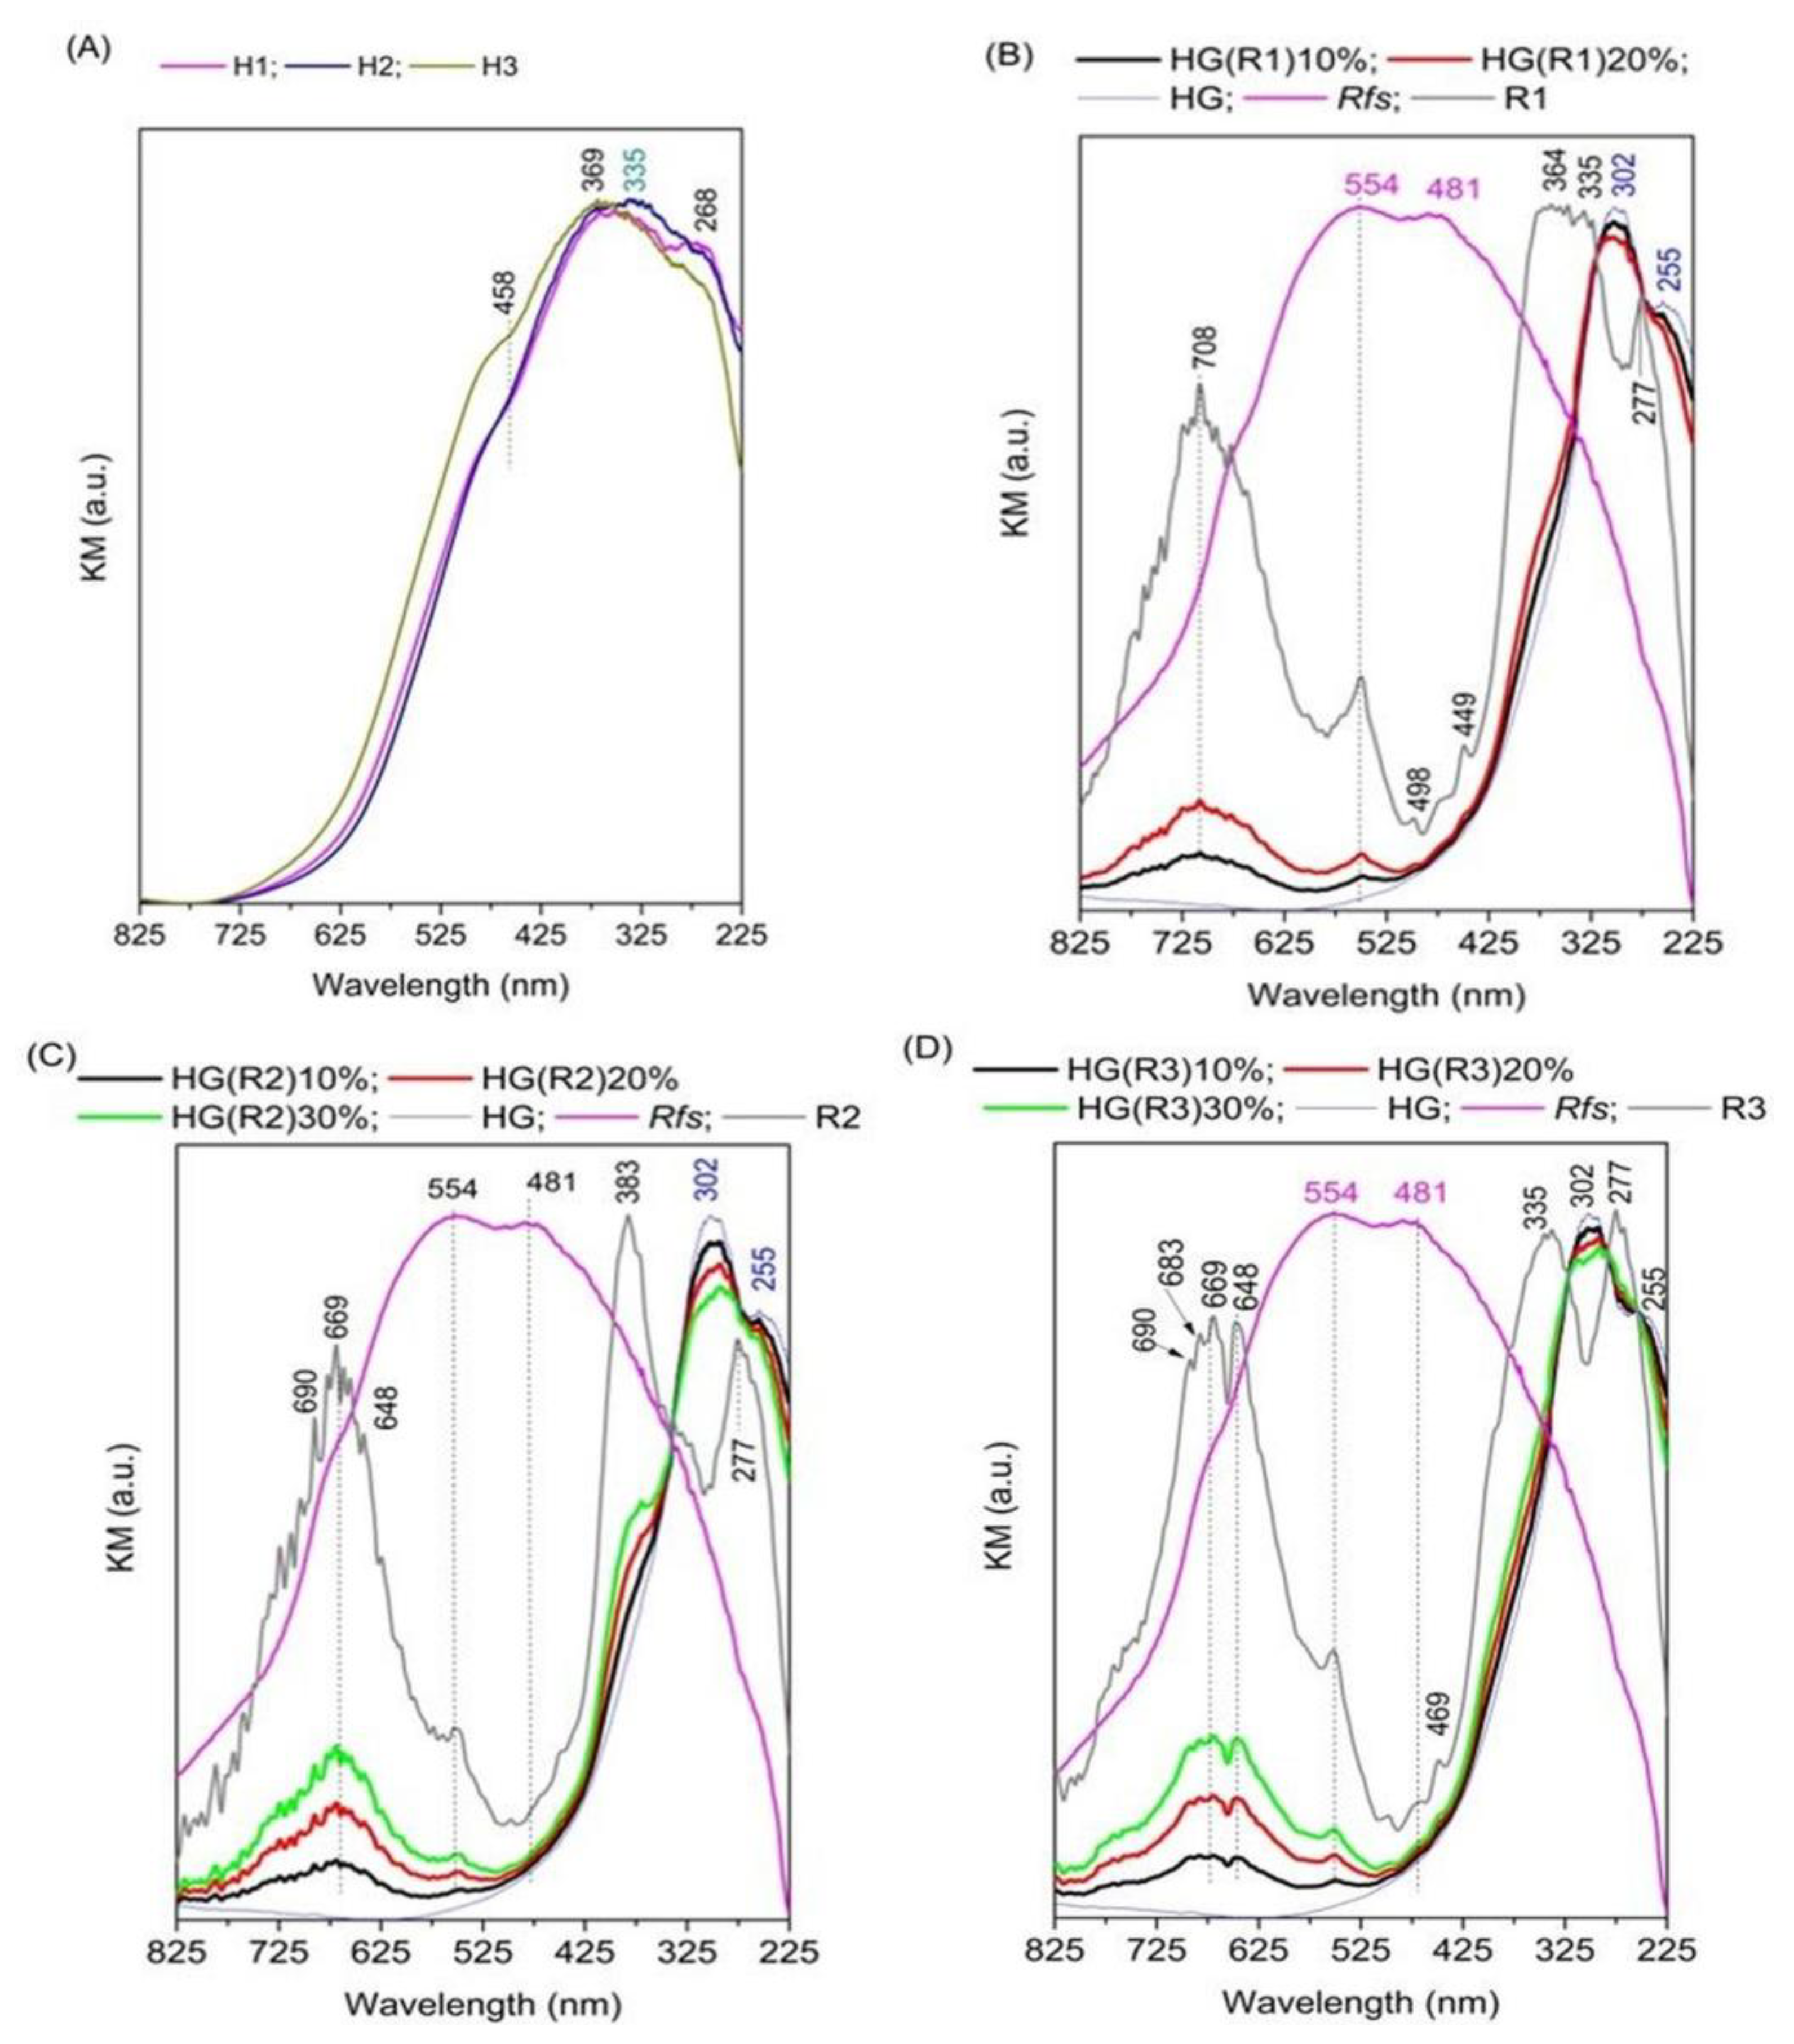
3.2. Identification of the Interactions between the PEGDA Matrix and LDH-RfL by DR-UV-Vis Spectroscopy

The DR-UV-vis spectra of the pristine LDHs (Figure 4A) present the most intense absorption maximum at 335–369 nm characteristic to Fe in octahedral symmetry [3,46,47,48] and the maximum at 268 nm corresponding to O→Fe3+ charge-transfer characteristic for α-Fe-O(OH) [47].
The DR-UV-Vis spectrum of the dried RfL phytoextract (Rfs) shows a broad absorption band with two maxima at 554 and 481 nm (Figure 4B–D) due to the electronic transitions characteristic to conjugated aromatic systems which exist in its composition [49]. After the incorporation of RfL phytoextract in the LDH matrix, the charge-transfer bands characteristic to the pristine LDHs become sharper and more intense and the position of the maximum at 268 nm (Figure 4A) shifts to higher wavelength 277 nm (Figure 4B–D). The bands characteristic to the dried RfL phytoextract appear for all reconstructed samples and the band at 554 nm displays the highest intensity for R3 (Figure 4D, while the band at 481 nm has the same intensity for all samples. The most significant changes of the DR-UV-Vis spectra compared to those of the parent LDHs are noticed in the region characteristic to d-d and n-π transitions, where new bands appear in the region 725–600 nm due to the complexation of the organic moieties from the RfL phytoextract to the Fe sites from the LDH matrix. The positions and intensities of the maxima differ slightly depending on the composition of the LDH matrix. Thus, for the sample R1 whose matrix contains only Mg and Fe, there is one sharp maximum at 708 nm (Figure 4B), for the sample R2 whose matrix contains Mg, Fe, and Al there are two intense maxima at 690 and 669 nm and two resembling a shoulder at 683 and 648 nm (Figure 4C), while for the sample R3 whose matrix contains Mg, Ca, Fe, and Al there are two well-defined intense maxima at 669 and 648 nm and two maxima resembling a shoulder at 690 and 683 nm (Figure 4D). This fact indicates that the components of the RfL phytoextract have different interactions in the ligand field of the solid depending on the chemical composition of the matrix. Since stronger interactions are characterized by lower wavelengths of the absorption maximum it may be inferred that the RfL phytoextract is stronger held in the matrix of R3. After the incorporation of R1, R2, and R3 into the hydrogel, the spectra of the resulting solids display the characteristic bands of R1, R2, and R3 with a lower intensity depending on their concentration in the hydrogel composite. For the samples prepared with R1 the absorption band at 335–369 nm characteristic to Fe in octahedral symmetry is noticed as a shoulder at 348 nm in the spectra of HG(R1)10% and 20%, respectively, while the maximum at 277 nm is overlapped by the band characteristic to the hydrogel (Figure 4B). A similar effect was noticed for R2 samples encapsulated in composite HG, where the shoulder (corresponding to the maximum at 383 of the neat R2 is noticed at 370 nm (Figure 4C). For the samples prepared with R3, whose LDH-matrix contains Mg, Ca, Fe, and Al, this shifting was not noticed, suggesting a better stabilization of the solid in the hydrogel structure.

3.3. Thermogravimetric (TGA/DTG) Investigation of the PEGDA/LDH-RfL Composite HGs

Thermal-analysis diagrams obtained for the synthesized samples indicate specific characteristics according to the nature of each sample category: pristine and reconstructed LDHs present three main decomposition steps whereas only two are noticed for calcined LDHs (Table 2). Furthermore, the presence of hydrogel adds more complexity to the thermal behavior, namely, an overall of four thermal decomposition steps. The general evolution of all LDH samples starts with water removal followed by decarbonation and, finally, the collapse of the double-layer structure at higher temperature [50] with specific features according to the cationic substitution performed (Fe with Al and, subsequently, Mg with Ca). The samples containing RfL phytoextract present exothermal steps because of the oxidative degradation processes occurring for the included organic component. All samples embedded in the PEG-based hydrogel matrix exhibit also specific thermal degradation steps of the polymeric backbone [23,51,52] that can be significantly influenced by the high-temperature interaction with the iron-based inorganic content of the samples [53,54]. Detailed discussion of the thermal-analysis results, based on the Table S4 and Figure S2, is given in the Supplementary Material.

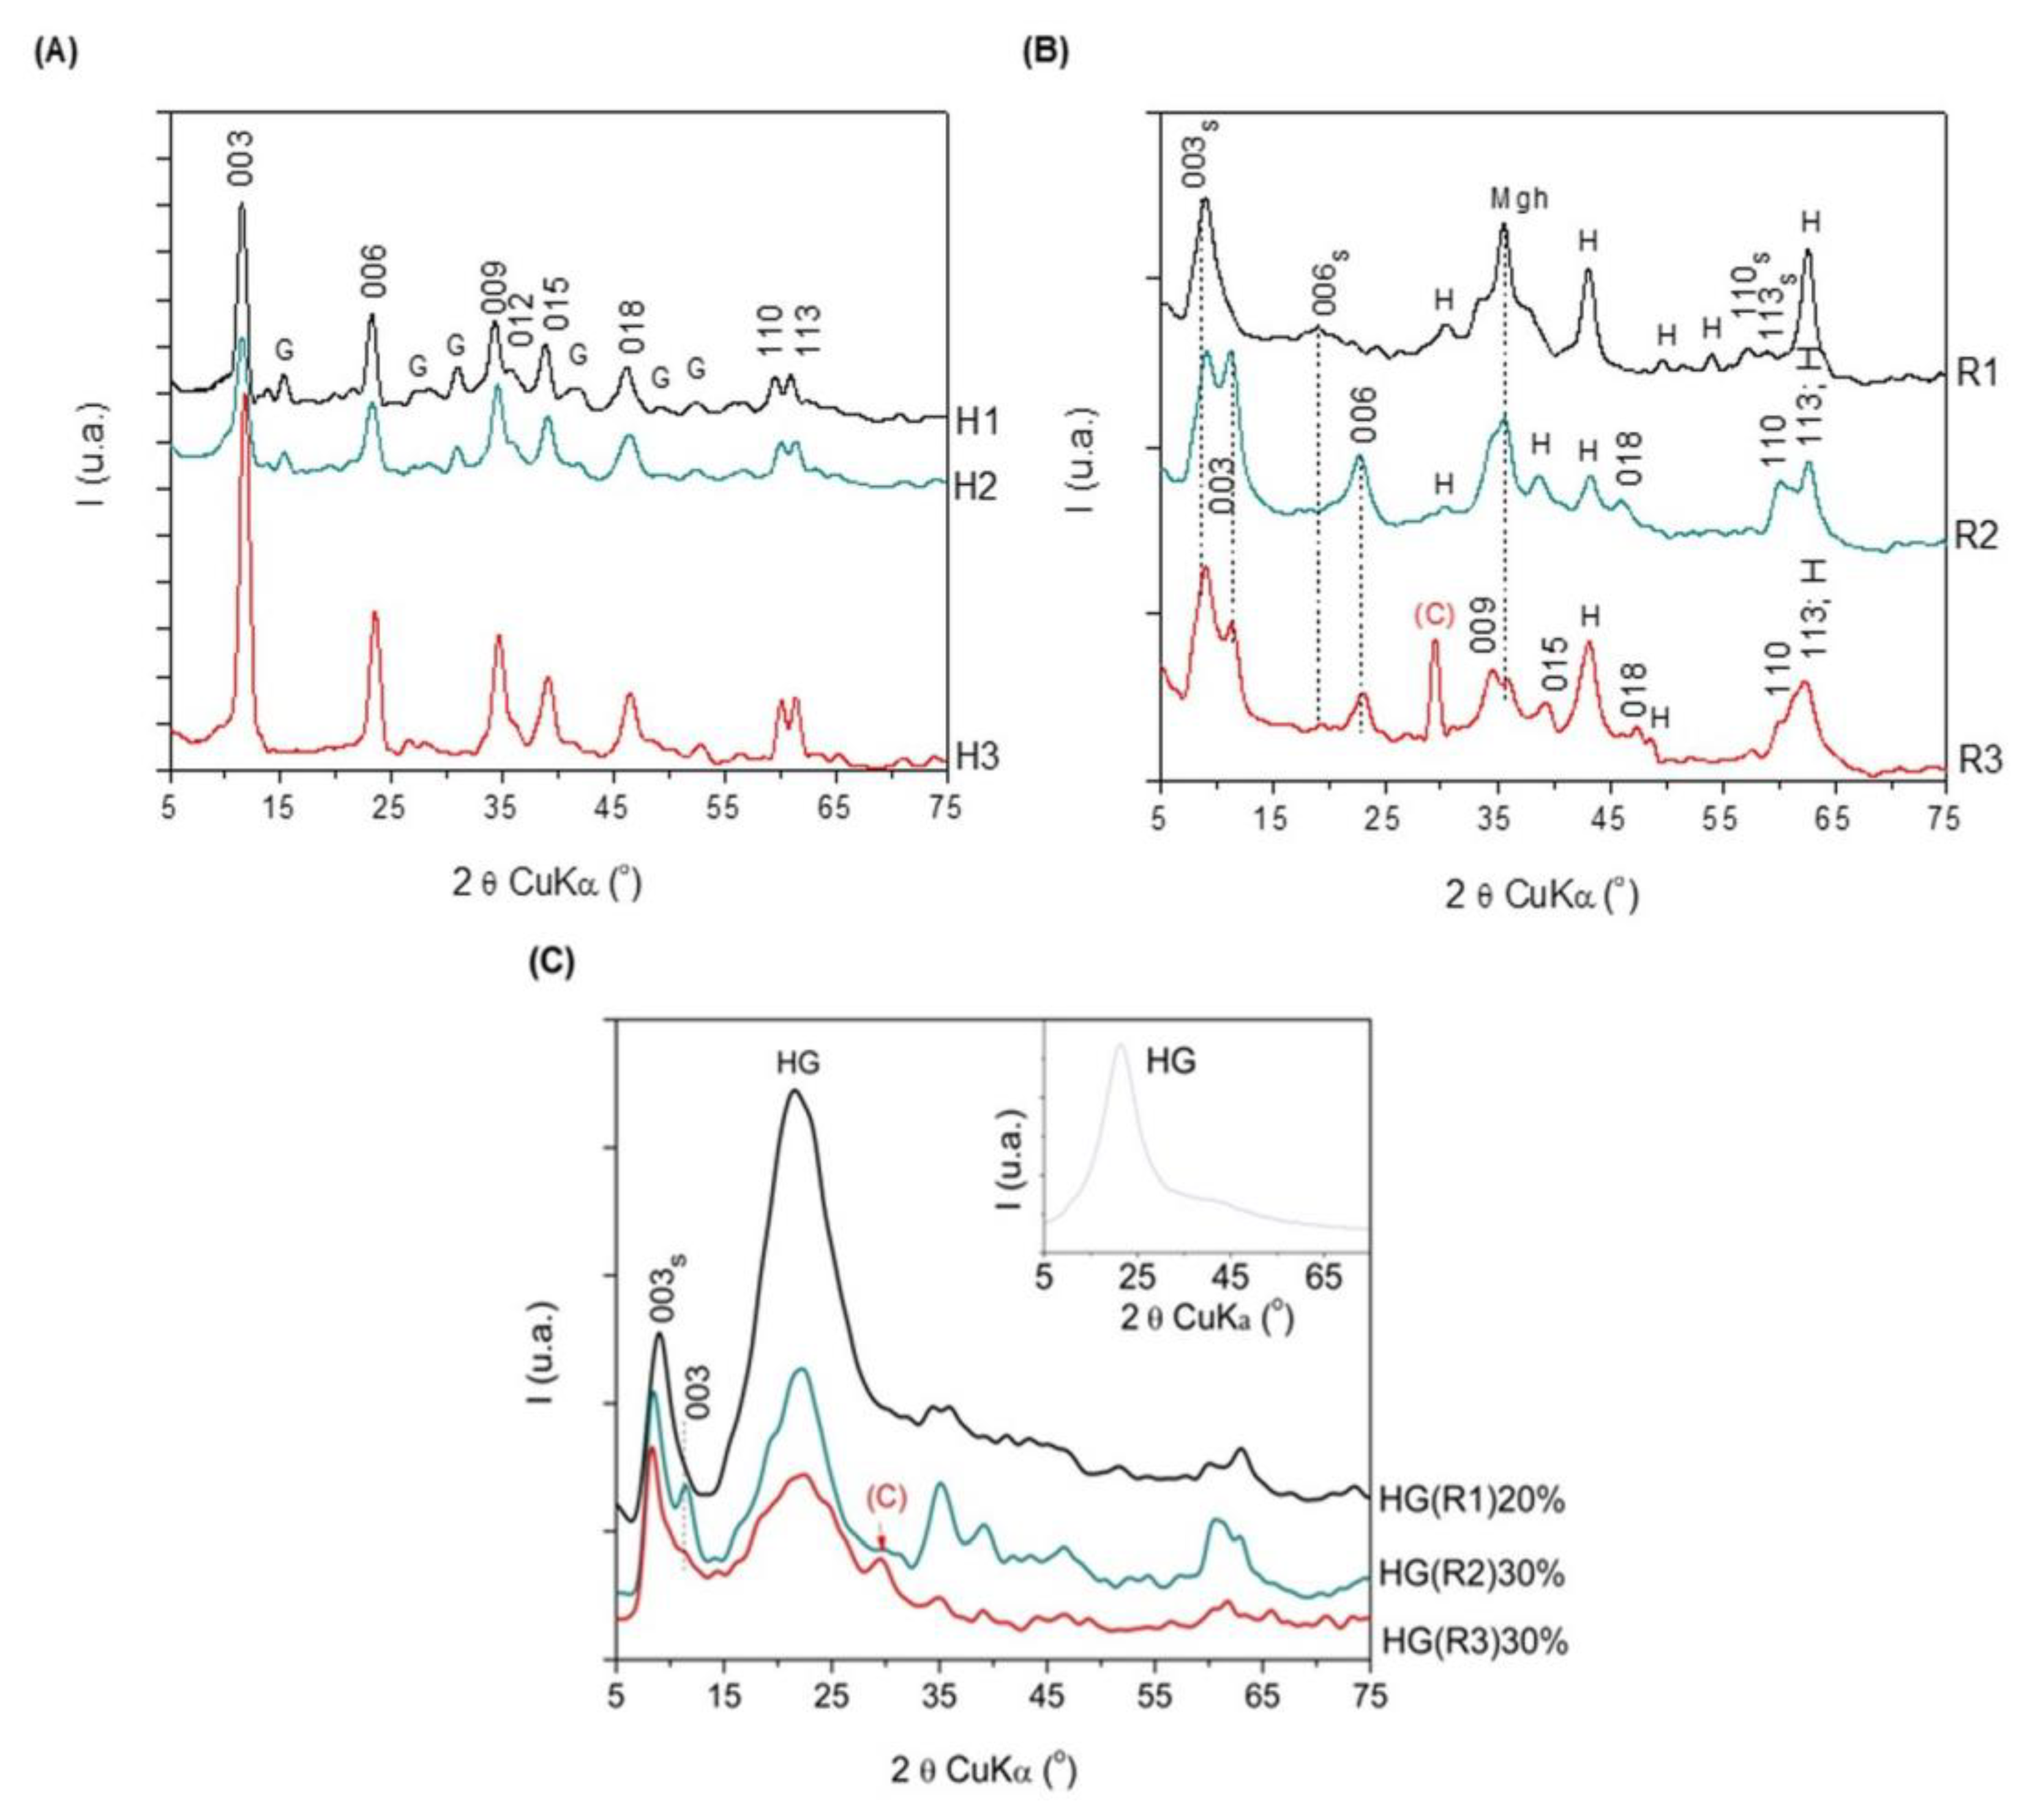
3.4. Morphological Characterization by XRD of the PEGDA/LDH-RfL Composite HGs

The XRD patterns in Figure 5A presented all the main diffraction lines characteristic to the LDH phases, the sample with the highest crystallinity (e.g., H3) being the one with quaternary composition of the brucite-type layer. In all patterns, low-intensity diffraction lines corresponding to goethite (PDF 01-081-0464) impurity (marked with G) were also noticed.
The immobilization of RfL phytoextract in the LDH matrix affected the crystallinity of the resulting solids as indicated by the XRD patterns in Figure 5B which show wider and lower-intensity diffraction lines compared to those noticed in Figure 5A. RfL incorporation led to the splitting of the diffraction lines corresponding to 003 reflection in the patterns of R2 and R3, while in the pattern of R1 this line was shifted to lower values of 2θ. For the sample R1, the diffraction lines for 006, 110, and 113 reflections were also shifted to lower values of 2θ. This fact indicated the formation of an extra layered phase having a larger interlayer space, proving the intercalation of larger-sized anions from the RfL phytoextract. The small value of 2θ corresponding to 003 reflection of this extra-phase denotes a degree of crystalline disorder along the c-axis, the axis on which the brucite-like layers are stacked [36]. Bands corresponding to traces of hematite (JCPDS card no. 1-087-1164) and maghemite (JCPDS card no. 39-1346) are visible in the patterns of R1–R3 samples, while the pattern of R3 shows also a diffraction line corresponding to calcite (JCPDS card no. r01-071-3699) impurity. This fact suggests that the reconstruction of the layered LDH structure was only partial, since these oxide-phase impurities were stable and did not participate in the dissolution–recrystallization process.
The diffraction patterns of the composite HGs encapsulated with RfL phytoextract in the LDH matrix (Figure 5C) show broad diffraction lines with low intensity. For the sample containing 80% hydrogel and 20% R1, the most intense diffraction line is the line corresponding to the hydrogel (see the inset figure), whereas for the samples HG(R2)30% and HG(R3)30%, which contain only 70% hydrogel, the most intense lines are those related to the 003s reflection of the LDHsRfL phase. The alteration of the intensities of the remaining diffraction lines corresponding to R1, R2, and R3 suggests that during the encapsulation in the hydrogel a dissolution–recrystallization process involving the LDHsRfL phase takes place.
Table 3 shows the values of the calculated lattice parameters for the LDH phases existent in all the samples. The distance between two metals cations in the brucite-like sheet is related to the value of the α-lattice parameter and depends only on the molar ratio between bivalent and trivalent cations M2+/M3+, while the c-lattice parameter depends on both this ratio and the size of the interlayer anions [36]. It may be noted that α-parameter increases slightly when Fe is partially substituted by Al in the samples H2 and H3. The same effect is noticed for the samples R1–R3 and the hydrogel-encapsulated samples HG-LDHRfL. The immobilization of the RfL extract in the LDH matrix leads to a decrease inα-parameter compared to the corresponding LDHs precursors, suggesting that the phytocomplex disturbs somehow the position of the cations in the brucite-type layer. The decrease inα is even more significant after the encapsulation of the LDHRfL samples in the hydrogel, indicating that the cations became involved in establishing links with the polymer. The χ-parameter is almost similar for the samples H1 and H2 but is significantly lower for the sample H3 which also contains Ca cations. This fact may be due to the larger ionic radius of Ca2+ compared to Mg2+, which may lead to a shrinking of the interlayer. All LDHRfL samples have larger χ-values than the corresponding parent LDHs, indicating that the phytocomplex has been accommodated in the interlayer region. The encapsulation of LDHRfL in the hydrogel results in a further increase in χ parameter.

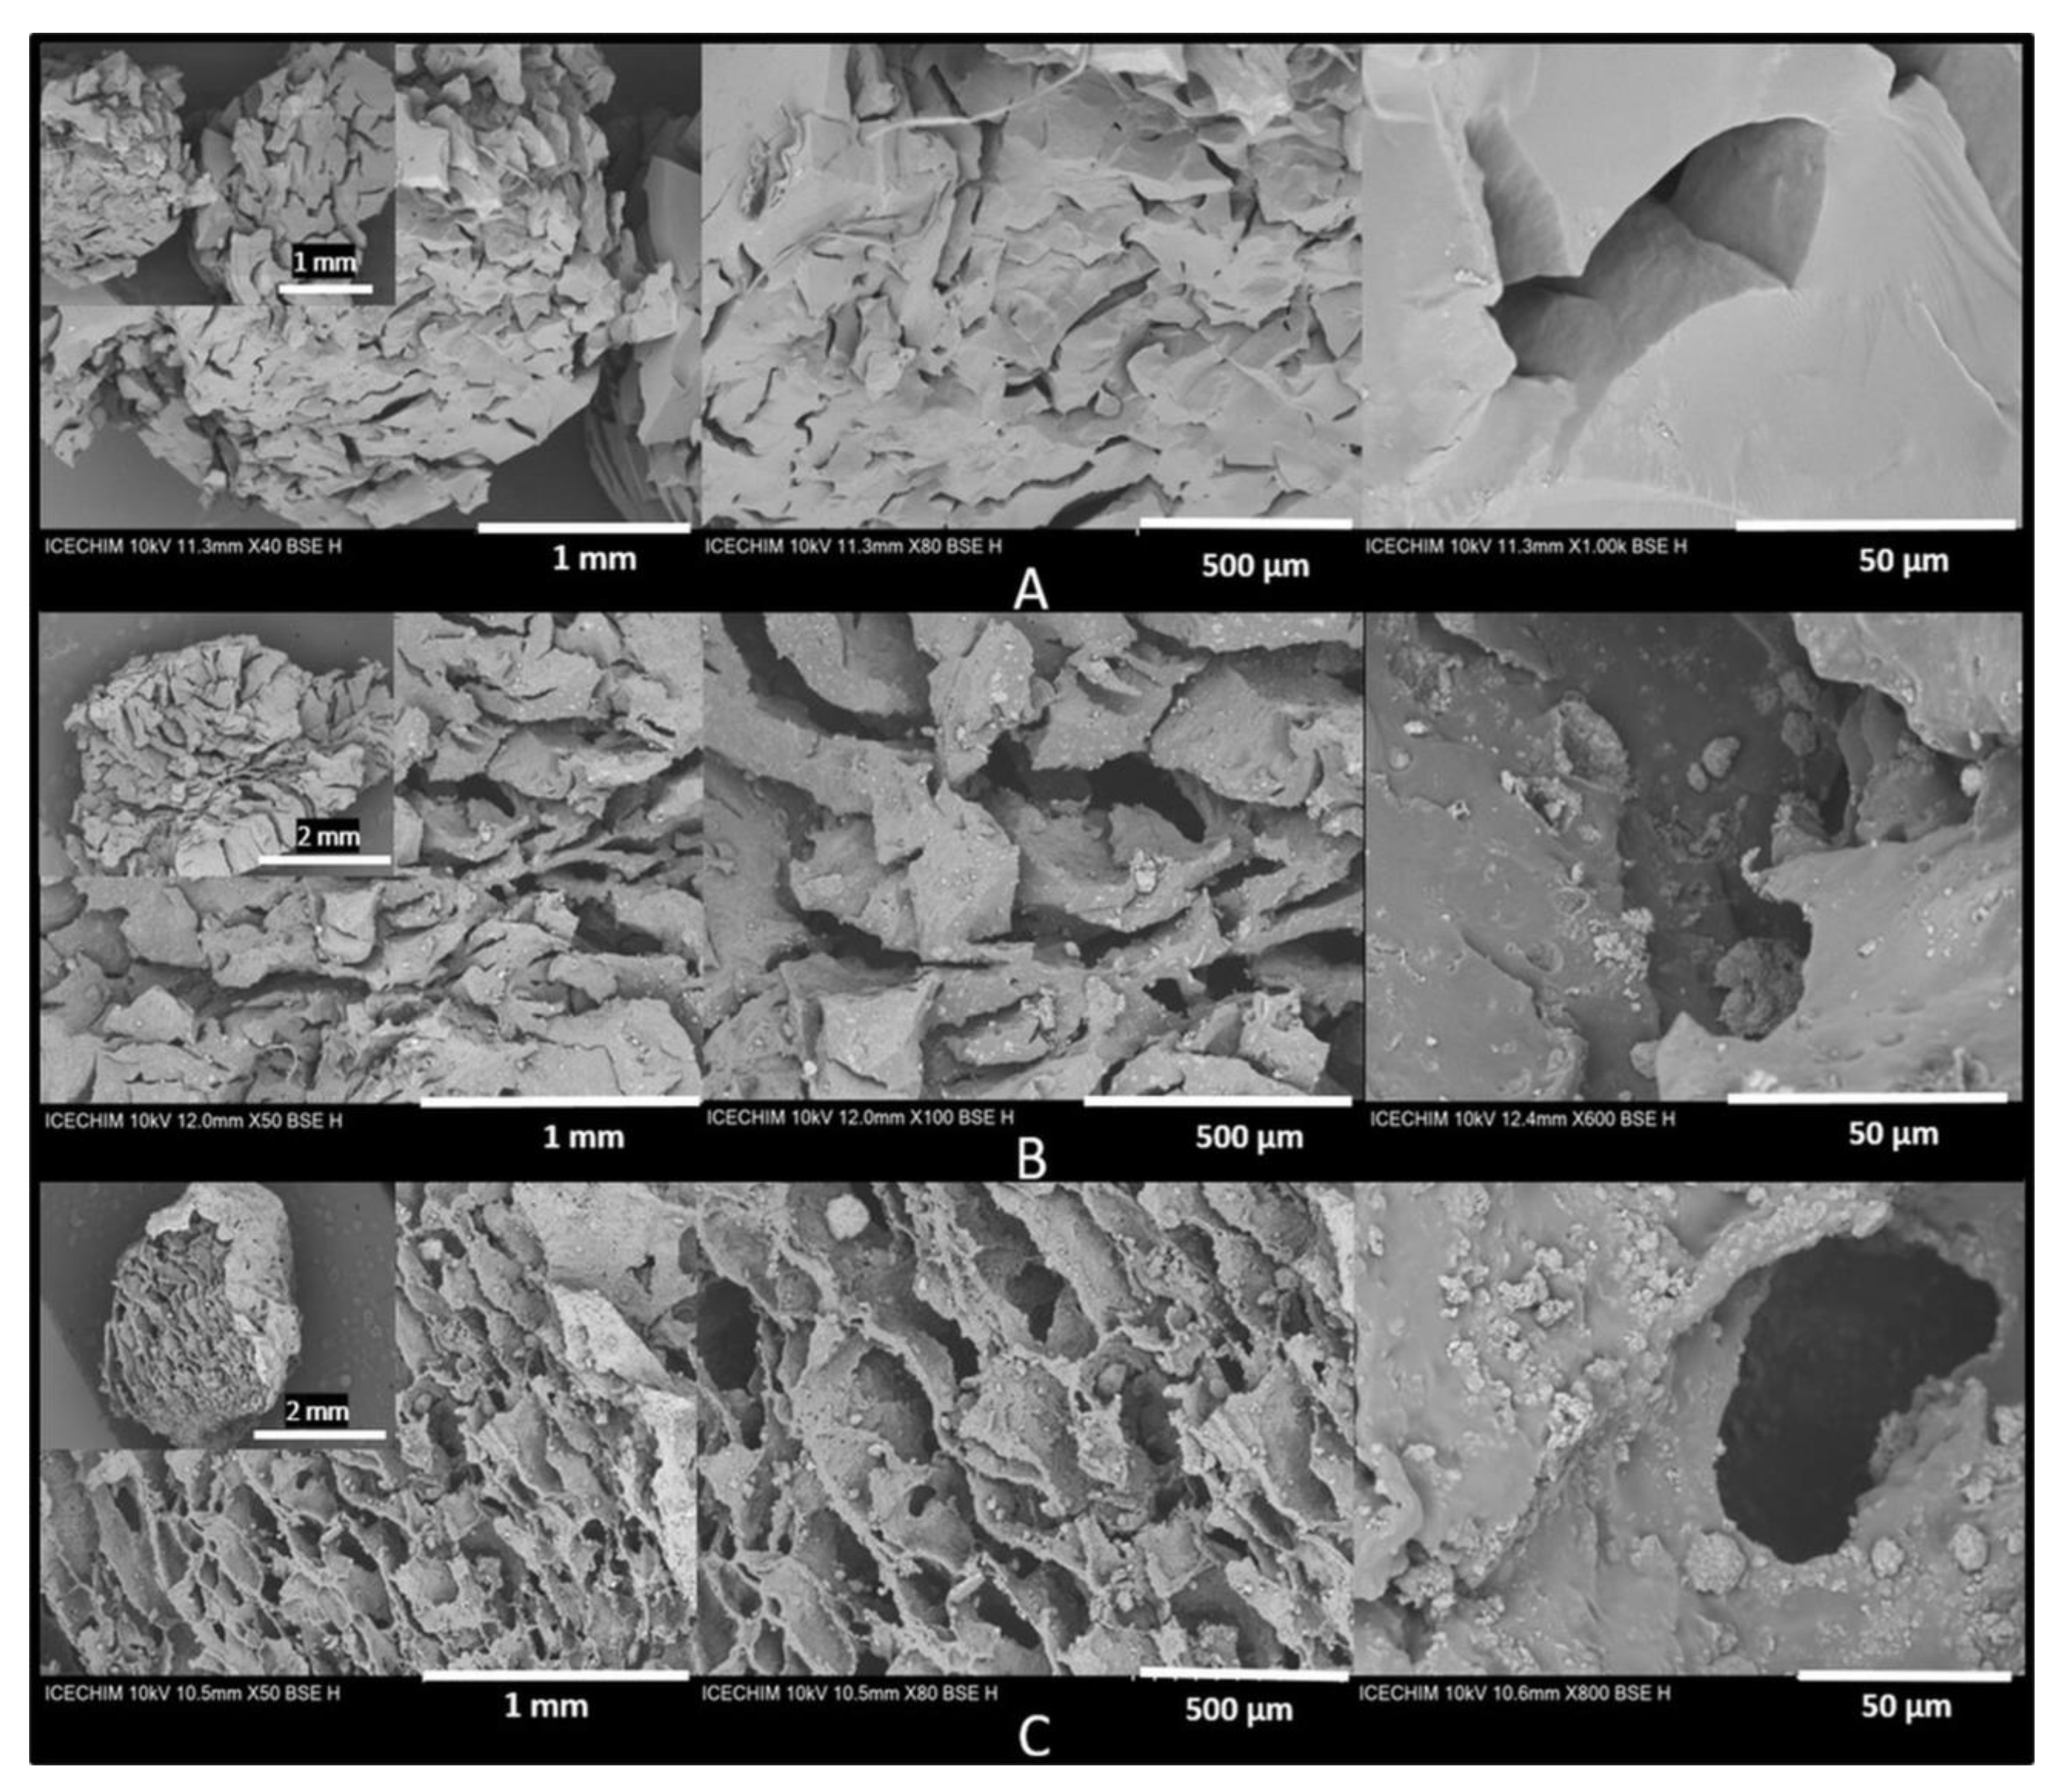
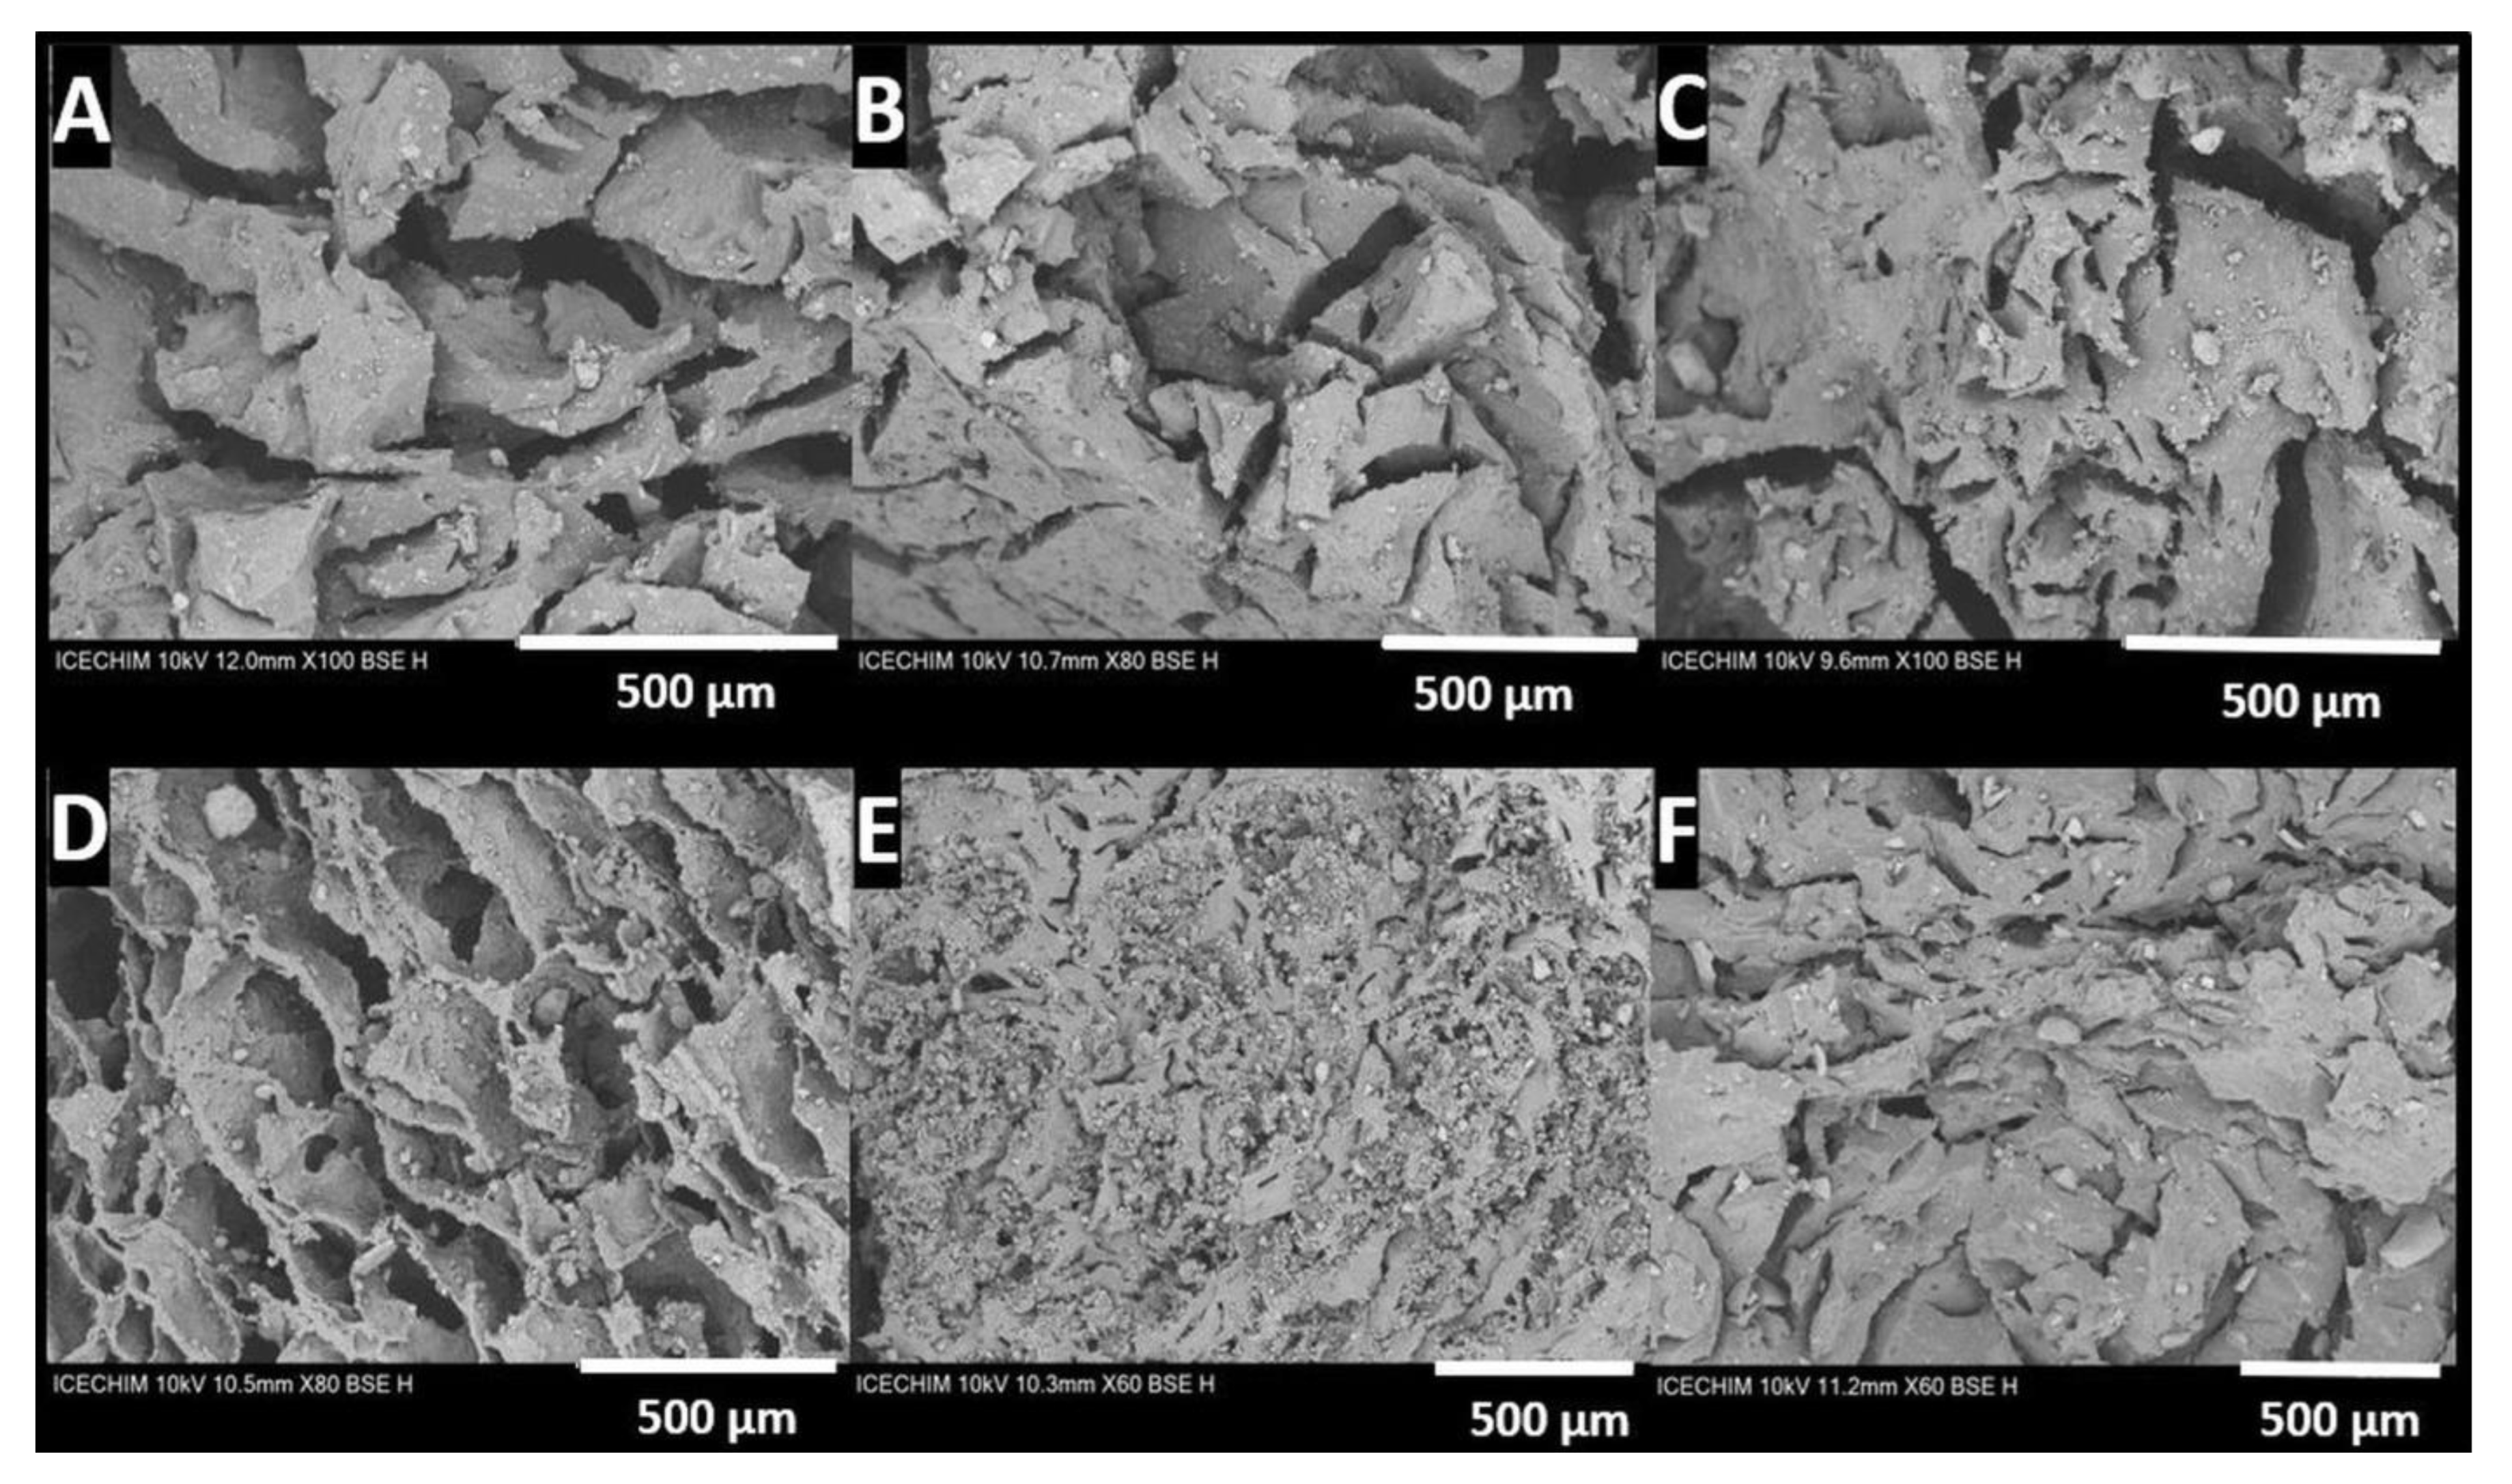
3.5. Morphological Characterization by SEM of the PEGDA/LDH-RfL Composite HGs

In Figure 6, SEM micrographs at three different magnifications of the lyophilized composite HGs with RfL phytoextract encapsulated in the LDHs matrix are presented. SEM micrographs were used to evaluate the morphology of all studied samples, knowing that the surface morphology has a great influence on the drug-release behavior. The micrographs clearly highlight the presence of LDHs in the structure of final HG composites. In Figure 6A, the images reveal a homogeneous morphology along with some cracks that led to the formation of porosity during the lyophilisation process of the control HG. The top surface morphology seen from above, looks like a smooth flat surface with large elongated pores. In Figure 6B, the SEM micrographs of the lyophilized HGs composite based on PEGDA and pristine LDH (HG(H1)20%), indicate the rough, homogeneous morphology and the presence of LDHs under plate-like shape agglomerates with a porosity and voids of the polymer network, together with some cracks formed during the freeze-drying process. Regarding the HG composites with RfL phytoextract encapsulated in the LDHs matrix (HG(R1)20%), the Figure 6C, reveals also a rough, homogeneous surface and a macro porous morphology with open and interconnected channels in the range of tens of microns. The rough and porous surface is an advantage in the drug-delivery systems [55]. Other SEM micrographs are displayed in Figure S4.
The porosity and the homogeneous distribution of LDH of all studied samples were also revealed in cross-section images (Figure 7 and Figure S3 in Supplementary Material). Looking into the detailed structures in the SEM micrographs, it is obvious that the surface of HG composites with incorporated LDHs (Figure 7A–C) exhibits a less homogeneous and more agglomerated structure (Figure 7D–F), thereby suggesting that the RfL phytoextract immobilized in the LDHs matrixand encapsulated in the HGs leads to an improvement in the dispersion of LDHs particles inside the polymeric network Therefore, it is relevant to say that the improvement of the dispersion with the RfL phytoextract immobilized in the LDHs matrix inside the polymer network may somehow be due to RfL phytoextract anions intercalated into the interlayer space of the LDHs, which caused the surface of the LDH to be more hydrophilic, leading to an improved compatibility of LDH particles with the hydrophilic polymer matrix. Also, the RfL phytocomplex encapsulated in the interlayer space of LDHs could intercalate the LDH layers, which can also lead to a better compatibility between the LDH filler and the PEGDA network [56]. The SEM images of hydrogel composites containing LDH with and without phytoextract (Figure 7) show a porous structure with interconnectivity between the pores, which is very important for drug release. The porosity and the dimensions of pores are very different, depending on the type of LDH and phytoextract content, being, generally, over 40%.

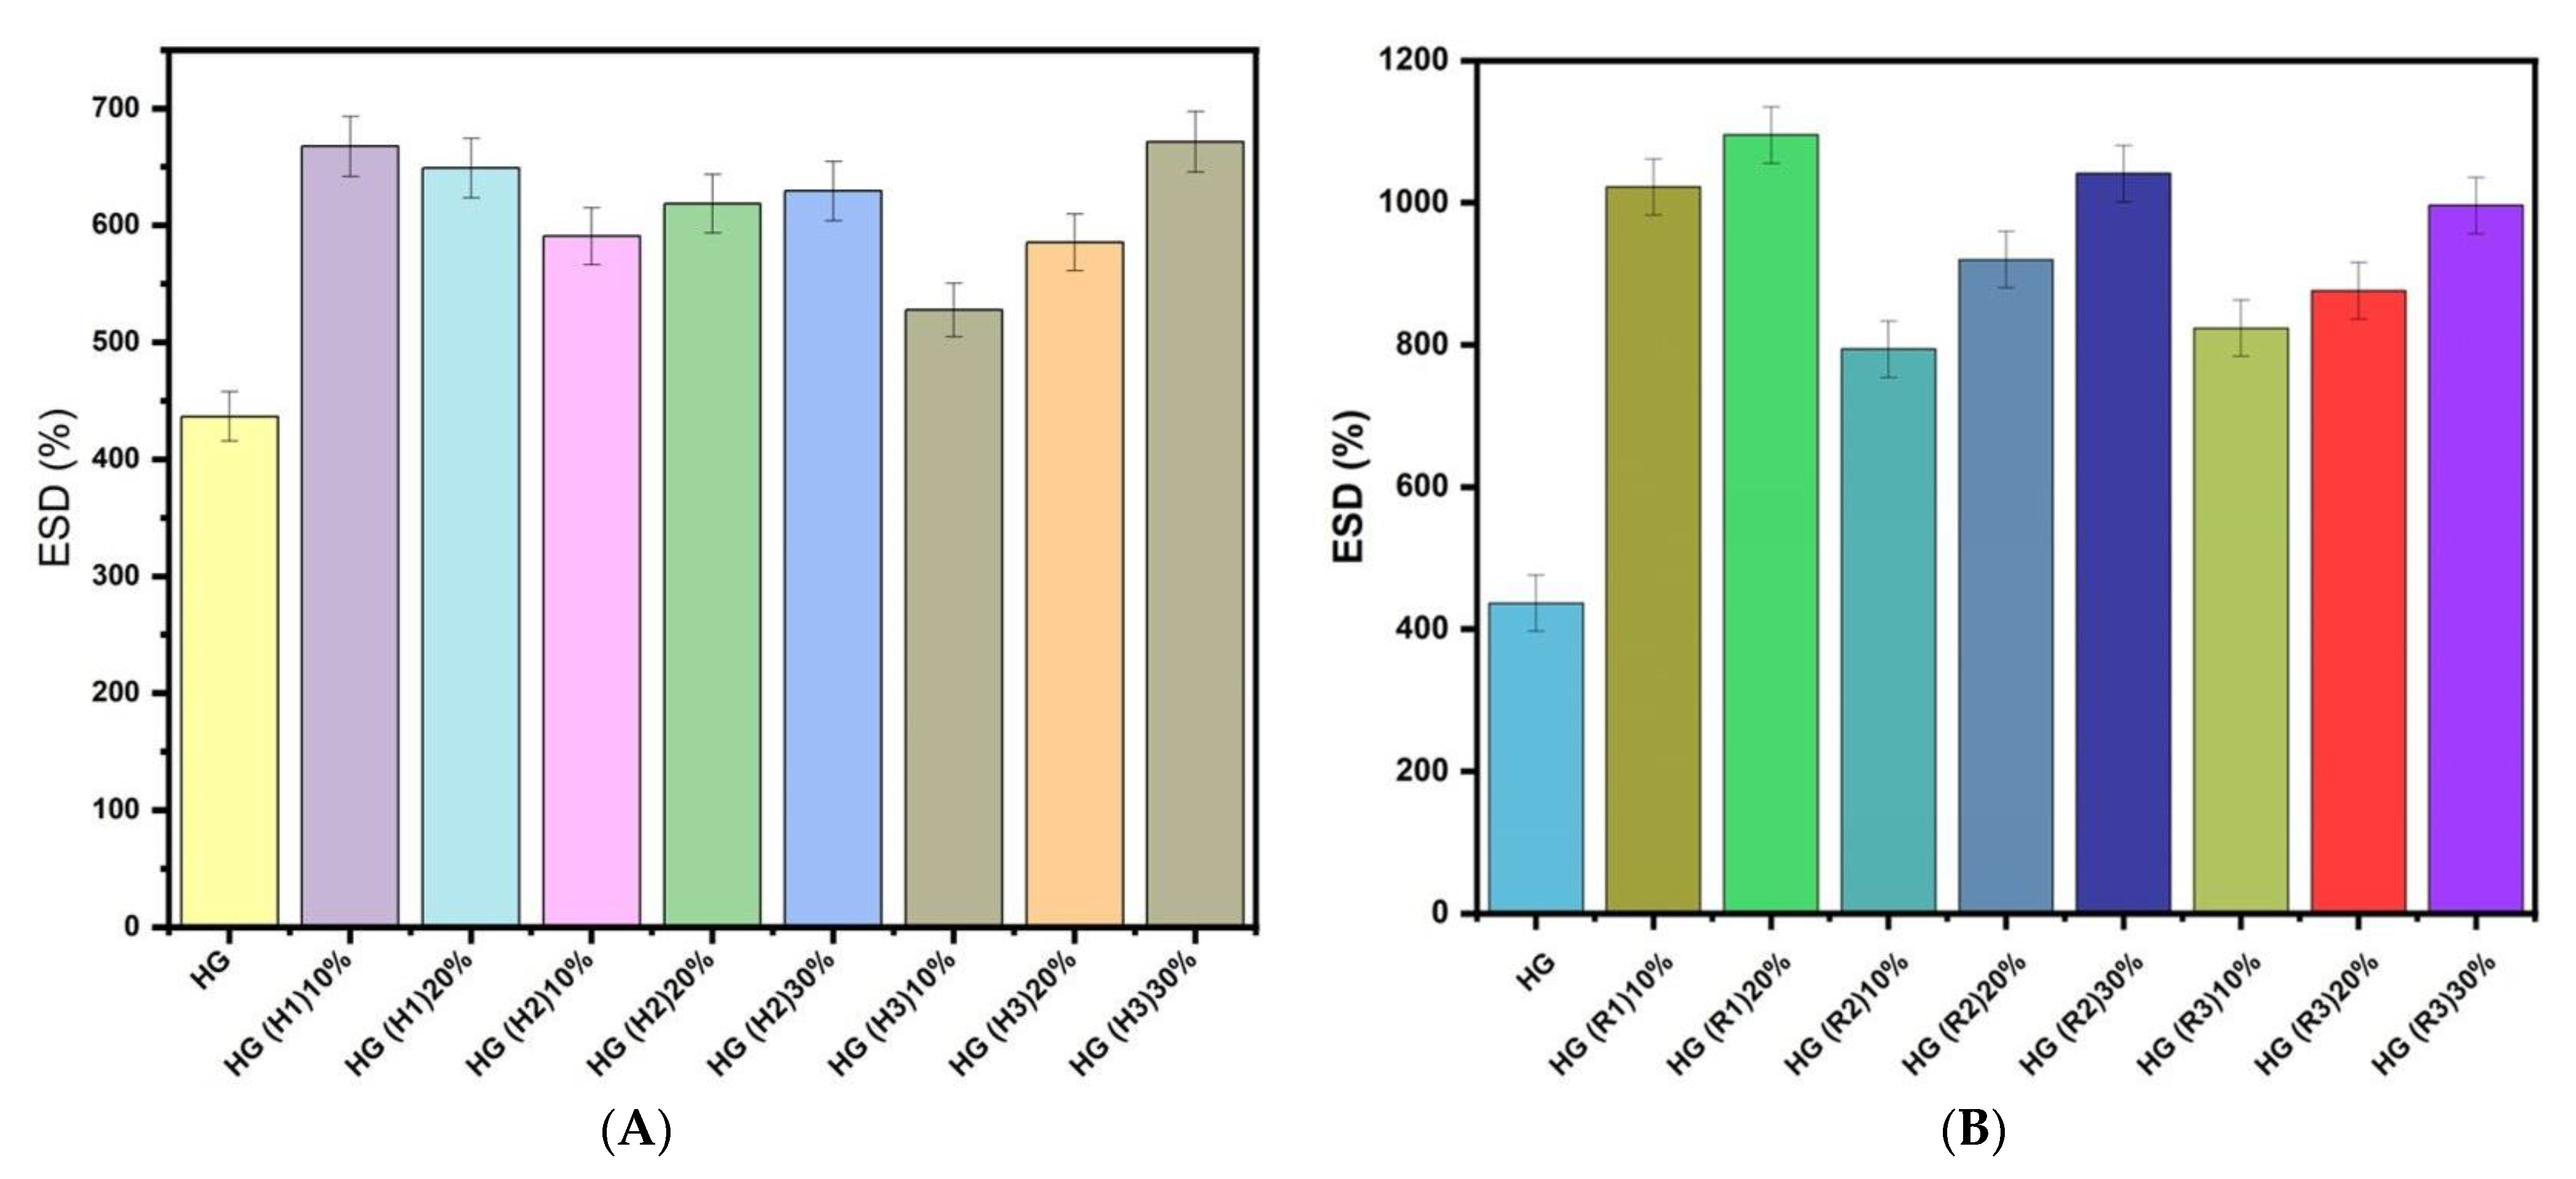
3.6. Equilibrium Swelling Degree

The equilibrium swelling degree (ESD) measurements in distilled water at room temperature are presented in Figure 8 for all studied samples. The equilibrium water content of the PEGDA hydrogels increased with the presence of the LDH filler (Figure 8A). This increase was more pronounced after immobilization of RfL phytoextract in the LDHs matrix (Figure 8B). The increase in water absorption as a result of RfL phytoextract immobilization in the LDHs particles and incorporation in the hydrogel structures is attributed to the presence of the phenolic compounds that limits the chain propagation (phenols might act as a chain transfer agent) [38]. The results show that a higher LDHs content in the polymer network leads to higher ESD of the HG composites. A possible explanation of this behaviour can be the intercalation of the LDH layers which led to a good dispersion in the polymer network and the yielding of more intercalate nanolayers increases the hydration ability of the OH group. A similar result was described by Lee and Chen in the case of poly (acrylic acid-co-n-isopropyl acrylamide)/intercalated hydrotalcite nanocomposites hydrogels [57].
Also, a difference in ESD can be observed depending on the type of encapsulated LDHs. Thus, in the case of H1(Mg2Fe) and H1 loaded with RfL(R1) encapsulated in the gel, a degree of swelling above 1000% can be observed. Due to the structure, the hydrogel acquires an affinity for water molecules and improves the swelling ratios of the final composite hydrogels. In the case of the pairs of composite HGs with LDH samples, namely, HG(H2), HG(R2) that contain LDH based on Mg, Fe, and Al, and HG(H3) and HG(R3) that contain LDH based on Mg, Ca, Fe, and Al; the swelling degree is slightly reduced compared to that of the LDH samples, which contain only Mg and Fe. It is well known that the presence of ions as Mg2+, Ca2+, and Al3+ in the hydrogel structure leads to a decrease in the swelling degree. Shivakumara and Demappa [58] have suggested that the bivalent cations develop strong interactions with the polymeric network and are able to cause further shrinking of the hydrogel network. However, in our case, the ESD increased with the presence of pristine LDHs and reconstructed LDHsRfL in the gel network. Enhancing the content of LDHs and LDHsRfL leads to an increase in ESD, in almost all the cases, showing again that intercalated structures are formed. Only in the case of HG(H1)10% and HG(H1)20% a slight decrease was noticed, revealing that the enhancement of cations concentration also plays a role in the hydration process.

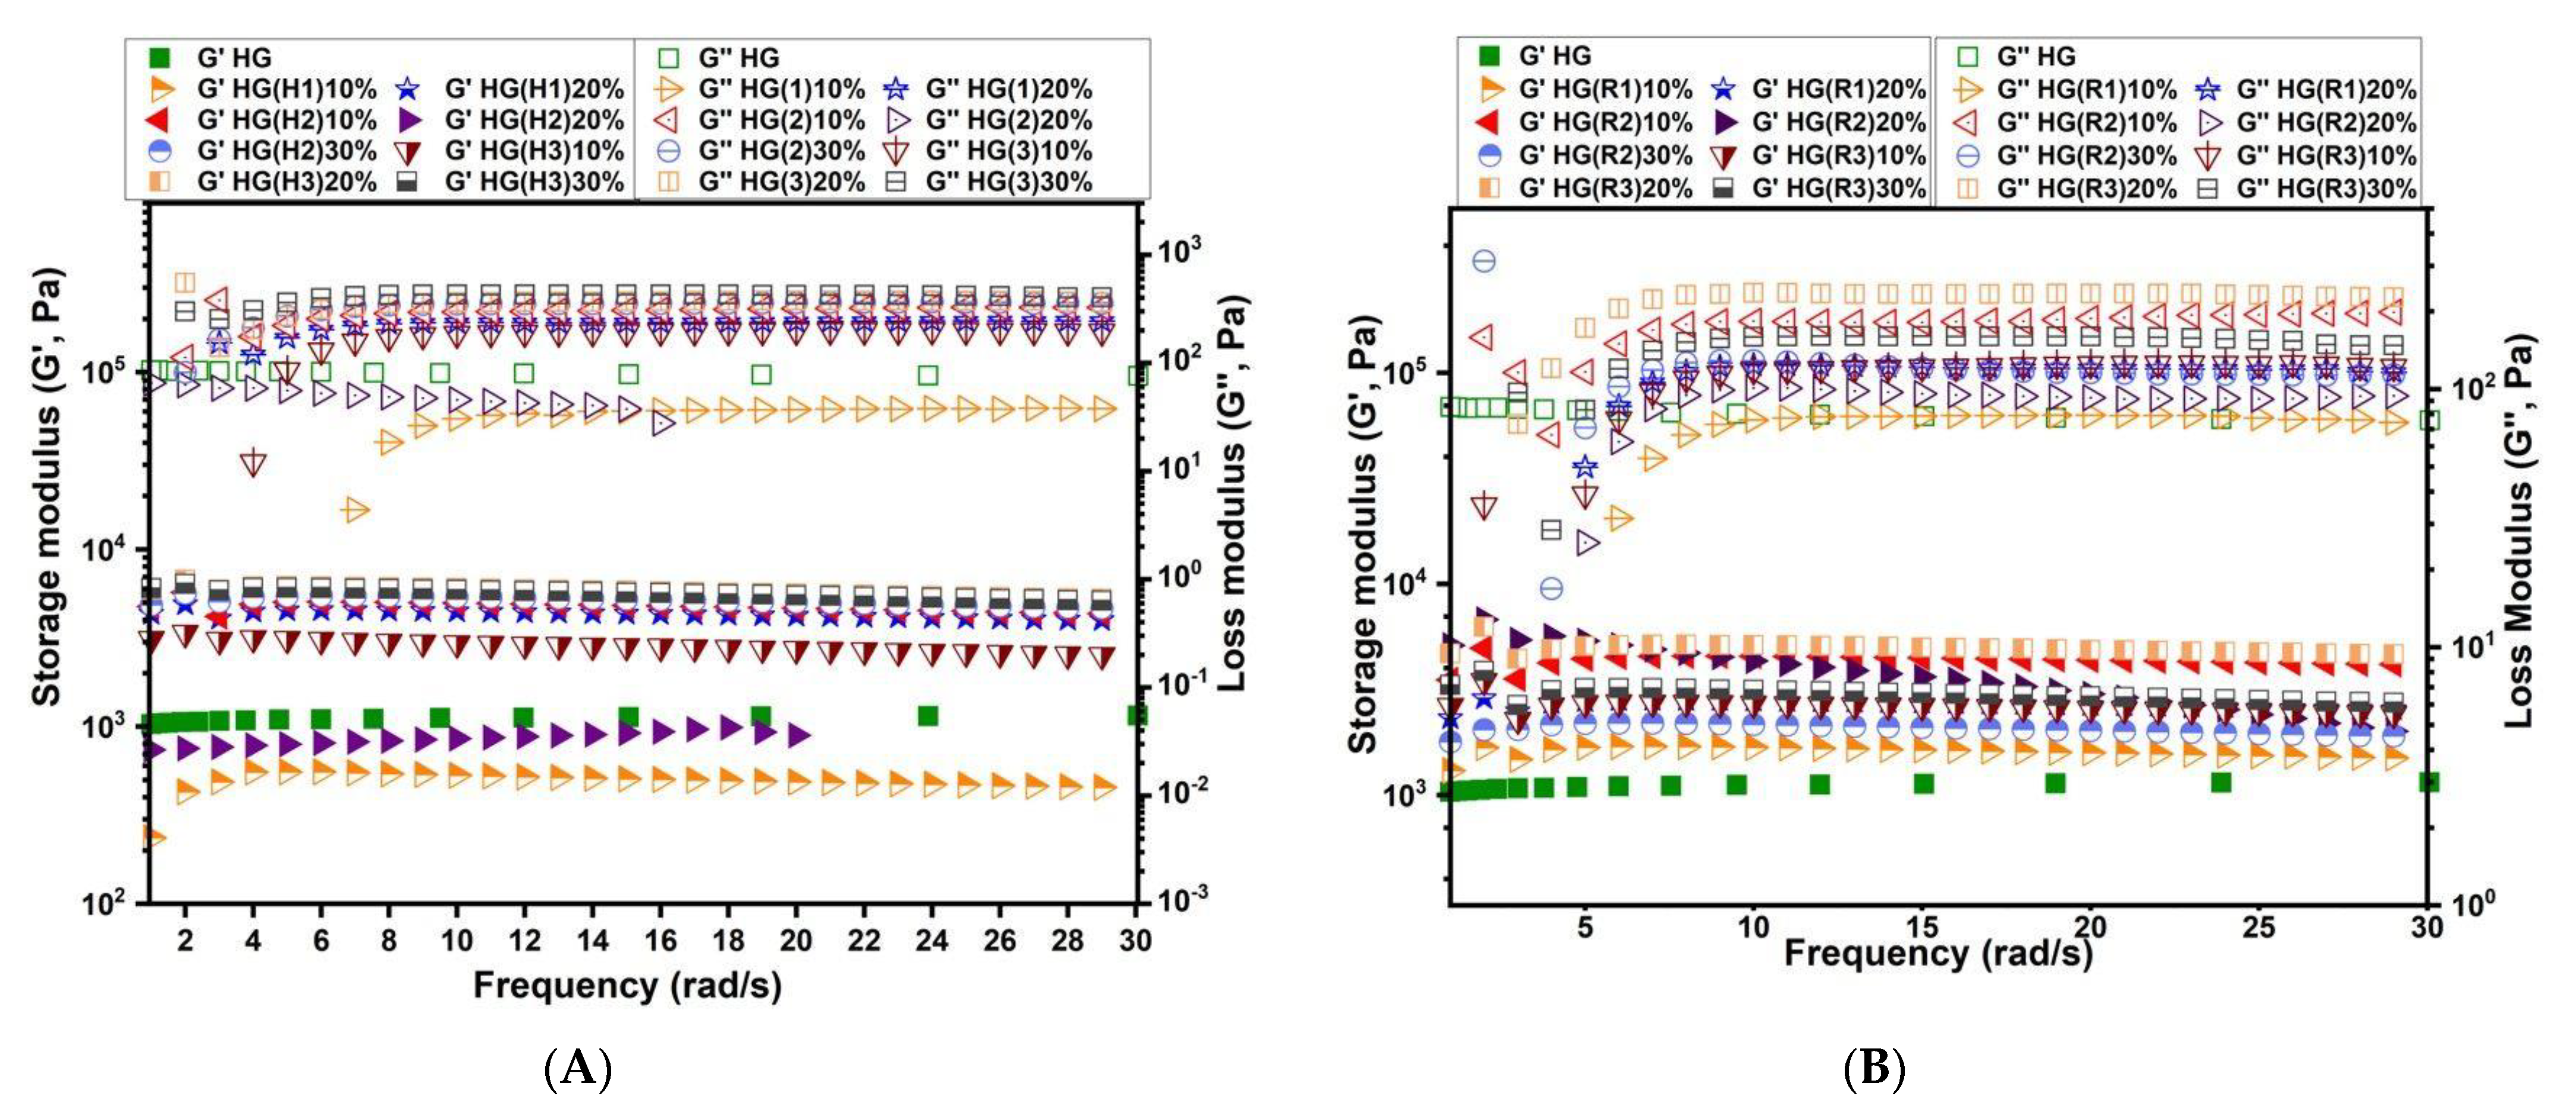
3.7. Rheological Behavior

The rheological behavior of the equilibrium swollen composite HGs was assessed by measuring the influence of the angular frequency on elastic modulus (G′) and loss modulus (G″). The frequency sweep measurements revealed that the elastic modulus (G′) was greater than the loss modulus (G″) over the whole investigated range, thus, confirming the crosslinked character of the hydrogels as presented in Figure 9. The fact that G′ is higher than G″ could be correlated to low numbers of network imperfections [59]. Therefore, one can notice that the addition of LDHs particles improved the mechanical properties of the composite HGs, the increasing of G′ being in the order: control HG < composite HGs containing pristine LDH < composite HGs containing RfL phytoextract immobilized in the LDH matrix. The gel strength increase may be explained by a better dispersion of the LDH particles in the PEGDA network, thus, leading to enhanced interactions and, consequently, to improved mechanical properties of the final hydrogels.
As stated in the ESD measurements presented above, the interaction between the LDHs particles and the PEGDA network influences the swelling behavior of the composite HGs. Therefore, in our case, the G′ values obtained for the neat HG displayed the same tendency as ESD, the control HG with a lowest ESD (HG, Figure 8) showing the lowest G′ (Figure 9), while the composite HGs with higher ESD namely HG(R2)30%,and HG(R3)30% (see Figure 8B) showed also higher G′ values (Figure 9B). Thus, the intercalated/dispersed LDH nanolayers in the PEGDA network, rendered possible the obtaining of a final composite HG with a stronger hydration capacity (due to the OH groups from LDH structure), and, at the same time, exhibiting a better elastic modulus (Figure 9A,B) than the neat HG. The loss tangent (tan δ = G″/G′) was calculated from the G′ and G″ values at 0.955 rad/s (~1 Hz). The values of a loss tangent lower than 1 for all the composite HGs represented an additional confirmation of their crosslinked character [60]. These results are in agreement with the SEM observations and the ESD measurements, where the RfL phytoextract immobilized in the LDHs matrix inside the polymer network showed a rough homogeneous surface and a macroporous morphology with open and interconnected channels and a stronger water-retention capacity compared with the neat HG.

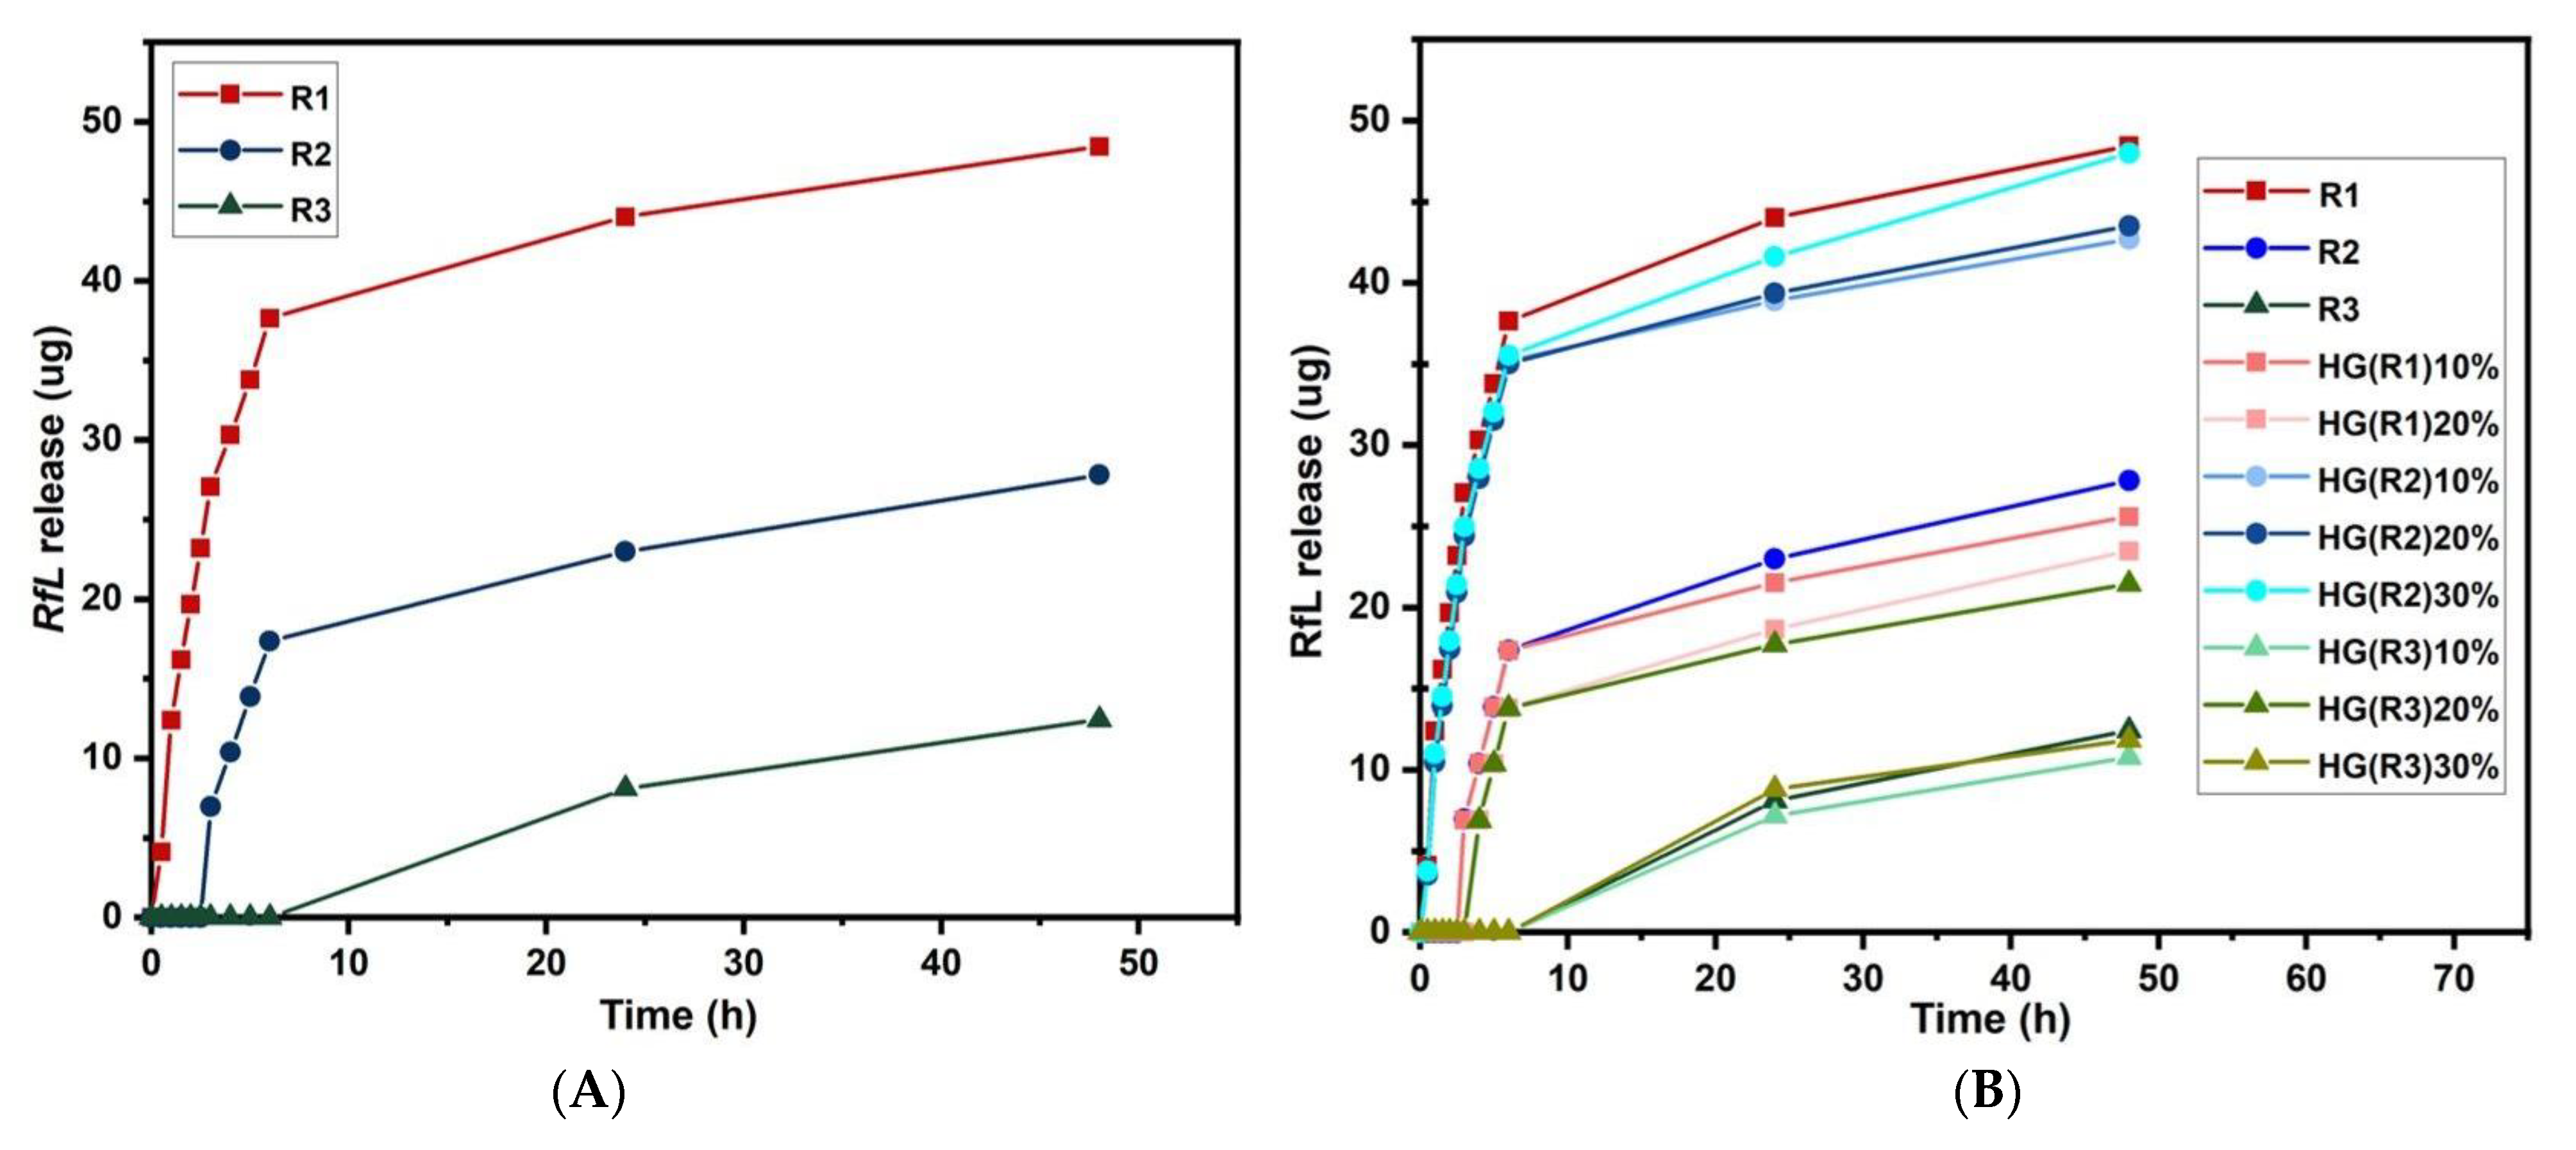
3.8. Controlled-Release Experiments

The results displayed in Figure 10 show the release rate of the RfL phytoextract at pH 6.8 for LDHsRfL and HGs with LDHsRfL samples. As one can see in the Figure 10A, the release rate of RfL phytoextract from LDHs not covered with HGs was higher for the R1 sample and smaller for the R2 and R3 samples, in the same time interval. In the case of R2 and R3, a delayed release is observed, showing the good encapsulation of phytoextract in LDH. Thus, the amount of released RfL depends on the composition of the LDH samples. Therefore, the RfL release was influenced by the interaction between immobilized RfL molecules and the bulk surface of LDH particles [61].
The release rate of the RfL phytoextract in the HG composites depending on time is shown in Figure 10B). For all the HG composites formulations, a sustained slow-release behavior was observed, with practically no burst effect. The slow-release rate in the case of the HG composite samples certificates the presence of the interactions between PEGDA chains, LDH particles, and RfL molecules [38]. The release rate of the RfL in the composite HGs decreased with the increase in the percentage of LDHs, in the case of the HG composite with encapsulated R1. The release rate obtained for the composite HG with encapsulated R1 presented an inverse tendency in relation to the water-retention capacity. This fact is due most probably to the compatibility between the RfL phytoextract and the HGs composite. The release rate of the RfL phytoextract in the case of the HG composites with encapsulated R2 and R3, showed the same tendency with the water-retention capacity. This fact is due most probably to the presence of ions, such as Al3+ and Ca2+, in the HG composite structure, that lead to the decrease in the existing attractions between the RfL phytoextract, the LDH particles, and the HGs composite [62,63,64].
As shown in Figure 9, from rheological behavior, the presence of the LDH-RfL in the hydrogel network led to a higher crosslinking degree of the network (G′ increased with the LDH-RfL concentration), making possible the reduction of the burst effect, similar to the literature data [9]. An important contribution to this release behavior can also be attributed to the hydrogen bonds formed between the -C=O group of PEGDA and the -OH functional groups of the phenolic compounds from RfL phytoextract. Additionally, the interactions between the cations from LDH and the electrons from the oxygen atom of the OH group or the aromatic ring of phenols [65,66] from the RfL phytoextract may also minimize the burst release.
Very important to notice is that many HG composites, such as HG(R1)10%, HG(R1)20%, and all HG with R3, not only do not display the burst release, but instead present a delayed release, meaning that the phytoextract release begins after a while. At the same time, the release of phytoextract from HG composites is slower than that from the LDHs. These facts clearly emphasize the synergistic effect of hydrogel and the LDH system on slow-release behavior. It can be concluded that the obtained HG composites are very promising as synergistic sustained drug-release systems due to their good control over the release of RfL phytoextract.
Table 4 lists the release data obtained by means of the four mathematical models described in Section 2.5. This study aims to offer a better understanding of RfL release mechanism from LDH particles and composite HGs. The parameters obtained were fitted to each model to determine k, R2, and n coefficients for each sample. For all the models studied, the Higuchi and Korsmeyer-Peppas (highest R2 values) models were found to be more suitable than the zero-order or first-order models. This classification clearly indicates that release is diffusion-controlled in all the cases. The kinetic description is characteristic to the low-molecular-weight compounds diffusing from porous matrices, such as composite HGs. The Korsmeyer-Peppas model considers the dissolution events and the swelling behavior that is characteristic of the proposed composite HGs. The Higuchi model does not account for any dissolution of the polymeric matrix and only allows for minor changes in the shape and size of the system. The low values for R2 for all mathematical models prove that, most probably, two different releasing mechanisms are involved for LDHs and for hydrogel and, so, the synergistic effect is explained.
Table 4 also gives the value of the parameter n. The calculated values for the results of drug-release exponents, for a cylindrical geometry, n, varies from 0.38 to 0.48 which implies Fickian diffusion mechanism, i.e., diffusion-controlled transport. That means that the diffusion rate in slab geometry decreases continuously with time, owing to the continuous decrease in the driving concentration gradient [67,68]. Individual graphs for zero-order, first-order, Higuchi, and Korsmeyer-Peppas models, for sample HG(R2)20%, are provided as Supplementary Data (Figure S5).

4. Conclusions

The study proved the noncovalent nature of the interactions between the phytoextract components, LDH and hydrogel. The study on thermal stability, performed in air, proved that the LDH and phytoextract components embedded in the hydrogel exhibit specific thermal degradation steps. The alteration of the intensities of XRD diffraction lines suggests that during the encapsulation in the hydrogel a dissolution–recrystallization process involving the LDHsRfL phase could take place. The surface of composite HGs with incorporated LDHs exhibits a less homogeneous and more agglomerated structure than that of samples with LDHsRfL, suggesting that the RfL phytoextract leads to an improvement in the dispersion of LDHs particles inside the polymeric network and that some intercalated structures could appear. Although it is well known that the presence of ions, such as Mg2+, Ca2+, and Al3+ in the hydrogel structure leads to a decrease in the swelling degree, in our case, the equilibrium swelling degree of the composite hydrogels increased in the presence of pristine LDHs and reconstructed LDHsRfL in the gel network. A more crosslinked structure of HG composites was formed by the addition of LDHs particles, which improved the mechanical properties. Studying the release of phytoextract from composite HGs with LDHRfL, no burst effect was observed and many such composites presented a delayed release, which underlined the synergistic effect of PEGDA network and LDH particles on the slow-release behavior. These findings can lead to an efficient slow-release system, at the intestine pH, for slow intestinal-transit treatment. Further studies on the interactions between the components of the systems, on the elements content (EDAX), on the stability at different temperatures and pH, on the biocompatibility, and animal studies are foreseen.

Supplementary Materials

The following supporting information can be downloaded at: https://www.mdpi.com/article/10.3390/pharmaceutics15071888/s1, Table S1. The parameters for the anthrones and derivatives (analytical reference substances) and Frangula cortex rich extract applied in the quantification experiments. Table S2. Phytochemical characterization of the Buckthorn bark and of the phytoextractobtainedby microwave-assisted extraction; Table S3. Chemical composition of LDH samples: metal content as determined by ICP-AES, weight loss at 450 °C for H1–H3 samples (WL450°C); weight gain for the samples reconstructed with RfL extractive solution (WG), Rfs content determined from UV analysis of the fresh RfL extractive solution and the solution recovered after the reconstruction; Figure S1 The aspect of pristine hydrogel and of composite hydrogels, Figure S2. The corresponding calibration curve obtained using standard RfL phytoextract solution with known concentrations; Table S4: Thermal behavior of investigated samples; Figure S3: Thermal analysis diagrams (black: TGA in %, blue: DTG in a.u. and red: DTA in volts per gram of sample) for all investigated samples categories as discussed in text: (i) as-prepared LDHs H1, H2, and H3; (ii) calcined LDHs C1, C2, and C3; (iii) LDHs reconstructed with RfL R1, R2, R3, and RfL; (iv) hydrogel HG and its composites with as-prepared LDHs HG(H1)20%, HG(H2)30%, HG(H3)30%, and (v) hydrogel composites with RfL-reconstructed LDHs HG(R1)20%, HG(R2)30%, and HG(R3)30%; Figure S4. SEM micrographs of lyophilized composite HGs: (a) control HG, (b–d) composites with LDHs without phytoextract, namely, (a) HG(H1)20%, (b) HG(H2)30%, (c) HG(H3)30%, and (e–g) HG composites with RfL phytoextract immobilized in the LDHs matrix, namely, (e) HG(R1)20%, (f) HG(R2)30%, and (g) HG(R3)30%, at different magnifications. Figure S5. The fitting of releasing experimental data by different mathematical models for sample HG(R2)20%.

Author Contributions

Conceptualization, A.S. and R.Z.; formal analysis, O.D.P., A.T., I.E.N. and S.V.D.; investigation, O.D.P., A.T., I.E.N. and S.V.D.; methodology, A.Z., C.E.Ț. and T.-V.I.; supervision, A.S. and R.Z.; visualization, T.-V.I.; writing—original draft, A.-L.N. and A.Z.; writing—review and editing, A.Z., O.D.P., A.T., I.E.N., S.V.D., C.E.Ț., T.-V.I., A.S. and R.Z. All authors have read and agreed to the published version of the manuscript.

Funding

This work was supported by the grants of the Ministry of Research, Innovation and Digitization, CCCDI-UEFISCDI, project number PN-III-P2-2.1-PED-2021-1870, within PNCDI III, grant number 646PED/2022—DUACTIVMER, and PN III-Human Resources Program—Young Research Teams—PN-III-P1-1.1-TE-2021-1239, grant number 144/2022–ANTISPIKE.

Institutional Review Board Statement

Not applicable.

Informed Consent Statement

Not applicable.

Data Availability Statement

The data presented in this study are available on request from the corresponding author.

Conflicts of Interest

The authors declare no conflict of interest.

References

  1. Mudshinge, S.R.; Deore, A.B.; Patil, S.; Bhalgat, C.M. Nanoparticles: Emerging Carriers for Drug Delivery. Saudi Pharm. J. 2011, 19, 129–141. [Google Scholar] [CrossRef] [PubMed] [Green Version]
  2. Nagaraj, V.; Sun, X.; Mehta, J.; Martin, M.; Ngo, T.; Dey, S. Synthesis, Characterization, and In Vitro Drug Delivery Capabilities of (Zn, Al)-Based Layered Double Hydroxide Nanoparticles. J. Nanotechnol. 2015, 2015, 350370. [Google Scholar] [CrossRef] [Green Version]
  3. Ameena Shirin, V.K.; Sankar, R.; Johnson, A.P.; Gangadharappa, H.V.; Pramod, K. Advanced Drug Delivery Applications of Layered Double Hydroxide. J. Control. Release 2021, 330, 398–426. [Google Scholar] [CrossRef] [PubMed]
  4. Cavallaro, G.; Lazzara, G.; Fakhrullin, R. Mesoporous Inorganic Nanoscale Particles for Drug Adsorption and Con-trolled Release. Ther. Deliv. 2018, 9, 287–301. [Google Scholar] [CrossRef] [PubMed]
  5. Luo, X.; Matranga, C.; Tan, S.; Alba, N.; Cui, X.T. Carbon Nanotube Nanoreservior for Controlled Release of An-ti-Inflammatory Dexamethasone. Biomaterials 2011, 32, 6316–6323. [Google Scholar] [CrossRef] [Green Version]
  6. Pauli, G.; Tang, W.-L.; Li, S.-D. Development and Characterization of the Solvent-Assisted Active Loading Technology (SALT) for Liposomal Loading of Poorly Water-Soluble Compounds. Pharmaceutics 2019, 11, 465. [Google Scholar] [CrossRef] [Green Version]
  7. Craparo, E.F.; Drago, S.E.; Costabile, G.; Ferraro, M.; Pace, E.; Scaffaro, R.; Ungaro, F.; Cavallaro, G. Sustained-Release Powders Based on Polymer Particles for Pulmonary Delivery of Beclomethasone Dipropionate in the Treatment of Lung Inflammation. Pharmaceutics 2023, 15, 1248. [Google Scholar] [CrossRef]
  8. Arrabito, G.; Bonasera, A.; Prestopino, G.; Orsini, A.; Mattoccia, A.; Martinelli, E.; Pignataro, B.; Medaglia, P.G. Layered Double Hydroxides: A Toolbox for Chemistry and Biology. Crystals 2019, 9, 361. [Google Scholar] [CrossRef] [Green Version]
  9. Pavlovic, M.; Szerlauth, A.; Muráth, S.; Varga, G.; Szilagyi, I. Surface Modification of Two-Dimensional Layered Double Hydroxide Nanoparticles with Biopolymers for Biomedical Applications. Adv. Drug Deliv. Rev. 2022, 191, 114590. [Google Scholar] [CrossRef]
  10. McNamara, K.; Tofail, S.A.M. Nanoparticles in Biomedical Applications. Adv. Phys. X 2017, 2, 54–88. [Google Scholar] [CrossRef]
  11. Ahmed, E.M. Hydrogel: Preparation, Characterization, and Applications: A Review. J. Adv. Res. 2015, 6, 105–121. [Google Scholar] [CrossRef] [PubMed] [Green Version]
  12. Vigata, M.; Meinert, C.; Hutmacher, D.W.; Bock, N. Hydrogels as Drug Delivery Systems: A Review of Current Char-acterization and Evaluation Techniques. Pharmaceutics 2020, 12, 1188. [Google Scholar] [CrossRef]
  13. Nairon, K.G.; DePalma, T.; Sivakumar, H.; Skardal, A. Tunable Hydrogel Systems for Delivery and Release of Cell-Secreted and Synthetic Therapeutic Products. In Controlled Drug Delivery Systems, 1st ed.; Opara, E., Ed.; CRC Press: Boca Raton, FL, USA, 2020; pp. 29–53. [Google Scholar]
  14. Naahidi, S.; Jafari, M.; Logan, M.; Wang, Y.; Yuan, Y.; Bae, H.; Dixon, B.; Chen, P. Biocompatibility of Hydrogel-Based Scaffolds for Tissue Engineering Applications. Biotechnol. Adv. 2017, 35, 530–544. [Google Scholar] [CrossRef] [PubMed]
  15. Loessner, D.; Meinert, C.; Kaemmerer, E.; Martine, L.C.; Yue, K.; Levett, P.A.; Klein, T.J.; Melchels, F.P.W.; Khademhosseini, A.; Hutmacher, D.W. Functionalization, Preparation and Use of Cell-Laden Gelatin Methacrylo-yl–Based Hydrogels as Modular Tissue Culture Platforms. Nat. Protoc. 2016, 11, 727–746. [Google Scholar] [CrossRef] [Green Version]
  16. Li, J.; Mooney, D.J. Designing Hydrogels for Controlled Drug Delivery. Nat. Rev. Mater. 2016, 1, 16071. [Google Scholar] [CrossRef] [PubMed]
  17. Bayat, M.R.; Baghani, M. A review on swelling theories of pH-sensitive hydrogels. J. Intell. Mat. Syst. Struct. 2021, 32. [Google Scholar] [CrossRef]
  18. García-Fernández, L.; Olmeda-Lozano, M.; Benito-Garzón, L.; Pérez-Caballer, A.; San Román, J.; Vázquez-Lasa, B. In-jectable Hydrogel-Based Drug Delivery System for Cartilage Regeneration. Mater. Sci. Eng. C 2020, 110, 110702. [Google Scholar] [CrossRef]
  19. Spatarelu, C.P.; (Radu) Chiriac, A.-L.; Cursaru, B.; Iordache, T.-V.; Gavrila, A.-M.; Cojocaru, C.-T.; Botez, R.-E.; Trica, B.; Sarbu, A.; Teodorescu, M.; et al. Composite Nanogels Based on Zeolite-Poly(Ethylene Glycol) Diacrylate for Controlled Drug Delivery. Nanomaterials 2020, 10, 195. [Google Scholar] [CrossRef] [Green Version]
  20. Zhang, H.; Zou, K.; Guo, S.; Duan, X. Nanostructural Drug-Inorganic Clay Composites: Structure, Thermal Property and in Vitro Release of Captopril-Intercalated Mg Al-Layered Double Hydroxides. J. Solid State Chem. 2006, 179, 1792–1801. [Google Scholar] [CrossRef]
  21. Mohanambe, L.; Vasudevan, S. Anionic Clays Containing Anti-Inflammatory Drug Molecules: Comparison of Mo-lecular Dynamics Simulation and Measurements. J. Phys. Chem. B 2005, 109, 15651–15658. [Google Scholar] [CrossRef]
  22. Chiriac, A.-L.; Gavrila, A.-M.; Cursaru, B.; Spatarelu, C.; Sandu, T.; Sarbu, A.; Teodorescu, M.; Perrin, F.; Nicolescu (Iordache), T.-V.; Zaharia (Lungu), A. Poly(Ethylene Glycol) Diacrylate-Nanogels Synthesized by Mini-Emulsion Polymer-ization. Mater. Plast. 2019, 56, 514–519. [Google Scholar] [CrossRef]
  23. Neblea, E.-I.; Gavrila, A.-M.; Iordache, T.-V.; Zaharia, A.; Stanescu, P.; Radu, I.-C.; Burlacu, S.; Neagu, G.; Chiriac, A.-L.; Sarbu, A. Interpenetrating Networks of Bacterial Cellulose and Poly (Ethylene Glycol) Diacrylate as Potential Cephalexin Carriers in Wound Therapy. J. Polym. Res. 2022, 29, 406. [Google Scholar] [CrossRef]
  24. Sârbu, A.; Zaharia, A.; Radu, A.L.; Iancu, S.; Stoica, A.; Stroescu, M.C.; Tebrencu, C.; Ionescu, E.; Sandu, T.; Apostol, S. Process for Obtaining Hybrid Hydrogels Containing Bioactive Phytoextracts. Patent RO 132253, 29 November 2021. [Google Scholar]
  25. Council of Europe. European Pharmacopoeia, 8th ed.; Council of Europe: Strasbourg, France, 2007; Volume 2, pp. 1949–1951. ISBN 978-92-871-7525-0. [Google Scholar]
  26. Chapter VIII “Frangula bark”. In Romanian Pharmacopoeia, 10th ed.; EdituraMedicala: Bucharest, Romania, 2000; p. 427.
  27. Chapter 6.8 “Frangulae cortex”. In European Pharmacopoeia, 6th ed.; Council of Europe: Strasbourg, France, 2008; p. 1516.
  28. Wagner, H.; Bladt, S. Plant Drug Analysis:A Thin Layer Chromatography Atlas, 2nd ed.; Springer: Dordrecht, The Netherlands; New York, NY, USA, 2009. [Google Scholar]
  29. Reich, E.; Schibli, A. High-Performance Thin-Layer Chromatography for the Analysis of Medicinal Plants, 1st ed.; Thieme: New York, NY, USA, 2007. [Google Scholar]
  30. Ainsworth, E.A.; Gillespie, K.M. Estimation of total phenolic content and other oxidation substrates in plant tissues using Folin-Ciocalteu reagent. Nat. Protoc. 2007, 2, 875–877. [Google Scholar] [CrossRef]
  31. Everette, J.D.; Bryant, Q.M.; Green, A.M.; Abbey, Y.A.; Wanglia, G.W.; Walker, R.B. Thorough study of reactivity of various classes toward the Folin-Ciocalteu reagent. J. Agr. Food Chem. 2010, 58, 8139–8181. [Google Scholar] [CrossRef] [PubMed] [Green Version]
  32. Wiesneth, S.; Jürgenliemk, G. Total phenolic and tannins determination: A modification of Ph. Eur. 2.8. 14 for higher throughput. Die Pharm. Int. J. Pharm. Sci. 2017, 72, 195–196. [Google Scholar] [CrossRef]
  33. EMA (European Medicines Agency). Assessment Report on Rhamnus frangula L. cortex.EMA/HMPC/483550/2018. Committee on Herbal Medicinal Products (HMPC). 2019. Available online: www.ema.europa.eu/contact (accessed on 20 January 2023).
  34. Paneitz, A.; Westendorf, J. Anthranoid contents of rhubarb (Rheum undulatum L.) and other Rheum species and their toxicological relevance. Eur. Food Res. Techn. 1999, 210, 97–101. [Google Scholar] [CrossRef]
  35. Rauwald, H.D. Chapter 9: Herbal Laxatives: Influence of Anthrones—Anthraquinones on Energy Metabolism and Ion Transport in a Model System. In Phytomedicines of Europe; ACS Symposium Series; ACS Publications: New York, NY, USA, 1998; pp. 97–116. [Google Scholar] [CrossRef]
  36. Pavel, O.D.; Şerban, A.; Zăvoianu, R.; Bacalum, E.; Bîrjega, R. Curcumin Incorporation into Zn3Al Layered Double Hydroxides—Preparation, Characterization and Curcumin Release. Crystals 2020, 10, 244. [Google Scholar] [CrossRef] [Green Version]
  37. Teodorescu, M.; Lungu, A.; Stanescu, P.O. Constantin Neamţu Preparation and Properties of Novel Slow-Release NPK Agrochemical Formulations Based on Poly(Acrylic Acid) Hydrogels and Liquid Fertilizers. Ind. Eng. Chem. Res. 2009, 48, 6527–6534. [Google Scholar] [CrossRef]
  38. Cursaru, B.; Radu, A.-L.; Perrin, F.-X.; Sarbu, A.; Teodorescu, M.; Gavrilă, A.-M.; Damian, C.-M.; Sandu, T.; Iordache, T.-V.; Zaharia, A. Poly(Ethylene Glycol) Composite Hydrogels with Natural Zeolite as Filler for Controlled Delivery Applications. Macromol. Res. 2020, 28, 211–220. [Google Scholar] [CrossRef]
  39. Flores-Cano, D.A.; Checca-Huaman, N.-R.; Castro-Merino, I.-L.; Pinotti, C.N.; Passamani, E.C.; Litterst, F.J.; Ramos-Guivar, J.A. Progress toward Room-Temperature Synthesis and Functionalization of Iron-Oxide Nanoparticles. Int. J. Mol. Sci. 2022, 23, 8279. [Google Scholar] [CrossRef]
  40. Pálinkó, I.; Sipos, P.; Berkesi, O.; Varga, G. Distinguishing Anionic Species That Are Intercalated in Layered Double Hydroxides from Those Bound to Their Surface: A Comparative IR Study. J. Phys. Chem. C 2022, 126, 15254–15262. [Google Scholar] [CrossRef]
  41. Štěpán, V.; Vodehnal, J. Preparation and Infrared Spectra of Anthraquinone and Its Methyl Derivatives and of Quinones Related to Polynuclear Aromatic Hydrocarbons. Collect. Czech. Chem. Commun. 1971, 36, 3964–3979. [Google Scholar] [CrossRef]
  42. Lesiak, B.; Rangam, N.; Jiricek, P.; Gordeev, I.; Tóth, J.; Kövér, L.; Mohai, M.; Borowicz, P. Surface Study of Fe3O4 Nanoparticles Functionalized with Biocompatible Adsorbed Molecules. Front. Chem. 2019, 7, 642. [Google Scholar] [CrossRef] [PubMed] [Green Version]
  43. Heriyanto, H.; Heraldy, E.; Nugrahaningtyas, K.D. X-RAY Diffraction and Fourier Transform Infrared Study of Ca-Mg-Al Hydrotalcite from Artificial Brine Water with Synthesis Hydrothermal Treatments. IOP Conf. Ser. Mater. Sci. Eng. 2018, 333, 012006. [Google Scholar] [CrossRef]
  44. Joseph, T.; Varghese, H.T.; Panicker, C.Y.; Thiemann, T.; Viswanathan, K.; Van Alsenoy, C. Infrared and Raman Spectroscopic Analysis and Theoretical Computation of the First Hyperpolarizability of a Monoarylated Anthraqui-none, 1-(4-Methoxyphenyl)-4-Methylanthraquinone. J. Mol. Struct. 2011, 1005, 17–24. [Google Scholar] [CrossRef]
  45. Strens, R.G.J.; Wood, B.J. Diffuse Reflectance Spectra and Optical Properties of Some Iron and Titanium Oxides and Oxyhydroxides. Mineral. Mag. 1979, 43, 347–354. [Google Scholar] [CrossRef] [Green Version]
  46. Sherman, D.M.; Waite, T.D. Electronic Spectra of Fe3+ Oxides and Oxide Hydroxides in the near IR to near UV. Am. Min. 1985, 70, 1262–1269. [Google Scholar]
  47. Sherman, D.M. The Electronic Structures of Fe3+ Coordination Sites in Iron Oxides: Applications to Spectra, Bonding, and Magnetism. Phys. Chem. Miner. 1985, 12, 161–175. [Google Scholar] [CrossRef]
  48. Scheinost, A.C.; Schulze, D.G.; Schwertmann, U. Diffuse Reflectance Spectra of Al Substituted Goethite: A Ligand Field Approach. Clays Clay Miner. 1999, 47, 156–164. [Google Scholar] [CrossRef]
  49. Scott, A.I. Chapter 8—Application of spectral data to investigation of gross molecular structure. In Interpretation of the Ultraviolet Spectra of Natural Products; Scott, A.I., Ed.; International Series of Monographs on Organic Chemistry: Pergamon, Greek, 1964; pp. 228–312. ISBN 978-0-08-013615-8. [Google Scholar]
  50. Hájek, M.; Kocík, J.; Frolich, K.; Vávra, A. Mg-Fe Mixed Oxides and Their Rehydrated Mixed Oxides as Catalysts for Transesterification. J. Clean. Prod. 2017, 161, 1423–1431. [Google Scholar] [CrossRef]
  51. Browning, M.B.; Cereceres, S.N.; Luong, P.T.; Cosgriff-Hernandez, E.M. Determination of the In Vivo Degradation Mechanism of PEGDA Hydrogels. J. Biomed. Mater. Res. A 2014, 102, 4244–4251. [Google Scholar] [CrossRef] [Green Version]
  52. Royer, A.; Barriere, T.; Gelin, J.C. The Degradation of Poly(Ethylene Glycol) in an Inconel 718 Feedstock in the Metal Injection Moulding Process. Powder Technol. 2015, 284, 467–474. [Google Scholar] [CrossRef]
  53. Murakami, T.; Kasai, E. Reduction Mechanism of Iron Oxide–Carbon Composite with Polyethylene at Lower Temperature. ISIJ Int. 2011, 51, 9–13. [Google Scholar] [CrossRef] [Green Version]
  54. Spreitzer, D.; Schenk, J. Reduction of Iron Oxides with Hydrogen—A Review. Steel Res. Int. 2019, 90, 1900108. [Google Scholar] [CrossRef] [Green Version]
  55. Nia, S.; Pooresmaeil, M.; Namazi, H. Carboxymethylcellulose/Layered Double Hydroxides Bio-Nanocomposite Hydrogel: A Controlled Amoxicillin Nanocarrier for Colonic Bacterial Infections Treatment. Int. J. Biol. Macromol. 2020, 155, 1401–1409. [Google Scholar] [CrossRef]
  56. Zhang, Y.-T.; Fan, L.-H.; Zhi, T.-T.; Zhang, L.; Huang, H.; Chen, H.-L. Synthesis and Characterization of Poly(Acrylic Acid-Co-Acrylamide)/Hydrotalcite Nanocomposite Hydrogels for Carbonic Anhydrase Immobilization. J. Polym. Sci. Part A Polym. Chem. 2009, 47, 3232–3240. [Google Scholar] [CrossRef]
  57. Lee, W.-F.; Chen, Y.-C. Effects of Intercalated Hydrotalcite on Drug Release Behavior for Poly(Acrylic Ac-id-Co-N-Isopropyl Acrylamide)/Intercalated Hydrotalcite Hydrogels. Eur. Polym. J. 2006, 42, 1634–1642. [Google Scholar] [CrossRef]
  58. Shivakumara, L.R.; Demappa, T. Synthesis and Swelling Behavior of Sodium Alginate/Poly(Vinyl Alcohol) Hydrogels. Turk. J. Pharm. Sci. 2019, 16, 252–260. [Google Scholar] [CrossRef]
  59. Patel, S.K.; Malone, S.; Cohen, C.; Gillmor, J.R.; Colby, R.H. Elastic Modulus and Equilibrium Swelling of Poly(Dimethylsiloxane) Networks. Macromolecules 1992, 25, 5241–5251. [Google Scholar] [CrossRef]
  60. Ninciuleanu, C.M.; Ianchiș, R.; Alexandrescu, E.; Mihăescu, C.I.; Burlacu, S.; Trică, B.; Nistor, C.L.; Preda, S.; Scomoroscenco, C.; Gîfu, C.; et al. Adjusting Some Properties of Poly(Methacrylic Acid) (Nano)Composite Hydrogels by Means of Silicon-Containing Inorganic Fillers. Int. J. Mol. Sci. 2022, 23, 10320. [Google Scholar] [CrossRef]
  61. Jeung, D.-G.; Kim, H.-J.; Oh, J.-M. Incorporation of Glycine Max Merrill Extract into Layered Double Hydroxide through Ion-Exchange and Reconstruction. Nanomaterials 2019, 9, 1262. [Google Scholar] [CrossRef] [PubMed] [Green Version]
  62. Lee, W.-F.; Lee, S.-C. Effect of Hydrotalcite on the Swelling and Mechanical Behaviors for the Hybrid Nano-composite Hydrogels Based on Gelatin and Hydrotalcite. J. Appl. Polym. Sci. 2006, 100, 500–507. [Google Scholar] [CrossRef]
  63. Rizzo, S.; Zingale, E.; Romeo, A.; Lombardo, R.; Pignatello, R. Colon Delivery of Nutraceutical Ingredients by Food-Grade Polymeric Systems: An Overview of Technological Characterization and Biological Evaluation. Appl. Sci. 2023, 13, 5443. [Google Scholar] [CrossRef]
  64. Rojas, R.; Mosconi, G.; Zanin, J.P.; Gil, G.A. Layered double hydroxide applications in biomedical implants. App. Clay Sci. 2022, 224, 106514. [Google Scholar] [CrossRef]
  65. Bhattarai, N.; Gunn, J.; Zhang, M. Chitosan-based hydrogels for controlled, localized drug delivery. Adv. Drug Deliv. Rev. 2010, 62, 83–99. [Google Scholar] [CrossRef]
  66. Tilman, B. Spectroscopic and kinetic study of the alkylation of phenol with dimethyl carbonate over NaX zeolite. J. Chem. Soc. Faraday Trans. 1998, 94, 985–993. [Google Scholar] [CrossRef]
  67. Peppas, N.A.; Brannon-Peppas, L. Water Diffusion and Sorption in Amorphous Macromolecular Systems and Foods. J. Food Eng. 1994, 22, 189–210. [Google Scholar] [CrossRef]
  68. Ghosal, K.; Chandra, A.; Rajabalaya, R.; Chakraborty, S.; Nanda, A. Mathematical modeling of drug release profiles for modified hydrophobic HPMC based gels. Pharmazie 2012, 67, 147–155. [Google Scholar] [CrossRef]
Figure 1. Synthesis process of the PEGDA composite hydrogels containing RfL phytoextract immobilized in the layered double hydroxide matrix.
Pharmaceutics 15 01888 g001
Figure 2. ATR-FTIR spectra of the as-prepared (before calcinations) pristine LDHs: H1, H2, and H3 and the dried phytocomplex Rfs (A), the spectra of sample R1 containing RfL phytocomplex immobilized by reconstruction in H1 matrix and the hydrogel-encapsulated HG(R1) samples with different concentrations of R1—10% and20% compared to the dried HG (B); the spectra of sample R2 containing RfL phytocomplex immobilized by reconstruction in H2 matrix and the hydrogel-encapsulated HG(R2) samples with different concentrations of R2—10%, 20%, and 30% (C); the spectra of the sample R3 containing RfL phytocomplex immobilized by reconstruction in H3 matrix and the hydrogel-encapsulated HG(R3) samples with different concentrations of R3 (10%, 20%, and 30%) (D).
Pharmaceutics 15 01888 g002
Figure 3. Five-fold amplified ATR-FTIR spectra of the sample R1 containing RfL phytocomplex immobilized by reconstruction in H1 matrix and the hydrogel-encapsulated HG(R1) samples with different concentrations of R1 (10% and 20%) compared to the dried HG (A); the spectra of sample R2 containing RfL phytocomplex immobilized by reconstruction in H2 matrix and the hydrogel-encapsulated HG(R2) samples with different concentrations of R2—10%, 20%, and 30% (B); the spectra of the sample R3 containing RfL phytocomplex immobilized by reconstruction in H3 matrix and the hydrogel-encapsulated HG(R3) samples with different concentrations of R3—10%, 20%, and 30% (C).
Pharmaceutics 15 01888 g003
Figure 4. DR-UV-Vis spectra of the as-prepared (before calcinations) pristine LDHs: H1, H2, and H3 (A), the spectra of sample R1 containing RfL phytoextract immobilized by reconstruction in H1 matrix and the hydrogel-encapsulated HG(R1) samples with different concentrations of R1—10% and 20% compared to the dried RfL phytoextract (Rfs) and dried HG (B); the spectra of sample R2 containing RfL phytoextract immobilized by reconstruction in H2 matrix and the hydrogel-encapsulated HG(R2) samples with different concentrations of R2—10%, 20%, and 30% compared toRfL and dried HG (C); the spectra of the sample R3 containing RfL phytoextract immobilized by reconstruction in H3 matrix and the hydrogel-encapsulated HG(R3) samples with different concentrations of R3—10%, 20%, and 30% compared to Rfs and dried HG (D).
Pharmaceutics 15 01888 g004
Figure 5. XRD patterns of the pristine LDHs (A), the reconstructed samples containing RfL phytoextract (B) and the hydrogel-encapsulated RfL phytoextract immobilized in LDH matrix (C); inset in (C)—the XRD pattern of the neat hydrogel (HG); abbreviations: (C)—calcite; G—goethite; H—hematite; Mgh—maghemite.
Pharmaceutics 15 01888 g005
Figure 6. SEM micrographs of lyophilized composites HG. (A) control HG; (B) composite HG with LDHs—HG(H1)20%; (C) and composite HG with RfL Phytocomplex immobilized in the LDHs matrix- HG(R1)20%.
Pharmaceutics 15 01888 g006
Figure 7. SEM micrographs of lyophilized composite HGs: (AC) composites with LDHs without phytoextract, namely: (A) HG(H1)20%, (B) HG(H2)30%, (C) HG(H3)30% and HG composites with RfL phytoextract immobilized in the LDHs matrix, namely: (D) HG(R1)20%, (E) HG(R2)30%, and (F) HG(R3)30%.
Pharmaceutics 15 01888 g007
Figure 8. Equilibrium swelling degrees of the synthesized HG composites: (A) HG composites containing pristine LDH; and (B) HG composites containing RfL phytoextract immobilized in the LDH matrix.
Pharmaceutics 15 01888 g008
Figure 9. Viscoelastic properties determined through frequency sweep measurements for the composite HGs containing pristine LDH (A) and containing RfL phytoextract immobilized in the LDH matrix (B).
Pharmaceutics 15 01888 g009
Figure 10. The release profile of RfL phytoextract (A) from composite HGs containing pristine LDH and (B) from composites HGs containing RfL phytoextract immobilized in the LDH matrix; over 24 h.
Pharmaceutics 15 01888 g010
Table 1. The sample code, the cationic composition, and the amounts of materials used for the synthesis of the obtained HGs composites.
Sample
Code
Cationic Composition
of LDHs
PEGDA
(g)
TMEDA
(g)
APS
(g)
LDHs
(g)
LDHsRfL
(g)
DW
(g)
HG00.50.006450.01--4.99
HG (H1)10%Mg, Fe0.50.006450.010.05-4.99
HG (H1)20%Mg, Fe0.50.006450.010.1-4.99
HG (H2)10%Mg, Fe, Al0.50.006450.010.05-4.99
HG (H2)20%Mg, Fe, Al0.50.006450.010.1-4.99
HG (H2)30%Mg, Fe, Al0.50.006450.010.15-4.99
HG (H3)10%Mg, Ca, Fe, Al0.50.006450.010.05-4.99
HG (H3)20%Mg, Ca, Fe, Al0.50.006450.010.1-4.99
HG (H3)30%Mg, Ca, Fe, Al0.50.006450.010.15-4.99
HG (R1)10%Mg, Fe0.50.006450.01-0.054.99
HG (R1)20%Mg, Fe0.50.006450.01-0.14.99
HG (R2)10%Mg, Fe, Al0.50.006450.01-0.054.99
HG (R2)20%Mg, Fe, Al0.50.006450.01-0.14.99
HG (R2)30%Mg, Fe, Al0.50.006450.01-0.154.99
HG (R3)10%Mg, Ca, Fe, Al0.50.006450.01-0.054.99
HG (R3)20%Mg, Ca, Fe, Al0.50.006450.01-0.14.99
HG (R3)30%Mg, Ca, Fe, Al0.50.006450.01-0.154.99
Table 2. Thermal behavior of investigated samples (RT = room temperature).
SampleTi—Tf (°C)
Δm (%)
Ti—Tf (°C)
Δm (%)
Ti—Tf (°C)
Δm (%)
Ti—Tf (°C)
Δm (%)
H1RT–209
−11.41%
209–500
−22.42%
500–569
−5.01%
-
H2RT–223
−13.20%
223–494
−22.71%
494–543
−2.79%
-
H3RT–231
−14.00%
223–550
−19.74%
664–773
−2.92%
-
C1RT–500
−2.4%
500–784
−1.25%
--
C2RT–500
−3.2%
500–784
−1.65%
--
C3RT–500
−2.5%
500–784
−5.75%
--
R1RT–198
−6.50%
198–560
−16.98%
--
R2RT–213
−11.57%
213–552
−22.34%
--
R3RT–214
−10.62%
214–556
−18.6%
656–773
−2.66%
-
RfL Dried
Extract
RT–184
−5.83%
184–325
−31.85%
325–652
−61.35%
-
HGRT–160
+1.37%
160–291
−34.79%
291–480
−53.6%
480–565
−8.46%
HG(H1)20%RT–170
−1.04%
170–370
−26.39%
370–427
−42.22%
427–525
−15.29%
HG(H2)30%RT–167
−1.2%
167–360
−29.44%
360–425
−40.46%
425–525
−15.02%
HG(H3)30%RT–169
−1.77%
169–360
−48.45%
360–424
−22.99%
424–506
−11.89%
HG(R1)20%RT–200
−3.12%
200–352
−38.75%
352–411
−22.47%
411–526
−17.24%
HG(R2)30%RT–190
−1.24%
190–354
−41.23%
354–422
−30.4%
422–523
−15.33%
HG(R3)30%RT–188
−2.68%
188–355
−34.1%
355–424
−32.76%
424–522
−15.03%
Table 3. Lattice parameters of the LDH phases in the investigated samples.
Sampleα
(Å)
χ
(Å)
H13.04322.997
H23.08322.992
H33.08122.636
R12.96023.084
R23.01724.056
R33.04823.057
HG(R1)20%2.95524.218
HG(R2)30%3.01324.971
HG(R3)30%3.01025.325
Table 4. Fitted parameters of the kinetic models used in the RfL release from composite HGs.
SampleZero-OrderFirst-OrderHiguchiKorsmeyer-Peppas
k0, μg/mLR2k1, min−1R2kH, µg/mL·min−1/2R2knR2
R10.7010.5650.0260.3056.2410.7453.3580.4640.760
R20.3900.8060.0220.6413.5170.8773.6730.4200.824
R3---------
HG(R1)10%0.3380.7600.0200.63.0590.833.6540.3870.787
HG(R1)20%0.3200.8580.0210.7192.9140.9063.7430.4050.844
HG(R2)10%0.6080.5150.0260.2865.4910.6983.4110.4720.745
HG(R2)20%0.6280.5340.0270.2925.6400.7163.4160.4780.751
HG(R2)30%0.7140.6020.0280.3256.2810.7753.4010.4840.779
HG(R3)10%---------
HG(R3)20%0.2730.8130.0190.672.5010.8673.7170.3680.808
HG(R3)30%---------
Disclaimer/Publisher’s Note: The statements, opinions and data contained in all publications are solely those of the individual author(s) and contributor(s) and not of MDPI and/or the editor(s). MDPI and/or the editor(s) disclaim responsibility for any injury to people or property resulting from any ideas, methods, instructions or products referred to in the content.

