
Corneal Permeability and Uptake of Twenty-Five Drugs: Species Comparison and Quantitative Structure–Permeability Relationships

 and
and
Abstract
:
1. Introduction
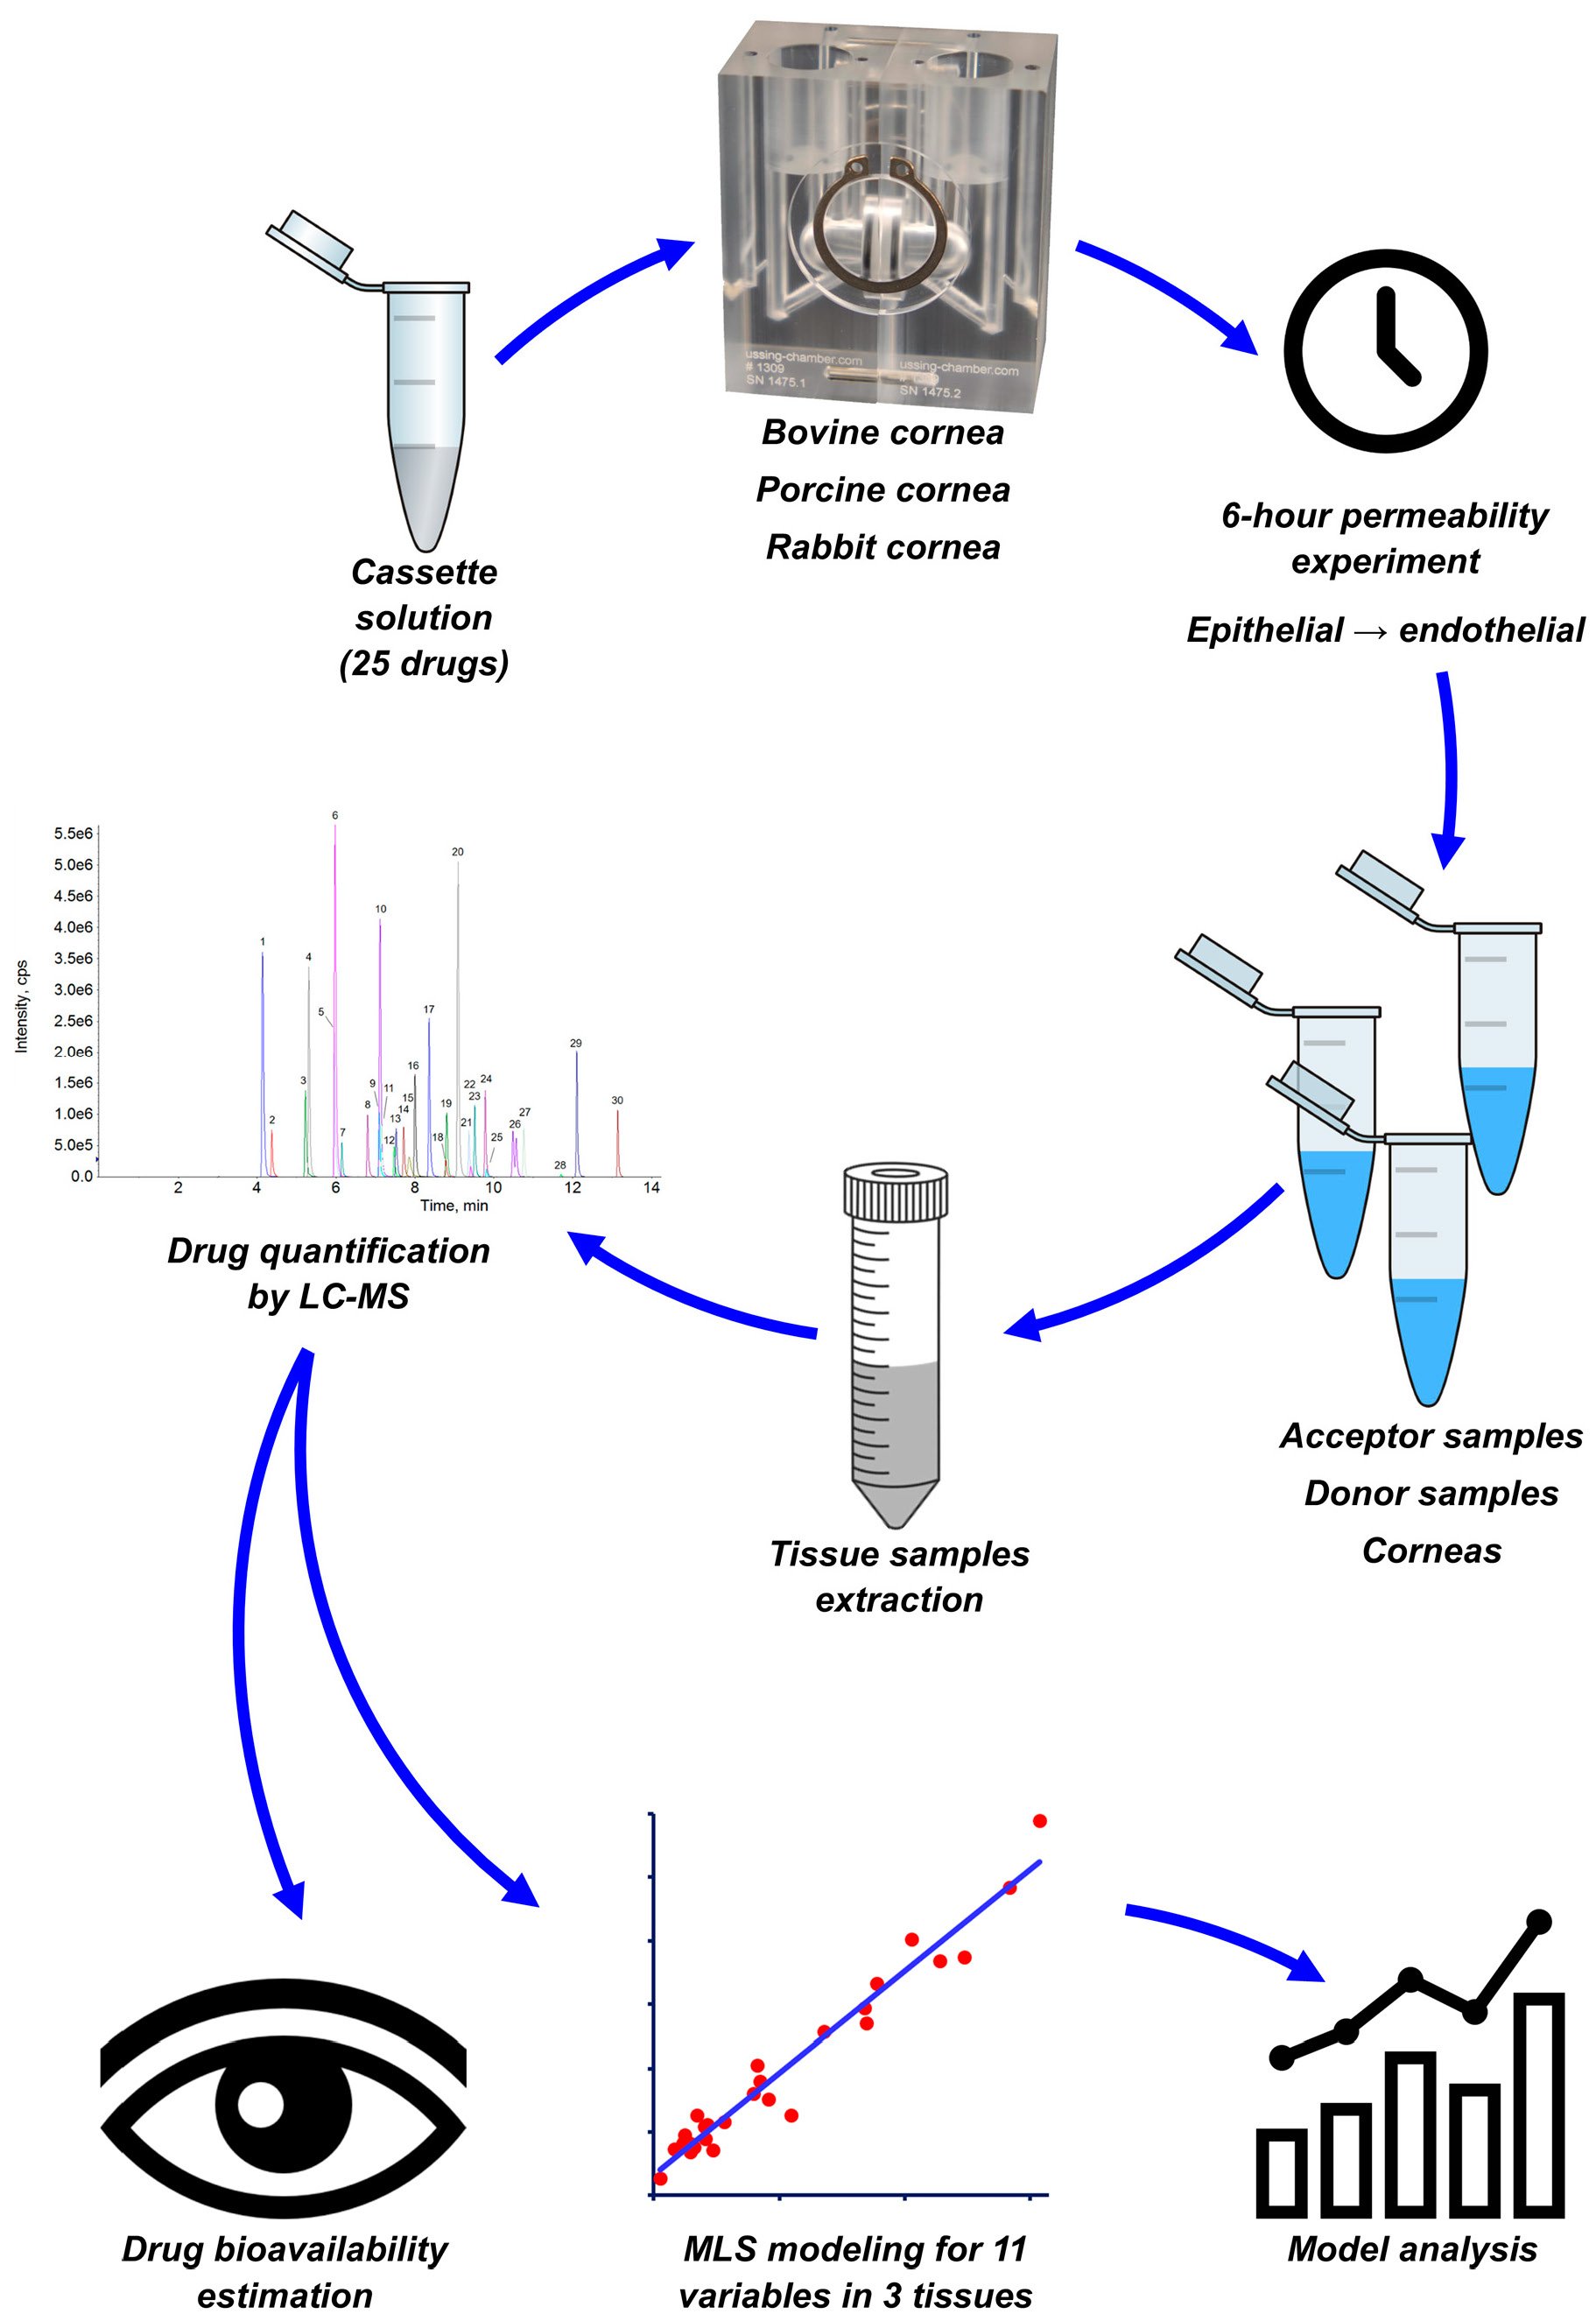
2. Materials and Methods
2.1. Chemicals
2.2. Dosing Solution Preparation
2.3. Tissue Preparation
2.4. Test Conditions
2.5. Permeability Evaluation
2.6. Drug Extraction
2.7. LC-MS/MS Analysis
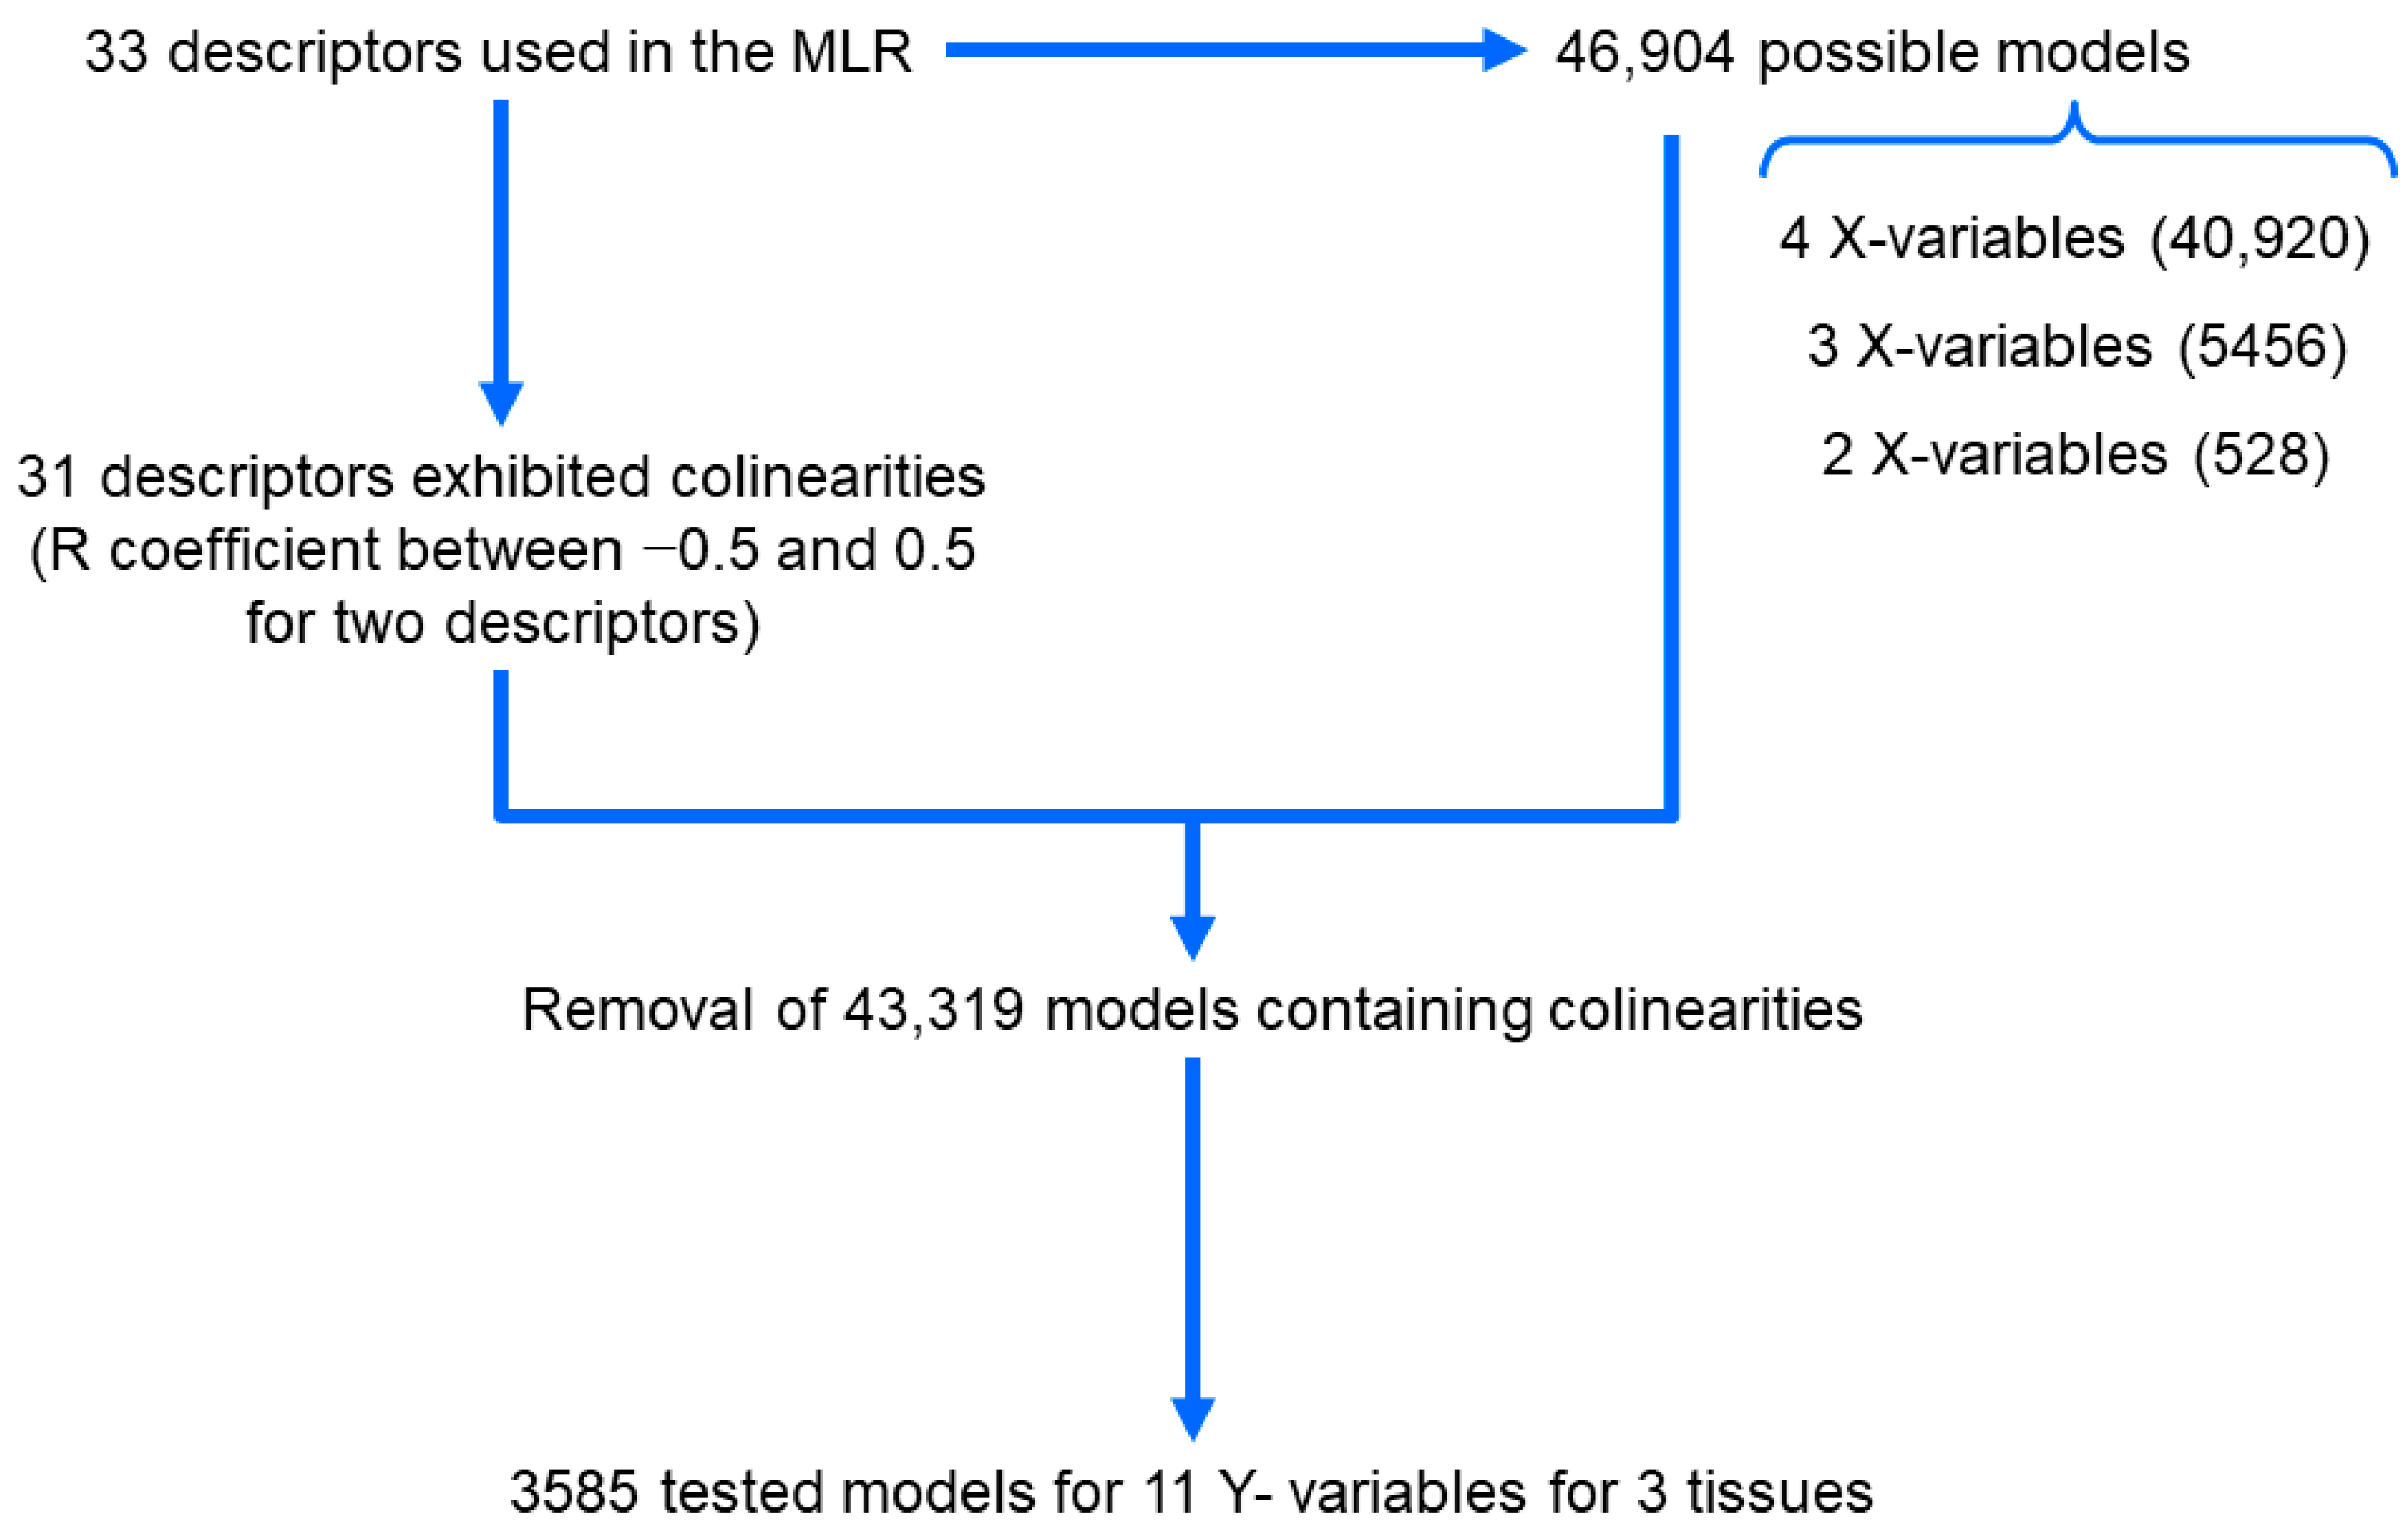
2.8. Multiple Linear Regression (MLR) Modelling
2.9. Bioavailability Estimation
2.10. Statistical Analysis
3. Results
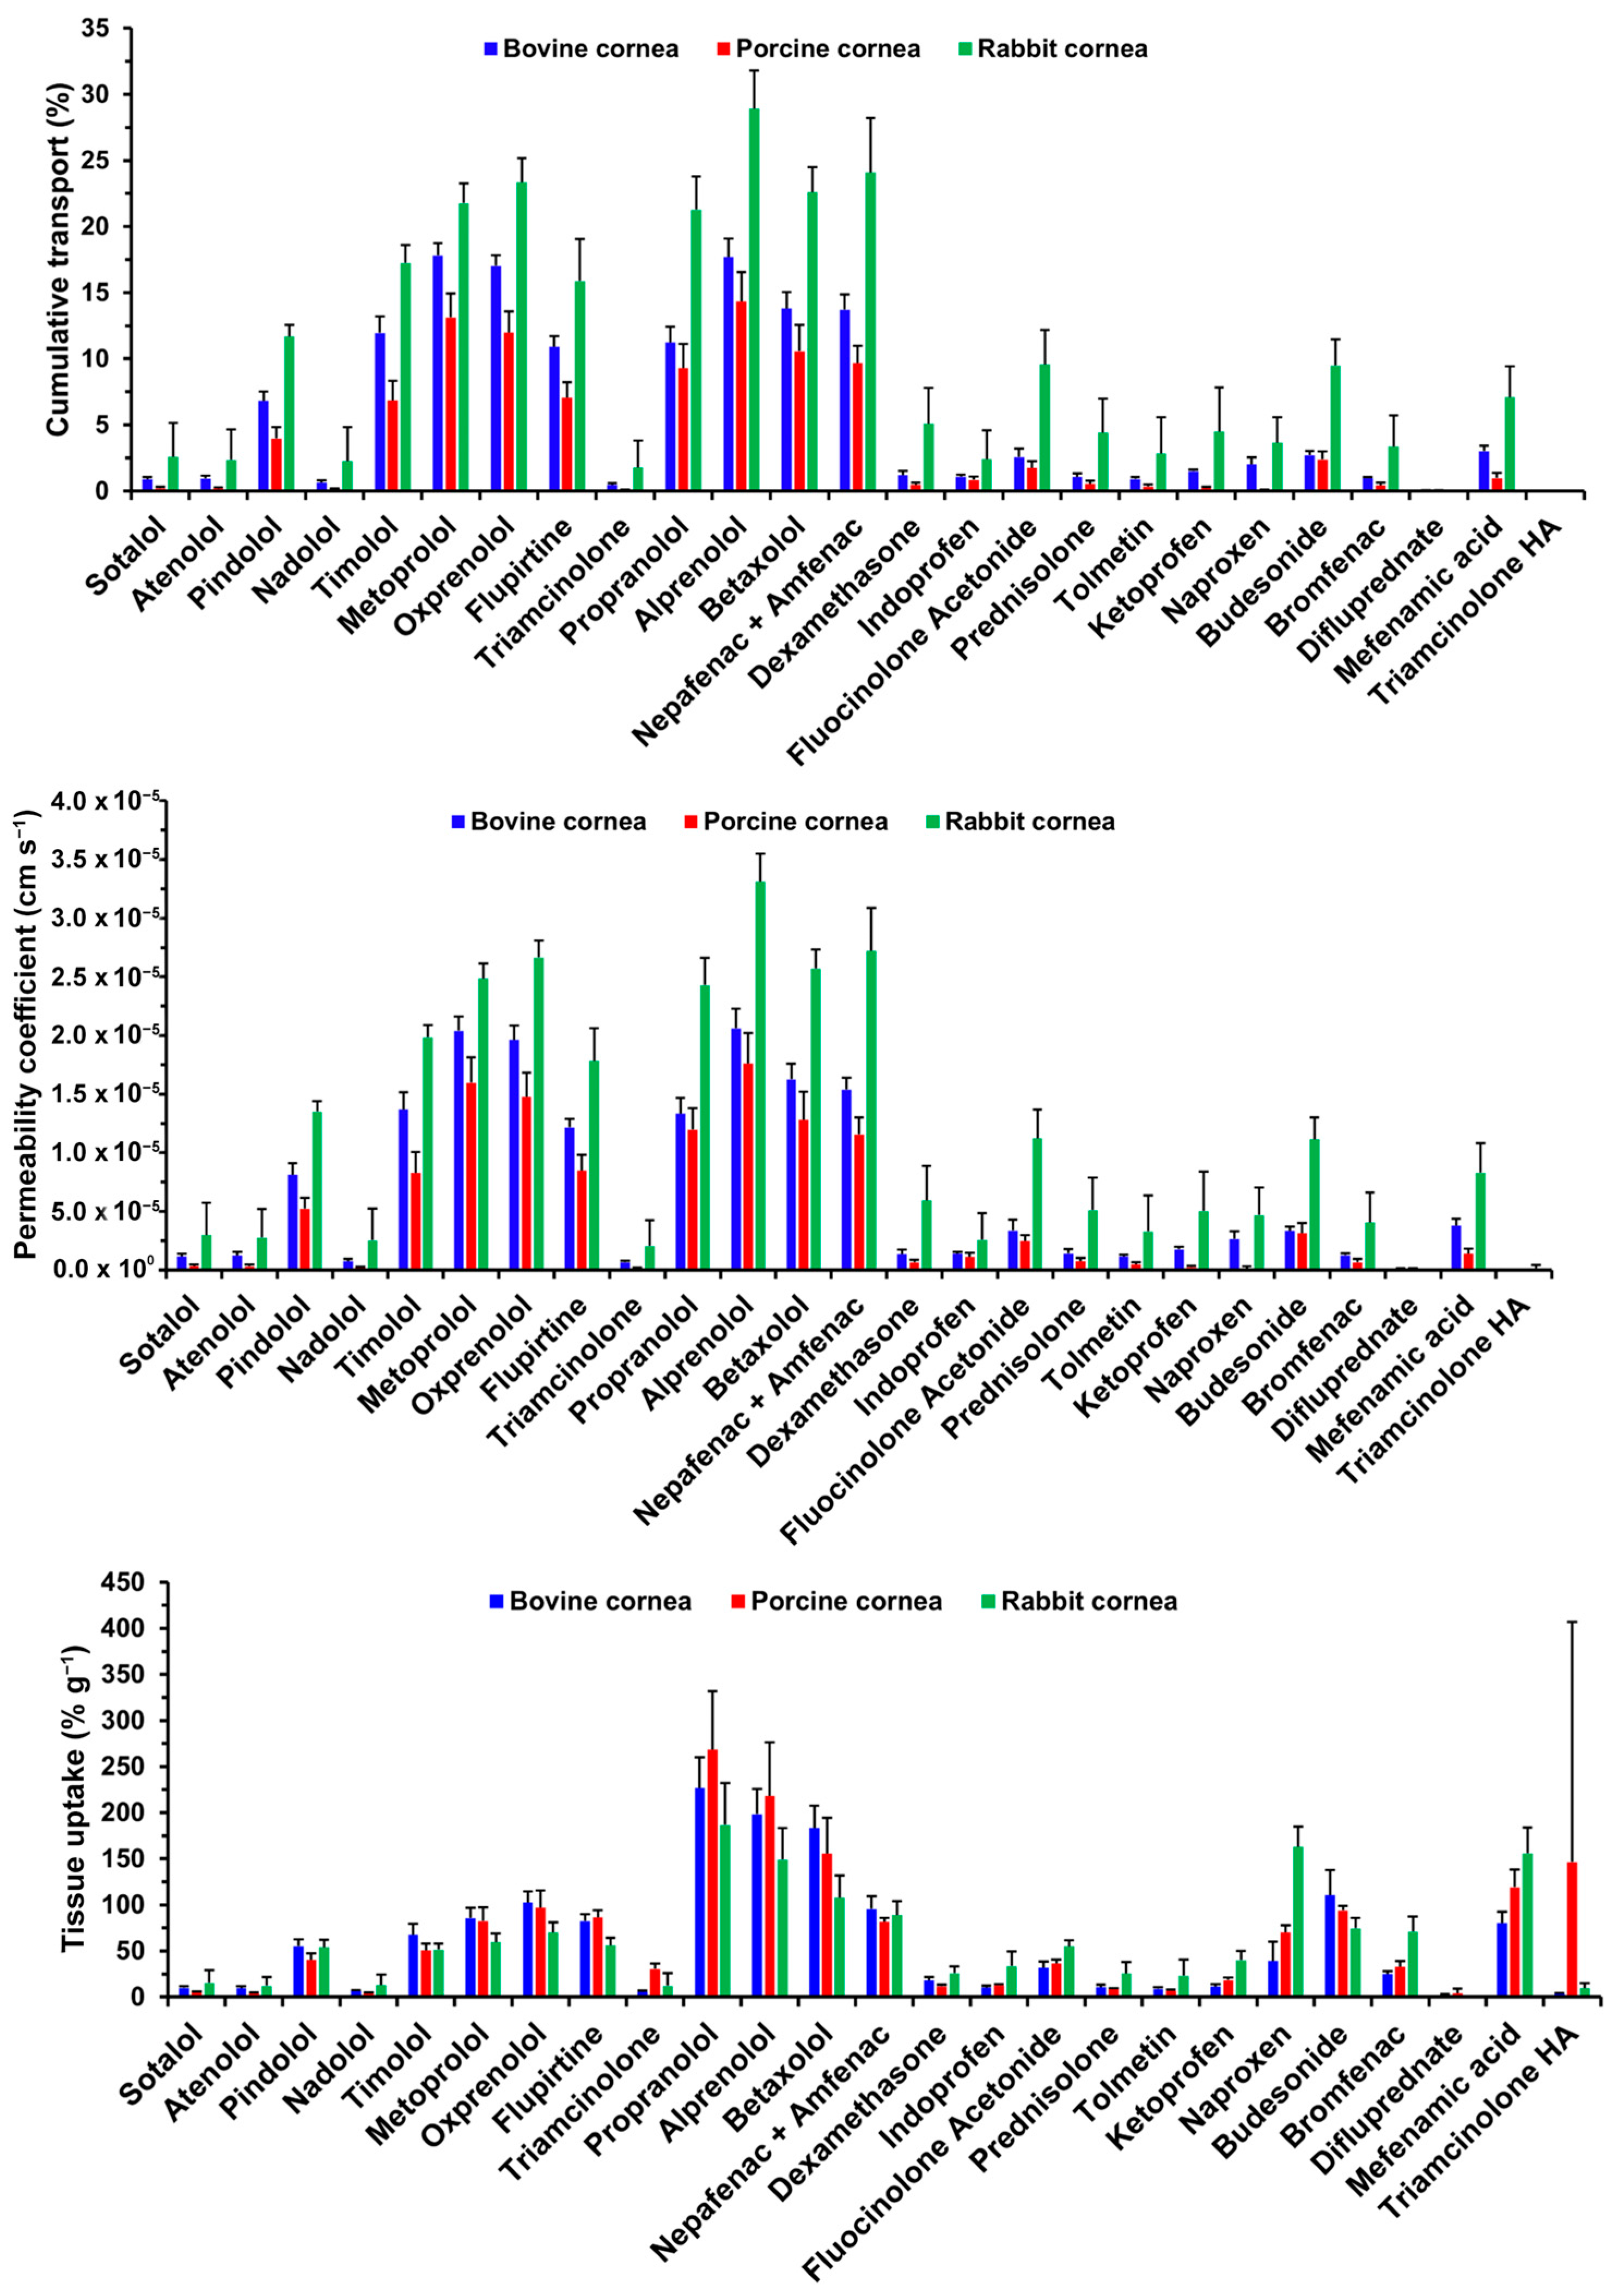
3.1. Cumulative Transport and Permeability Coefficient
3.2. Tissue Uptake
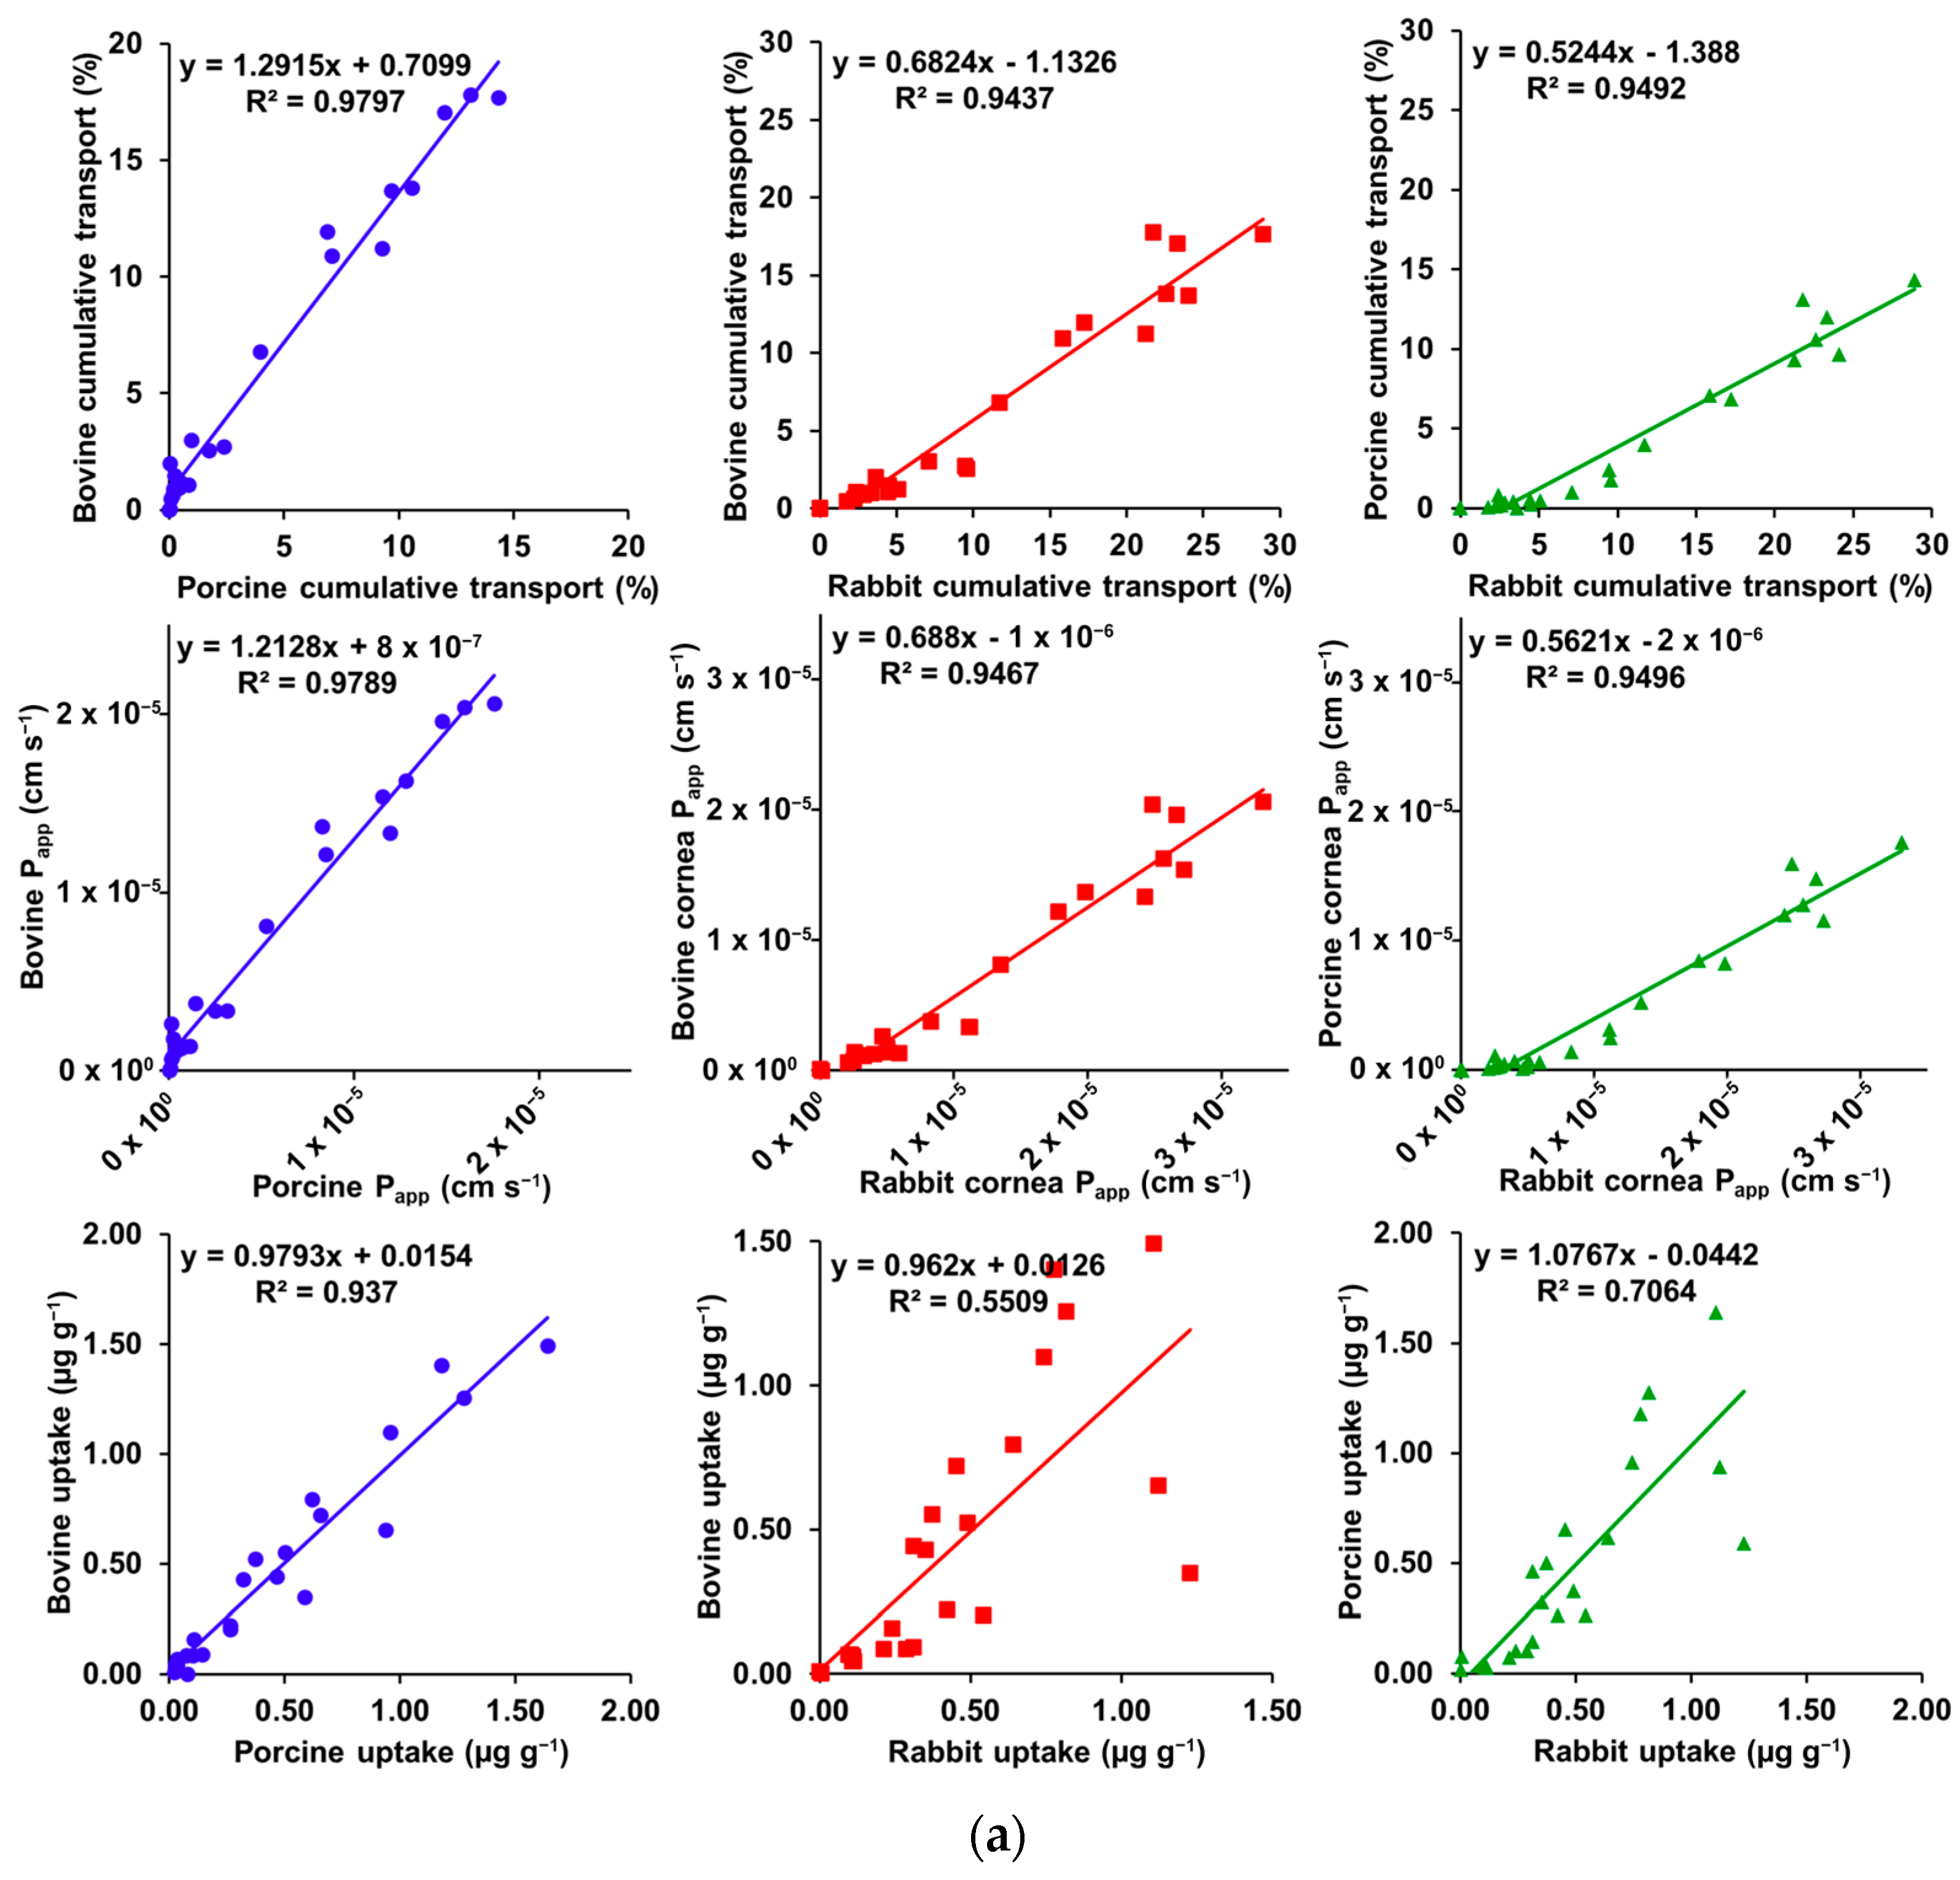
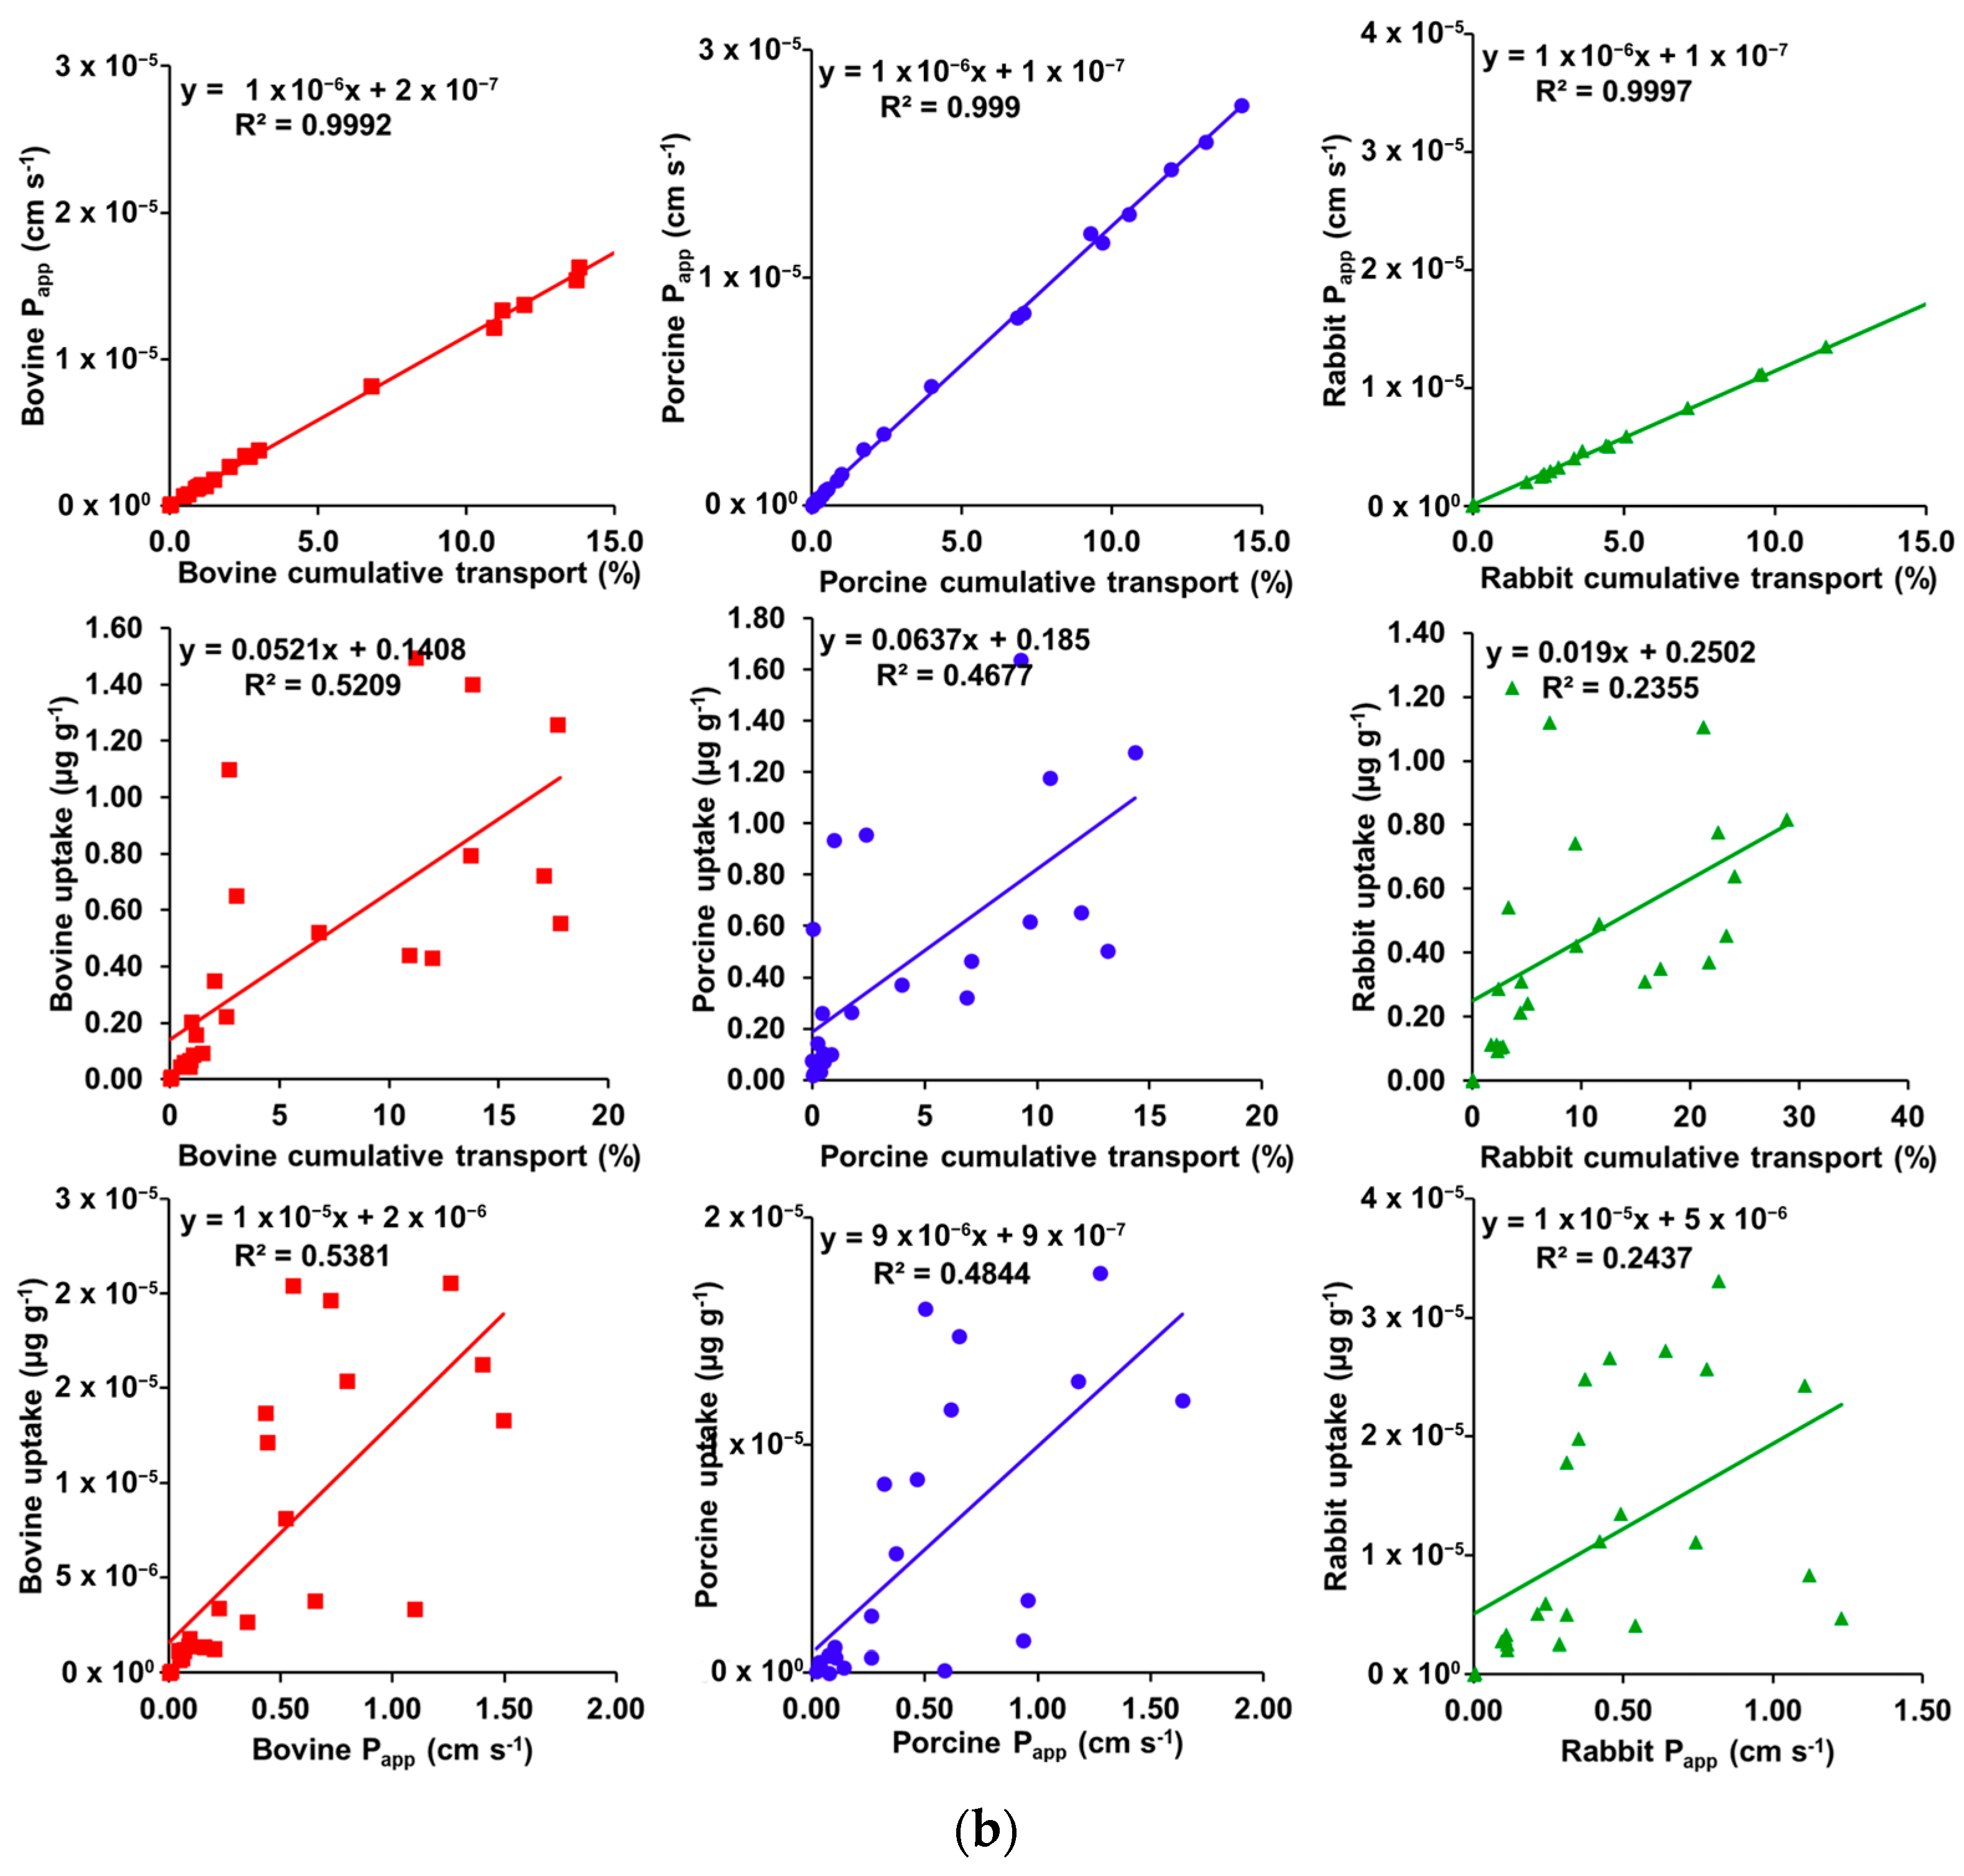
3.3. Correlation Plots
3.4. MLR Modeling
3.5. Bioavailability Estimation
4. Discussion
5. Conclusions
Supplementary Materials
Author Contributions
Funding
Institutional Review Board Statement
Data Availability Statement
Acknowledgments
Conflicts of Interest
References
- Gaballa, S.A.; Kompella, U.B.; Elgarhy, O.; Alqahtani, A.M.; Pierscionek, B.; Alany, R.G.; Abdelkader, H. Corticosteroids in ophthalmology: Drug delivery innovations, pharmacology, clinical applications, and future perspectives. Drug Deliv. Transl. Res. 2021, 11, 866–893. [Google Scholar] [CrossRef] [PubMed]
- Rajapakshal, A.; Fink, M.; Todd, B.A. Size-Dependent Diffusion of Dextrans in Excised Porcine Corneal Stroma. Mol. Cell. Biomech. 2015, 12, 215–230. [Google Scholar]
- Coca-Prados, M. The blood-aqueous barrier in health and disease. J. Glaucoma 2014, 23, S36–S38. [Google Scholar] [CrossRef] [PubMed]
- Cunha-Vaz, J.; Bernardes, R.; Lobo, C. Blood-retinal barrier. Eur. J. Ophthalmol. 2011, 21 (Suppl. S6), S3–S9. [Google Scholar] [CrossRef] [PubMed]
- Maurice, D.M. Drug delivery to the posterior segment from drops. Surv. Ophthalmol. 2002, 47 (Suppl. S1), S41–S52. [Google Scholar] [CrossRef]
- Yavuz, B.; Kompella, U. Ocular Drug Delivery. In Handbook of Experimental Pharmacology; Springer: Berlin/Heidelberg, Germany, 2017; Volume 242, pp. 57–93. [Google Scholar] [CrossRef]
- Tang-Liu, D.D.; Liu, S.; Neff, J.; Sandri, R. Disposition of levobunolol after an ophthalmic dose to rabbits. J. Pharm. Sci. 1987, 76, 780–783. [Google Scholar] [CrossRef]
- Tang-Liu, D.D.; Liu, S.S.; Weinkam, R.J. Ocular and systemic bioavailability of ophthalmic flurbiprofen. J. Pharm. Biopharm. 1984, 12, 611–626. [Google Scholar] [CrossRef]
- Naageshwaran, V.; Ranta, V.P.; Toropainen, E.; Tuomainen, M.; Gum, G.; Xie, E.; Bhoopathy, S.; Urtti, A.; Del Amo, E.M. Topical pharmacokinetics of dexamethasone suspensions in the rabbit eye: Bioavailability comparison. Int. J. Pharm. 2022, 615, 121515. [Google Scholar] [CrossRef]
- Fayyaz, A.; Ranta, V.P.; Toropainen, E.; Vellonen, K.S.; Valtari, A.; Puranen, J.; Ruponen, M.; Gardner, I.; Urtti, A.; Jamei, M.; et al. Topical ocular pharmacokinetics and bioavailability for a cocktail of atenolol, timolol and betaxolol in rabbits. Eur. J. Pharm. Sci. 2020, 155, 105553. [Google Scholar] [CrossRef]
- Zhang, W.; Prausnitz, M.R.; Edwards, A. Model of transient drug diffusion across cornea. J. Control Release 2004, 99, 241–258. [Google Scholar] [CrossRef]
- Tsubota, K. Tear dynamics and dry eye. Prog. Retin. Eye Res. 1998, 17, 565–596. [Google Scholar] [CrossRef]
- Pflugfelder, S.C.; Stern, M.E. Biological functions of tear film. Exp. Eye Res. 2020, 197, 108115. [Google Scholar] [CrossRef]
- Garaszczuk, I.K.; Montes Mico, R.; Iskander, D.R.; Expósito, A.C. The tear turnover and tear clearance tests—A review. Expert. Rev. Med. Devices 2018, 15, 219–229. [Google Scholar] [CrossRef]
- Lee, Y.H.; Kompella, U.B.; Lee, V.H. Systemic absorption pathways of topically applied beta adrenergic antagonists in the pigmented rabbit. Exp. Eye Res. 1993, 57, 341–349. [Google Scholar] [CrossRef]
- Schoenwald, R.D.; Huang, H.S. Corneal penetration behavior of beta-blocking agents I: Physiochemical factors. J. Pharm. Sci. 1983, 72, 1266–1272. [Google Scholar] [CrossRef]
- Huang, H.S.; Schoenwald, R.D.; Lach, J.L. Corneal penetration behavior of beta-blocking agents II: Assessment of barrier contributions. J. Pharm. Sci. 1983, 72, 1272–1279. [Google Scholar] [CrossRef]
- Karami, T.K.; Hailu, S.; Feng, S.; Graham, R.; Gukasyan, H.J. Eyes on Lipinski’s Rule of Five: A New “Rule of Thumb” for Physicochemical Design Space of Ophthalmic Drugs. J. Ocul. Pharm. 2022, 38, 43–55. [Google Scholar] [CrossRef]
- Grass, G.M.; Robinson, J.R. Mechanisms of corneal drug penetration I: In vivo and in vitro kinetics. J. Pharm. Sci. 1988, 77, 3–14. [Google Scholar] [CrossRef]
- Eller, M.G.; Schoenwald, R.D.; Dixson, J.A.; Segarra, T.; Barfknecht, C.F. Topical Carbonic Anhydrase Inhibitors III: Optimization Model for Corneal Penetration of Ethoxzolamide Analogues. J. Pharm. Sci. 1985, 74, 155–160. [Google Scholar] [CrossRef]
- Kidron, H.; Vellonen, K.S.; del Amo, E.M.; Tissari, A.; Urtti, A. Prediction of the Corneal Permeability of Drug-Like Compounds. Pharm. Res. 2010, 27, 1398–1407. [Google Scholar] [CrossRef]
- Ashton, P.; Podder, S.K.; Lee, V.H.L. Formulation influence on conjunctival penetration of 4-beta blockers in the pigmented rabbit—A comparison with corneal penetration. Pharm. Res. 1991, 8, 1166–1174. [Google Scholar] [CrossRef] [PubMed]
- Brock, D.J.; Kondow-McConaghy, H.; Allen, J.; Brkljača, Z.; Kustigian, L.; Jiang, M.; Zhang, J.; Rye, H.; Vazdar, M.; Pellois, J.P. Mechanism of Cell Penetration by Permeabilization of Late Endosomes: Interplay between a Multivalent TAT Peptide and Bis(monoacylglycero)phosphate. Cell. Chem. Biol. 2020, 27, 1296–1307.e1295. [Google Scholar] [CrossRef] [PubMed]
- Loch, C.; Zakelj, S.; Kristl, A.; Nagel, S.; Guthoff, R.; Weitschies, W.; Seidlitz, A. Determination of permeability coefficients of ophthalmic drugs through different layers of porcine, rabbit and bovine eyes. Eur. J. Pharm. Sci. 2012, 47, 131–138. [Google Scholar] [CrossRef] [PubMed]
- Chan, T.; Payor, S.; Holden, B.A. Corneal thickness profiles in rabbits using an ultrasonic pachometer. Investig. Ophthalmol. Vis. Sci. 1983, 24, 1408–1410. [Google Scholar]
- Missel, P.; Chastain, J.; Mitra, A.; Kompella, U.; Kansara, V.; Duvvuri, S.; Amrite, A.; Cheruvu, N. In vitro transport and partitioning of AL-4940, active metabolite of angiostatic agent anecortave acetate, in ocular tissues of the posterior segment. J. Ocul. Pharm. 2010, 26, 137–146. [Google Scholar] [CrossRef] [Green Version]
- Oliveira, G.A.; Ducas Rdo, N.; Teixeira, G.C.; Batista, A.C.; Oliveira, D.P.; Valadares, M.C. Short Time Exposure (STE) test in conjunction with Bovine Corneal Opacity and Permeability (BCOP) assay including histopathology to evaluate correspondence with the Globally Harmonized System (GHS) eye irritation classification of textile dyes. Toxicol. Vitr. 2015, 29, 1283–1288. [Google Scholar] [CrossRef] [Green Version]
- Van den Berghe, C.; Guillet, M.C.; Compan, D. Performance of porcine corneal opacity and permeability assay to predict eye irritation for water-soluble cosmetic ingredients. Toxicol. Vitr. 2005, 19, 823–830. [Google Scholar] [CrossRef]
- Pescina, S.; Govoni, P.; Potenza, A.; Padula, C.; Santi, P.; Nicoli, S. Development of a convenient ex vivo model for the study of the transcorneal permeation of drugs: Histological and permeability evaluation. J. Pharm. Sci. 2015, 104, 63–71. [Google Scholar] [CrossRef]
- Doughty, M.J.; Petrou, S.; Macmillan, H. Anatomy and morphology of the cornea of bovine eyes from a slaughterhouse. Can. J. Zool. 1995, 73, 2159–2165. [Google Scholar] [CrossRef]
- Elsheikh, A.; Alhasso, D. Mechanical anisotropy of porcine cornea and correlation with stromal microstructure. Exp. Eye Res. 2009, 88, 1084–1091. [Google Scholar] [CrossRef]
- Li, H.F.; Petroll, W.M.; Møller-Pedersen, T.; Maurer, J.K.; Cavanagh, H.D.; Jester, J.V. Epithelial and corneal thickness measurements by in vivo confocal microscopy through focusing (CMTF). Curr. Eye Res. 1997, 16, 214–221. [Google Scholar] [CrossRef]
- Kim, Y.L.; Walsh, J.T., Jr.; Goldstick, T.K.; Glucksberg, M.R. Variation of corneal refractive index with hydration. Phys. Med. Biol. 2004, 49, 859–868. [Google Scholar] [CrossRef]
- Wollensak, G.; Spoerl, E.; Seiler, T. Stress-strain measurements of human and porcine corneas after riboflavin–ultraviolet-A-induced cross-linking. J. Cataract. Refract. Surg. 2003, 29, 1780–1785. [Google Scholar] [CrossRef]
- Goskonda, V.R.; Hill, R.A.; Khan, M.A.; Reddy, I.K. Permeability of chemical delivery systems across rabbit corneal (SIRC) cell line and isolated corneas: A comparative study. Pharm. Dev. Technol. 2000, 5, 409–416. [Google Scholar] [CrossRef]
- Boyce, B.L.; Grazier, J.M.; Jones, R.E.; Nguyen, T.D. Full-field deformation of bovine cornea under constrained inflation conditions. Biomaterials 2008, 29, 3896–3904. [Google Scholar] [CrossRef]
- Wollensak, G.; Aurich, H.; Pham, D.T.; Wirbelauer, C. Hydration behavior of porcine cornea crosslinked with riboflavin and ultraviolet A. J. Cataract. Refract. Surg. 2007, 33, 516–521. [Google Scholar] [CrossRef]
- Wollensak, G.; Iomdina, E. Long-term biomechanical properties of rabbit cornea after photodynamic collagen crosslinking. Acta Ophthalmol. 2009, 87, 48–51. [Google Scholar] [CrossRef]
- Attama, A.A.; Reichl, S.; Müller-Goymann, C.C. Diclofenac sodium delivery to the eye: In vitro evaluation of novel solid lipid nanoparticle formulation using human cornea construct. Int. J. Pharm. 2008, 355, 307–313. [Google Scholar] [CrossRef]
- Matter, B.; Bourne, D.W.A.; Kompella, U.B. A High-Throughput LC-MS/MS Method for the Simultaneous Quantification of Twenty-Seven Drug Molecules in Ocular Tissues. Aaps PharmSciTech 2022, 23, 14. [Google Scholar] [CrossRef]
- Roy, K.; Kar, S.; Ambure, P. On a simple approach for determining applicability domain of QSAR models. Chemom. Intell. Lab. Syst. 2015, 145, 22–29. [Google Scholar] [CrossRef]
- Consonni, V.; Ballabio, D.; Todeschini, R. Evaluation of model predictive ability by external validation techniques. J. Chemometr. 2010, 24, 194–201. [Google Scholar] [CrossRef]
- Ramsay, E.; Del Amo, E.M.; Toropainen, E.; Tengvall-Unadike, U.; Ranta, V.P.; Urtti, A.; Ruponen, M. Corneal and conjunctival drug permeability: Systematic comparison and pharmacokinetic impact in the eye. Eur. J. Pharm. Sci. 2018, 119, 83–89. [Google Scholar] [CrossRef] [PubMed] [Green Version]
- Lee, V.H.; Robinson, J.R. Topical ocular drug delivery: Recent developments and future challenges. J. Ocul. Pharm. 1986, 2, 67–108. [Google Scholar] [CrossRef] [PubMed]
- Prausnitz, M.R.; Noonan, J.S. Permeability of cornea, sclera, and conjunctiva: A literature analysis for drug delivery to the eye. J. Pharm. Sci. 1998, 87, 1479–1488. [Google Scholar] [CrossRef] [PubMed]
- Greiner, J.V.; Kopp, S.J.; Lass, J.H.; Gold, J.B.; Glonek, T. Metabolic compatibility of abattoir and human corneas: An ex vivo 31P nuclear magnetic resonance spectroscopic study of intact tissues. Cornea 1993, 12, 461–465. [Google Scholar] [CrossRef]
- Greiner, J.V.; Lass, J.H.; Glonek, T. Interspecies analysis of corneal phosphate metabolites. Exp. Eye Res. 1989, 49, 523–529. [Google Scholar] [CrossRef]
- Subasinghe, S.K.; Ogbuehi, K.C.; Mitchell, L.; Dias, G.J. Animal model with structural similarity to human corneal collagen fibrillar arrangement. Anat. Sci. Int. 2021, 96, 286–293. [Google Scholar] [CrossRef]
- Sanchez, I.; Martin, R.; Ussa, F.; Fernandez-Bueno, I. The parameters of the porcine eyeball. Graefes Arch. Clin. Exp. Ophthalmol. 2011, 249, 475–482. [Google Scholar] [CrossRef]
- Hammond, G.M.; Young, R.D.; Muir, D.D.; Quantock, A.J. The microanatomy of Bowman’s layer in the cornea of the pig: Changes in collagen fibril architecture at the corneoscleral limbus. Eur. J. Anat. 2020, 24, 399–406. [Google Scholar]
- Hayashi, S.; Osawa, T.; Tohyama, K. Comparative observations on corneas, with special reference to Bowman’s layer and Descemet’s membrane in mammals and amphibians. J. Morphol. 2002, 254, 247–258. [Google Scholar] [CrossRef]
- Bueno, J.M.; Gualda, E.J.; Artal, P. Analysis of corneal stroma organization with wavefront optimized nonlinear microscopy. Cornea 2011, 30, 692–701. [Google Scholar] [CrossRef]
- Wang, W.; Sasaki, H.; Chien, D.S.; Lee, V.H. Lipophilicity influence on conjunctival drug penetration in the pigmented rabbit: A comparison with corneal penetration. Curr. Eye Res. 1991, 10, 571–579. [Google Scholar] [CrossRef]
- Toropainen, E.; Ranta, V.P.; Vellonen, K.S.; Palmgrén, J.; Talvitie, A.; Laavola, M.; Suhonen, P.; Hämäläinen, K.M.; Auriola, S.; Urtti, A. Paracellular and passive transcellular permeability in immortalized human corneal epithelial cell culture model. Eur. J. Pharm. Sci. 2003, 20, 99–106. [Google Scholar] [CrossRef]
- Over, B.; Matsson, P.; Tyrchan, C.; Artursson, P.; Doak, B.C.; Foley, M.A.; Hilgendorf, C.; Johnston, S.E.; Lee, M.D.; Lewis, R.J.; et al. Structural and conformational determinants of macrocycle cell permeability. Nat. Chem. Biol. 2016, 12, 1065–1074. [Google Scholar] [CrossRef]
- Diukendjieva, A.; Tsakovska, I.; Alov, P.; Pencheva, T.; Pajeva, I.; Worth, A.P.; Madden, J.C.; Cronin, M.T.D. Advances in the prediction of gastrointestinal absorption: Quantitative Structure-Activity Relationship (QSAR) modelling of PAMPA permeability. Comput. Toxicol. 2019, 10, 51–59. [Google Scholar] [CrossRef] [Green Version]
- Janicka, M.; Sztanke, M.; Sztanke, K. Predicting the Blood-Brain Barrier Permeability of New Drug-Like Compounds via HPLC with Various Stationary Phases. Molecules 2020, 25, 487. [Google Scholar] [CrossRef] [Green Version]
- Rocquefelte, X.; Goubin, F.; Koo, H.J.; Whangbo, M.H.; Jobic, S. Investigation of the origin of the empirical relationship between refractive index and density on the basis of first principles calculations for the refractive indices of various TiO2 phases. Inorg. Chem. 2004, 43, 2246–2251. [Google Scholar] [CrossRef]
- Veber, D.F.; Johnson, S.R.; Cheng, H.Y.; Smith, B.R.; Ward, K.W.; Kopple, K.D. Molecular properties that influence the oral bioavailability of drug candidates. J. Med. Chem. 2002, 45, 2615–2623. [Google Scholar] [CrossRef]
- Zakeri, M.P.; Tajerzadeh, H.; Eslamboulchilar, Z.; Barzegar, S.; Valizadeh, H. The relation between molecular properties of drugs and their transport across intestinal membrane. DARU J. Pharm. Sci. 2006, 14, 164–171. [Google Scholar]
- Iyer, M.; Tseng, Y.J.; Senese, C.L.; Liu, J.Z.; Hopfinger, A.J. Prediction and mechanistic interpretation of human oral drug absorption using MI-QSAR analysis. Mol. Pharm. 2007, 4, 218–231. [Google Scholar] [CrossRef]
- Davis, T.D.; Gerry, C.J.; Tan, D.S. General platform for systematic quantitative evaluation of small-molecule permeability in bacteria. ACS Chem. Biol. 2014, 9, 2535–2544. [Google Scholar] [CrossRef] [PubMed] [Green Version]
- Suenderhauf, C.; Hammann, F.; Huwyler, J. Computational prediction of blood-brain barrier permeability using decision tree induction. Molecules 2012, 17, 10429–10445. [Google Scholar] [CrossRef] [PubMed] [Green Version]
- Genty, M.; Gonzalez, G.; Clere, C.; Desangle-Gouty, V.; Legendre, J.Y. Determination of the passive absorption through the rat intestine using chromatographic indices and molar volume. Eur. J. Pharm. Sci. 2001, 12, 223–229. [Google Scholar] [CrossRef] [PubMed]
- Yoon, C.H.; Shin, B.S.; Chang, H.S.; Kwon, L.S.; Kim, H.Y.; Yoo, S.E.; Yoo, S.D. Rapid screening of drug absorption potential using the immobilized artificial membrane phosphatidylcholine column and molar volume. Chromatographia 2004, 60, 399–404. [Google Scholar] [CrossRef]
- Ghafourian, T.; Fooladi, S. The effect of structural QSAR parameters on skin penetration. Int. J. Pharm. 2001, 217, 1–11. [Google Scholar] [CrossRef]
- Lawrence, M.S.; Miller, J.W. Ocular tissue permeabilities. Int. Ophthalmol. Clin. 2004, 44, 53–61. [Google Scholar] [CrossRef]
- Kompella, U.B.; Kim, K.J.; Lee, V.H. Active chloride transport in the pigmented rabbit conjunctiva. Curr. Eye Res. 1993, 12, 1041–1048. [Google Scholar] [CrossRef]
- Sasaki, H.; Igarashi, Y.; Nagano, T.; Yamamura, K.; Nishida, K.; Nakamura, J. Penetration of β-blockers through ocular membranes in a1bino rabbits. J. Pharm. Pharmacol. 1995, 47, 17–21. [Google Scholar] [CrossRef]
- Saha, P.; Yang, J.J.; Lee, V.H.L. Existence of a p-glycoprotein drug efflux pump in cultured rabbit conjunctival epithelial cells. Investig. Ophthalmol. Vis. Sci. 1998, 39, 1221–1226. [Google Scholar]
- Dey, S.; Gunda, S.; Mitra, A.K. Pharmacokinetics of erythromycin in rabbit corneas after single-dose infusion: Role of P-glycoprotein as a barrier to in vivo ocular drug absorption. J. Pharmacol. Exp. Ther. 2004, 311, 246–255. [Google Scholar] [CrossRef] [Green Version]
- Horibe, Y.; Hosoya, K.; Kim, K.J.; Lee, V.H.L. Carrier-mediated transport of monocarboxylate drugs in the pigmented rabbit conjunctiva. Investig. Ophthalmol. Vis. Sci. 1998, 39, 1436–1443. [Google Scholar]
- Gautheron, P.; Dukic, M.; Alix, D.; Sina, J.F. Bovine corneal opacity and permeability test: An in vitro assay of ocular irritancy. Fundam. Appl. Toxicol. 1992, 18, 442–449. [Google Scholar] [CrossRef]
- Gautheron, P.; Giroux, J.; Cottin, M.; Audegond, L.; Morilla, A.; Mayordomo-Blanco, L.; Tortajada, A.; Haynes, G.; Vericat, J.A.; Pirovano, R.; et al. Interlaboratory assessment of the bovine corneal opacity and permeability (BCOP) assay. Toxicol. In Vitro 1994, 8, 381–392. [Google Scholar] [CrossRef]


| Corneal Thickness (µm) | ||
|---|---|---|
| Bovine | Porcine | Rabbit |
| 800 [27] | 950 [28] | 480 [28] |
| 1530 [28] | 1188 [29] | 370 [27] |
| 1015 [30] | 955 [31] | 381 [32] |
| 1024 [33] | 850 [34] | 500 [35] |
| 1160 [36] | 851 [37] | 422 [38] |
| 1105.8 * | 958.8 * | 430.6 * |
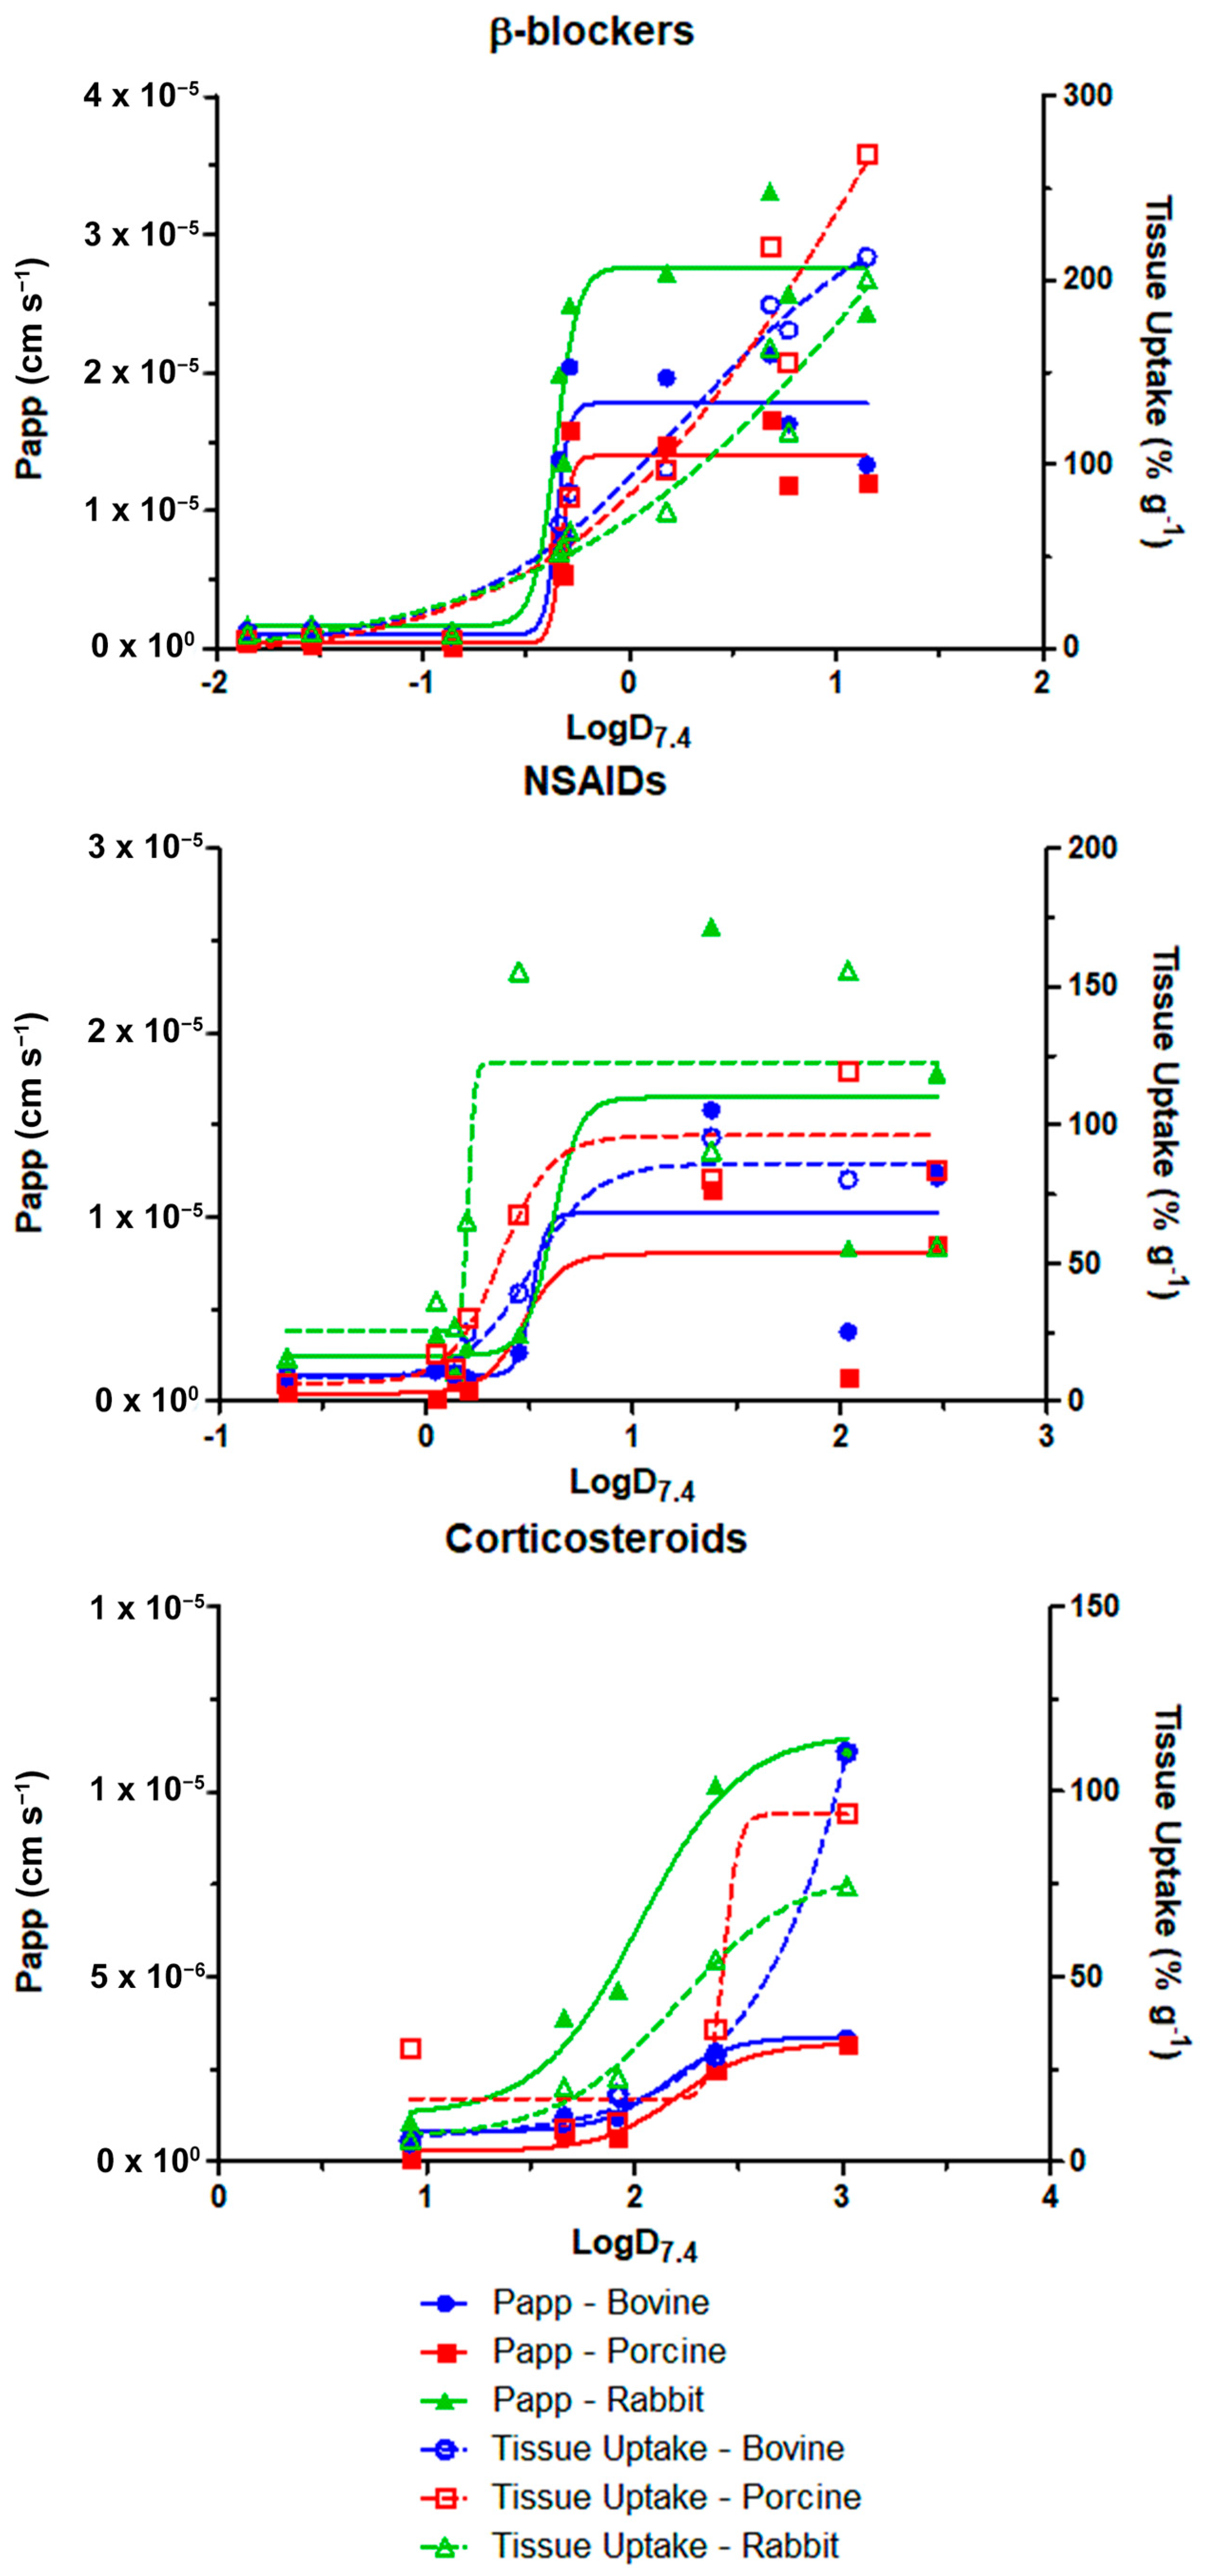
| Tissue | Parameter | LogD7.4 at Half-Maximum | ||
|---|---|---|---|---|
| β-Blockers | NSAIDs | Corticosteroids | ||
| Bovine | Papp (cm s−1) | −0.3521 | 0.5118 | 2.145 |
| Tissue uptake (% g−1) | 0.2783 | 0.5068 | 5.61 | |
| Porcine | Papp (cm s−1) | −0.3327 | 0.4692 | 2.202 |
| Tissue uptake (% g−1) | 1.093 | 0.3586 | 2.43 | |
| Rabbit | Papp (cm s−1) | −0.3578 | 0.6092 | 2.023 |
| Tissue uptake (% g−1) | 1.758 | 0.2055 | 2.204 | |
| Parameter | Tissue | Unit | Coefficients | R2 | Q2 |
|---|---|---|---|---|---|
| Permeability | Bovine | Flux (log % s−1/cm2) | (8.312) + (−0.236·HBA) + (7.254·NR) + (−7.192·IR) + (0.348·LogD7.4) | 0.87 | 0.735 |
| Papp (log cm s−1) | (−5.84) + (−0.101·HBDA) + (0.141·RB) + (3.994·NR) + (0.274·LogD7.4) | 0.812 | 0.632 | ||
| Porcine | Flux (log % s−1/cm2) | (11.882) + (−0.319·HBA) + (10.175·NR) + (−9.504·IR) + (0.503·LogD7.4) | 0.857 | 0.704 | |
| Papp (log cm s−1) | (−24.374) + (−0.329·HBDA) + (8.346·Log MV) + (14.591·NR) + (0.227·LogD7.4) | 0.722 | 0.462 | ||
| Rabbit | Flux (log % s−1/cm2) | (10.143) + (−0.279·HBA) + (7.64·NR) + (−8.174·IR) + (0.47·LogD7.4) | 0.884 | 0.748 | |
| Papp (log cm s−1) | (−5.496) + (−0.061·HBDA) + (0.11·RB) + (2.308·NR) + (0.245·LogD7.4) | 0.781 | 0.537 | ||
| Cumulative transport | Bovine | Amount (%) | (179.182) + (−2.468·HBA) + (81.565·NR) + (−106.291·IR) + (3.247·LogD7.4) | 0.764 | 0.529 |
| Amount (%) | (−6.868) + (2.251·RB) + (2.282·LogD7.4) | 0.676 | 0.492 | ||
| Porcine | Amount (%) | (142.4) + (−1.956·HBA) + (57.287·NR) + (−84.66·IR) + (2.559·LogD7.4) | 0.75 | 0.522 | |
| Amount (%) | (−6.025) + (1.754·RB) + (1.857·LogD7.4) | 0.691 | 0.5 | ||
| Rabbit | Amount (%) | (253.788) + (−3.628·HBA) + (110.828·NR) + (−149.001·IR) + (5.481·LogD7.4) | 0.801 | 0.617 | |
| Amount (%) | (−7.379) + (3.048·RB) + (4.057·LogD7.4) | 0.675 | 0.493 | ||
| Tissue uptake | Bovine | Amount (% g−1) | (0.763) + (−0.293·HBA) + (0.145·RB) + (5.139·HR) + (0.426·LogD7.4) | 0.863 | 0.69 |
| Porcine | Amount (% g−1) | (7.694) + (−2.834·Log MW) + (0.118·RB) + (0.419·LogD7.4) | 0.728 | 0.562 | |
| Rabbit | Amount (% g−1) | (2.23) + (−0.146·HBDA) + (0.041·RB) + (2.376·NR) + (0.216·LogD7.4) | 0.807 | 0.657 |
| Parameter | Unit | Model | R2 | Q2 |
|---|---|---|---|---|
| Flux | −log %·s−1/cm2 | (3.474) + (3.833·TT) + (0.138·HBDA) + (−0.135·RB) + (−5.07·NR) + (−0.375·LogD) | 0.781 | 0.719 |
| Flux | −log %·s−1/cm2 | (−10.432) + (3.833·TT) + (0.279·HBA) + (−8.357·NR) + (8.29·IR) + (−0.441·LogD) | 0.826 | 0.780 |
| Papp | −log cm s−1 | (5.41) + (7.257·TT) + (0.086·HBDA) + (−0.151·RB) + (−3.872·NR) + (−0.315·LogD) | 0.691 | 0.608 |
| Papp | −log cm s−1 | (−9.001) + (7.256·TT) + (0.207·HBA) + (−7.687·NR) + (8.548·IR) + (−0.374·LogD) | 0.716 | 0.650 |
| Cumulative transport | % | (6.118) + (−84.079·TT) + (−1.383·HBA) + (2.093·RB) + (25.45·NR) + (3.029·LogD) | 0.700 | 0.610 |
| Cumulative transport | % | (198.783) + (−84.079·TT) + (−2.685·HBA) + (83.227·NR) + (−113.318·IR) + (3.763·LogD) | 0.734 | 0.662 |
| Tissue uptake | log % g−1 | (1.422) + (−2.235·TT) + (−0.303·HBA) + (0.105·RB) + (4.442·HR) + (0.387·LogD) | 0.750 | 0.684 |
| Tissue uptake | log % g−1 | (1.853) + (−2.235·TT) + (−0.13·HBDA) + (0.097·RB) + (2.615·NR) + (0.308·LogD) | 0.748 | 0.678 |
| Drug Class | R2 | Model |
|---|---|---|
| β-blockers | 0.934 | PappConjunctiva = (10.141·PappCornea) + (−0.00000267) |
| NSAIDs | 0.979 | PappConjunctiva = (24.645·PappCornea) + (−0.00000633) |
| Corticosteroids | 0.999 | PappConjunctiva = (7.150·PappCornea) + (0.00000136) |
Disclaimer/Publisher’s Note: The statements, opinions and data contained in all publications are solely those of the individual author(s) and contributor(s) and not of MDPI and/or the editor(s). MDPI and/or the editor(s) disclaim responsibility for any injury to people or property resulting from any ideas, methods, instructions or products referred to in the content. |
© 2023 by the authors. Licensee MDPI, Basel, Switzerland. This article is an open access article distributed under the terms and conditions of the Creative Commons Attribution (CC BY) license (https://creativecommons.org/licenses/by/4.0/).
Share and Cite
Santana, C.P.; Matter, B.A.; Patil, M.A.; Silva-Cunha, A.; Kompella, U.B. Corneal Permeability and Uptake of Twenty-Five Drugs: Species Comparison and Quantitative Structure–Permeability Relationships. Pharmaceutics 2023, 15, 1646. https://doi.org/10.3390/pharmaceutics15061646
Santana CP, Matter BA, Patil MA, Silva-Cunha A, Kompella UB. Corneal Permeability and Uptake of Twenty-Five Drugs: Species Comparison and Quantitative Structure–Permeability Relationships. Pharmaceutics. 2023; 15(6):1646. https://doi.org/10.3390/pharmaceutics15061646
Chicago/Turabian StyleSantana, Cleildo P., Brock A. Matter, Madhoosudan A. Patil, Armando Silva-Cunha, and Uday B. Kompella. 2023. "Corneal Permeability and Uptake of Twenty-Five Drugs: Species Comparison and Quantitative Structure–Permeability Relationships" Pharmaceutics 15, no. 6: 1646. https://doi.org/10.3390/pharmaceutics15061646