

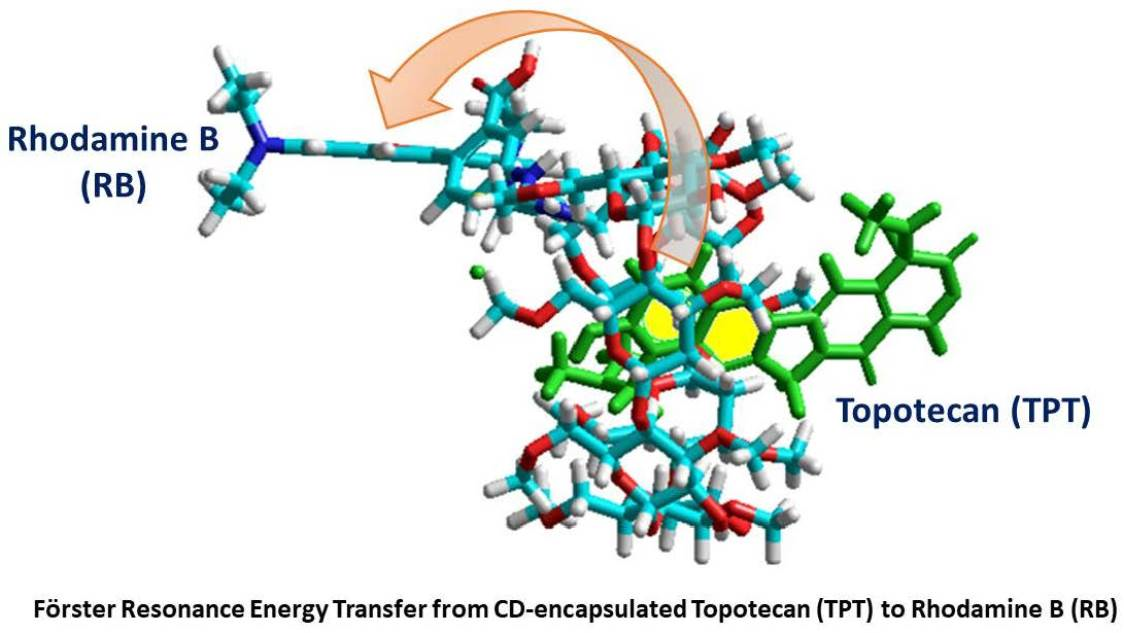
Robust Inclusion Complex of Topotecan Comprised within a Rhodamine-Labeled β-Cyclodextrin: Competing Proton and Energy Transfer Processes

Abstract
:
1. Introduction
2. Materials and Methods
3. Results
3.1. Steady-State Study
3.1.1. UV–Vis Absorption Spectra
3.1.2. Emission Spectra
3.1.3. Determination of the Complex Stability Constant (Keq)
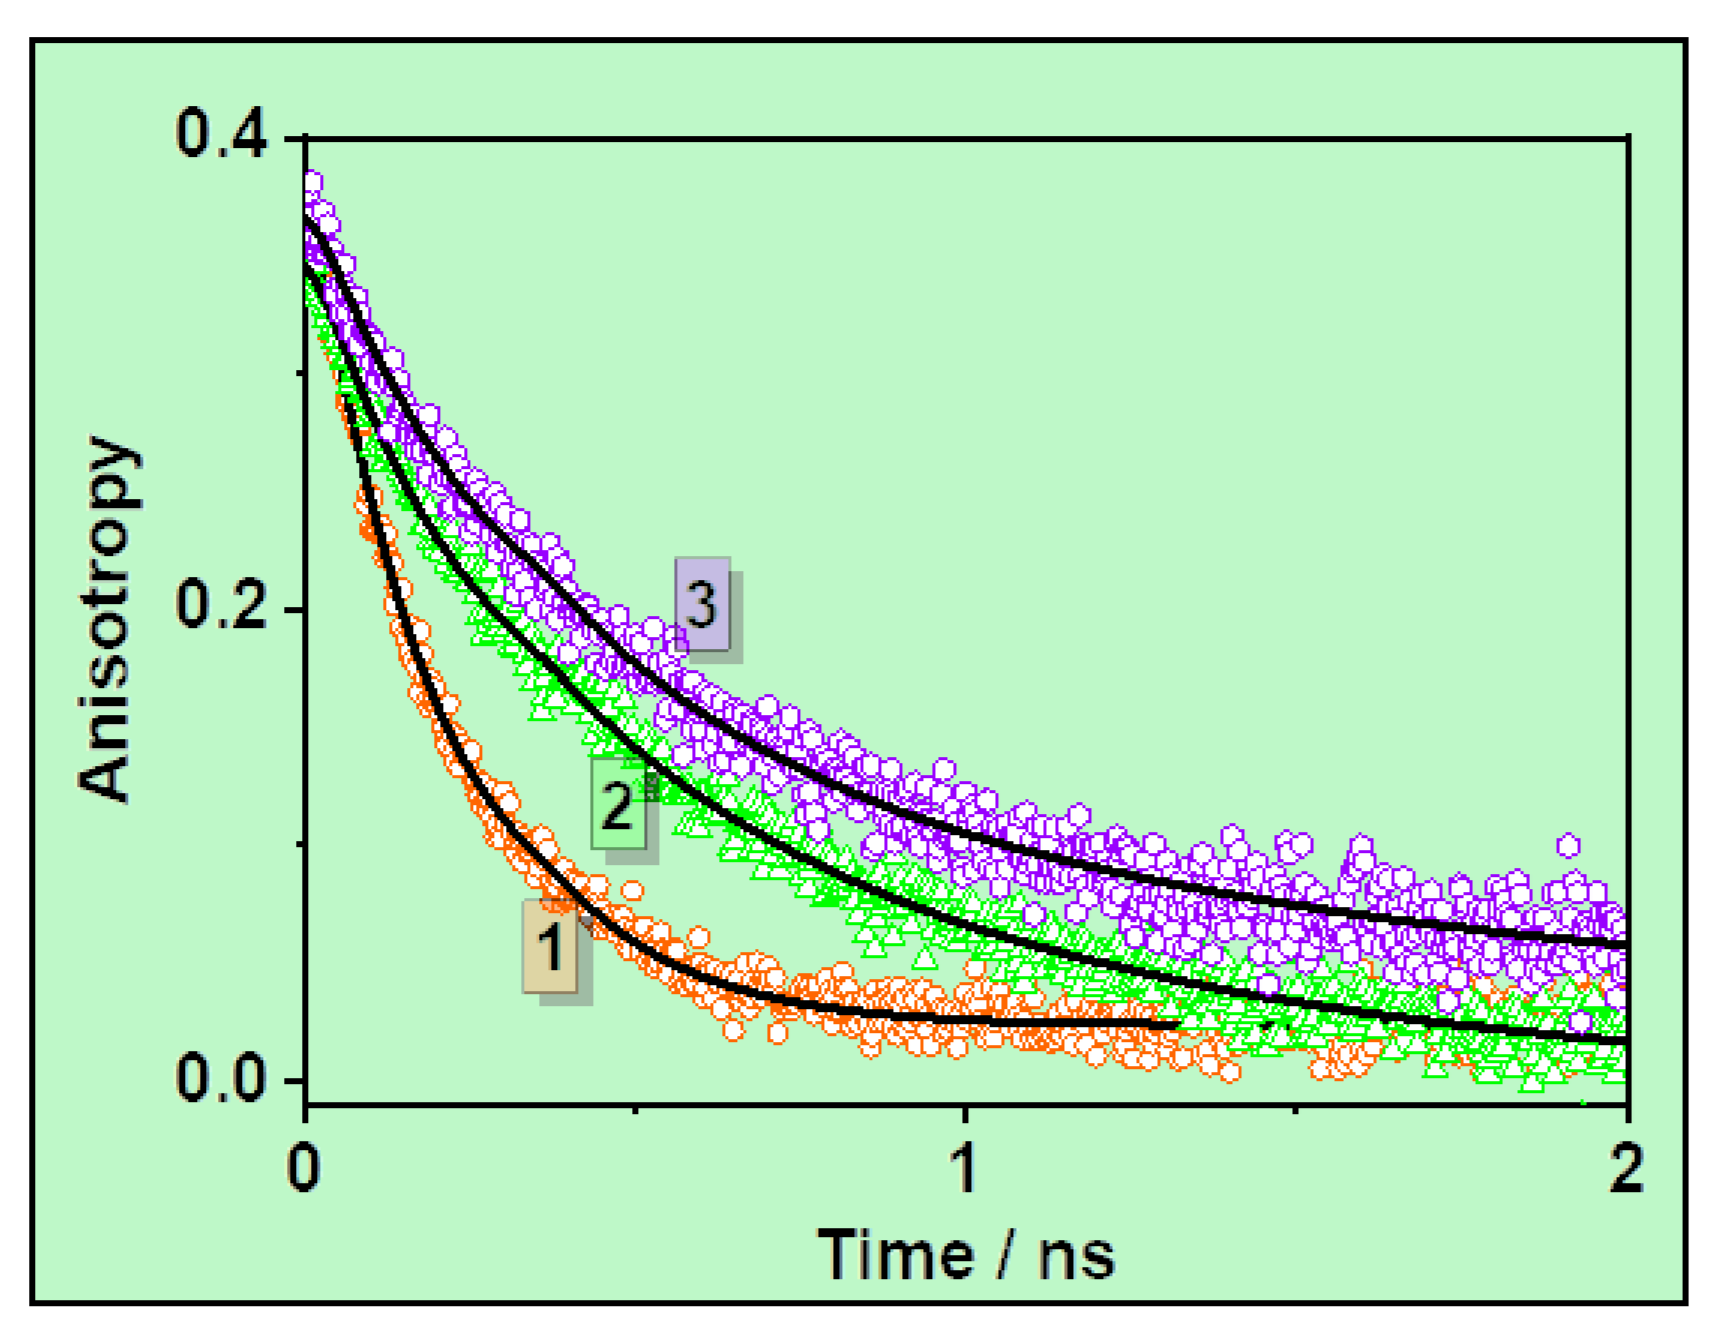
3.2. Ps-Time-Resolved Emission Study
4. Conclusions
Supplementary Materials
Author Contributions
Funding
Institutional Review Board Statement
Informed Consent Statement
Data Availability Statement
Acknowledgments
Conflicts of Interest
Abbreviations
| TPT | topotecan |
| RB-RM-βCD | 6-deoxy-6-[(5/6)-rhodaminylthioureido]-randomly methylated-βCD |
| FRET | Förster resonance energy transfer |
| CPT | camptothecin |
| Top1 | topoisomerase I |
| RNA | ribonucleic acid |
| DNA | deoxyribonucleic acid |
| RB | rhodamine B |
| CD | cyclodextrin |
| HP-βCD | 2-hydroxypropyl-βCD |
| SBE-βCD | sulfobutylether-βCD |
| RM-βCD | randomly methylated βCD |
| CT | charge transfer |
| PT | proton transfer |
| ET | energy transfer |
| ELISA | Enzyme-Linked ImmunoSorbent Assay |
| DM-βCD | heptakis(2,6-di-O-methyl)-βCD |
| TM-βCD | heptakis(2,3,6-tri-O-methyl)-βCD |
| 1HNMR | proton nuclear magnetic resonance |
| Me | methyl |
| UV | ultraviolet |
| TCSPC | time-correlated single-photon counting |
| IRF | instrumental response function |
| E | enol |
| C | cation |
| Z | zwitterion |
| iHBs | intermolecular H-bonds |
| A | anion |
| PBS | phosphate-buffered saline |
| TRES | time-resolved emission spectra |
| D | donor |
| A | acceptor |
| BH | Benesi–Hildebrand |
| H1 | heptakis-[6-deoxy-6-(3-sulfanylpropanoic acid)]-βCD |
| H2 | heptakis-[6-deoxy-6-(2-sulfanylacetic acid)]-βCD |
| ESiPT | excited-state intermolecular PT |
| ESIPT | excited-state intramolecular PT |
References
- Alhmoud, J.F.; Woolley, J.F.; Al Moustafa, A.-E.; Malki, M.I. DNA Damage/Repair Management in Cancers. Cancers 2020, 12, 1050. [Google Scholar] [CrossRef] [PubMed]
- Bruzzese, F.; Rocco, M.; Castelli, S.; Di Gennaro, E.; Desideri, A.; Budillon, A. Synergistic antitumor effect between vorinostat and topotecan in small cell lung cancer cells is mediated by generation of reactive oxygen species and DNA damage-induced apoptosis. Mol. Cancer Ther. 2009, 8, 3075–3087. [Google Scholar] [CrossRef] [PubMed]
- Kollmannsberger, C.; Mross, K.; Jakob, A.; Kanz, L.; Bokemeyer, C. Topotecan—A Novel Topoisomerase I Inhibitor: Pharmacology and Clinical Experience. Oncology 1999, 56, 1–12. [Google Scholar] [CrossRef] [PubMed]
- Ahmad, T.; Gore, M. Review of the use of topotecan in ovarian carcinoma. Expert Opin. Pharmacother. 2004, 5, 2333–2340. [Google Scholar] [CrossRef]
- Mirchandani, D.; Hochster, H.; Hamilton, A.; Liebes, L.; Yee, H.; Curtin, J.P.; Lee, S.; Sorich, J.; Dellenbaugh, C.; Muggia, F.M. Phase I Study of Combined Pegylated Liposomal Doxorubicin with Protracted Daily Topotecan for Ovarian Cancer. Clin. Cancer Res. 2005, 11, 5912–5919. [Google Scholar] [CrossRef] [PubMed]
- Kurtz, J.E.; Freyer, G.; Joly, F.; Gladieff, L.; Kaminski, M.C.; Fabbro, M.; Floquet, A.; Hardy-Bessard, A.C.; Raban, N.; Ray-Coquard, I.; et al. Combined Oral Topotecan plus Carboplatin in Relapsed or Advanced Cervical Cancer: A GINECO Phase I-II Trial. Anticancer Res. 2012, 32, 1045. [Google Scholar] [PubMed]
- Saraf, S.; Jain, A.; Hurkat, P.; Jain, S.K. Topotecan Liposomes: A Visit from a Molecular to a Therapeutic Platform. Crit. Rev. Ther. Drug Carrier Syst. 2016, 33, 401–432. [Google Scholar] [CrossRef]
- Jeong, S.-H.; Jang, J.-H.; Lee, Y.-B. Pharmacokinetic Comparison of Three Different Administration Routes for Topotecan Hydrochloride in Rats. Pharmaceuticals 2020, 13, 231. [Google Scholar] [CrossRef] [PubMed]
- Jeong, S.-H.; Jang, J.-H.; Lee, Y.-B. Oral delivery of topotecan in polymeric nanoparticles: Lymphatic distribution and pharmacokinetics. J. Control. Release 2021, 335, 86–102. [Google Scholar] [CrossRef] [PubMed]
- Lee, J.; Kang, J.; Kwon, N.-Y.; Sivaraman, A.; Naik, R.; Jin, S.-Y.; Oh, A.R.; Shin, J.-H.; Na, Y.; Lee, K.; et al. Dual Inhibition of P-gp and BCRP Improves Oral Topotecan Bioavailability in Rodents. Pharmaceutics 2021, 13, 559. [Google Scholar] [CrossRef] [PubMed]
- Loos, W.J.; Stoter, G.; Verweij, J.; Schellens, J.H.M. Sensitive high-performance liquid chromatographic fluorescence assay for the quantitation of topotecan (SKF 104864-A) and its lactone ring-opened product (hydroxy acid) in human plasma and urine. J. Chromatogr. B Biomed. Appl. 1996, 678, 309–315. [Google Scholar] [CrossRef] [PubMed]
- Rivory, L.P.; Robert, J. Molecular, cellular, and clinical aspects of the pharmacology of 20(S)camptothecin and its derivatives. Pharmacol. Ther. 1995, 68, 269–296. [Google Scholar] [CrossRef]
- Rosing, H.; Doyle, E.; Davies, B.E.; Beijnen, J.H. High-performance liquid chromatographic determination of the novel antitumour drug topotecan and topotecan as the total of the lactone plus carboxylate forms, in human plasma. J. Chromatogr. B Biomed. Appl. 1995, 668, 107–115. [Google Scholar] [CrossRef] [PubMed]
- Wall, J.G.; Burris, H.A., III; Von Hoff, D.D.; Rodriguez, G.; Kneuper-Hall, R.; Shaffer, D.; O’Rourke, T.; Brown, T.; Weiss, G.; Clark, G.; et al. A phase I clinical and pharmacokinetic study of the topoisomerase I inhibitor topotecan (SK&F 104864) given as an intravenous bolus every 21 days. Anti Cancer Drugs 1992, 3, 337–345. [Google Scholar]
- Gillies, R.J.; Raghunand, N.; Garcia-Martin, M.L.; Gatenby, R.A. pH imaging. IEEE Eng. Med. Biol. Mag. 2004, 23, 57–64. [Google Scholar] [CrossRef] [PubMed]
- Hao, Y.-L.; Deng, Y.-J.; Chen, Y.; Hao, A.-J.; Zhang, Y.; Wang, K.-Z. In-vitro cytotoxicity, in-vivo biodistribution and anti-tumour effect of PEGylated liposomal topotecan†. J. Pharm. Pharmacol. 2005, 57, 1279–1287. [Google Scholar] [CrossRef]
- Drummond, D.C.; Noble, C.O.; Guo, Z.; Hayes, M.E.; Connolly-Ingram, C.; Gabriel, B.S.; Hann, B.; Liu, B.; Park, J.W.; Hong, K.; et al. Development of a highly stable and targetable nanoliposomal formulation of topotecan. J. Control. Release 2010, 141, 13–21. [Google Scholar] [CrossRef] [PubMed]
- Souza, L.G.; Silva, E.J.; Martins, A.L.L.; Mota, M.F.; Braga, R.C.; Lima, E.M.; Valadares, M.C.; Taveira, S.F.; Marreto, R.N. Development of topotecan loaded lipid nanoparticles for chemical stabilization and prolonged release. Eur. J. Pharm. Biopharm. 2011, 79, 189–196. [Google Scholar] [CrossRef]
- Kim, M.; Ock, K.; Cho, K.; Joo, S.-W.; Lee, S.Y. Live-cell monitoring of the glutathione-triggered release of the anticancer drug topotecan on gold nanoparticles in serum-containing media. Chem. Comm. 2012, 48, 4205–4207. [Google Scholar] [CrossRef]
- Xing, L.; Zheng, H.; Cao, Y.; Che, S. Coordination Polymer Coated Mesoporous Silica Nanoparticles for pH-Responsive Drug Release. Adv. Mater. 2012, 24, 6433–6437. [Google Scholar] [CrossRef]
- Patankar, N.A.; Waterhouse, D.; Strutt, D.; Anantha, M.; Bally, M.B. Topophore C: A liposomal nanoparticle formulation of topotecan for treatment of ovarian cancer. Invest. New Drugs 2013, 31, 46–58. [Google Scholar] [CrossRef] [PubMed]
- Du, X.; Shi, B.; Liang, J.; Bi, J.; Dai, S.; Qiao, S.Z. Developing Functionalized Dendrimer-Like Silica Nanoparticles with Hierarchical Pores as Advanced Delivery Nanocarriers. Adv. Mater. 2013, 25, 5981–5985. [Google Scholar] [CrossRef] [PubMed]
- Luo, G.-F.; Chen, W.-H.; Liu, Y.; Lei, Q.; Zhuo, R.-X.; Zhang, X.-Z. Multifunctional Enveloped Mesoporous Silica Nanoparticles for Subcellular Co-delivery of Drug and Therapeutic Peptide. Sci. Rep. 2014, 4, 6064. [Google Scholar] [CrossRef] [PubMed]
- di Nunzio, M.R.; Agostoni, V.; Cohen, B.; Gref, R.; Douhal, A. A “Ship in a Bottle” Strategy To Load a Hydrophilic Anticancer Drug in Porous Metal Organic Framework Nanoparticles: Efficient Encapsulation, Matrix Stabilization, and Photodelivery. J. Med. Chem. 2014, 57, 411–420. [Google Scholar] [CrossRef] [PubMed]
- Fugit, K.D.; Anderson, B.D. The role of pH and ring-opening hydrolysis kinetics on liposomal release of topotecan. J. Control. Release 2014, 174, 88–97. [Google Scholar] [CrossRef]
- Shen, B.; Zhao, K.; Ma, S.; Yuan, D.; Bai, Y. Topotecan-Loaded Mesoporous Silica Nanoparticles for Reversing Multi-Drug Resistance by Synergetic Chemoradiotherapy. Chem. Asian J. 2015, 10, 344–348. [Google Scholar] [CrossRef]
- Padhi, S.; Mirza, M.A.; Verma, D.; Khuroo, T.; Panda, A.K.; Talegaonkar, S.; Khar, R.K.; Iqbal, Z. Revisiting the nanoformulation design approach for effective delivery of topotecan in its stable form: An appraisal of its in vitro Behavior and tumor amelioration potential. Drug Deliv. 2016, 23, 2827–2837. [Google Scholar] [CrossRef]
- Martínez-Carmona, M.; Lozano, D.; Colilla, M.; Vallet-Regí, M. Selective topotecan delivery to cancer cells by targeted pH-sensitive mesoporous silica nanoparticles. RSC Adv. 2016, 6, 50923–50932. [Google Scholar] [CrossRef]
- Foulon, C.; Tedou, J.; Queruau Lamerie, T.; Vaccher, C.; Bonte, J.P.; Goossens, J.F. Assessment of the complexation degree of camptothecin derivatives and cyclodextrins using spectroscopic and separative methodologies. Tetrahedron: Asymmetry 2009, 20, 2482–2489. [Google Scholar] [CrossRef]
- Di Nunzio, M.R.; Wang, Y.; Douhal, A. Spectroscopy and dynamics of topotecan anti-cancer drug comprised within cyclodextrins. J. Photochem. Photobiol. A Chem. 2013, 266, 12–21. [Google Scholar] [CrossRef]
- Wu, H.; Peng, J.; Wang, S.; Xie, B.; Lei, L.; Zhao, D.; Nie, H. Fabrication of graphene oxide-β-cyclodextrin nanoparticle releasing doxorubicin and topotecan for combination chemotherapy. Mater. Technol. 2015, 30 (Suppl. S8), B242–B249. [Google Scholar] [CrossRef]
- Cheng, J.-G.; Yu, H.-J.; Chen, Y.; Liu, Y. Selective binding and controlled release of anticancer drugs by polyanionic cyclodextrins. Bioorg. Med. Chem. 2018, 26, 2287–2290. [Google Scholar] [CrossRef] [PubMed]
- Yoon, S.; Kim, Y.; Youn, Y.S.; Oh, K.T.; Kim, D.; Lee, E.S. Transferrin-Conjugated pH-Responsive γ-Cyclodextrin Nanoparticles for Antitumoral Topotecan Delivery. Pharmaceutics 2020, 12, 1109. [Google Scholar] [CrossRef] [PubMed]
- Crini, G.; Fourmentin, S.; Fenyvesi, É.; Torri, G.; Fourmentin, M.; Morin-Crini, N. Cyclodextrins, from molecules to applications. Environ. Chem. Lett. 2018, 16, 1361–1375. [Google Scholar] [CrossRef]
- Santos Braga, S. Cyclodextrins: Emerging Medicines of the New Millennium. Biomolecules 2019, 9, 801. [Google Scholar] [CrossRef]
- Davis, M.E.; Brewster, M.E. Cyclodextrin-based pharmaceutics: Past, present and future. Nat. Rev. Drug Discov. 2004, 3, 1023–1035. [Google Scholar] [CrossRef] [PubMed]
- Loftsson, T.; Duchêne, D. Cyclodextrins and their pharmaceutical applications. Int. J. Pharm. 2007, 329, 1–11. [Google Scholar] [CrossRef]
- Laza-Knoerr, A.L.; Gref, R.; Couvreur, P. Cyclodextrins for drug delivery. J. Drug Target. 2010, 18, 645–656. [Google Scholar] [CrossRef]
- Otero-Espinar, F.J.; Torres-Labandeira, J.J.; Alvarez-Lorenzo, C.; Blanco-Méndez, J. Cyclodextrins in drug delivery systems. J. Drug Deliv. Sci. Technol. 2010, 20, 289–301. [Google Scholar] [CrossRef]
- Kurkov, S.V.; Loftsson, T. Cyclodextrins. Int. J. Pharm. 2013, 453, 167–180. [Google Scholar] [CrossRef]
- Muankaew, C.; Loftsson, T. Cyclodextrin-Based Formulations: A Non-Invasive Platform for Targeted Drug Delivery. Basic Clin. Pharmacol. Toxicol. 2018, 122, 46–55. [Google Scholar] [CrossRef] [PubMed]
- Jansook, P.; Ogawa, N.; Loftsson, T. Cyclodextrins: Structure, physicochemical properties and pharmaceutical applications. Int. J. Pharm. 2018, 535, 272–284. [Google Scholar] [CrossRef]
- Mura, P. Advantages of the combined use of cyclodextrins and nanocarriers in drug delivery: A review. Int. J. Pharm. 2020, 579, 119181. [Google Scholar] [CrossRef]
- Tian, B.; Liu, Y.; Liu, J. Cyclodextrin as a magic switch in covalent and non-covalent anticancer drug release systems. Carbohydr. Polym. 2020, 242, 116401. [Google Scholar] [CrossRef] [PubMed]
- Tian, B.; Hua, S.; Liu, J. Cyclodextrin-based delivery systems for chemotherapeutic anticancer drugs: A review. Carbohydr. Polym. 2020, 232, 115805. [Google Scholar] [CrossRef] [PubMed]
- Herkstroeter, W.G.; Martic, P.A.; Evans, T.R.; Farid, S. Cyclodextrin inclusion complexes of 1-pyrenebutyrate. The role of coinclusion of amphiphiles. J. Am. Chem. Soc. 1986, 108, 3275–3280. [Google Scholar] [CrossRef]
- Lyapustina, S.A.; Metelitsa, A.V.; Bulgarevich, D.S.; Alexeev, Y.E.; Knyazhansky, M.I. The twisted-intramolecular-charge-transfer-state-forming compound as a guest for cyclodextrins. J. Photochem. Photobiol. A Chem. 1993, 75, 119–123. [Google Scholar] [CrossRef]
- Song, X.; Perlstein, J.; Whitten, D.G. Supramolecular Aggregates of Azobenzene Phospholipids and Related Compounds in Bilayer Assemblies and Other Microheterogeneous Media: Structure, Properties, and Photoreactivity1. J. Am. Chem. Soc. 1997, 119, 9144–9159. [Google Scholar] [CrossRef]
- Bortolus, P.; Marconi, G.; Monti, S.; Grabner, G.; Mayer, B. Structures and excited state properties of 2- and 3-hydroxybiphenyl complexed with cyclodextrins. Phys. Chem. Chem. Phys. 2000, 2, 2943–2949. [Google Scholar] [CrossRef]
- Monti, S.; Sortino, S. Photoprocesses of photosensitizing drugs within cyclodextrin cavities. Chem. Soc. Rev. 2002, 31, 287–300. [Google Scholar] [CrossRef]
- Douhal, A. Ultrafast Guest Dynamics in Cyclodextrin Nanocavities. Chem. Rev. 2004, 104, 1955–1976. [Google Scholar] [CrossRef] [PubMed]
- Sen, P.; Roy, D.; Mondal, S.K.; Sahu, K.; Ghosh, S.; Bhattacharyya, K. Fluorescence Anisotropy Decay and Solvation Dynamics in a Nanocavity: Coumarin 153 in Methyl β-Cyclodextrins. J. Phys. Chem. A 2005, 109, 9716–9722. [Google Scholar] [CrossRef] [PubMed]
- Das, P.; Chakrabarty, A.; Haldar, B.; Mallick, A.; Chattopadhyay, N. Effect of Cyclodextrin Nanocavity Confinement on the Photophysics of a β-Carboline Analogue: A Spectroscopic Study. J. Phys. Chem. B 2007, 111, 7401–7408. [Google Scholar] [CrossRef] [PubMed]
- Cohen, B.; Organero, J.A.; Santos, L.; Rodriguez Padial, L.; Douhal, A. Exploring the Ground and Excited States Structural Diversity of Levosimendan, a Cardiovascular Calcium Sensitizer. J. Phys. Chem. B 2010, 114, 14787–14795. [Google Scholar] [CrossRef]
- Martín, C.; Gil, M.; Cohen, B.; Douhal, A. Ultrafast Photodynamics of Drugs in Nanocavities: Cyclodextrins and Human Serum Albumin Protein. Langmuir 2012, 28, 6746–6759. [Google Scholar] [CrossRef]
- Anand, R.; Ottani, S.; Manoli, F.; Manet, I.; Monti, S. A close-up on doxorubicin binding to γ-cyclodextrin: An elucidating spectroscopic, photophysical and conformational study. RSC Adv. 2012, 2, 2346–2357. [Google Scholar] [CrossRef]
- Anand, R.; Manoli, F.; Manet, I.; Daoud-Mahammed, S.; Agostoni, V.; Gref, R.; Monti, S. β-Cyclodextrin polymer nanoparticles as carriers for doxorubicin and artemisinin: A spectroscopic and photophysical study. Photochem. Photobiol. Sci. 2012, 11, 1285–1292. [Google Scholar] [CrossRef]
- Kandoth, N.; Vittorino, E.; Sciortino, M.T.; Parisi, T.; Colao, I.; Mazzaglia, A.; Sortino, S. A Cyclodextrin-Based Nanoassembly with Bimodal Photodynamic Action. Chem. Eur. J. 2012, 18, 1684–1690. [Google Scholar] [CrossRef]
- Malanga, M.; Seggio, M.; Kirejev, V.; Fraix, A.; Di Bari, I.; Fenyvesi, E.; Ericson, M.B.; Sortino, S. A phototherapeutic fluorescent β-cyclodextrin branched polymer delivering nitric oxide. Biomater. Sci. 2019, 7, 2272–2276. [Google Scholar] [CrossRef]
- Alarcos, N.; Cohen, B.; Ziółek, M.; Douhal, A. Photochemistry and Photophysics in Silica-Based Materials: Ultrafast and Single Molecule Spectroscopy Observation. Chem. Rev. 2017, 117, 13639–13720. [Google Scholar] [CrossRef]
- Ogoshi, T.; Harada, A. Chemical Sensors Based on Cyclodextrin Derivatives. Sensors 2008, 8, 4961–4982. [Google Scholar] [CrossRef] [PubMed]
- Xu, M.; Wu, S.; Zeng, F.; Yu, C. Cyclodextrin Supramolecular Complex as a Water-Soluble Ratiometric Sensor for Ferric Ion Sensing. Langmuir 2010, 26, 4529–4534. [Google Scholar] [CrossRef] [PubMed]
- Hasegawa, T.; Kondo, Y.; Koizumi, Y.; Sugiyama, T.; Takeda, A.; Ito, S.; Hamada, F. A highly sensitive probe detecting low pH area of HeLa cells based on rhodamine B modified β-cyclodextrins. Bioorg. Med. Chem. 2009, 17, 6015–6019. [Google Scholar] [CrossRef] [PubMed]
- Wei, H.; Zheng, W.; Diakur, J.; Wiebe, L.I. Confocal laser scanning microscopy (CLSM) based evidence for cell permeation by mono-4-(N-6-deoxy-6-amino-β-cyclodextrin)-7-nitrobenzofuran (NBD-β-CyD). Int. J. Pharm. 2011, 403, 15–22. [Google Scholar] [CrossRef] [PubMed]
- Malanga, M.; Jicsinszky, L.; Fenyvesi, É. Rhodamine-labeled cyclodextrin derivatives. J. Drug Deliv. Sci. Technol. 2012, 22, 260–265. [Google Scholar] [CrossRef]
- Plazzo, A.P.; Höfer, C.T.; Jicsinszky, L.; Fenyvesi, É.; Szente, L.; Schiller, J.; Herrmann, A.; Müller, P. Uptake of a fluorescent methyl-β-cyclodextrin via clathrin-dependent endocytosis. Chem. Phys. Lipids 2012, 165, 505–511. [Google Scholar] [CrossRef]
- Agnes, M.; Thanassoulas, A.; Stavropoulos, P.; Nounesis, G.; Miliotis, G.; Miriagou, V.; Athanasiou, E.; Benkovics, G.; Malanga, M.; Yannakopoulou, K. Designed positively charged cyclodextrin hosts with enhanced binding of penicillins as carriers for the delivery of antibiotics: The case of oxacillin. Int. J. Pharm. 2017, 531, 480–491. [Google Scholar] [CrossRef]
- Rodriguez-Ruiz, V.; Maksimenko, A.; Salzano, G.; Lampropoulou, M.; Lazarou, Y.G.; Agostoni, V.; Couvreur, P.; Gref, R.; Yannakopoulou, K. Positively charged cyclodextrins as effective molecular transporters of active phosphorylated forms of gemcitabine into cancer cells. Sci. Rep. 2017, 7, 8353. [Google Scholar] [CrossRef]
- Mier, W.; Beijer, B.; Graham, K.; Hull, W.E. Fluorescent Somatostatin Receptor Probes for the Intraoperative Detection of Tumor Tissue with Long-Wavelength Visible Light. Bioorg. Med. Chem. 2002, 10, 2543–2552. [Google Scholar] [CrossRef]
- Chandran, S.S.; Dickson, K.A.; Raines, R.T. Latent Fluorophore Based on the Trimethyl Lock. J. Am. Chem. Soc. 2005, 127, 1652–1653. [Google Scholar] [CrossRef]
- Lavis, L.D.; Chao, T.-Y.; Raines, R.T. Fluorogenic Label for Biomolecular Imaging. ACS Chem. Biol. 2006, 1, 252–260. [Google Scholar] [CrossRef]
- Liu, W.; Howarth, M.; Greytak, A.B.; Zheng, Y.; Nocera, D.G.; Ting, A.Y.; Bawendi, M.G. Compact Biocompatible Quantum Dots Functionalized for Cellular Imaging. J. Am. Chem. Soc. 2008, 130, 1274–1284. [Google Scholar] [CrossRef]
- Yatzeck, M.M.; Lavis, L.D.; Chao, T.-Y.; Chandran, S.S.; Raines, R.T. A highly sensitive fluorogenic probe for cytochrome P450 activity in live cells. Bioorg. Med. Chem. Lett. 2008, 18, 5864–5866. [Google Scholar] [CrossRef]
- Beija, M.; Afonso, C.A.M.; Martinho, J.M.G. Synthesis and applications of Rhodamine derivatives as fluorescent probes. Chem. Soc. Rev. 2009, 38, 2410–2433. [Google Scholar] [CrossRef] [PubMed]
- Wang, R.; Yu, C.; Yu, F.; Chen, L.; Yu, C. Molecular fluorescent probes for monitoring pH changes in living cells. TrAC, Trends Anal. Chem. 2010, 29, 1004–1013. [Google Scholar] [CrossRef]
- Koide, Y.; Urano, Y.; Hanaoka, K.; Terai, T.; Nagano, T. Development of an Si-Rhodamine-Based Far-Red to Near-Infrared Fluorescence Probe Selective for Hypochlorous Acid and Its Applications for Biological Imaging. J. Am. Chem. Soc. 2011, 133, 5680–5682. [Google Scholar] [CrossRef] [PubMed]
- Culzoni, M.J.; Muñoz de la Peña, A.; Machuca, A.; Goicoechea, H.C.; Babiano, R. Rhodamine and BODIPY chemodosimeters and chemosensors for the detection of Hg2+, based on fluorescence enhancement effects. Anal. Methods. 2013, 5, 30–49. [Google Scholar] [CrossRef]
- Paul, S.; Bhuyan, S.; Mukhopadhyay, S.K.; Murmu, N.C.; Banerjee, P. Sensitive and Selective in Vitro Recognition of Biologically Toxic As(III) by Rhodamine Based Chemoreceptor. ACS Sustain. Chem. Eng. 2019, 7, 13687–13697. [Google Scholar] [CrossRef]
- Zhu, C.; Chen, Z.; Gao, S.; Goh, B.L.; Samsudin, I.B.; Lwe, K.W.; Wu, Y.; Wu, C.; Su, X. Recent advances in non-toxic quantum dots and their biomedical applications. Prog. Nat. Sci. Mater. Int. 2019, 29, 628–640. [Google Scholar] [CrossRef]
- Petropoulou, A.; Kralj, S.; Karagiorgis, X.; Savva, I.; Loizides, E.; Panagi, M.; Krasia-Christoforou, T.; Riziotis, C. Multifunctional Gas and pH Fluorescent Sensors Based on Cellulose Acetate Electrospun Fibers Decorated with Rhodamine B-Functionalised Core-Shell Ferrous Nanoparticles. Sci. Rep. 2020, 10, 367. [Google Scholar] [CrossRef]
- Panagopoulou, M.S.; Wark, A.W.; Birch, D.J.S.; Gregory, C.D. Phenotypic analysis of extracellular vesicles: A review on the applications of fluorescence. J. Extracell. Vesicles 2020, 9, 1710020. [Google Scholar] [CrossRef]
- Vitelli, M.; Budman, H.; Pritzker, M.; Tamer, M. Applications of flow cytometry sorting in the pharmaceutical industry: A review. Biotechnol. Prog. 2021, 37, e3146. [Google Scholar] [CrossRef]
- Panagiotakis, S.; Saridakis, E.; Malanga, M.; Mavridis, I.M.; Yannakopoulou, K. A Self-locked β-Cyclodextrin-rhodamine B Spirolactam with Photoswitching Properties. Chem. Asian J. 2022, 17, e202101282. [Google Scholar] [CrossRef] [PubMed]
- Chen, T.; He, B.; Tao, J.; He, Y.; Deng, H.; Wang, X.; Zheng, Y. Application of Förster Resonance Energy Transfer (FRET) technique to elucidate intracellular and In Vivo biofate of nanomedicines. Adv. Drug Deliv. Rev. 2019, 143, 177–205. [Google Scholar] [CrossRef]
- Gu, Y.; Lin, D.; Fei, X.; Chen, Y.; Wang, C.; Yang, Q.; Tang, Y. Labeling of Microthrix parvicella in situ: A novel FRET probe based on bisoctyl rhodamine B. Spectrochim. Acta A Mol. Biomol. Spectrosc. 2019, 213, 263–271. [Google Scholar] [CrossRef] [PubMed]
- Doll, F.; Keckeis, P.; Scheel, P.; Cölfen, H. Visualizing Cholesterol Uptake by Self-Assembling Rhodamine B-Labeled Polymer Inside Living Cells via FLIM-FRET Microscopy. Macromol. Biosci. 2020, 20, 1900081. [Google Scholar] [CrossRef]
- Yang, G.; Liu, Y.; Teng, J.; Zhao, C.-X. FRET Ratiometric Nanoprobes for Nanoparticle Monitoring. Biosensors 2021, 11, 505. [Google Scholar] [CrossRef]
- Van Der Meer, B.W.; Coker, G.; Chen, S.Y.S. Resonance Energy Transfer: Theory and Data; VCH: New York, NY, USA, 1994. [Google Scholar]
- Organero, J.A.; Tormo, L.; Douhal, A. Caging ultrafast proton transfer and twisting motion of 1-hydroxy-2-acetonaphthone. Chem. Phys. Lett. 2002, 363, 409–414. [Google Scholar] [CrossRef]
- Strel’tsov, S.A.; Grokhovskii, S.L.; Kudelina, I.A.; Oleinikov, V.A.; Zhuze, A.L. Interaction of Topotecan, DNA Topoisomerase I Inhibitor, with Double-Stranded Polydeoxyribonucleotides. 1. Topotecan Dimerization in Solution. Mol. Biol. 2001, 35, 365–373. [Google Scholar] [CrossRef]
- Di Nunzio, M.R.; Wang, Y.; Douhal, A. Structural Spectroscopy and Dynamics of Inter- and Intramolecular H-Bonding Interactions of Topotecan, a Potent Anticancer Drug, in Organic Solvents and in Aqueous Solution. J. Phys. Chem. B 2012, 116, 7522–7530. [Google Scholar] [CrossRef]
- Du, W. Towards new anticancer drugs: A decade of advances in synthesis of camptothecins and related alkaloids. Tetrahedron 2003, 59, 8649–8687. [Google Scholar] [CrossRef]
- Burke, T.G.; Mi, Z. Ethyl substitution at the 7 position extends the half-life of 10-hydroxycamptothecin in the presence of human serum albumin. J. Med. Chem. 1993, 36, 2580–2582. [Google Scholar] [CrossRef] [PubMed]
- Solntsev, K.M.; Sullivan, E.N.; Tolbert, L.M.; Ashkenazi, S.; Leiderman, P.; Huppert, D. Excited-State Proton Transfer Reactions of 10-Hydroxycamptothecin1. J. Am. Chem. Soc. 2004, 126, 12701–12708. [Google Scholar] [CrossRef]
- Ferreira, J.A.B.; Costa, S.M.B. Non-radiative decay in rhodamines: Role of 1:1 and 1:2 molecular complexation with β-cyclodextrin. J. Photochem. Photobiol. A Chem. 2005, 173, 309–318. [Google Scholar] [CrossRef]
- Bom, A.; Bradley, M.; Cameron, K.; Clark, J.K.; Van Egmond, J.; Feilden, H.; MacLean, E.J.; Muir, A.W.; Palin, R.; Rees, D.C.; et al. A novel concept of reversing neuromuscular block: Chemical encapsulation of rocuronium bromide by a cyclodextrin-based synthetic host. Angew. Chem. Int. Ed. 2002, 41, 265–270. [Google Scholar] [CrossRef]
- Matsuo, M.; Togawa, M.; Hirabaru, K.; Mochinaga, S.; Narita, A.; Adachi, M.; Egashira, M.; Irie, T.; Ohno, K. Effects of cyclodextrin in two patients with Niemann–Pick Type C disease. Mol. Genet. Metab. 2013, 108, 76–81. [Google Scholar] [CrossRef] [PubMed]
- Benkovics, G.; Malanga, M.; Fenyvesi, É. The ‘Visualized’ macrocycles: Chemistry and application of fluorophore tagged cyclodextrins. Int. J. Pharm. 2017, 531, 689–700. [Google Scholar] [CrossRef]
- Gonzalez, M.C.; McIntosh, A.R.; Bolton, J.R.; Weedon, A.C. Intramolecular photochemical electron transfer to acceptors in a β-cyclodextrin linked to a porphyrin. J. Chem. Soc. Chem. Commun. 1984, 17, 1138–1140. [Google Scholar] [CrossRef]
- Li, W.; Qu, J.; Du, J.; Ren, K.; Wang, Y.; Sun, J.; Hu, Q. Photoluminescent supramolecular hyperbranched polymer without conventional chromophores based on inclusion complexation. Chem. Comm. 2014, 50, 9584–9587. [Google Scholar] [CrossRef]
- Bai, L.; Yan, H.; Bai, T.; Feng, Y.; Zhao, Y.; Ji, Y.; Feng, W.; Lu, T.; Nie, Y. High Fluorescent Hyperbranched Polysiloxane Containing β-Cyclodextrin for Cell Imaging and Drug Delivery. Biomacromolecules 2019, 20, 4230–4240. [Google Scholar] [CrossRef]
- Zhou, W.-L.; Chen, Y.; Lin, W.; Liu, Y. Luminescent lanthanide–macrocycle supramolecular assembly. Chem. Comm. 2021, 57, 11443–11456. [Google Scholar] [CrossRef] [PubMed]
- Gu, Z.-Y.; Guo, D.-S.; Sun, M.; Liu, Y. Effective Enlargement of Fluorescence Resonance Energy Transfer of Poly-Porphyrin Mediated by β-Cyclodextrin Dimers. J. Org. Chem. 2010, 75, 3600–3607. [Google Scholar] [CrossRef] [PubMed]
- Shen, F.-F.; Chen, Y.; Dai, X.; Zhang, H.-Y.; Zhang, B.; Liu, Y.; Liu, Y. Purely organic light-harvesting phosphorescence energy transfer by β-cyclodextrin pseudorotaxane for mitochondria targeted imaging. Chem. Sci. 2021, 12, 1851–1857. [Google Scholar] [CrossRef] [PubMed]
- Wang, M.; Su, K.; Cao, J.; She, Y.; El-Aty, A.M.A.; Hacımüftüoğlu, A.; Wang, J.; Yan, M.; Hong, S.; Lao, S.; et al. “Off-On” non-enzymatic sensor for malathion detection based on fluorescence resonance energy transfer between β-cyclodextrin@Ag and fluorescent probe. Talanta 2019, 192, 295–300. [Google Scholar] [CrossRef] [PubMed]


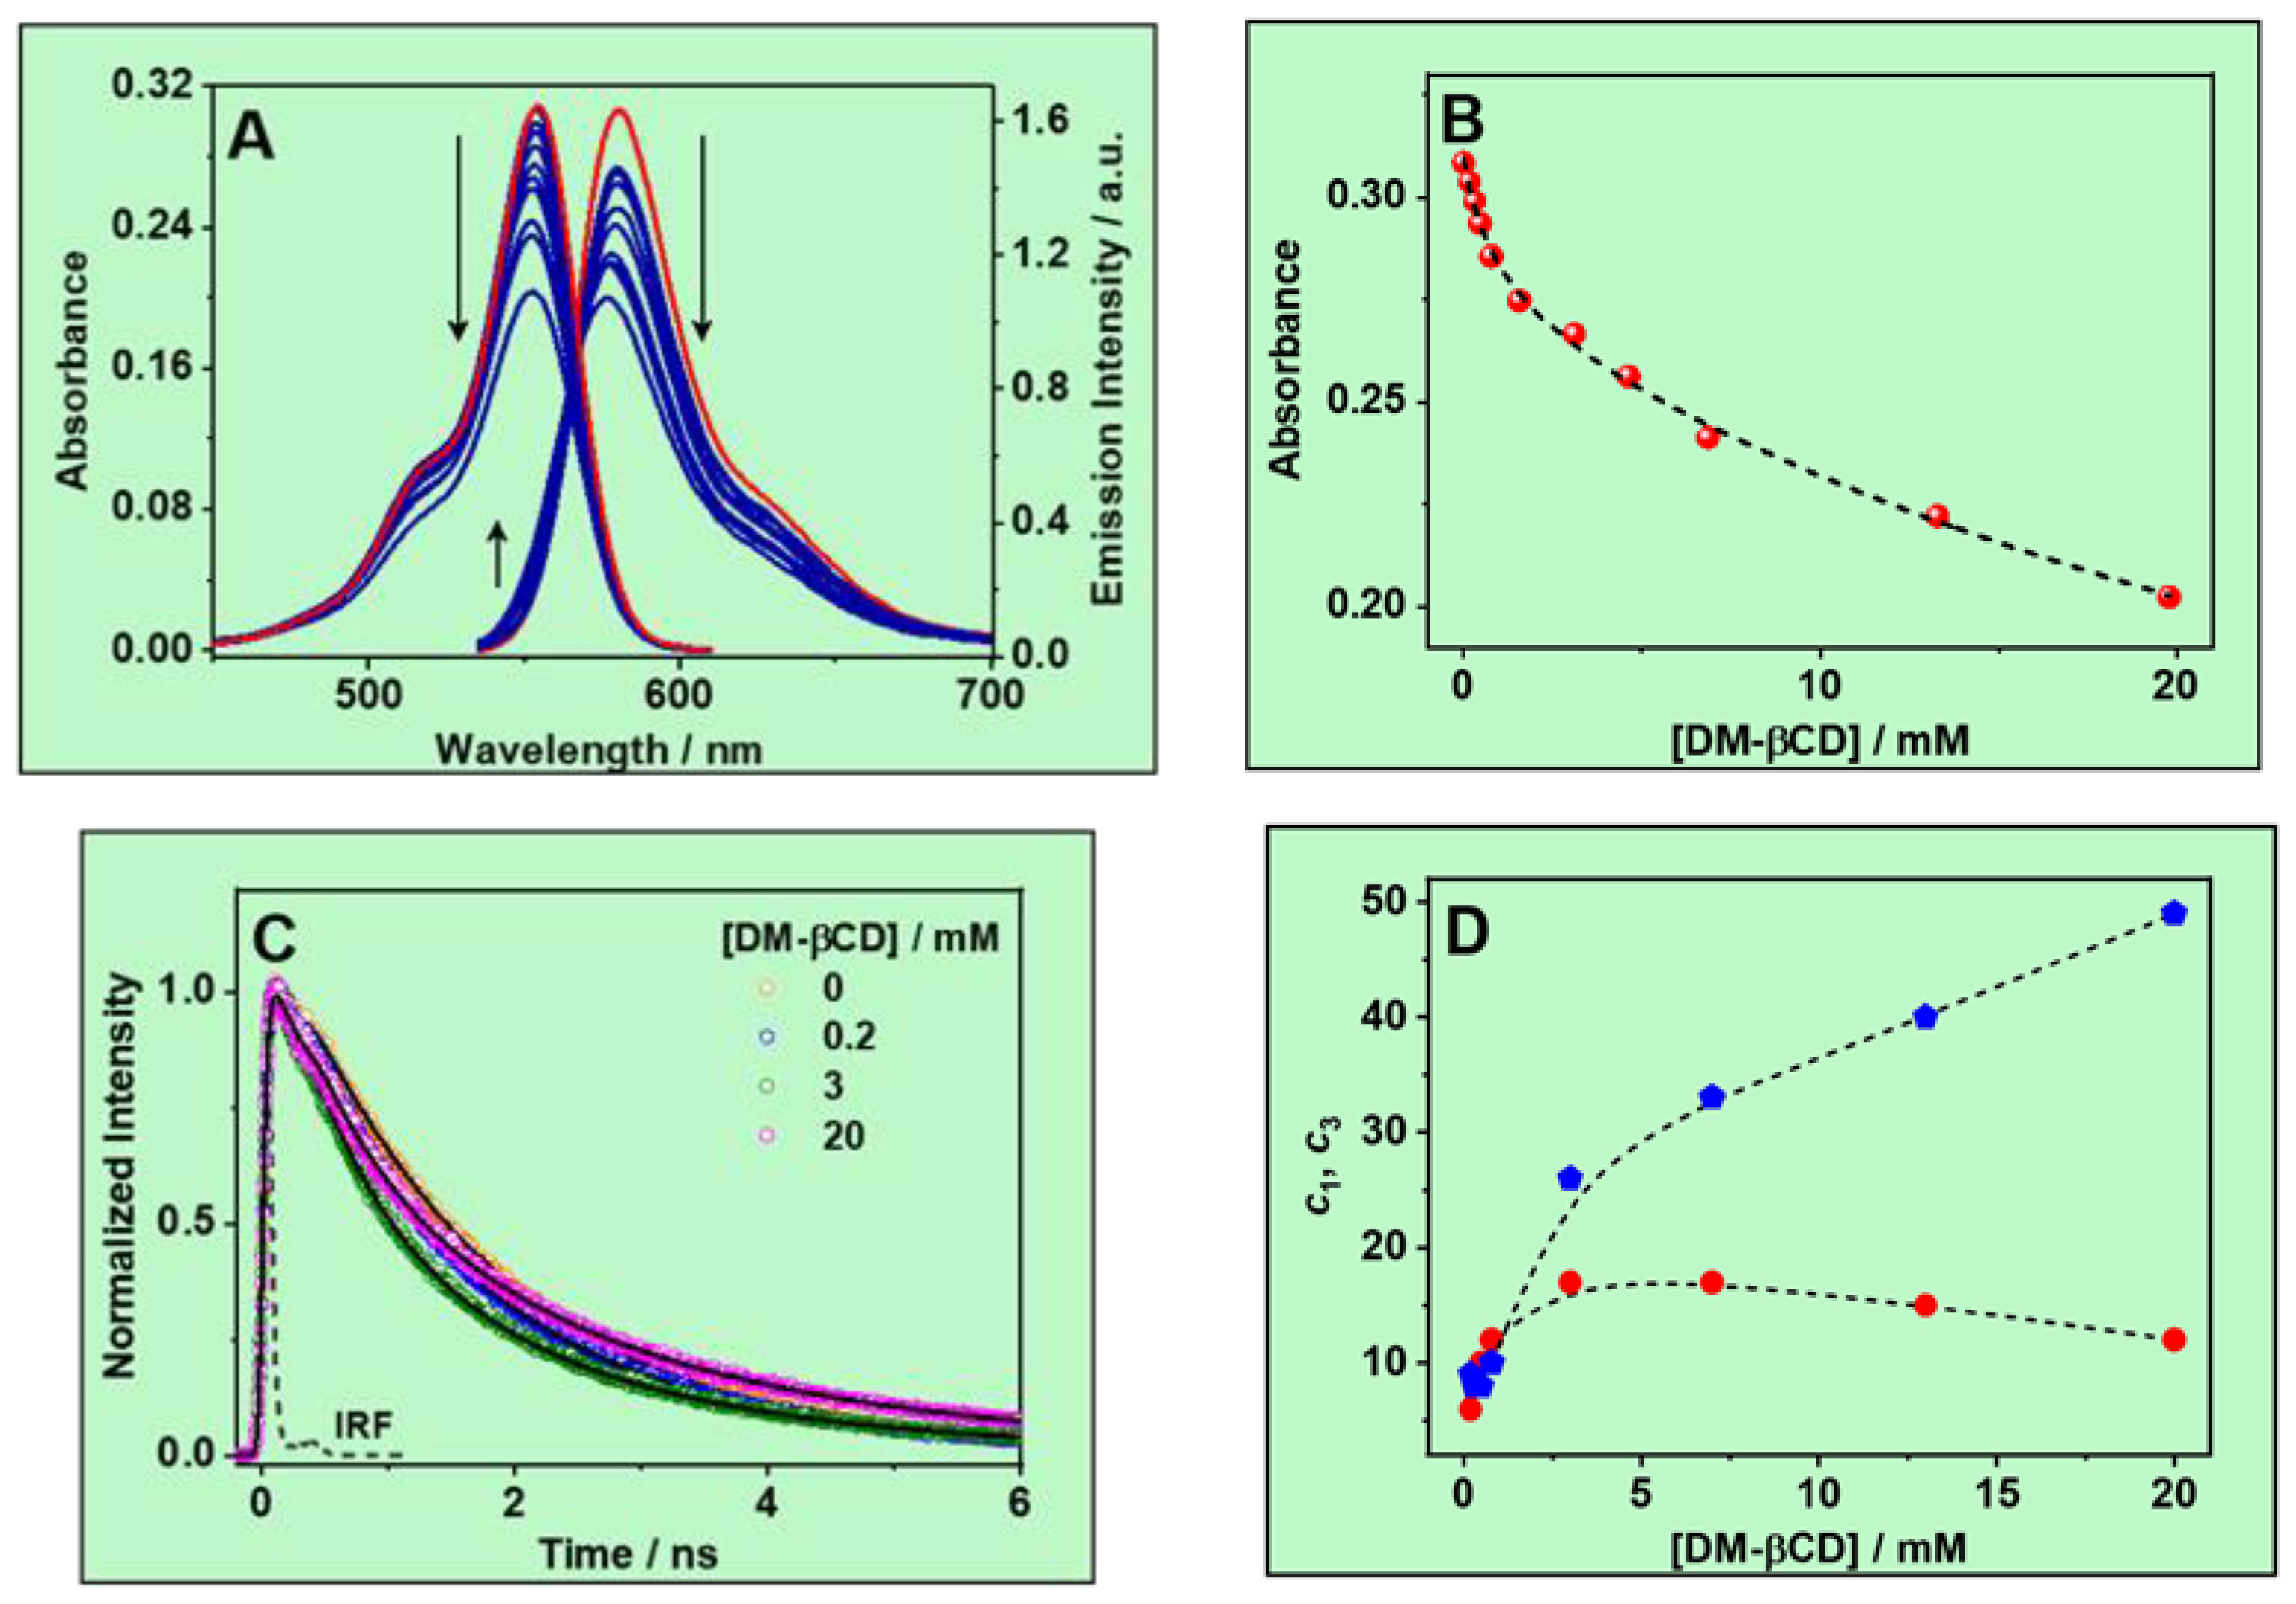
| (DM-βCD) /mM | τ1/ps ± 50 | a1 /% | c1 /% | τ2/ns ± 0.20 | a2 /% | c2 /% | τ3/ns ± 0.30 | a3 /% | c3 /% |
|---|---|---|---|---|---|---|---|---|---|
| 0 | 1.67 | 100 | 100 | ||||||
| 0.2 | 560 | 16 | 6 | 1.67 | 80 | 85 | 3.50 | 4 | 9 |
| 0.3 | 590 | 21 | 8 | 1.67 | 76 | 84 | 3.60 | 3 | 8 |
| 0.5 | 600 | 24 | 10 | 1.67 | 73 | 82 | 3.90 | 3 | 8 |
| 0.8 | 590 | 28 | 12 | 1.67 | 68 | 78 | 3.80 | 4 | 10 |
| 3 | 580 | 42 | 17 | 1.67 | 47 | 57 | 3.40 | 11 | 26 |
| 7 | 590 | 42 | 17 | 1.67 | 44 | 50 | 3.40 | 14 | 33 |
| 13 | 580 | 40 | 15 | 1.67 | 42 | 45 | 3.30 | 18 | 40 |
| 20 | 580 | 36 | 12 | 1.67 | 39 | 39 | 3.30 | 25 | 49 |
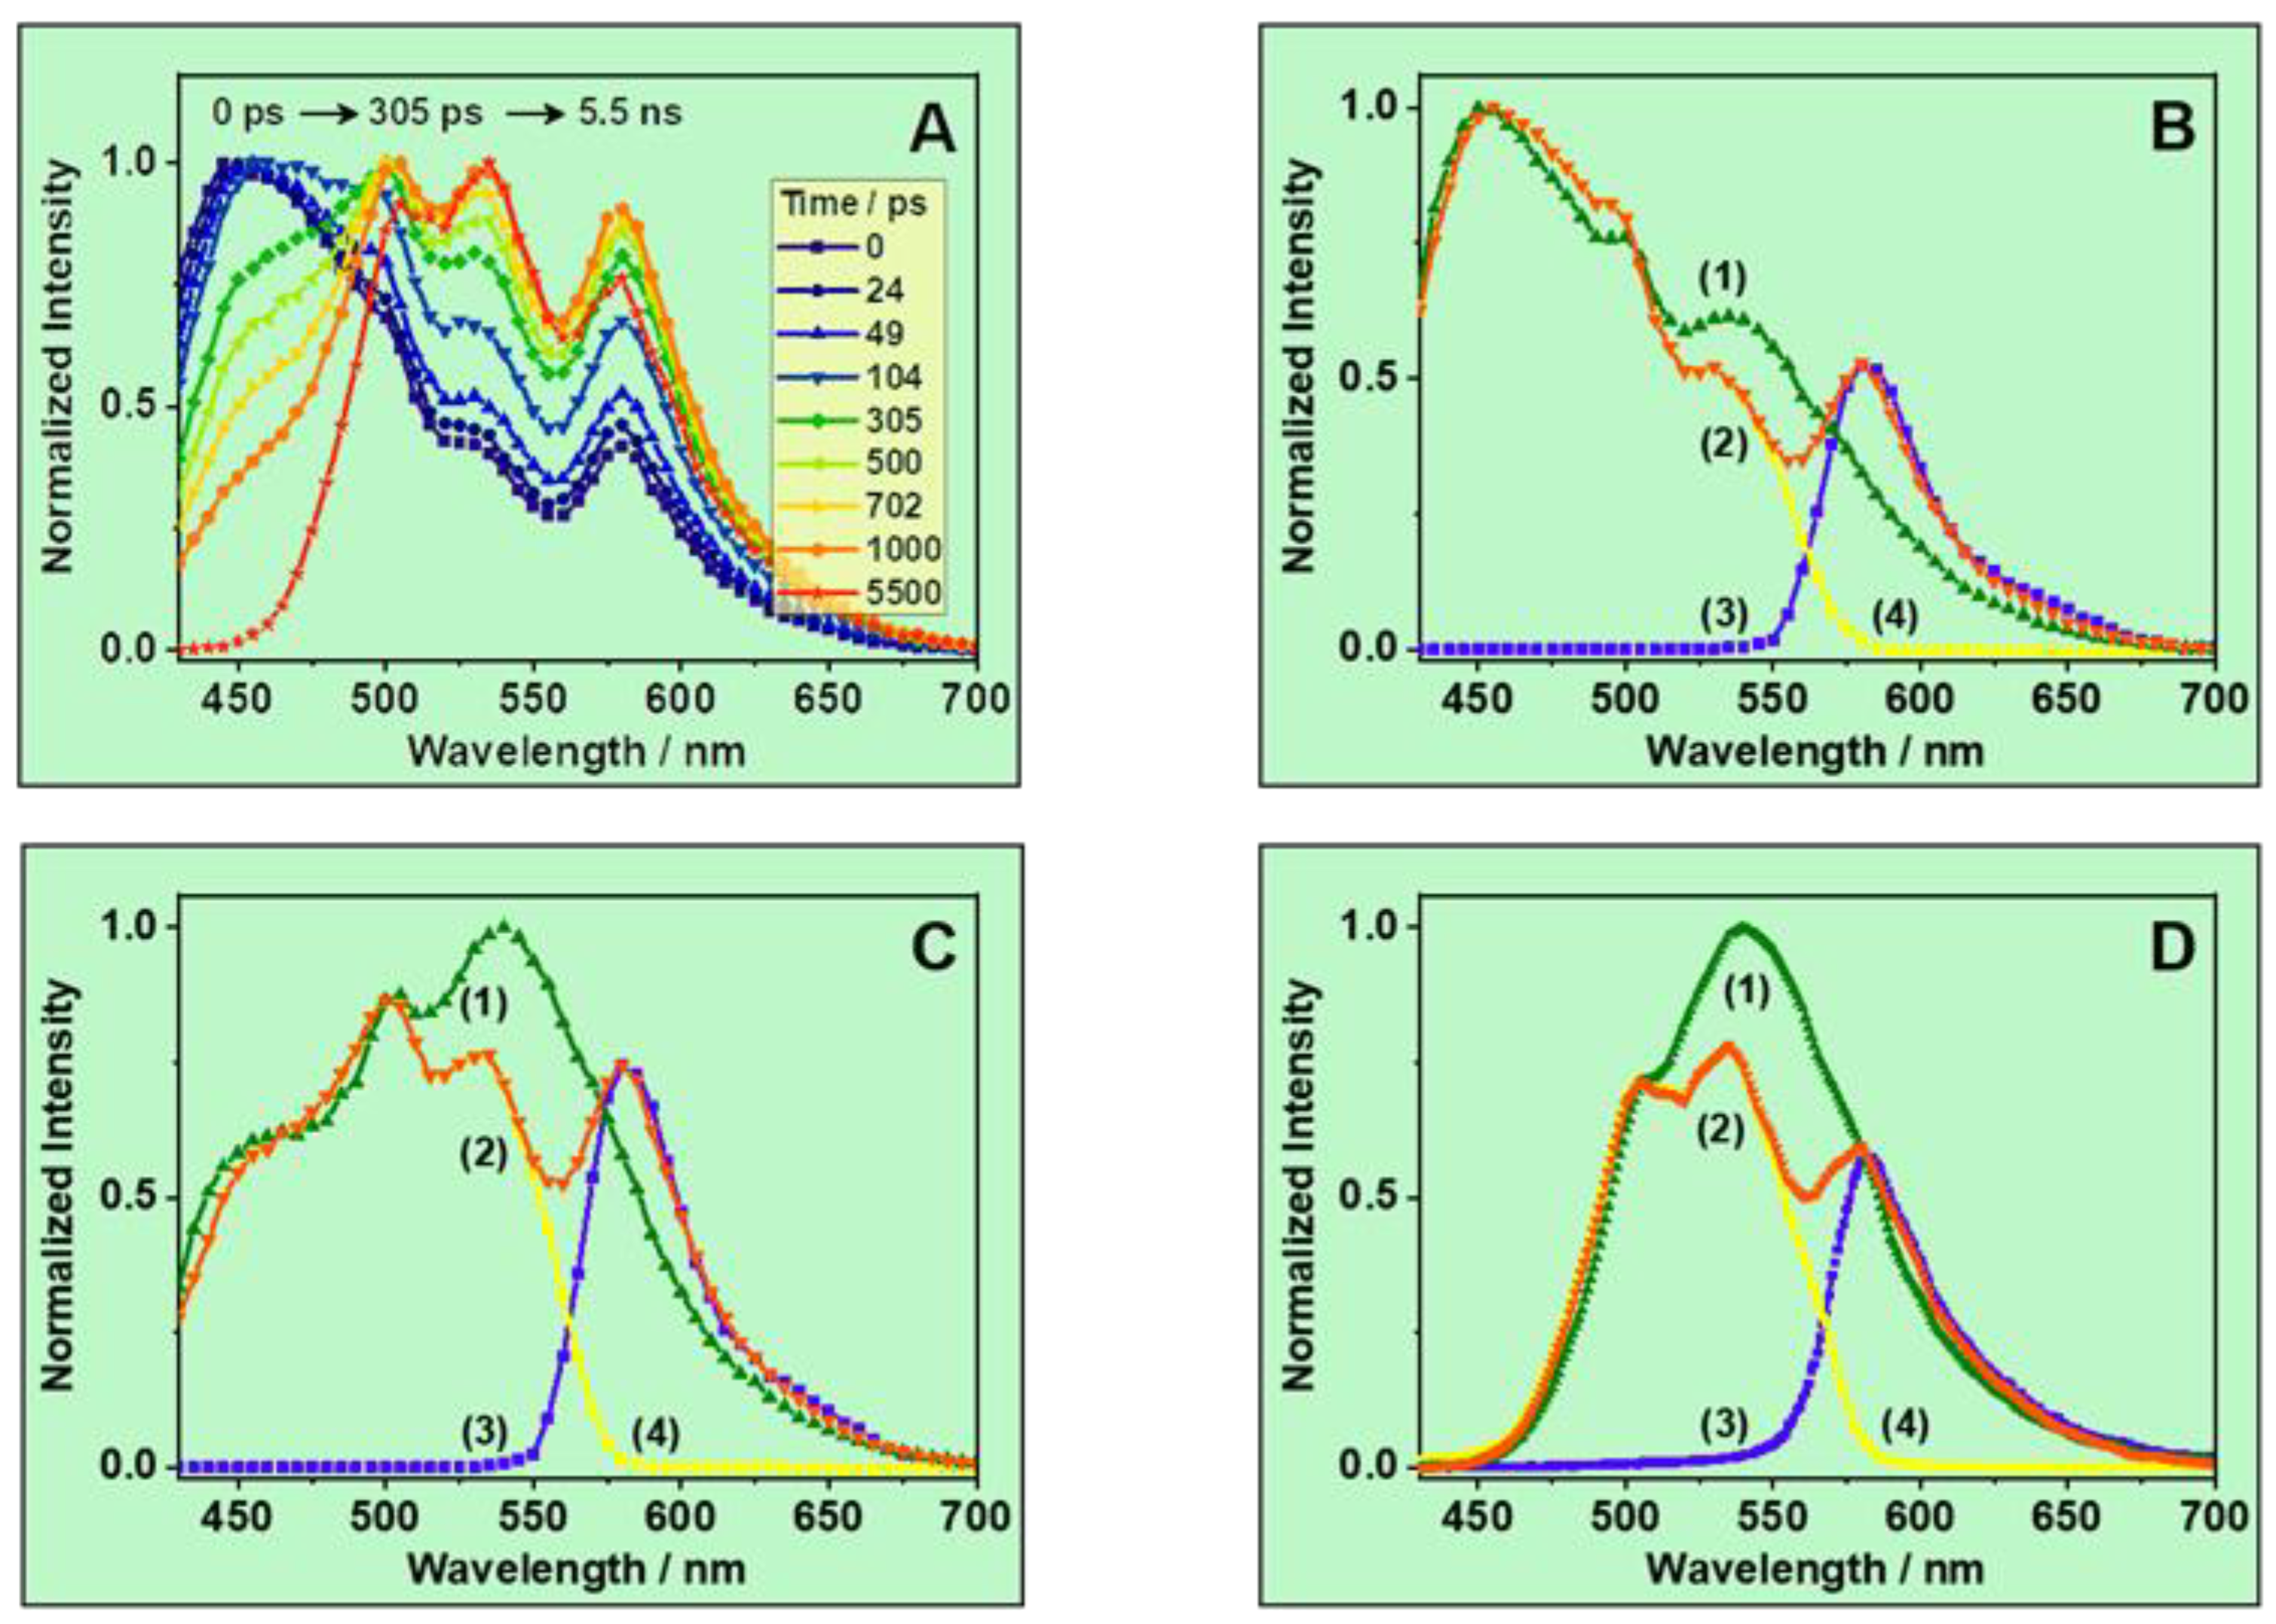
| λobs = 500 nm | ||||||||||||
| τ1/ps ± 15 | a1 /% | c1 /% | τ2/ps ± 50 | a2 /% | c2 /% | τ3/ns ± 0.2 | a3 /% | c3 /% | τ4/ns ± 0.3 | a4 /% | c4 /% | |
| 0.38 | 39 | 52 | 1 | 590 | 8 | 2 | - | - | - | 5.7 | 40 | 97 |
| 1.14 | 40 | 43 | 1 | 590 | 11 | 2 | - | - | - | 5.6 | 46 | 97 |
| 4.16 | 40 | 39 | 1 | 580 | 15 | 3 | - | - | - | 5.6 | 46 | 96 |
| λobs = 670 nm | ||||||||||||
| τ1/ps ± 15 | a1 /% | c1 /% | τ2/ps ± 50 | a2 /% | c2 /% | τ3/ns ± 0.2 | a3 /% | c3 /% | τ4/ns ± 0.3 | a4 /% | c4 /% | |
| 0.38 | 39 | −100 | −100 | 590 | 25 | 6 | 1.7 | 53 | 38 | 5.7 | 22 | 56 |
| 1.14 | 40 | −100 | −100 | 590 | 27 | 5 | 1.7 | 32 | 18 | 5.6 | 41 | 77 |
| 4.16 | 40 | −100 | −100 | 580 | 25 | 4 | 1.7 | 13 | 5 | 5.6 | 62 | 91 |
Disclaimer/Publisher’s Note: The statements, opinions and data contained in all publications are solely those of the individual author(s) and contributor(s) and not of MDPI and/or the editor(s). MDPI and/or the editor(s) disclaim responsibility for any injury to people or property resulting from any ideas, methods, instructions or products referred to in the content. |
© 2023 by the authors. Licensee MDPI, Basel, Switzerland. This article is an open access article distributed under the terms and conditions of the Creative Commons Attribution (CC BY) license (https://creativecommons.org/licenses/by/4.0/).
Share and Cite
Di Nunzio, M.R.; Douhal, A. Robust Inclusion Complex of Topotecan Comprised within a Rhodamine-Labeled β-Cyclodextrin: Competing Proton and Energy Transfer Processes. Pharmaceutics 2023, 15, 1620. https://doi.org/10.3390/pharmaceutics15061620
Di Nunzio MR, Douhal A. Robust Inclusion Complex of Topotecan Comprised within a Rhodamine-Labeled β-Cyclodextrin: Competing Proton and Energy Transfer Processes. Pharmaceutics. 2023; 15(6):1620. https://doi.org/10.3390/pharmaceutics15061620
Chicago/Turabian StyleDi Nunzio, Maria Rosaria, and Abderrazzak Douhal. 2023. "Robust Inclusion Complex of Topotecan Comprised within a Rhodamine-Labeled β-Cyclodextrin: Competing Proton and Energy Transfer Processes" Pharmaceutics 15, no. 6: 1620. https://doi.org/10.3390/pharmaceutics15061620