Article

Plasmid DNA Prime/Protein Boost Vaccination against Campylobacter jejuni in Broilers: Impact of Vaccine Candidates on Immune Responses and Gut Microbiota

1
GVB—Viral Genetics and Biosafety Unit, French Agency for Food, Environmental and Occupational Health & Safety (ANSES), 22440 Ploufragan, France
2
HQPAP—Unit of Hygiene and Quality of Poultry and Pork Products, French Agency for Food, Environmental and Occupational Health & Safety (ANSES), 22440 Ploufragan, France
3
UFR of Life Sciences Environment, University of Rennes 1, 35700 Rennes, France
4
SELEAC—Avian Breeding and Experimental Department, French Agency for Food, Environmental and Occupational Health & Safety (ANSES), 22440 Ploufragan, France
*
Author to whom correspondence should be addressed.
Pharmaceutics 2023, 15(5), 1397; https://doi.org/10.3390/pharmaceutics15051397
Submission received: 24 March 2023 / Revised: 25 April 2023 / Accepted: 27 April 2023 / Published: 3 May 2023
(This article belongs to the Special Issue Plasmid DNA for Gene Therapy and DNA Vaccine Applications)

Abstract

:
Campylobacter infections, traced to poultry products, are major bacterial foodborne zoonoses, and vaccination is a potential solution to reduce these infections. In a previous experimental trial using a plasmid DNA prime/recombinant protein boost vaccine regimen, two vaccine candidates (YP437 and YP9817) induced a partially protective immune response against Campylobacter in broilers, and an impact of the protein batch on vaccine efficacy was suspected. This new study was designed to evaluate different batches of the previously studied recombinant proteins (called YP437A, YP437P and YP9817P) and to enhance the immune responses and gut microbiota studies after a C. jejuni challenge. Throughout the 42-day trial in broilers, caecal Campylobacter load, specific antibodies in serum and bile, the relative expression of cytokines and β-defensins, and caecal microbiota were assessed. Despite there being no significant reduction in Campylobacter in the caecum of vaccinated groups, specific antibodies were detected in serum and bile, particularly for YP437A and YP9817P, whereas the production of cytokines and β-defensins was not significant. The immune responses differed according to the batch. A slight change in microbiota was demonstrated in response to vaccination against Campylobacter. The vaccine composition and/or regimen must be further optimised.

1. Introduction

Campylobacter infections are the major bacterial foodborne zoonoses in Europe, with 127,840 human cases in 2021 [1]. Campylobacteriosis also affects developing countries, where the need for control strategies against this disease is growing [2]. The major sources of infections in humans are contaminated poultry products, but not only those; Campylobacter was also isolated from other animal species such as sheep, goats, pigs, cattle, monkeys, horses, seals, cats, and dogs, as well as from insects [3,4,5]. These infections are most often characterised by gastroenteritis, but Campylobacter may also be associated with a severe demyelinating neuropathy known as Guillain–Barré syndrome [6]. Campylobacter jejuni, a gram-negative and microaerophilic bacterium, is the most frequently reported species, causing approximately 88% of cases [1].
In poultry, the major site of colonisation is the caecum, which can contain large quantities of C. jejuni (about 8 log10 CFU/g [7,8,9], but possibly up to approximately 11 log10 CFU/g [10,11]). A positive correlation is usually found between the counts of Campylobacter in the caeca of broilers and the counts of these bacteria on chicken carcasses after slaughter [8]. In Europe, the prevalence of Campylobacter in broiler batches and carcasses was estimated at 71.2% and 75.8%, respectively [12].
The high levels of avian intestinal Campylobacter loads impact the incidence of human campylobacteriosis. In fact, it was estimated that a 2 log10 to 3 log10 CFU/g reduction of these loads in broiler caeca may reduce the relative risk of these human diseases from 42% to 58% [13].
Vaccination could be one of the control strategies at the primary poultry level to reduce these infections. Multiple vaccine development strategies targeting Campylobacter have been investigated in poultry. Most include subunit vaccine delivery, whether with a vector or not, and whole-cell inactivated vaccines. Moreover, different routes of administration (intramuscular, oral, and in ovo) have been tested. However, these studies have produced inconsistent results on intestinal Campylobacter loads in poultry [14,15,16,17,18,19,20,21,22,23,24,25,26,27,28,29,30,31]; consequently, no effective vaccine is available to date.
Interactions between the chicken gut microbiota and immune system in response to Campylobacter colonisation were reported in recent studies [32,33,34,35]. More specifically, Campylobacter was recently associated with the production of β-defensins, which are host defence peptides (HDPs), and cytokines more specifically belonging to the Th17 pathway [32,36,37]. The results concerning microbiota composition have also proved inconsistent, though Campylobacter colonisation has mainly been associated with an increase in Firmicutes. Furthermore, recent studies have evaluated the impact of vaccination against Campylobacter on the chicken immune system and gut microbiota [15,17,18].
A previous study by our group identified, through reverse vaccinology from the Campylobacter genome, two proteins—WP_002869420.1, called here YP437 (a haemolysin secreting/activating protein of the ShlB/FhaC/HecB family), and WP_002868767, called here YP9817 (hypothetical protein)—as potential vaccine candidates [38]. In an initial in vivo trial using a plasmid DNA prime/recombinant protein boost vaccine regimen, these vaccine candidates induced a partial protective immunity in broilers, reflected through the production of antibodies against Campylobacter and significantly lower Campylobacter contamination in the vaccinated groups than in the placebo group. However, in a second trial, this reduction in Campylobacter colonisation was not confirmed, despite the production of antibodies. During this second trial, a high inter-individual variability of colonisation (including in the placebo group) was observed using the same batch of the YP437 protein [24]. In addition, another batch of YP9817 vaccine was used, suggesting that protein batches could have impacted vaccine efficacy for this antigen (for example, due to a different protein structure or purity) [24]. Therefore, these vaccine candidates required a reassessment.
The objectives here were to: (1) re-evaluate the protective potential of the vaccine candidates against Campylobacter colonisation using the DNA prime/protein boost protocol with new batches of recombinant proteins (YP437P and YP9817P) and a previous one (YP437A); (2) evaluate the impact of protein batch production on vaccine efficacy with the YP437A and YP437P batches; (3) study in greater depth the innate or specific immune responses generated and changes in gut microbiota after vaccination in order to potentially identify key parameters involved in protection.

2. Materials and Methods

2.1. DNA Vaccines Production

pcDNA3-based plasmids, encoding C. jejuni antigens (YP437 or YP9817) or not, were produced as described previously [24]. Briefly, transformed E. coli Top10 with pcDNA3-YP437, pcDNA3-YP9817, or pcDNA3 were cultured in LB broth + Amp. Thereafter, the plasmids were extracted and purified using the NucleoBond PC 10000 Endotoxin Free extraction kit (ThermoFisher Scientific, Villebon sur Yvette, France) according to the manufacturer’s instructions. Plasmid concentrations were assessed by measuring the optical density at 260 nm.
For each chicken, 150 µg of plasmid DNA was mixed with 25 µg of a phosphorothioate-based backbone unmethylated CpG ODN2007 (5′-TCGTCGTTGTCGTTTTGTCGTT-3′) (Sigma-Aldrich, Saint-Quentin-Fallavier, France) and then stored at −20 °C until vaccination.

2.2. Production of the Recombinant Protein Vaccines

Recombinant YP437A was of the same batch as the one used previously [24], whereas new batches of recombinant YP437P and YP9817P were produced by ProteoGenix (Schiltigheim, France). For each chicken, 100 µg of recombinant protein (or phosphate buffer saline (PBS) for the placebo group) was emulsified in MONTANIDE™ ISA 78 VG (37/63, w/w) (Seppic, La Garenne-Colombes, France) using an Ultra Turrax Tube drive (IKA®-Werke GmbH, Staufen, Germany) the day before vaccination according to the manufacturer’s recommendations. It was then stored at 4 °C.

2.3. Campylobacter Strain and Growth

The C. jejuni C97Anses640 strain, isolated at the ANSES laboratory in Ploufragan (France) from broilers and belonging to the ST−45 (sequence type) complex, was orally delivered to the chicken as a challenge experimental infection, as described previously [17]. Briefly, frozen bacteria were plated at 41.5 °C under microaerobic conditions (85% N2, 10% CO2 and 5% O2) twice on selective modified charcoal cefoperazone deoxycholate agar (mCCDA) (Thermo Fisher Diagnostics, Dardilly, France) for 48 h, then inoculated twice in Brucella broth (Becton Dickinson, Le Pont-de-Claix, France) for 24 h. The bacterial suspension was diluted to 5 log10 CFU/mL in tryptone salt broth (BioMérieux, Bruz, France) and titrated on mCCDA plates in 10-fold dilution series.

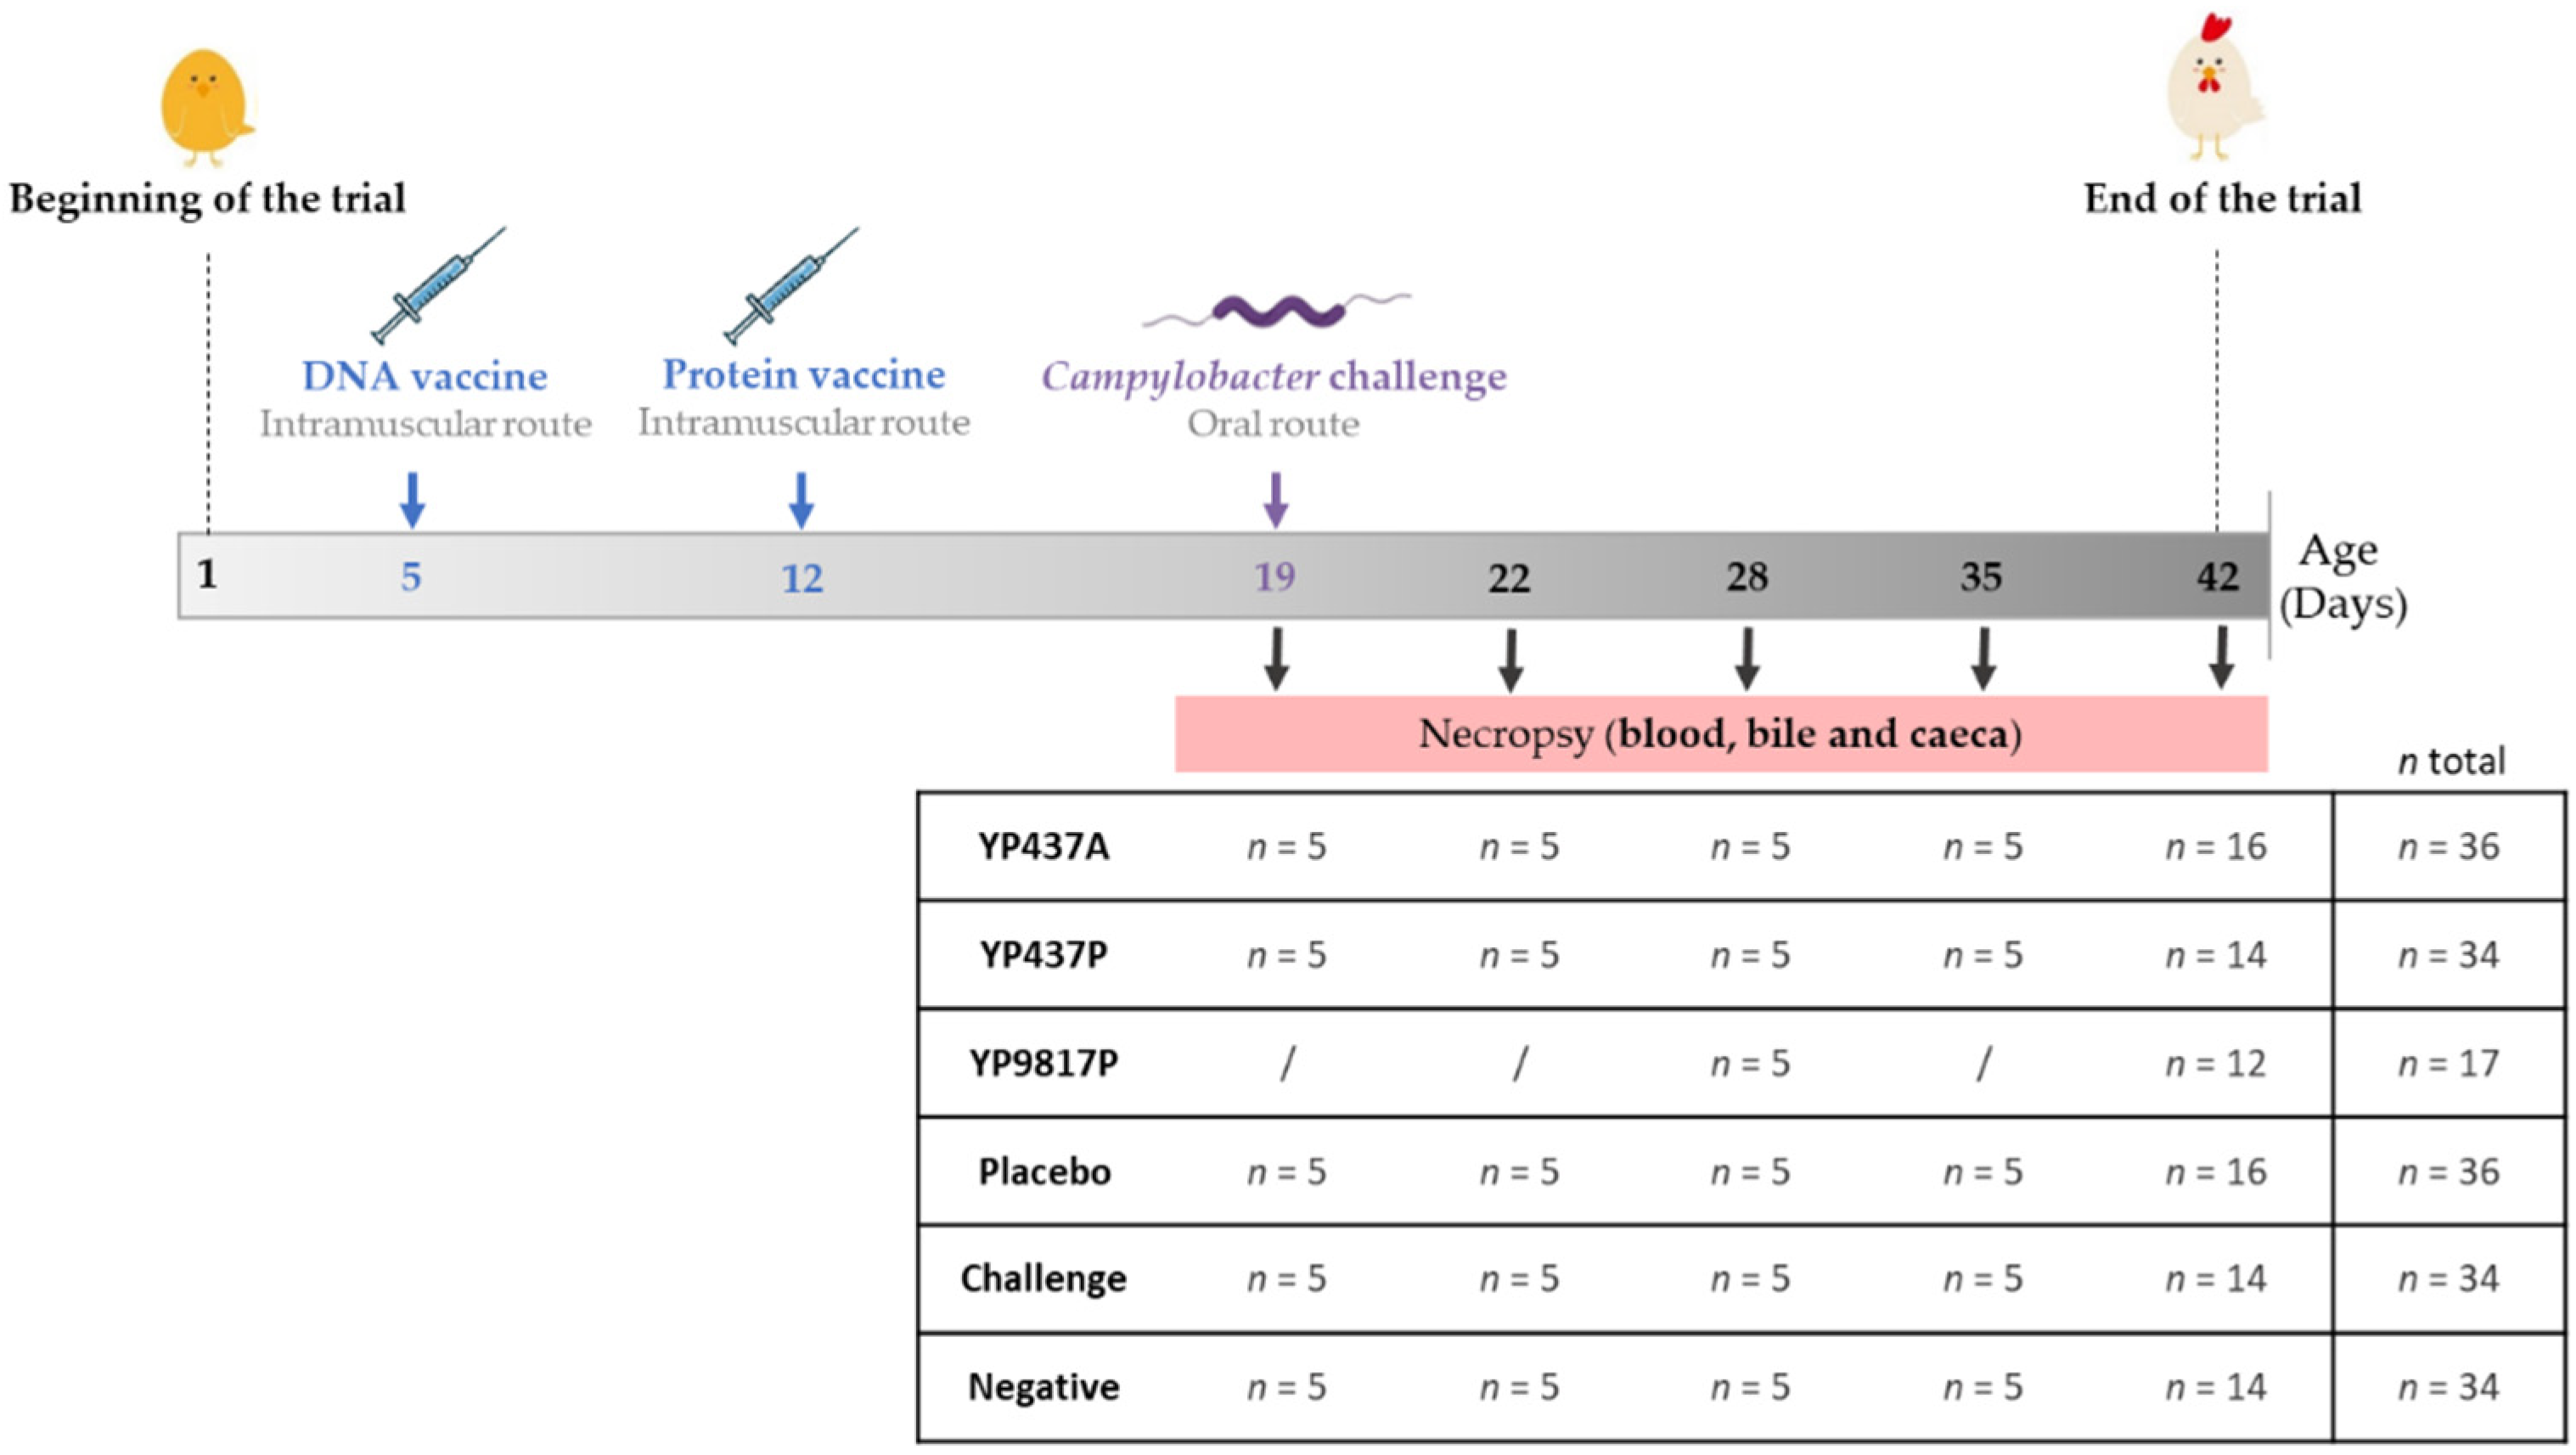
2.4. Avian Vaccine Experiment

The trial was carried out at the Animal Biosafety Level 2 facilities of ANSES’s Ploufragan Laboratory (France), an approved establishment for animal experimentation (No. E-22-745-1). It was authorised by the French Ministry of Higher Education, Research and Innovation (reference APAFIS#27000-2020082011122238 v2). A total of 191 day-of-hatch conventional Ross 308 broiler chicks (male and female) were purchased from a local hatchery. Before the trial, the absence of Campylobacter spp. was confirmed in husbandries (including the feeding and drinking systems) and in four chicks according to standard NF EN ISO 10272-1 (2017). The remaining chickens were randomly divided (from 17 to 36 chickens, Figure 1) into different groups (YP437A, YP437P, YP9817P, placebo, challenge and negative) and were kept in 3.42 m2 floor pens (1.85 × 1.85 m2). The YP9817P group was composed of fewer chickens because a smaller quantity of protein was available than for the other groups (YP437A and YP437P) after purification. Litter was composed of unused wood shavings. From day 1 to day 7, there were 23 h of lighting per day. Thereafter, the number of lighting hours per day was reduced to eighteen. The ambient temperature was gradually reduced from 32 °C on day 1 to 18 °C on day 35. The poultry diets were obtained from a commercial feed meal company. All the groups received a starter-grower diet from days 1 to 22, then a grower-finisher diet until day 42 (D42).
The chickens were intramuscularly injected, using 26 G needles with DNA vaccine on day 5 and protein vaccine on day 12. On D19, all the chickens except those in the negative group were orally challenged with 104 CFU of C. jejuni C97Anses640 [17,24]. At several time-points from D19 to D42, caeca, blood and bile were sampled and processed from 5 to 16 euthanised animals per group, as previously described [17], through to determination of the systemic humoral immune response, the mucosal immune response, and Campylobacter spp. enumeration and microbiota analysis, respectively. Each bird was individually weighed on days 5, 12, 19, and on each slaughter day. They were observed daily to detect any occurrence of adverse reactions. The experimental design is summarised in Figure 1.

2.5. Campylobacter Caecal Enumeration

Campylobacter enumerations were assessed in caecal contents as described previously [17]. Briefly, homogenised caeca were serially diluted 1:10 (w/v) up to dilution 10−6 in tryptone salt broth (Biomerieux, Craponne, France) and plated on mCCDA using easySpiral (Interscience, Saint-Nom-la-Bretèche, France), an automatic plater. After incubation of the plates for 48 h at 41.5 °C under microaerobic conditions, typical Campylobacter colonies were enumerated and converted to log10 CFU/g. The detection limit for enumeration of Campylobacter was 2 log10 CFU/g of caecal content. One mL of the 10−1 dilution of caecal content was centrifuged (10,000× g, 10 min) and the pellet was stored at −70 °C until microbiota analysis.

2.6. Specific Serum (IgY) and Bile (IgA) Antibodies Levels against Vaccine Antigens Determined by ELISAs

The levels of specific antibodies against YP437A, YP437P, and YP9817P proteins in vaccinated groups and control groups in serum and bile were measured by ELISA as in the previous study [17], but the technic was adapted to each vaccine antigen. Briefly, 96-well Maxisorp® plates coated with 100 µL of individual purified protein per well were successively incubated with diluted serum or diluted bile and diluted goat anti-chicken IgY-horseradish peroxidase (HRP) antibodies (Abcam, Paris, France), or diluted goat anti-chicken IgA-HRP (Abcam, Paris, France), respectively (according to the concentrations or dilutions indicated in Table 1). After incubation with the HRP substrate (o-phenylenediamine dihydrochloride in citrate buffer containing hydrogen peroxide), 1 M of H2SO4 was added. The optical densities were then measured at 490 nm using the Infinite 200 PRO Nanoquant (Tecan, Lyon, France). Each sample was measured in duplicate.

2.7. Total RNA Extraction and Relative Cytokine and β-Defensin Expressions Determined by Relative RT-qPCR

Total RNA was extracted from caecal tissues using an Agencourt® RNAdvance™ Tissue kit (Beckman coulter, Brea, CA, USA) with magnetic beads according to the manufacturer’s protocol with modifications, as described previously [17]. Then, the eluted RNA was processed with the Turbo DNA-free™ kit (Thermo Fisher Scientific, Vilnius, Lithuania) and quantified using the Qubit RNA high sensitivity assay kit (Life Technologies, Saint-Aubin, France) with a Qubit 2.0 fluorometer (Life Technologies, Saint-Aubin, France). Some RNA samples were checked for quality and integrity by capillary electrophoresis using a fragment analyser system (Agilent, Les Ulis, France).
Total RNA (320 ng) was reverse-transcribed into cDNA using the High-capacity cDNA Reverse Transcription kit (Thermo Fisher Scientific, Villebon sur Yvette, France) according to the manufacturer’s instructions.
Quantitative PCR (qPCR) reactions were performed on a cDNA obtained from 4 ng of total RNA in duplicate using the SYBR Green Master mix (Thermo Fisher Scientific, Villebon sur Yvette, France) and the 7500 real-time PCR system (Applied Biosystems, Villebon sur Yvette, France) as described previously [17]. The primers used for β-actin, interferon (IFN)-γ, interleukin (IL)8 like (L)1, IL8L2, IL-1β, IL-4, IL-10, IL-17A, host defence peptide avian β-defensins 10 (AvBD10), and AvBD12 amplifications have been previously described [17], and the primers for IL-6 and glyceraldehyde 3-phosphate dehydrogenase (GAPDH) are presented in Table 2. Specific primers for GAPDH were designed using Primer Express® (Thermo Fisher Scientific, Villebon sur Yvette, France) software. qPCR on the total RNA was performed to check that there was no residual genomic DNA in each sample. PCR efficiency, evaluated using the standard curve slope, ranged from 90 to 110%. The results were normalised with the reference genes β-actin and GAPDH as already used [39,40]. Statistical tests were performed using the mean of duplicates of 2−ΔCt data for each gene between the two reference genes [17,32,41]. The gene expression, represented by delta Ct, corresponds to the average of the differences between the duplicate Ct for each gene and the duplicate Ct for each of the two reference genes (GAPDH and β-actin).

2.8. Statistical Analyses

R software (version 4.0.3) was used for statistical analysis [43]. To compare vaccinated groups and control groups, an ANOVA parametric test was used when the normality and homogeneity criteria of the variances had been previously validated (checked by the Shapiro–Wilk normality test and Bartlett’s test, respectively) followed by the Tukey test; otherwise, the non-parametric Kruskall-Wallis test was used followed by the Wilcoxon test. A p-value lower or equal to 0.05 (p ≤ 0.05) was considered statistically significant.

2.9. Caecal Microbiota Diversity Analysis

2.9.1. Bacterial DNA Extraction

Bacterial DNA was isolated from caecal pellets prepared in part 2.5 using the NucleoMag Tissue Kit (Macherey-Nagel, Hoerdt, France), as described previously [17], and using caecal samples randomly chosen from the different groups. Briefly, these pellets were resuspended in 500 µL of T1 lysis buffer and mechanically homogenized by adding one stainless-steel 5 mm bead (Qiagen, Courtaboeuf, France), using the Star Beater (3 min–30 Hz) (VWR, Fontenay-sous-Bois, France). Proteinase K (Macherey Nagel, Hoerdt, France) was added, and the suspension was heated 30 min at 70 °C. After centrifugation (2 min at 13,000× g), DNA was extracted into standard 96-well plates from 225 µL of supernatant using the KingFisher Duo Prime instrument (Thermo Fisher Scientific, Villebon sur Yvette, France). A negative extraction control was included in each plate. DNA concentrations were estimated using the Qubit dsDNA High Sensitivity Assay Kit (Thermo Fisher Scientific, Illkirch-Graffenstaden, France) and a Qubit 2.0 Fluorometer (Life Technologies, Saint-Aubin, France). The DNA extracts were stored at −20 °C until sequencing.

2.9.2. V3/V4 Variable Region of the 16S Ribosomal Genes Sequencing

Bacterial genomic DNA was PCR-amplified using a primer set covering the V3-V4 variable regions of the 16S rDNA gene (forward primer: 5′-TCGTCGGCAGCGTCAGATGTGTATAAGAGACAG-3′; reverse primer: 5′-GTCTCGTGGGCTCGGAGATGTGTATAAGAGACAG-3′) to obtain an amplicon size of about 460 bp (15044223 Rev B adapted). Amplicons were sequenced using the 2 × 300 bp paired-end sequencing strategy, which was using an Illumina MiSeq sequencer with the Illumina MiSeq reagent kit 600 version 3, according to the Illumina 16S metagenomic library preparation protocol (15044223 Rev B adapted) and the MiSeq system denature and dilute libraries guide (15039740–3 December 2017 adapted).

2.9.3. Sequence Analyses

Sequences were processed using FROGS (Version 4.0.1) [44], a galaxy-supported pipeline. Briefly, paired-end reads were merged using VSEARCH, and sequences with ambiguous bases, unexpected lengths (<380 or >500 nucleotides) or with at least one primer sequence at 3′- and/or 5′-ends that did not completely correspond to the original primer sequences were removed before dereplication. The sequences were next clustered into operational taxonomic units (OTUs) using SWARM, and following FROGS guidelines, chimeras were removed using VSEARCH combined with a cross-sample validation step. OTUs with an abundance below 5 × 10⁻⁵ and present in fewer than 12 samples were removed, and the BLAST algorithm was used for taxonomic assignment against the SILVA 16S database (version 132 filtered at a pintail score of 80).

2.9.4. Statistical Analyses of the Diversity and Structure of Caecal Microbiota

Diversity and structure of caecal microbiota statistical analyses were performed using the phyloseq R package implemented in FROGS. The richness represents the number of OTUs present in a sample (observed richness). Total richness is estimated by the Chao 1 richness index (observed richness and not observed unknown number of species present in the community). The Shannon and InvSimpson indices were used to describe diversity in samples and to take into account richness and evenness (Table S1). The effect of the vaccination and Campylobacter colonisation on these indices was investigated using an ANOVA followed by the Tukey test. The impact of vaccination on microbiota diversity and structure was also investigated. A weighted UniFrac (wUniFrac) distance matrix, taking into account the relative abundance of OTUs shared between samples, was calculated after data rarefaction and plotted using multidimensional scaling (MDS) to investigate the structure of the bacterial community. An ADONIS pairwise test was used to check significance. The groups’ relative abundance of the major phyla and nine main genera was compared with the non-parametric Kruskall-Wallis test. Significant differences (p ≤ 0.05) between groups were estimated using the Wilcoxon test. To identify and visualise whether taxa with differential abundance (Table S2) were statistically different between groups, the linear discriminant analysis (LDA) effect size (LEfSe) method was applied with an LDA > 2.

3. Results

3.1. Clinical Observations and Body Weight

No adverse reactions were observed after each vaccination or inoculation. Results showed that chicken growth was unaffected by vaccinations (including the placebo) and/or the challenge, as there was no difference in mean body weight between each group tested from D5 to D42 compared with the negative group (p > 0.05) (except for the placebo group only on D19) (Table 3).

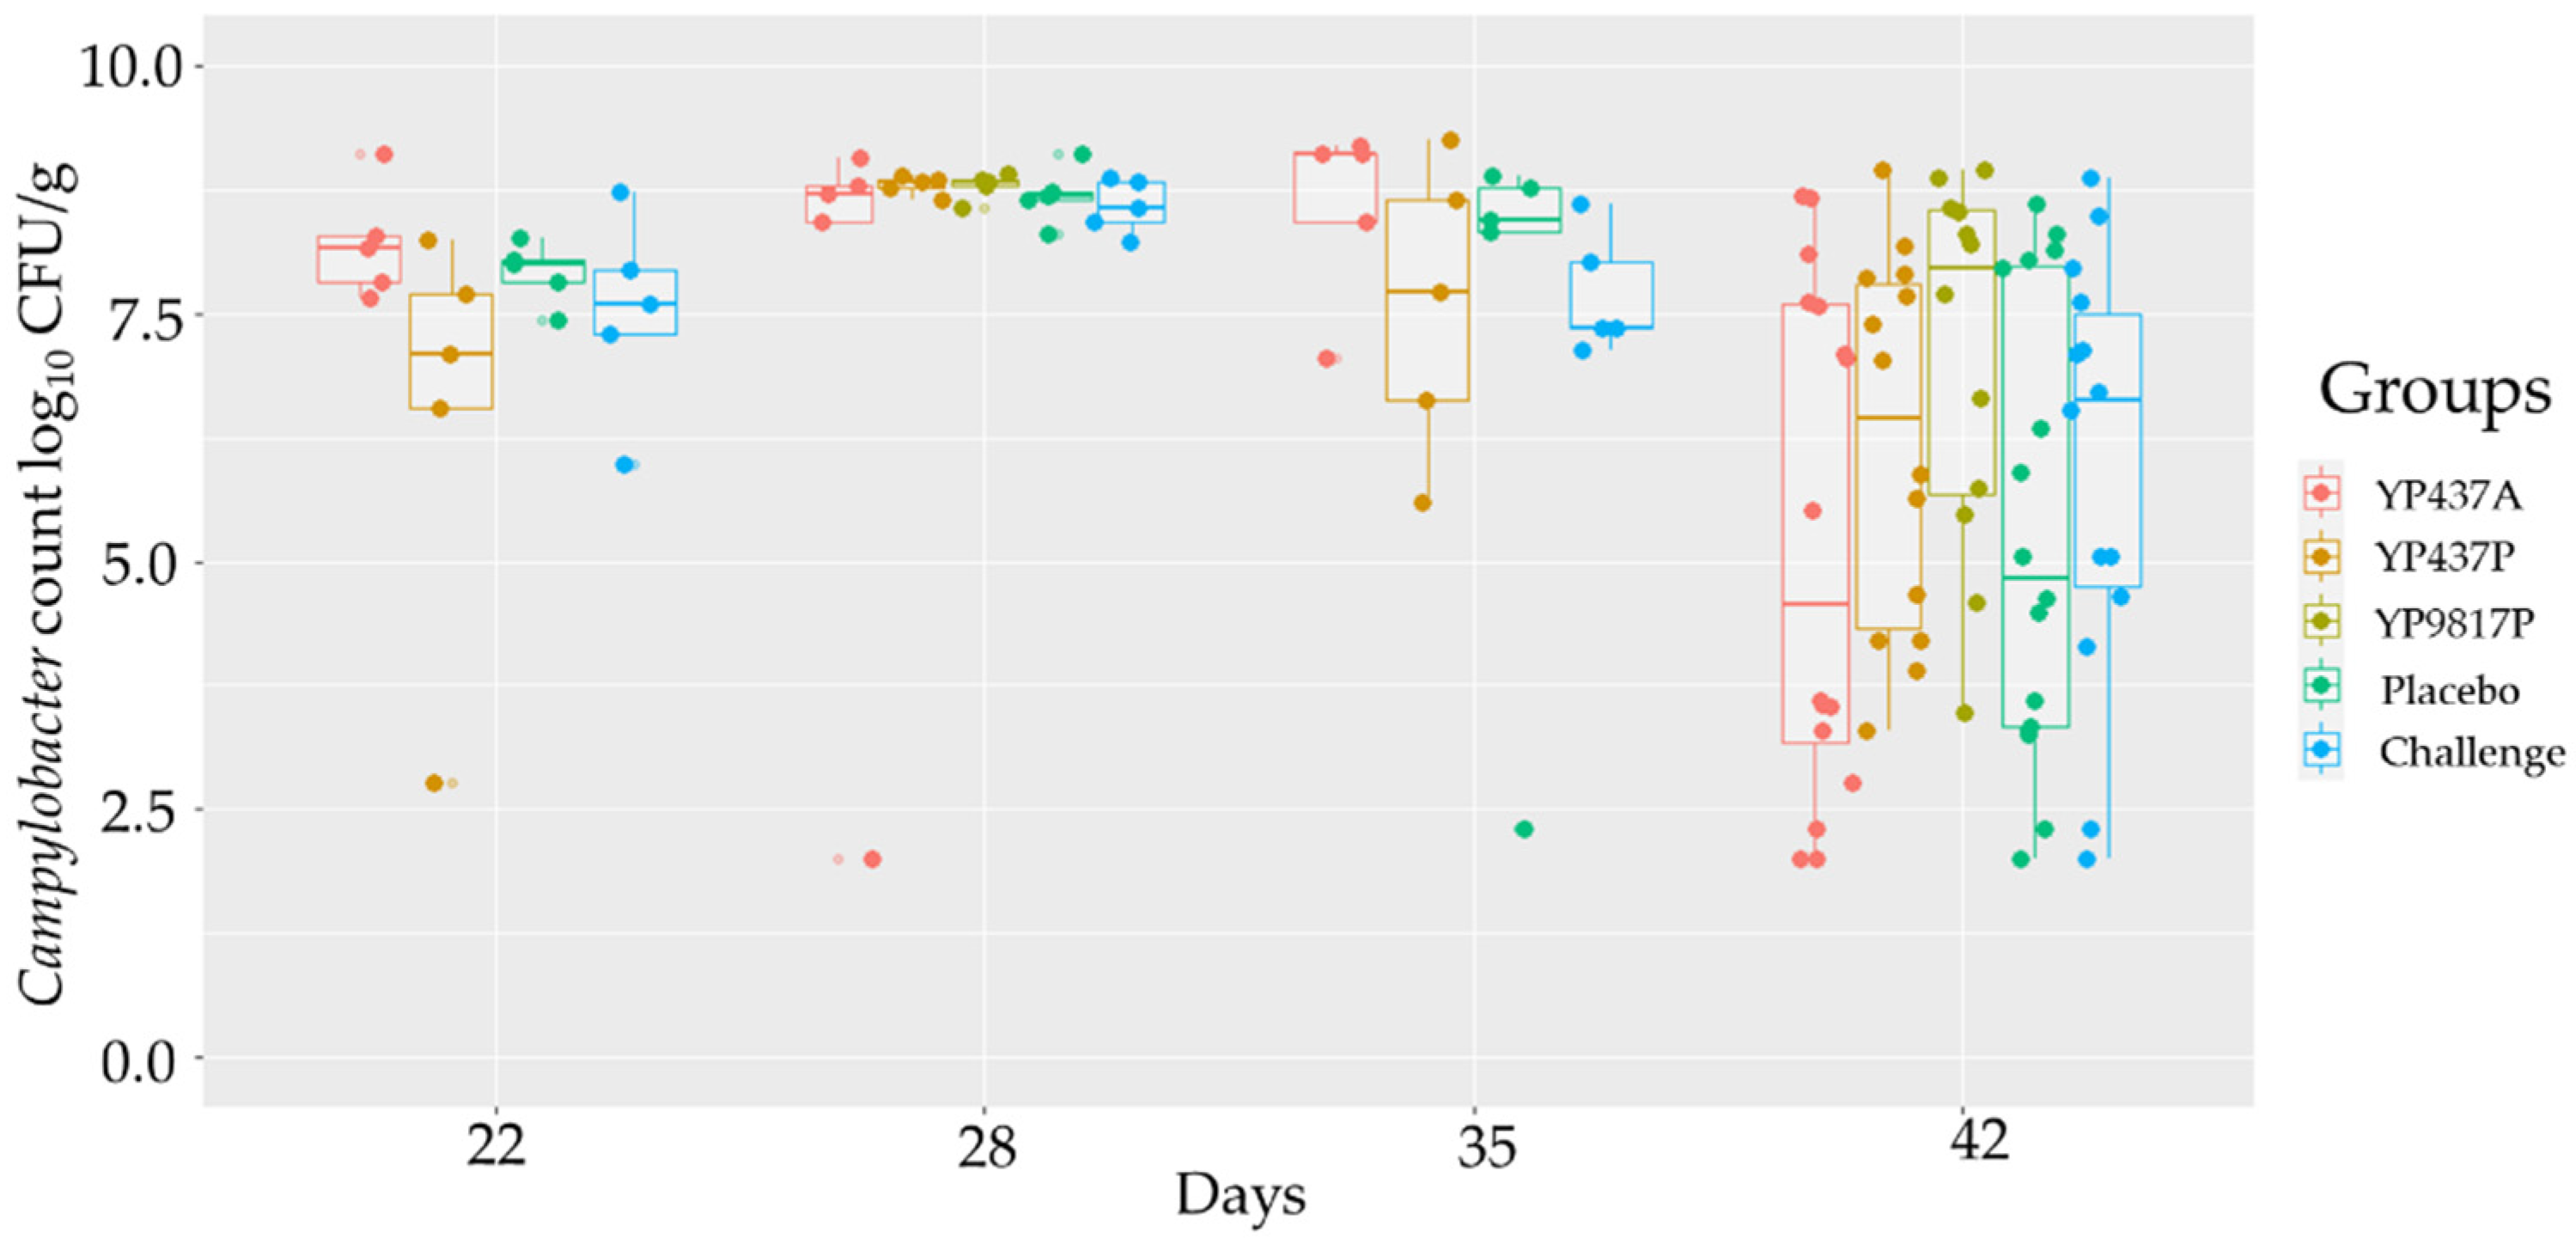
3.2. Campylobacter Counts in the Caeca of the Infected Chickens

Campylobacter levels were measured in caecal contents at several time points after the experimental challenge on D19. Three days post-challenge, chickens from all the groups were found to be highly colonised by Campylobacter (mean colonisation from 2.77 to 9.11 log10 CFU/g). The YP9817P group was checked only on D28 and had the same level of colonisation as the other groups (mean colonisation from 2.00 to 9.11 log10 CFU/g) (Figure 2). No significant difference (p > 0.05) was observed in caecal Campylobacter load among the groups from D22 to D42 (Figure 2). However, a high inter-individual variability was observed on D42 in all the tested groups, with Campylobacter loads ranging from 2.00 to 8.94 log10 CFU/g (Figure 2). As expected, Campylobacter was not detected in the negative group (limit of detection: 2 log10 CFU/g).

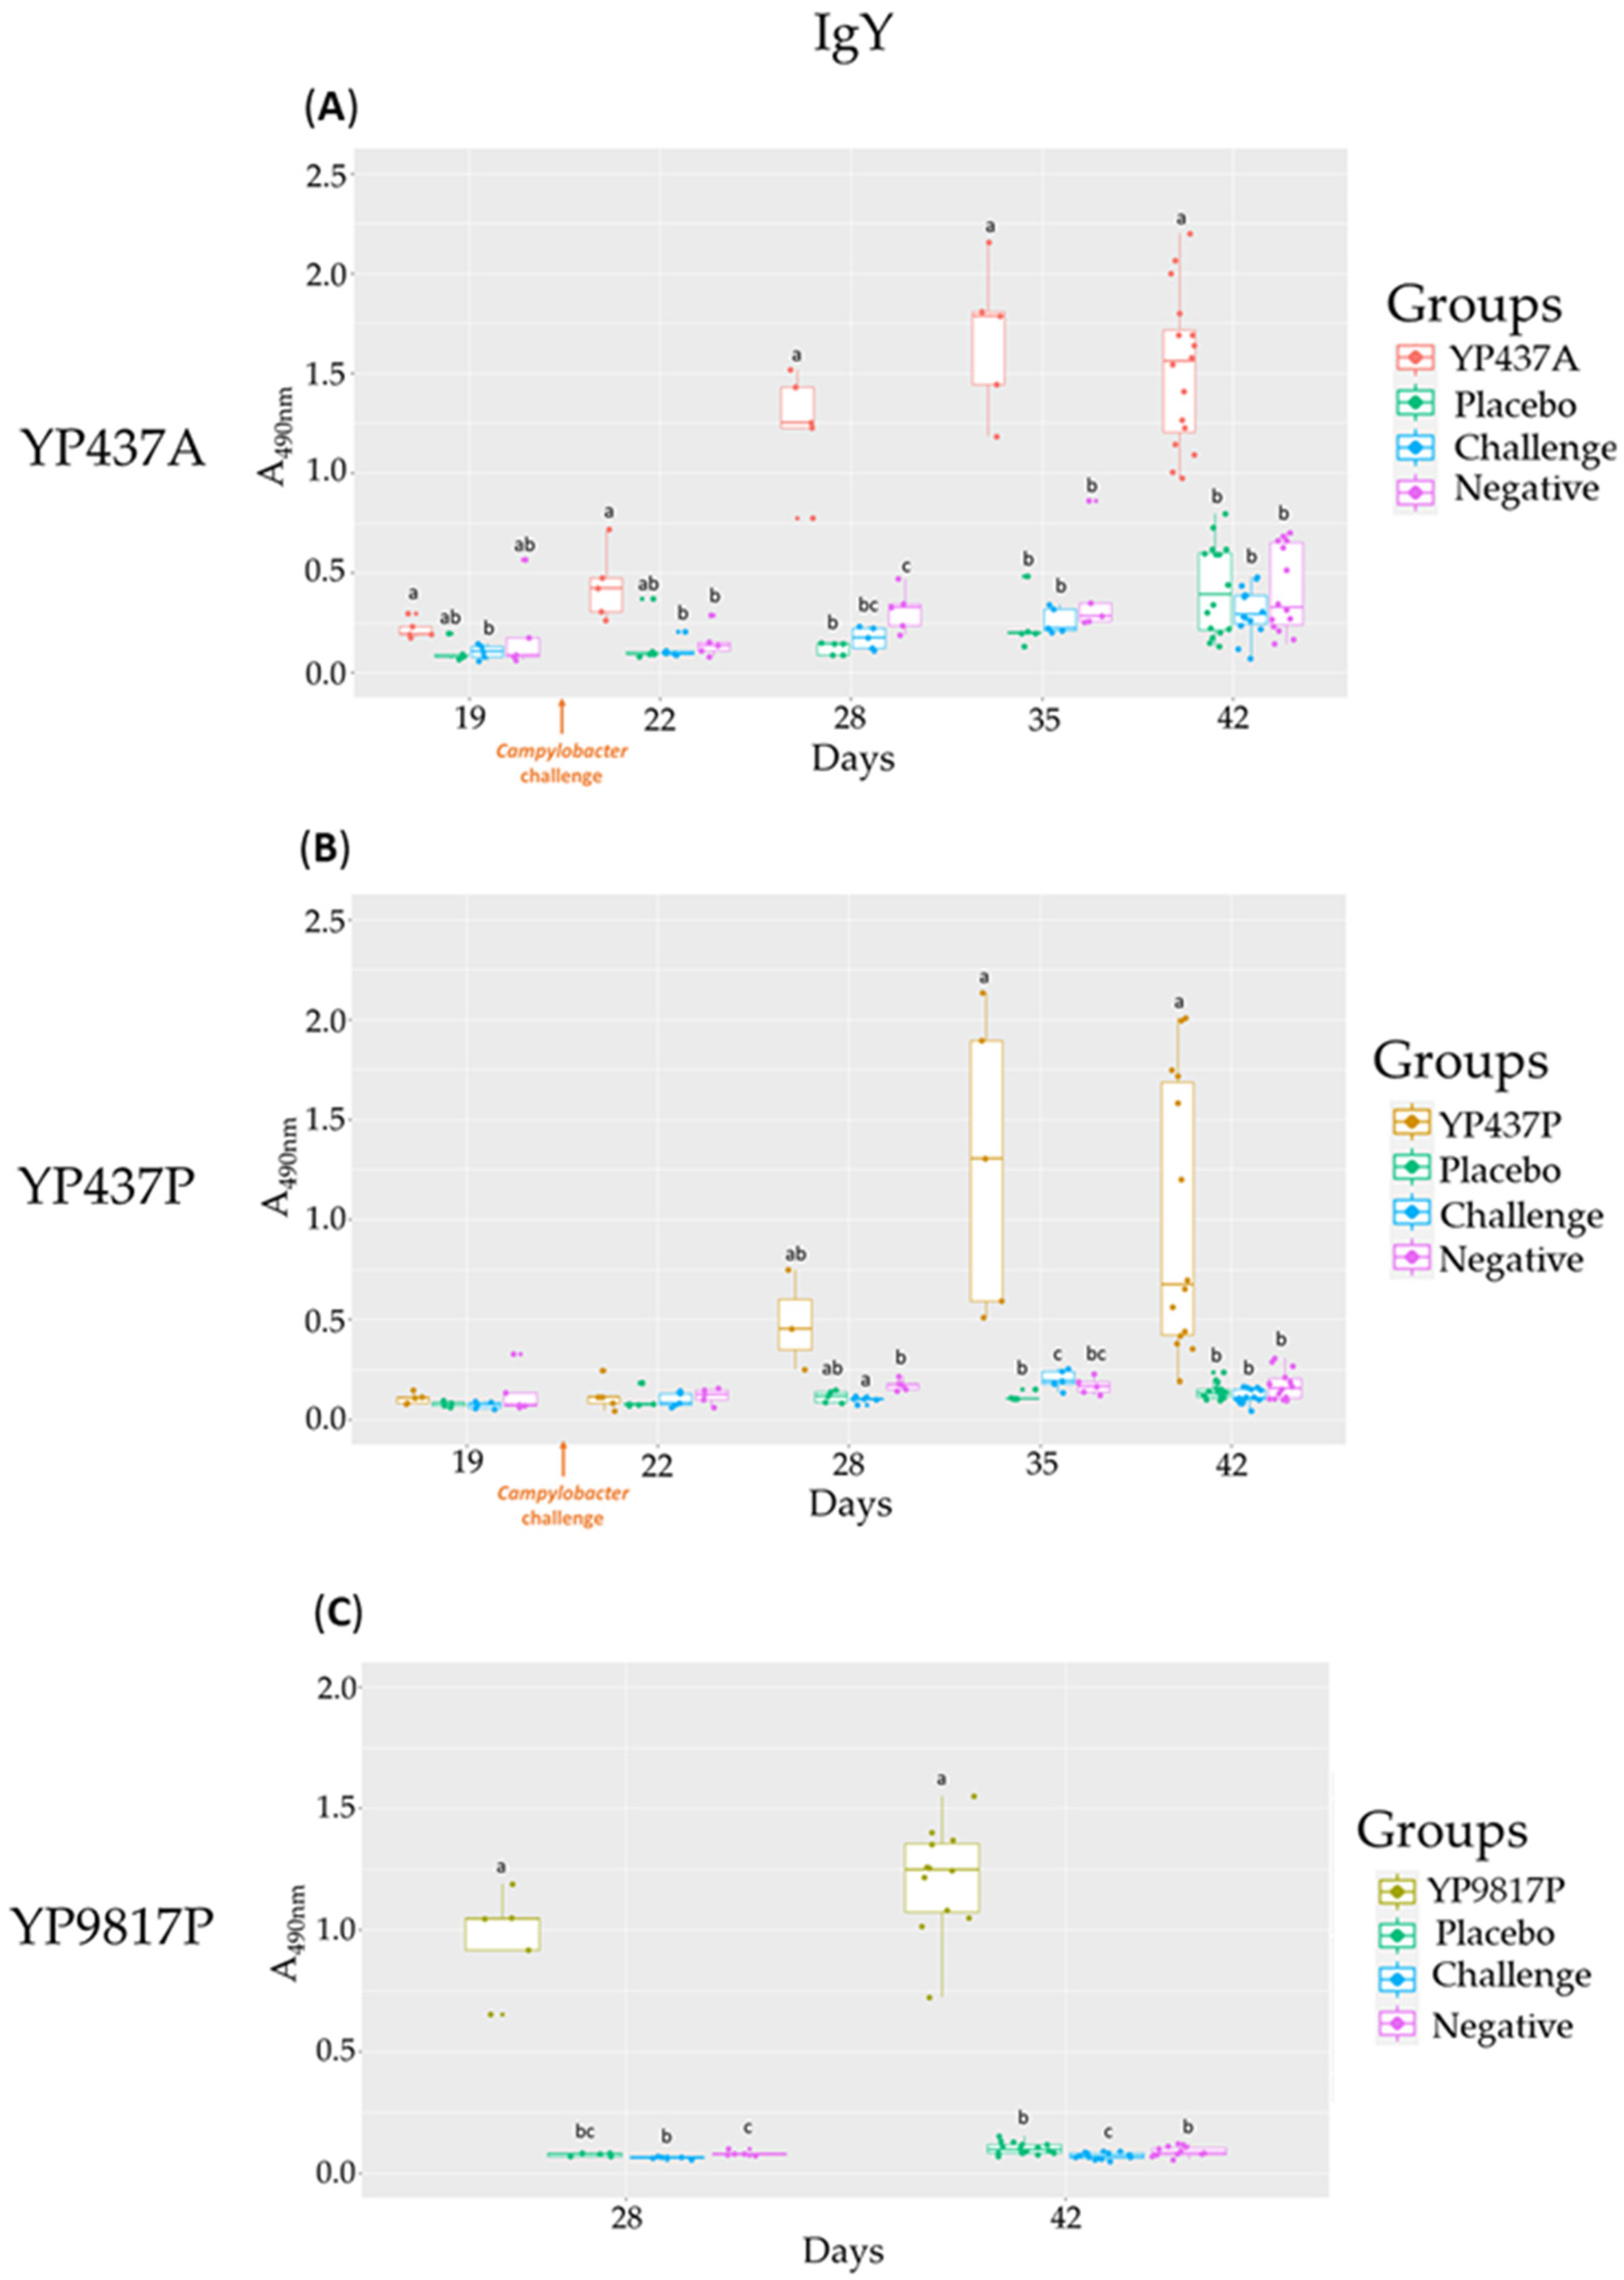
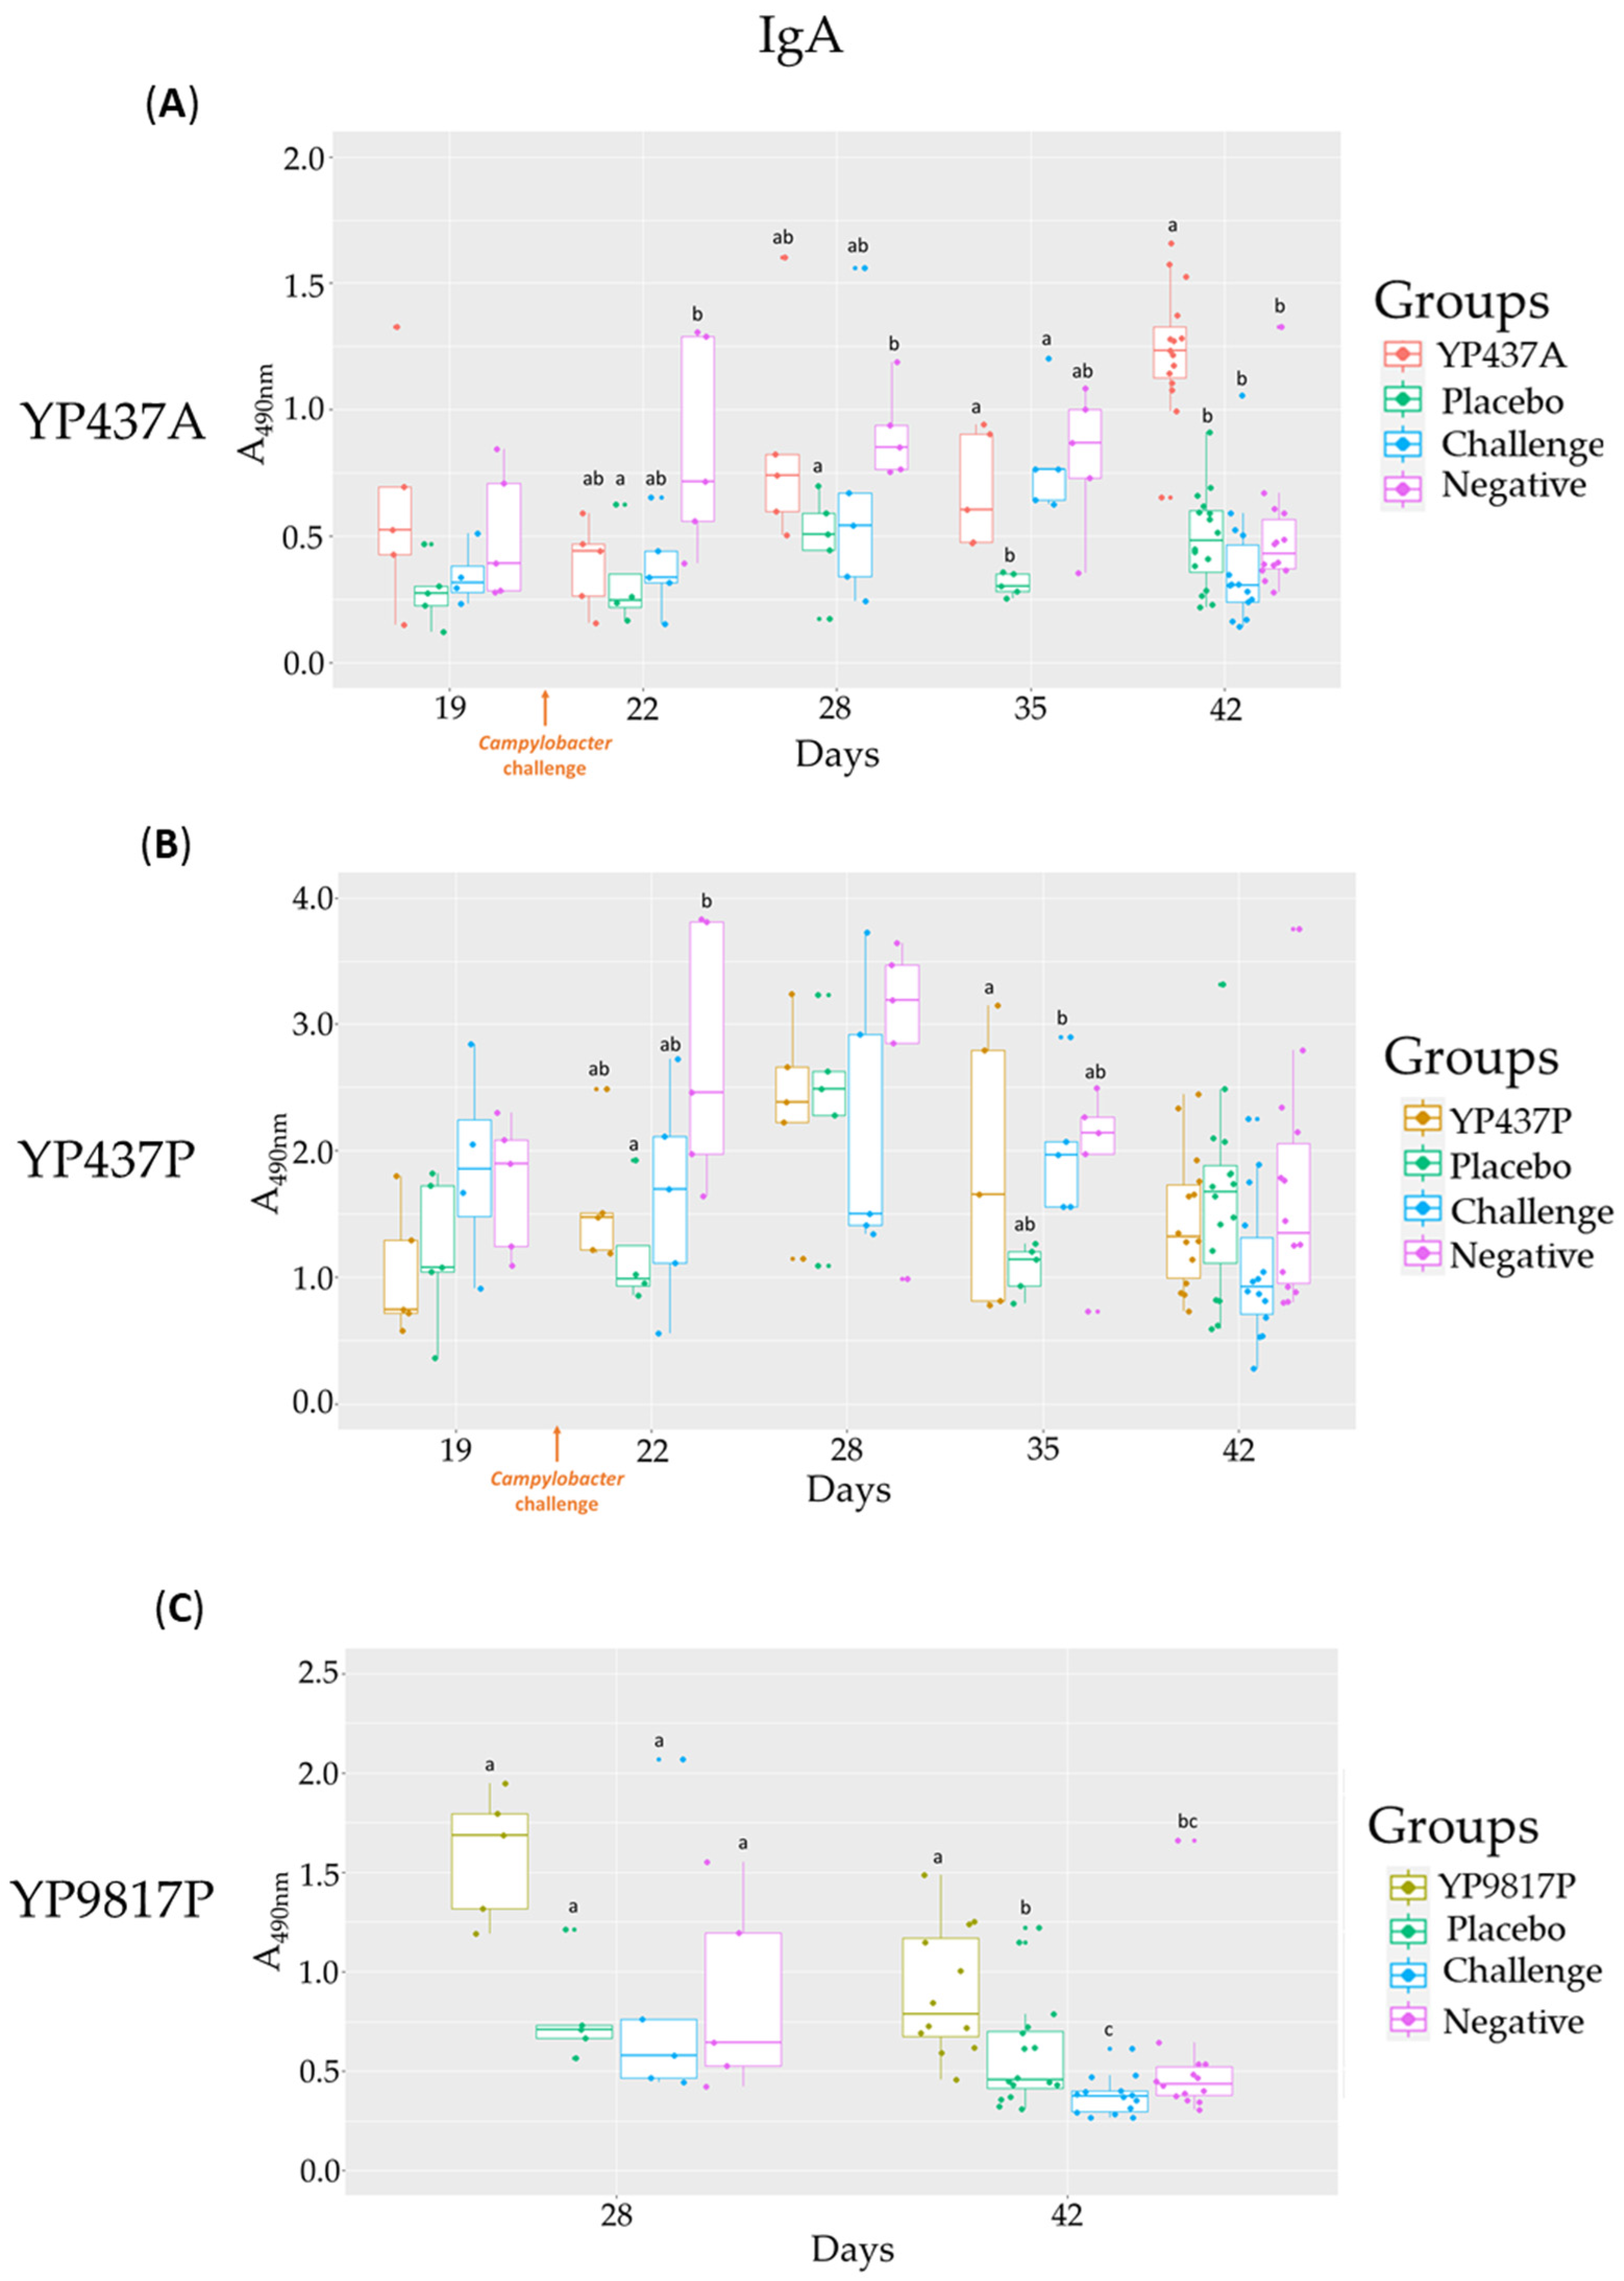
3.3. Specific Serum (IgY) and Bile (IgA) Anti-YP Antibody Levels Assessed by Specific ELISAs

ELISAs were performed to determine the levels of specific systemic antibodies in serum (IgY) and specific mucosal antibodies in bile (IgA) against the three proteins tested.
First, no significant difference in the levels of specific antibodies (IgY and IgA) against the three vaccine proteins was observed between the three control groups (placebo, challenge and negative) (Figure 3A–C and Figure 4A–C).
Moreover, the dilutions of proteins for coating and antibodies used for analysis of anti-YP9817P antibody levels (IgY and IgA) were higher than for YP437A, which were even higher than for YP437P (Table 1).
Furthermore, specific IgY antibodies were observed in the serum of all vaccinated chickens. The production of specific anti-YP9817P IgY on D28 and D42, anti-YP437A IgY from D22 to D42 and anti-YP437P IgY on D35 and D42 were significantly higher in the vaccinated groups than in the control groups (Figure 3A–C). In that respect, in chickens vaccinated with YP9817P and YP437A vaccines, the specific systemic immune response appeared earlier (D28) (Figure 3A,C) than with the YP437P vaccine (D35) (Figure 3B).
Moreover, a significantly higher production of specific IgA was measured in the bile of chickens vaccinated with YP437A and YP9817P on D42 compared with the control groups, except in chickens vaccinated with YP437P (Figure 4A–C). A higher inter-individual variability was observed in the results of the specific anti-YP437P IgA ELISA for all groups (vaccinated and controls) (Figure 4B).
Thus, there is a different specific humoral immune response depending on the vaccine and the production batch. For the vaccine, the specific humoral immune response in the YP9817P and YP437A groups occurred earlier than in the YP437P one. For the production batch, there was an earlier specific humoral immune response in the YP437A group than in the YP437P one.

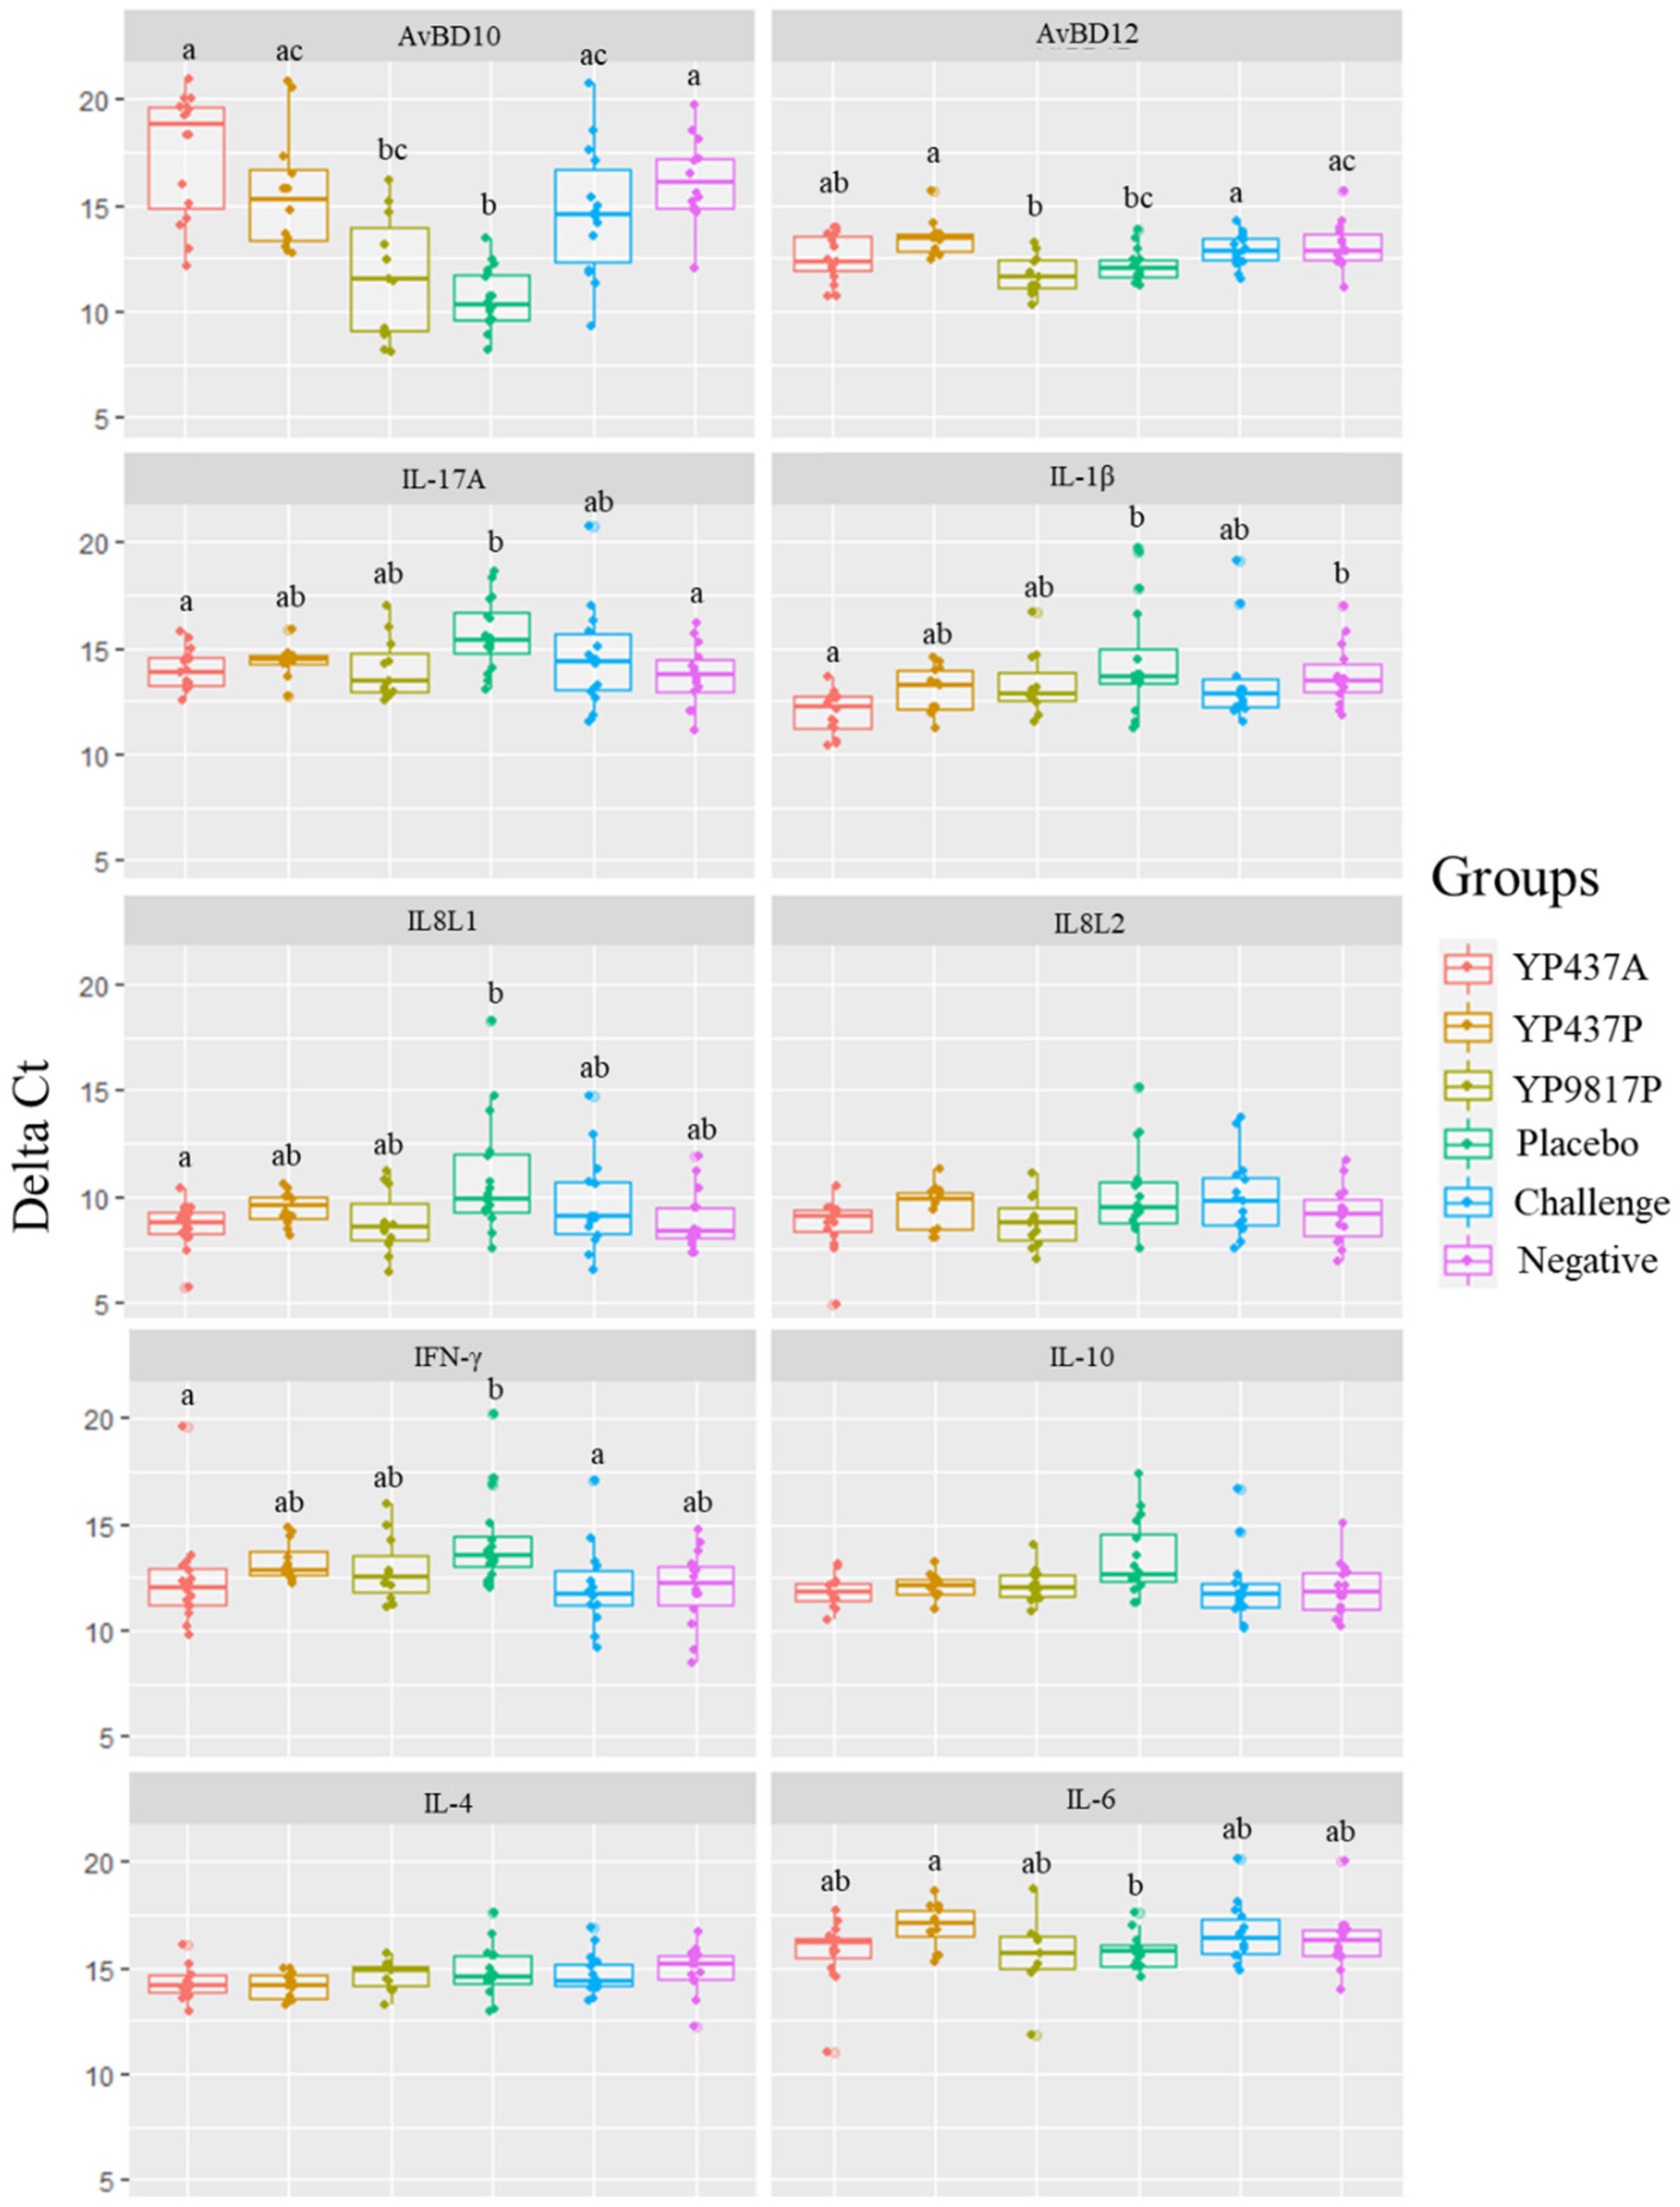
3.4. Relative Gene Expressions Determined by RT-qPCR

Relative expressions of eight caecal cytokines and two β-defensin genes (that were previously shown to play a role in response to Campylobacter infection and vaccination against Campylobacter) were evaluated on caecal tissues on D42 by relative RT-qPCR.
First, no significant difference in the expression of all the tested genes was observed between the challenge group and the negative group on D42, reflecting no effect of Campylobacter colonisation on both cytokine and β-defensin production (Figure 5). However, the placebo group demonstrated an upregulation of AvBD10 and AvBD12 (significantly higher delta Ct) and a downregulation of IFN-γ (significantly lower delta Ct) compared with the challenge group (p ≤ 0.05). Contrastingly, no difference (p > 0.05) was observed between the placebo group and the negative group concerning the relative expression of AvBD12 and IFN-γ (Figure 5).
No significant difference in relative gene expressions was observed between the YP9817P and the placebo groups. An upregulation of IL-17A, IL-1β, IL8L1, and IFN-γ (significantly higher delta Ct) and a downregulation of AvBD10 (significantly lower delta Ct) in the YP437A groups compared with the placebo (p ≤ 0.05) was observed, but not compared with the challenge and negative groups (p > 0.05). Similarly, the YP437P vaccine induced a downregulation of AvBD10, AvBD12, and IL-6 (significantly lower delta Ct) compared with the placebo group (p ≤ 0.05) but not compared with the challenge and negative groups (p > 0.05) (Figure 5). These discrepancies in the results observed between the vaccinated groups and the placebo group or with the other control groups (challenge and negative groups) did not allow a conclusion to be reached about the effect of the three vaccines on the expression of the tested genes.

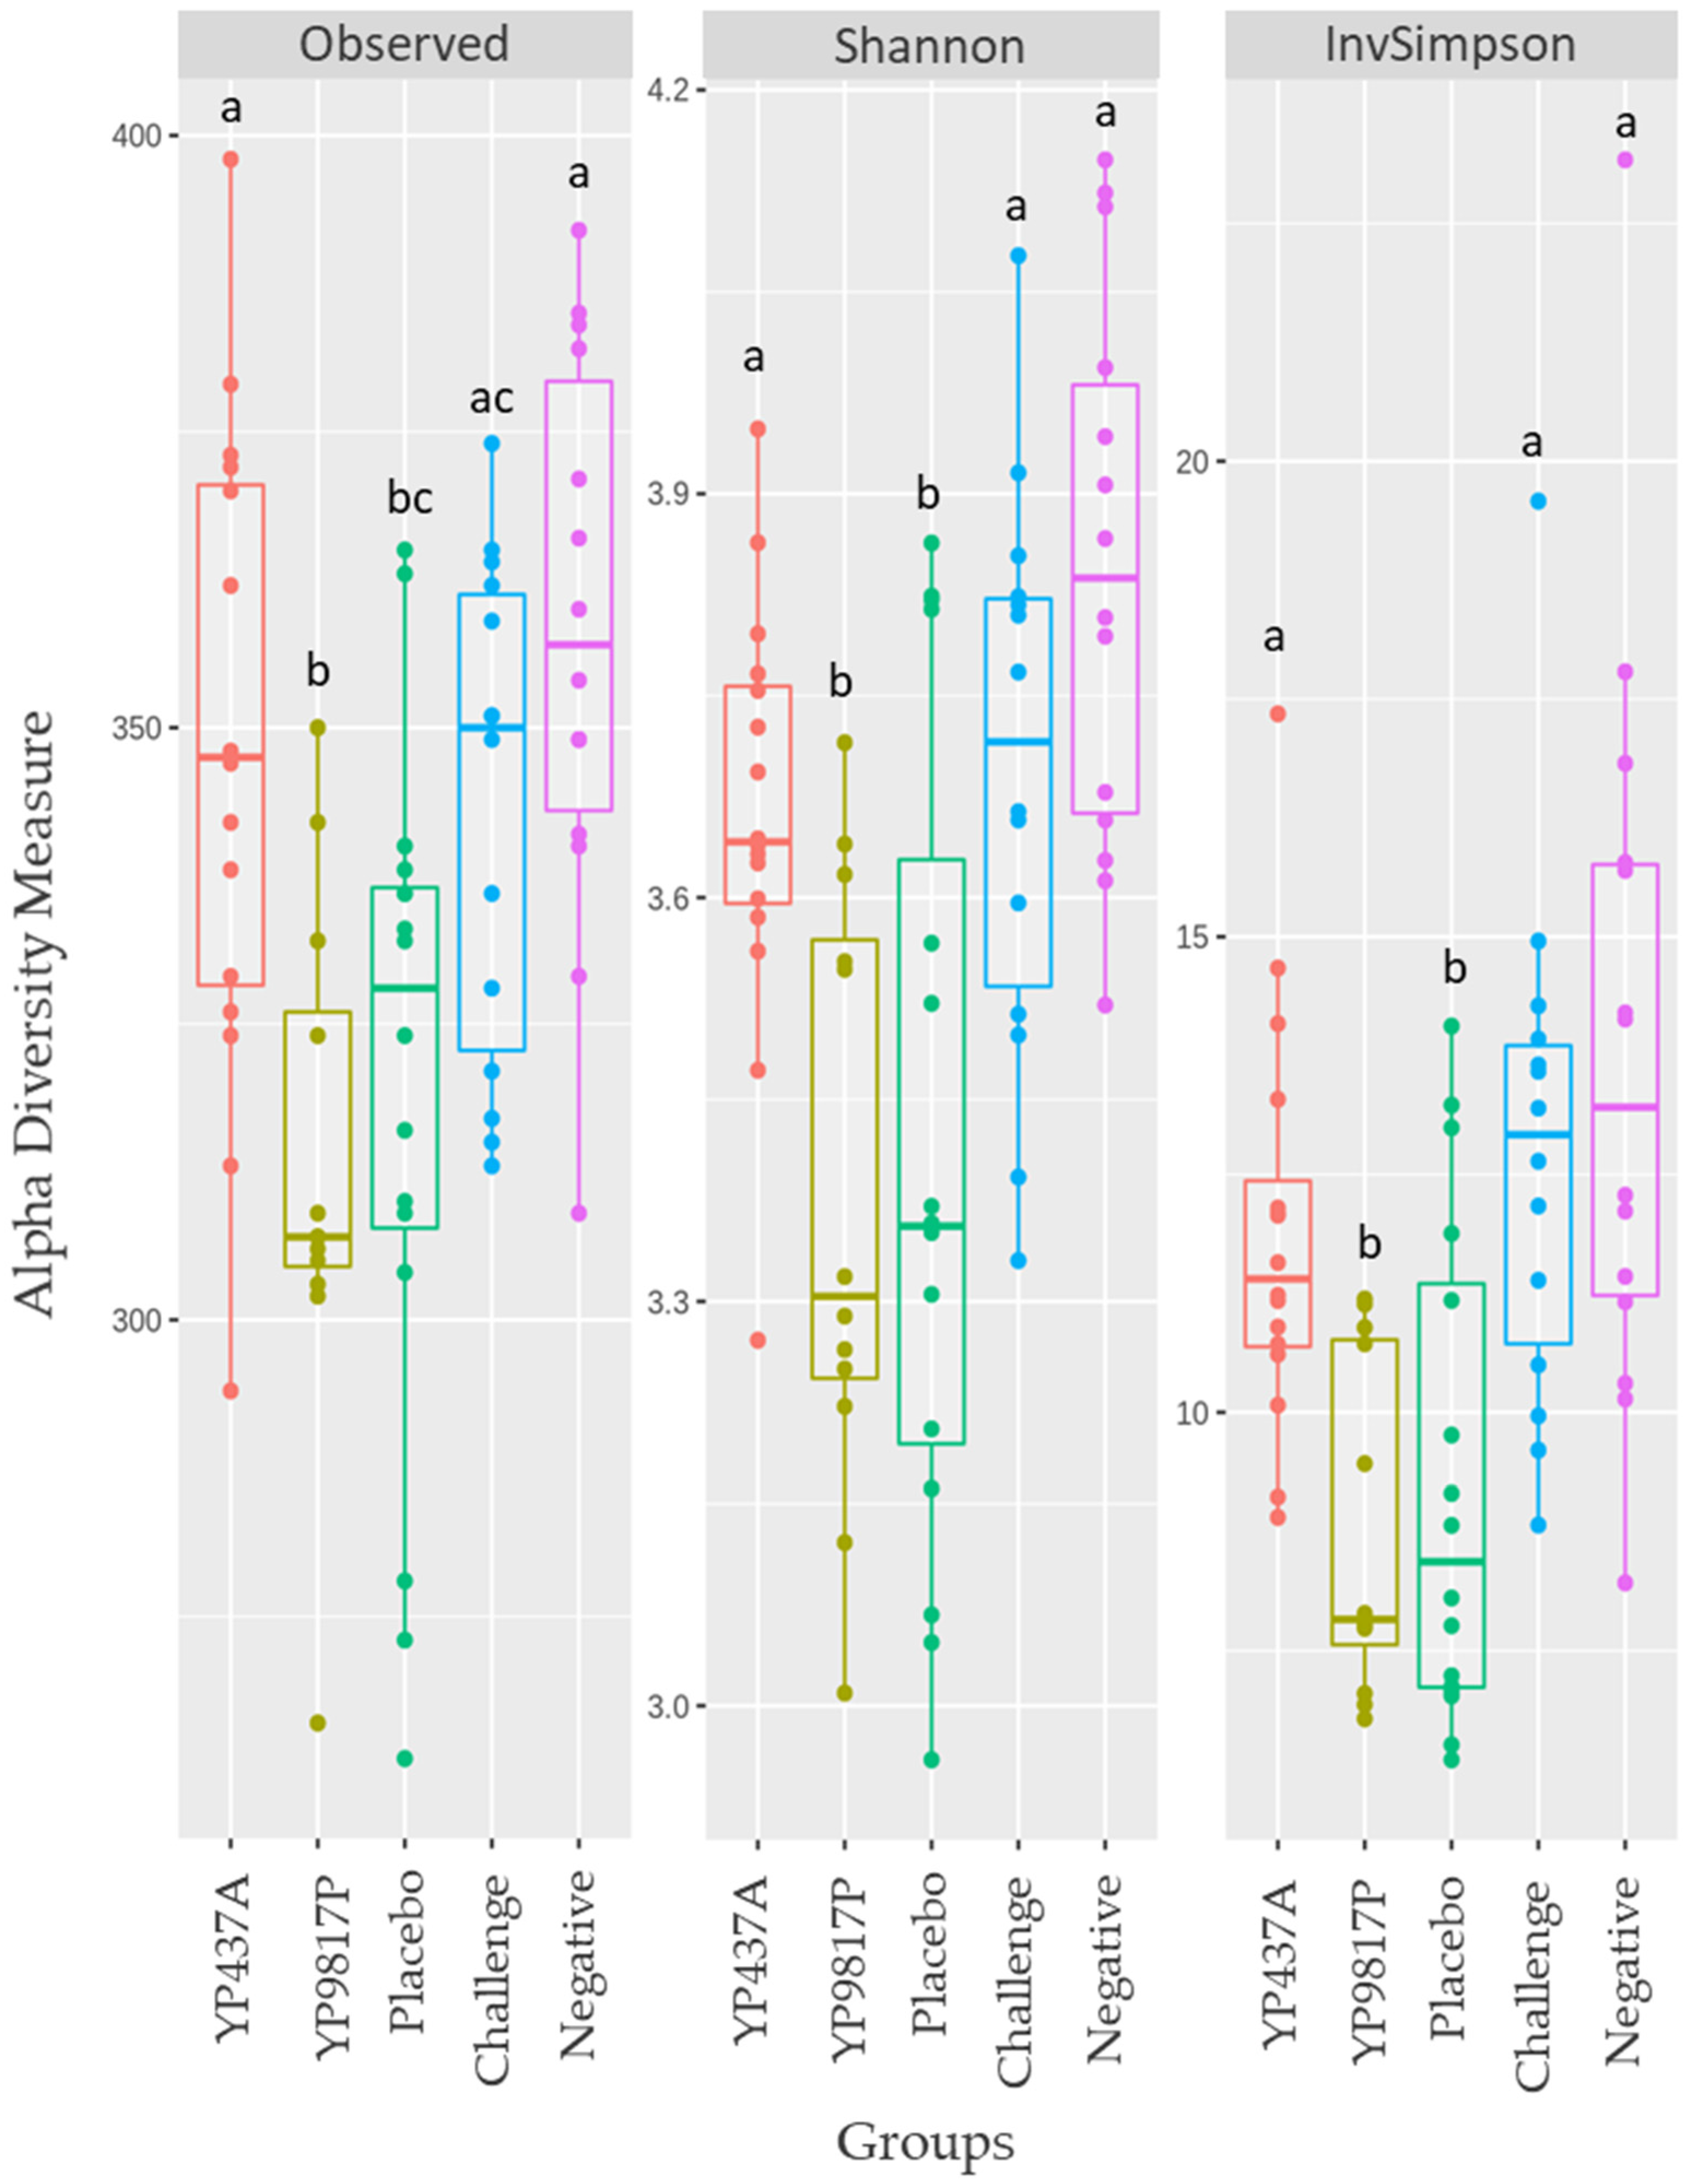
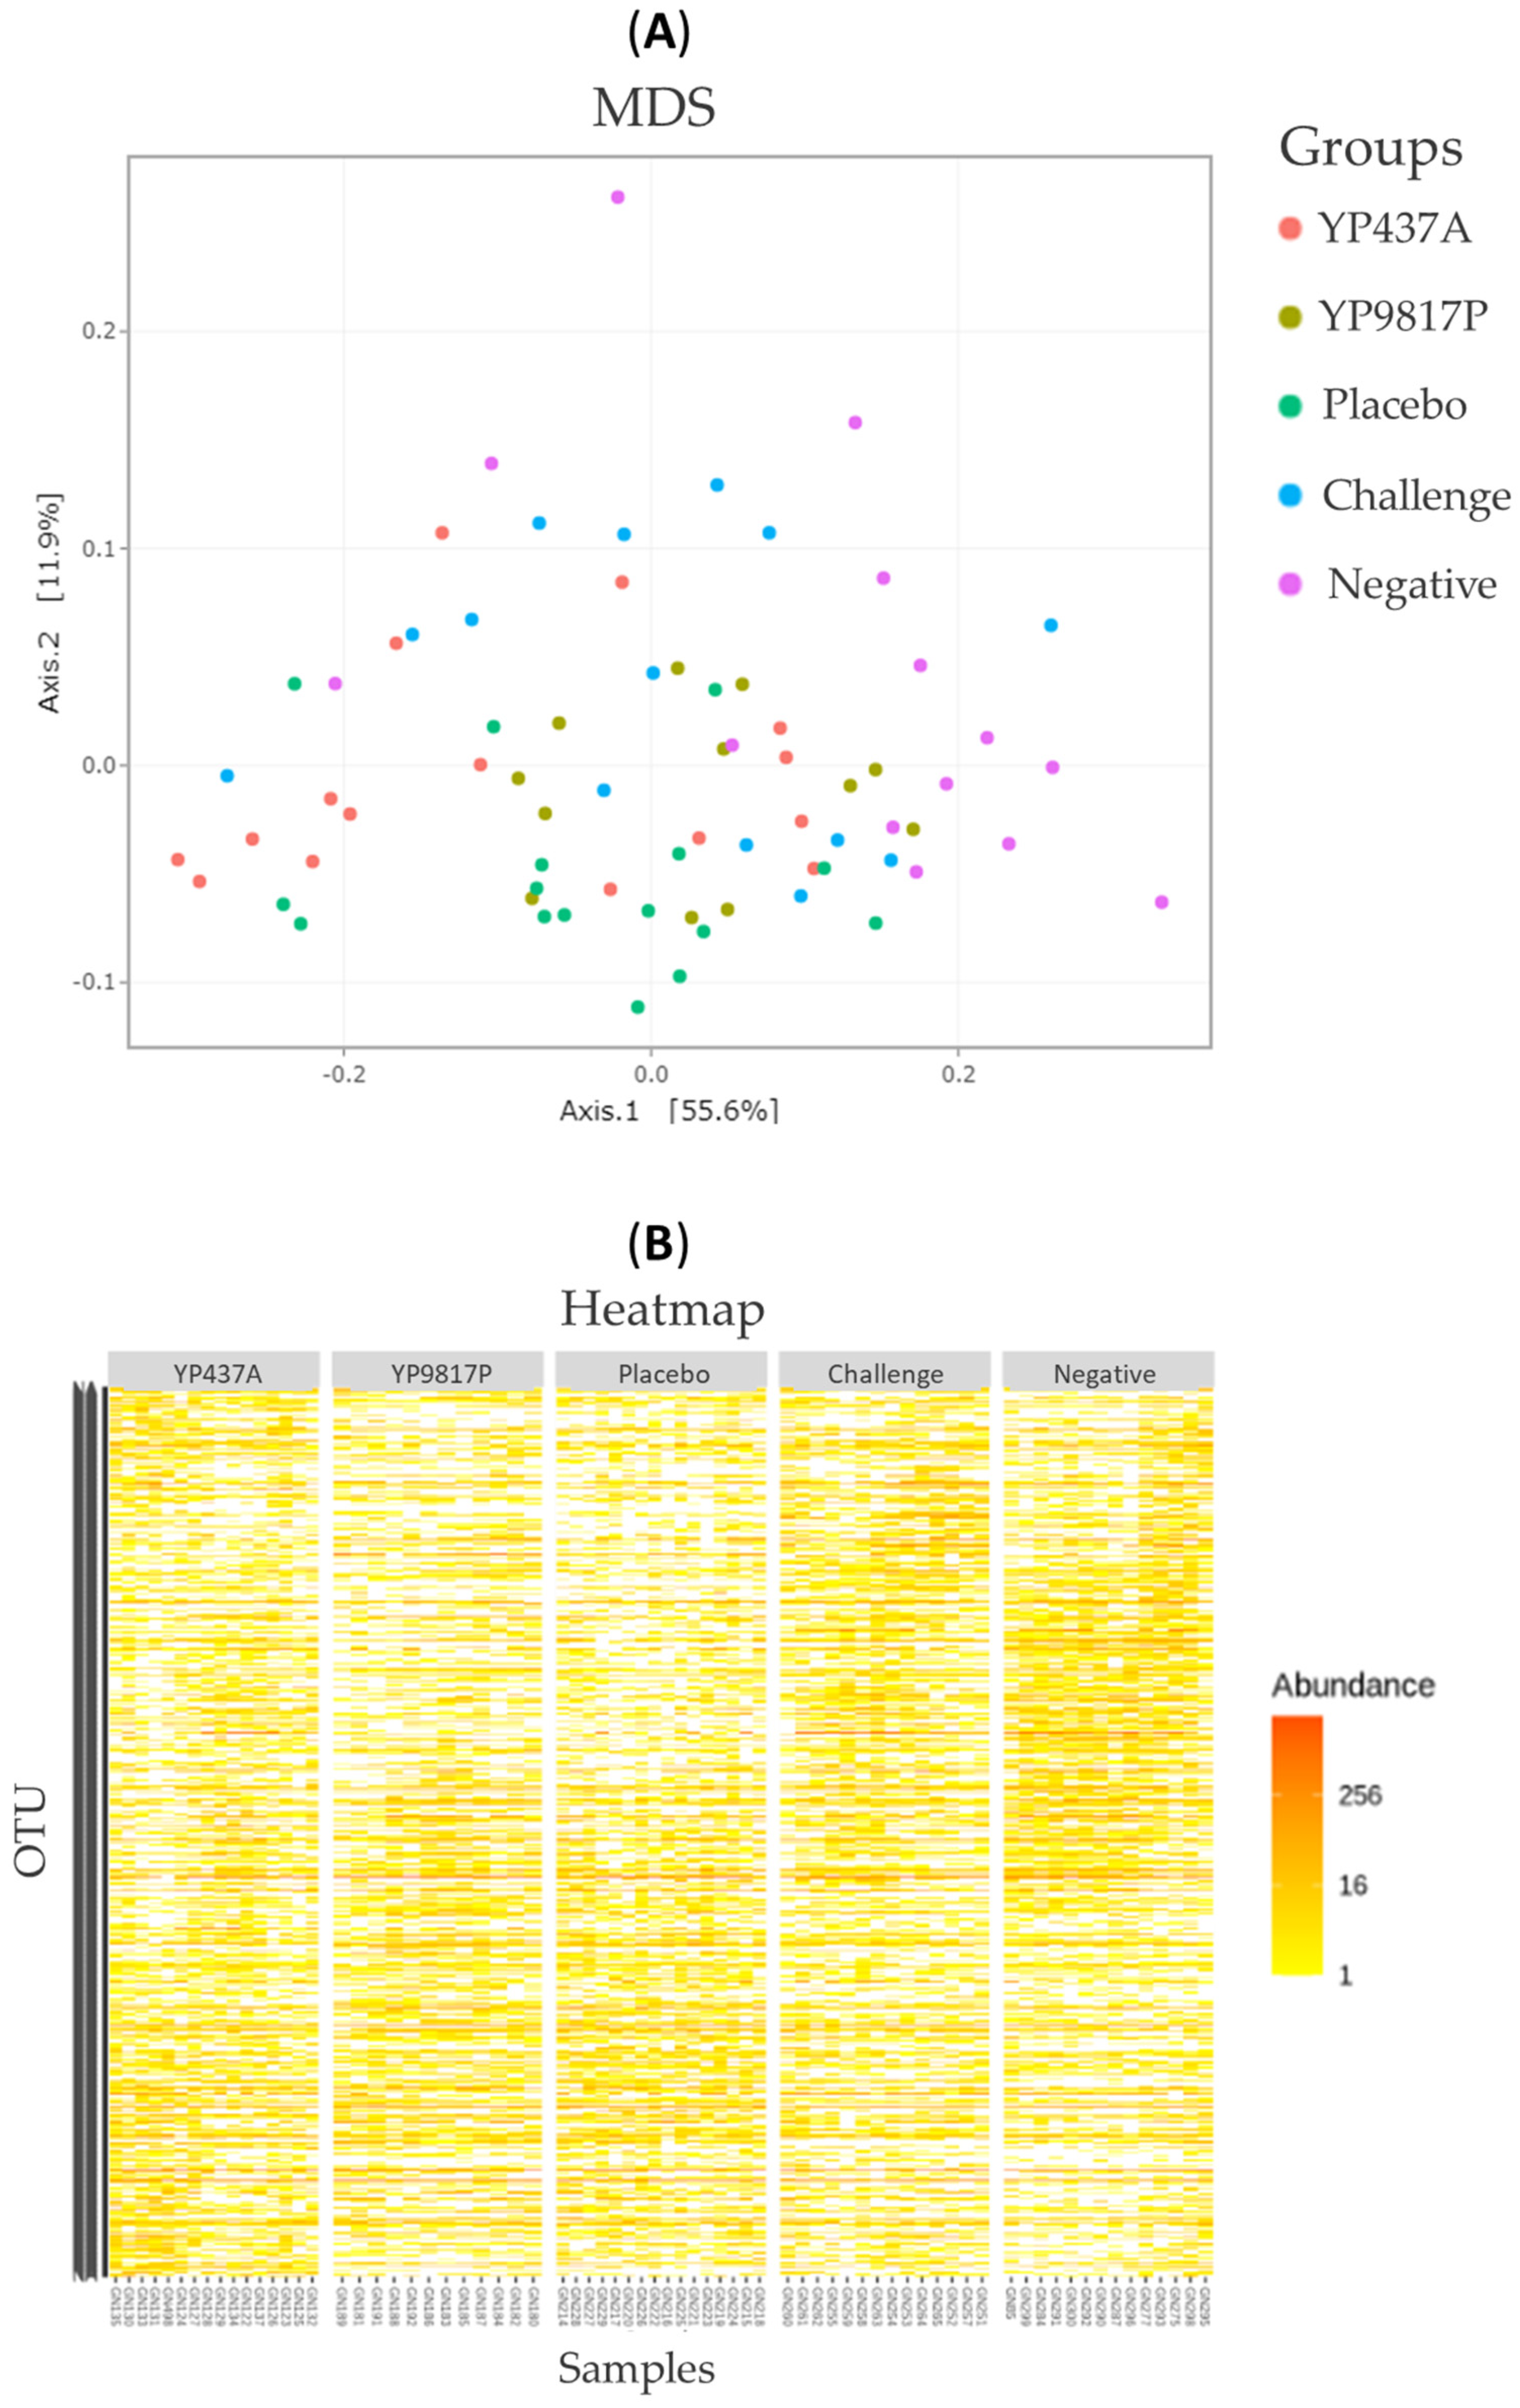
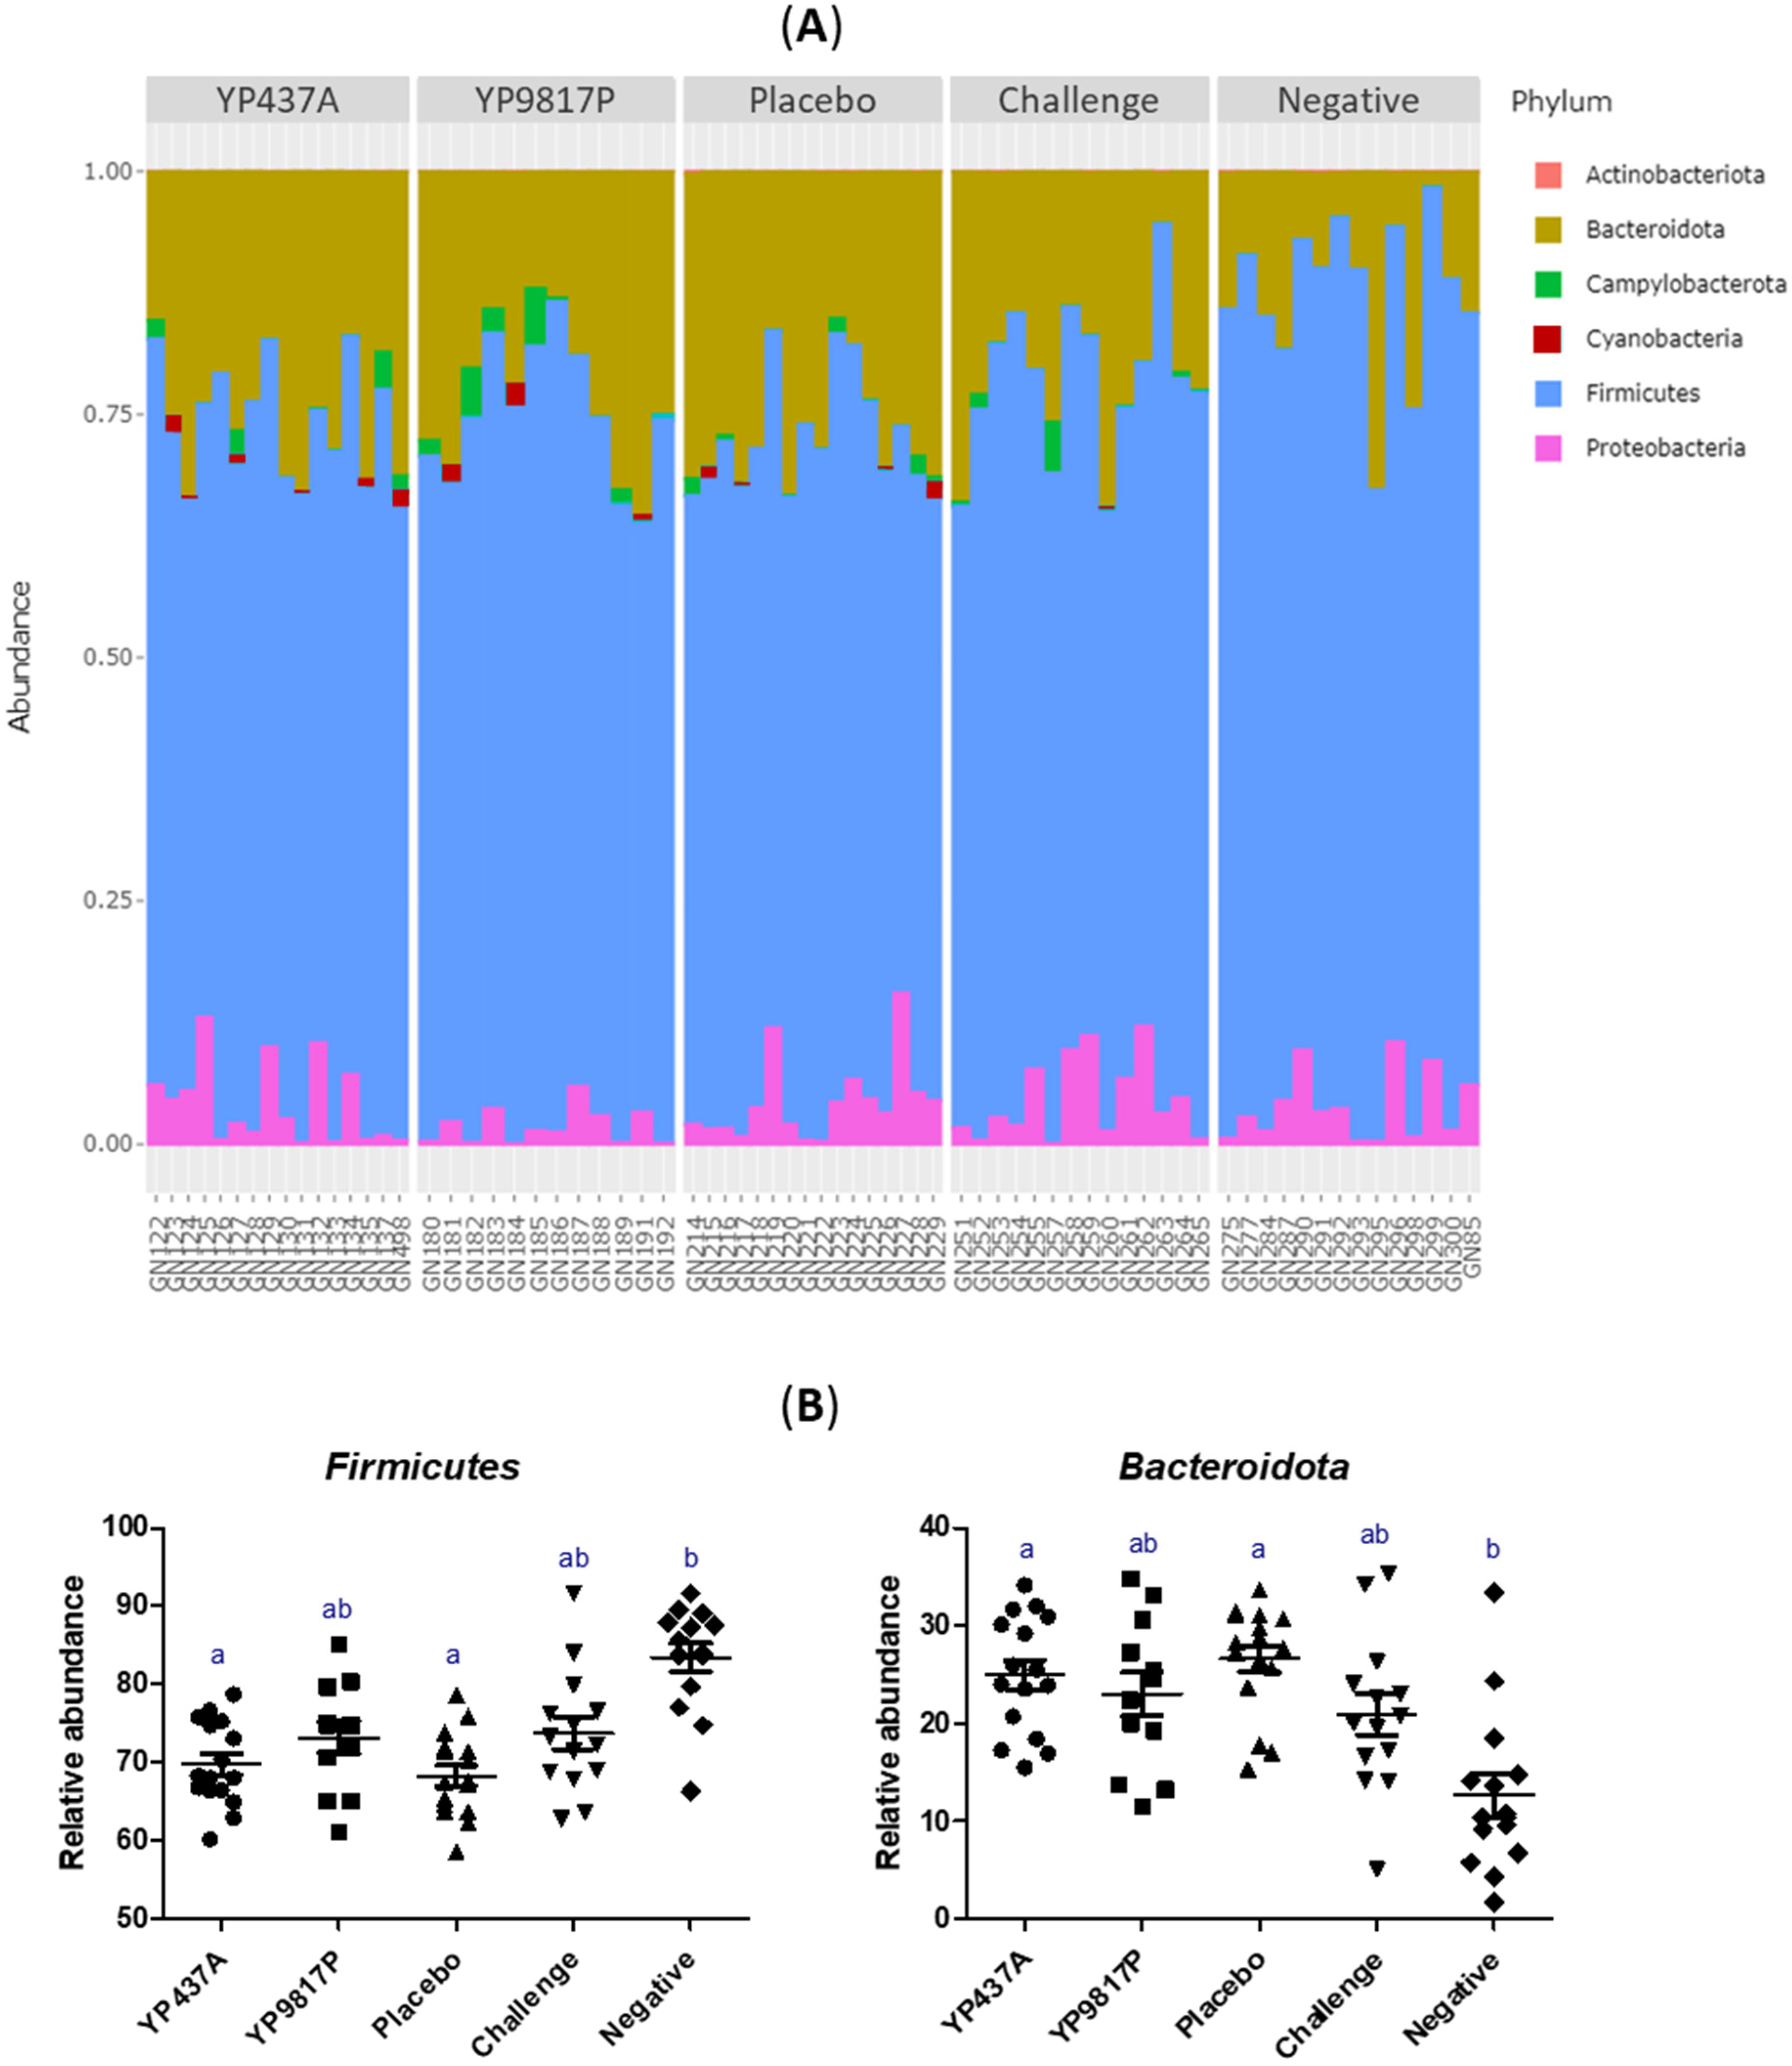
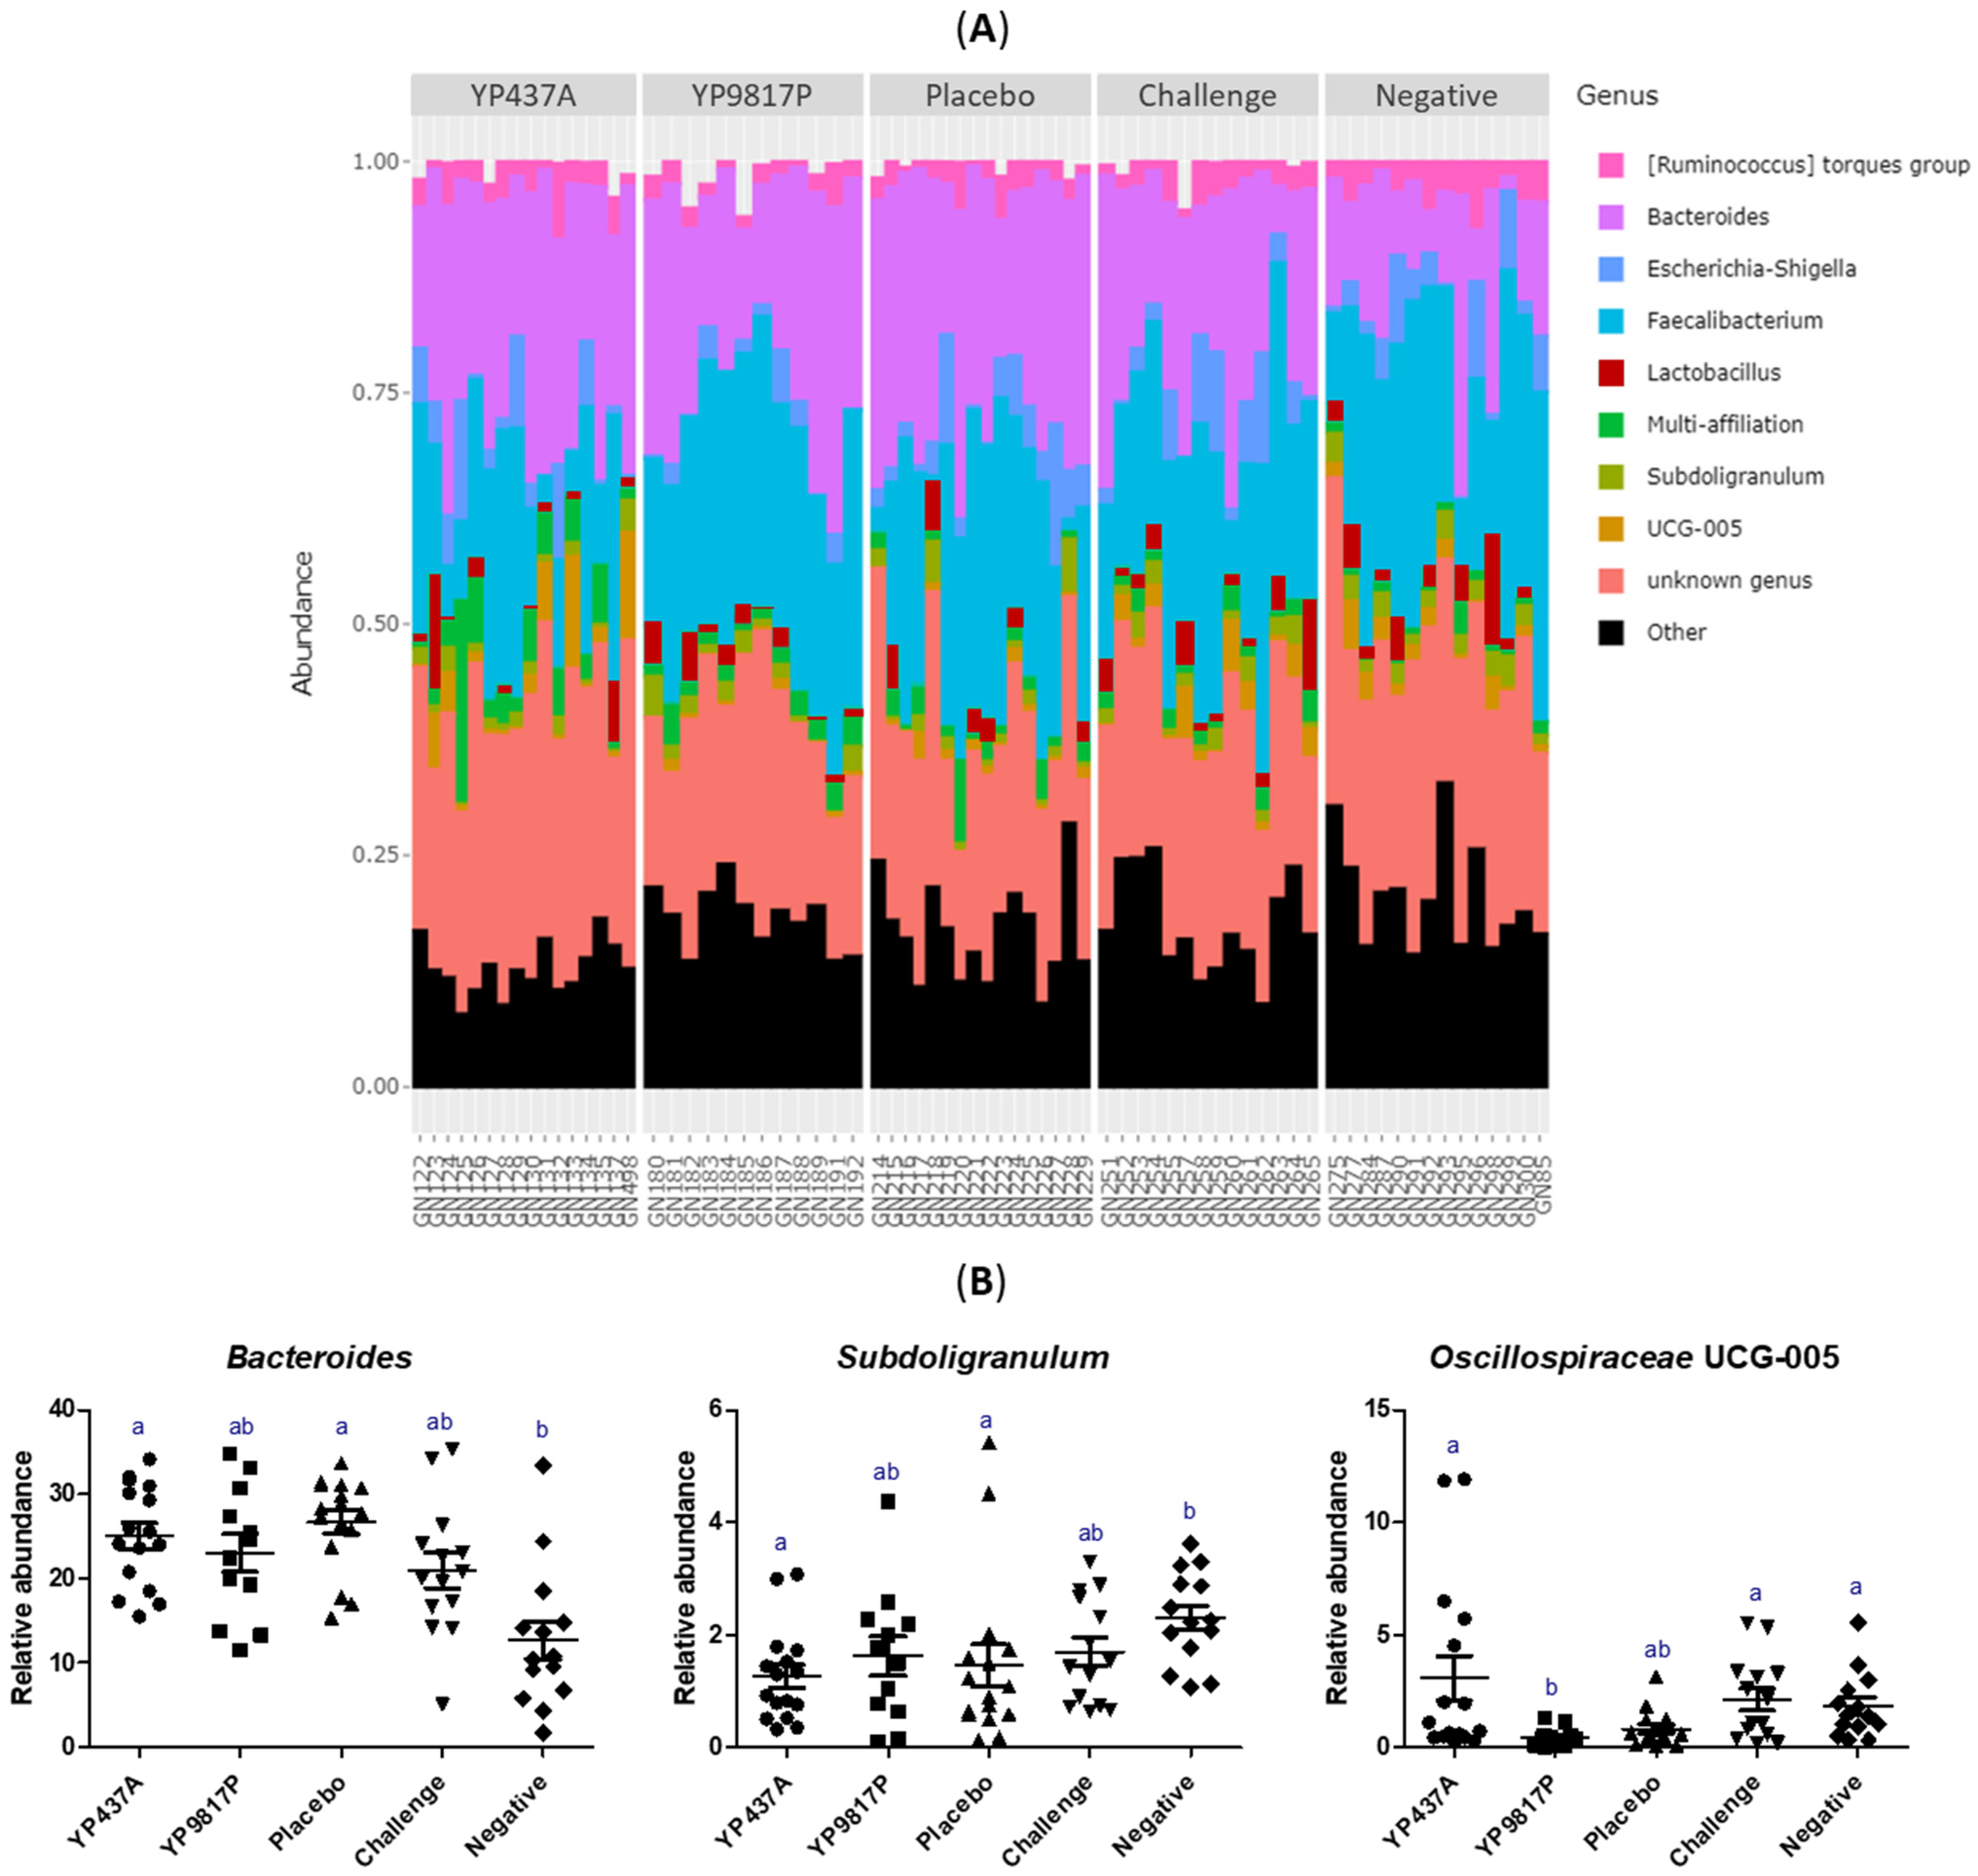
3.5. Caecal Microbiota Analyses

To assess the impact of vaccination with YP437A and YP9817P candidates on caecal microbiota, the caecal content of the chickens in the different groups was analysed on D42 using 16S metabarcoding. The effect of the YP437P protein was not evaluated due to the low immune response demonstrated in this study. The number of sequences after read demultiplexing and pre-processing (merging, denoising and dereplication) was 3,253,573 (minimum: 22,614; maximum: 117,822).
A total of 713 OTUs were obtained (with 1,698,589 sequences). The minimum and maximum number of OTUs in each group is indicated in Table 4.
To determine bacterial diversity, the alpha and beta diversities of the caecal microbiota were assessed (Figure 6 and Figure 7). The richness (observed species) and diversity (Shannon and inverse Simpson indices) indices were compared between groups for the alpha diversity found within samples (Figure 6). Both richness and diversity were higher (p ≤ 0.05) in the YP437A, challenge, and negative groups than in the YP9817P and placebo groups (Figure 6). These results suggest that the YP437A, challenge and negative groups contained a larger number of species (higher richness) more evenly distributed than the YP9817P and placebo groups.
For the analysis of beta diversity, the differences in microbial population compositions among the YP437A, YP9817P, placebo, challenge, and negative groups were examined by multi-dimensional scaling (MDS) based on weighted UniFrac distance (Figure 7A). Little segregation of the groups was observed, suggesting that the most abundant OTUs in the different groups are phylogenetically close (Figure 7A). The heatmap, representing the community structure with the relative abundance of OTUs, also confirmed the minimal segregation of the groups observed (Figure 7B). However, a multivariate ANOVA (performed with Adonis) revealed that the bacterial community structure differed significantly (p  ≤  0.001) between groups and that the group explained 25% of the observed variation.
The caecal bacterial composition in each group at the phylum level on D42 is represented in Figure 8. According to the results, the Firmicutes phylum predominated in each group, followed by Bacteroidota and Proteobacteria phyla (Figure 8A). Among the predominant phyla, the relative abundance of the Firmicutes phylum was significantly higher in the negative group than in the YP437A and placebo groups (p ≤ 0.05), but not in the YP9817P and challenge groups (p > 0.05). On the contrary, the Bacteroidota phylum was significantly lower in the negative group than in the YP437A and placebo groups (p ≤ 0.05), but not in the YP9817P and challenge groups (p > 0.05) (Figure 8B). These results suggest that Campylobacter decreases the relative abundance of Firmicutes and increases the relative abundance of Bacteroidota, whereas the vaccination did not have any effect on the relative abundance of these phyla. The relative abundance of the Proteobacteria phylum did not differ significantly between the groups.
The caecal bacterial composition in each group at the genus level (nine main genera) on D42 is represented in Figure 9. The Faecalibacterium and Bacteroides genera predominated in each group, followed by Escherichia-Shigella, [Ruminococcus] torque group, Lactobacillus, UCG-005 (Oscillospiraceae family), and the Subdoligranulum genus (Figure 9A). Among the predominant genera, the relative abundance of the Bacteroides genus (Bacteroidota phylum) was significantly lower in the negative group than in the YP437A and placebo groups (p ≤ 0.05) but not lower than in the YP9817P and challenge groups (p > 0.05). On the contrary, the Subdoligranulum genus (Firmicutes phylum) was significantly higher in the negative group than in the YP437A and placebo groups (p ≤ 0.05) but not higher than in the YP9817P and challenge groups (p > 0.05) (Figure 9B). These results suggest that Campylobacter decreases the relative abundance of the Subdoligranulum genus (Firmicutes phylum) but increases the relative abundance of the Bacteroides genus (Bacteroidota phylum), which agrees with the analysis of relative abundance at the phylum level. Moreover, the relative abundance of Oscillospiraceae UCG-005 (Firmicutes phylum) was significantly lower in the YP9817P group than in the YP437A, challenge and negative groups (p ≤ 0.05) but not lower than in the placebo group (p > 0.05) (Figure 9B), reflecting a possible impact of the YP9817P vaccination on the relative abundance of Oscillospiraceae UCG-005. The relative abundance of the other predominant genera (Faecalibacterium, Escherichia-Shigella, [Ruminococcus] torque group and Lactobacillus) did not significantly differ between the groups.
In addition, to identify the characteristic bacteria which were specific to each group, a linear discriminant analysis (LDA) effect size (LEfSe) algorithm approach was applied. However, no specific taxa were identified for each group. These results indicate that no OTUs with a statistically different relative abundance between the groups were identified. Consequently, the effect of vaccination and Campylobacter colonisation are not taxon-specific.

4. Discussion

Vaccinating broilers against Campylobacter is one of the possible strategies to reduce Campylobacter caecal load and, consequently, reduce the risk of the incidence of human campylobacteriosis. Many vaccine research studies have been carried out in the past few decades, but the results have been inconclusive and inconsistent [45,46,47]. To this date, therefore, the mechanisms of protection against Campylobacter following vaccination remain to be fully elucidated, and currently vaccines against Campylobacter are not available. It is also necessary to have a vaccine platform that can help evaluate the immune and protective potential of newly identified potential vaccine antigens. DNA vaccination is one such platform because of the ease with which novel antigens may be included. A previous review reported DNA vaccination in poultry as an appropriate and simple strategy with promising results against bacteria (e.g., Campylobacter jejuni, Chlamydophila psittaci). Such vaccination can boost the protective immune response while avoiding maternal immunity [48]. It is to be noted that heterologous DNA prime/other recombinant vectors or recombinant proteins are often associated. In a previous study, we used reverse vaccinology to identify potential vaccine candidates against Campylobacter [38], and some of these vaccine candidates have already been tested using a DNA prime/protein boost vaccine regimen. These vaccines induced a partially protective immune response against Campylobacter, but the protections were not confirmed in a second trial [24]. It was speculated that the absence of significant protection in the second trial may have been due to high inter-individual Campylobacter colonisation rate differences (including the non-vaccinated group), thus masking a potential reduction in colonisation within some vaccine groups. One other hypothesis is that the protein vaccine batch affected vaccine efficacy in certain cases. Nevertheless, since these vaccine candidates induced partial protection once, they may be used again to evaluate several points. Firstly, to conclude regarding the protection against Campylobacter induced by antigens YP437 and YP9817 (i.e., two of the promising antigens) administered via the prime DNA/protein boost regimen, they were tested once again in this work, as was the potential effect of the vaccine production batch. Secondly, other parameters were evaluated to better characterise the immune responses and changes in microbiota induced after vaccination against Campylobacter colonisation; this will potentially help to identify avenues for improving the efficacy of future vaccines against Campylobacter in poultry.
In the present study, the colonisation of broilers by Campylobacter was evaluated from D22 to D42, but no protection was observed against Campylobacter with the three vaccines tested. Moreover, Campylobacter caecal loads presented a high inter-individual variability in all groups. These results have already been observed after a Campylobacter challenge in previous in vivo studies [24,49,50] and in broiler flocks [7].
In this work, a specific antibody response was tested in serum for the three tested antigens. A specific systemic immune response was observed for the YP437A vaccine (the same batch as previously used), confirming the immune potential of this antigen [24] and its quicker response than the YP437P vaccine (the new batch used only here), revealing that the batch can have an impact. Moreover, the YP9817P vaccine induced production of specific anti-YP9817P IgY in serum, also confirming the previous results [24], even though the batch was not the same. Despite the production of specific IgY in serum, no effect on Campylobacter colonisation was observed. As already suggested, IgY might have been absent or inaccessible (denatured, degraded, or both) during the passage through the intestine, thereby reaching the caeca at insufficient concentrations, or it might not have been active in the caeca [14,51,52].
A large majority of the IgA involved in mucosal immune responses is present in the bile [53]. In this study, significant quantities of specific IgA antibodies were produced in the YP9817P and YP437A groups (belatedly, on D42) but not in the YP437P group. The discrepancies between the two YP437 groups again indicate a batch effect on the induction of immune responses. More specifically, in the YP437A group, specific IgA appeared to increase over time without reducing Campylobacter colonisation. These results have already been observed in another study where there appeared to be an increase in IgA over time after the challenge by Campylobacter without, however, affecting Campylobacter colonisation [53]. On the other hand, the absence of a specific mucosal response observed in chickens in the YP437P group could have been due to the short half-life of IgA [54] or to the interference of maternal antibodies as has been previously demonstrated [25]. Maternal antibodies could block interactions between the circulating pathogen-derived antigens and immune cells [55].
The limited effect of humoral immunity (IgY and IgA production) on Campylobacter caecal load was already suggested by an immature bursa of Fabricius leading to an immature antibody repertoire of up to 5–7 weeks [56]. On the contrary, other studies have found that humoral immunity appears to be involved in the reduction of Campylobacter colonisation in birds [21,57] and, more specifically, in the mucosal immune response [58]. However, high antibody levels do not necessarily indicate in vivo protective power in broilers, as was previously observed when using these proteins [24] and other proteins of Campylobacter such as flagellin [17] or CjaA [59]. Antibodies need to bind protein epitopes, and it is essential that immunogenic conformational epitopes are available on the protein’s surface. As already suggested, the folding of a recombinant protein is not necessarily equivalent to the protein’s native structure and might expose epitopes normally hidden, thereby leading to a false-positive ELISA response [60].
It could be beneficial to determine the three-dimensional structure of the recombinant protein by X-ray crystallography to compare it with the three-dimensional structure model of the native protein in Campylobacter. However, in vivo assays—which are dependent on the protein of interest—represent the best probe for the native structure. Moreover, additional tests could be performed, such as determining N-terminal signal peptides or investigating the possibility of an alternative secretion pathway to obtain more information on the vaccinal potential of proteins. In fact, the N-terminal part could elicit a strong antibody response [60]. Thus, the combination of several conventional laboratory and bioinformatic tests could provide additional answers.
It is noteworthy that the production of specific antibodies (IgA and IgY) against the tested antigens was also observed in the negative group, whereas there was no Campylobacter in this group and therefore no specific antibody production was expected. These results could be explained by cross-reactions between the coated antigens and the presence of antibodies targeting similar protein domains on bacteria in the commensal microbiota.
Contrary to other studies from 2 days to 22 days post inoculation [32,36,37,61], we found no impact of Campylobacter on cytokine and β-defensin production on D42 (23 days post inoculation). Moreover, because the relative expression of certain genes was upregulated in vaccine groups compared with the placebo group but not when compared with the challenge and negative groups, it was not possible to reach a conclusion on the role of vaccination in innate and cellular response. We can also highlight that there was no significant difference in gene expression between the YP437A and YP437P vaccinated groups. Thus, there is no difference in innate and cellular responses depending on the production batch. However, one author found that cellular pathways appear to be stimulated by Campylobacter colonisation and not by vaccination until a certain level of tolerance to Campylobacter colonisation is reached [62]. Thus, the role played by these cytokines in the elaboration of a response remains to be explained.
In this study, the humoral immune responses were strongly stimulated in response to the three vaccines against Campylobacter, whereas the results regarding the expression of immunity genes were inconclusive. These results could be explained by the structure of epitopes. In fact, the epitopes exposed to the surface were probably conformational ones with discontinued residues. Moreover, it has been estimated that up to 90% of B cell epitopes from native proteins are conformational rather than linear ones [63].
The Firmicutes, Bacteroidota and Proteobacteria phyla predominated in the caecum of chickens, a situation consistent with previous reports [64,65,66,67]. The results of this study suggest that the presence of Campylobacter could be associated with a lower relative abundance of Firmicutes but a higher relative abundance of Bacteroidota. However, the contrary was observed in other studies [68,69]. Among the Bacteroidota phylum, Campylobacter seems to be associated with a higher relative abundance of the Bacteroides genus, but in another study, this genus was reported in flocks not colonised by Campylobacter [70]. Campylobacter seems to be associated with a lower relative abundance of the Subdoligranulum genus (Firmicutes phylum). In the same way, one study reported that Subdoligranulum occurred more often in Campylobacter-free flocks [70], whereas another study reported an increase in Subdoligranulum when exposed to C. jejuni [49]. The relative abundance of the Oscillospiraceae UCG-005 genus (Firmicutes phylum) was significantly lower in the YP9817P group than in the YP437A, challenge, and negative groups, suggesting that the type of vaccine could modulate the relative abundance of specific taxa in the caecal microbiota. Indeed, another study with a DNA prime/protein boost flagellin-based vaccine revealed an increase in the Ruminococcaceae and Bacillaceae families (Firmicutes phylum) in response to vaccination against Campylobacter [17]. Other studies on vaccination against Campylobacter have reported changes and in particular a high abundance of taxa belonging to the Firmicutes phylum [15,17,71]. However, another study has shown that the abundance and diversity of chicken gut microbiota were not impacted by three vaccinations with the Ent–KLH conjugate [18].
In this study, the DNA prime/protein boost strategy inoculated intramuscularly led, for all three vaccines, to strong systemic and mucosal antibody immune responses, but the implication of cytokines and β-defensins on D42 and major changes in the microbiota (measured only for vaccines YP437A and YP9817P) were not demonstrated. Moreover, the three vaccines did not offer protection against Campylobacter colonisation. A batch effect was observed between the YP437A and YP437P groups concerning the production of specific antibodies but not concerning the expression of cytokines and β-defensins, probably due to a different protein conformation or purity. Further investigations are needed, perhaps using another administration strategy by including other vectors or by evaluating other routes of inoculation such as the oral or in ovo routes. In fact, an important consideration in the vaccination strategy used in this study is that the antigens were delivered via intramuscular injection, resulting in a robust IgY antibody response. However, as Campylobacter is in the digestive tract of chickens, mucosal antibodies (e.g., mucosal delivery) may further reduce the colonisation of C. jejuni. A mucosal delivery of vaccine has previously demonstrated promising results against Campylobacter in the literature [22,29,72].

5. Conclusions

This study revealed that no reduction in Campylobacter caecal load was observed despite the induction of humoral and mucosal immune responses, particularly with YP437A and YP9817P vaccines. Moreover, a batch effect on the induction of immune responses was observed.
Further studies are needed to identify the role of immune responses and microbiota composition against Campylobacter. Future protocols of vaccination could be tested in broilers with other vaccine regimens (e.g., mucosal and in ovo).

Supplementary Materials

The following supporting information can be downloaded at: https://www.mdpi.com/article/10.3390/pharmaceutics15051397/s1, Table S1: Alpha diversity index values for all the chicken caecal samples on D42; Table S2: Table showing relative abundance of OTUs and their taxonomic affiliation in chicken caecal samples on day 42.

Author Contributions

Conceptualization, N.G., M.G.-N., M.C. and D.D.; methodology, N.G., M.G.-N., A.K. and D.D.; validation, N.G., M.G.-N., A.K. and D.D.; formal analysis, N.G. and M.G.-N.; investigation, N.G., M.G.-N., R.B., S.Q., A.K. and D.D.; resources, N.G., M.G.-N., A.K. and D.D.; data curation, N.G.; writing—original draft preparation, N.G.; writing—review and editing, N.G., M.G.-N., M.C. and D.D.; visualization, N.G. and M.G.-N.; supervision, M.G.-N., M.C. and D.D.; project administration, M.G.-N., M.C. and D.D.; funding acquisition, M.G.-N., M.C. and D.D. All authors have read and agreed to the published version of the manuscript.

Funding

N.G. was the recipient of a thesis salary paid by ANSES, Saint-Brieuc Armor Agglomération (VaccCamp project) and Conseil Départemental des Côtes d’Armor (VaccCamp project). This work was supported by the “Comité Interprofessionnel du Poulet de Chair—CIPC”, Rennes, France (ProtectCamp project). The experiments were self-funded by ANSES.

Institutional Review Board Statement

All experimental procedures were performed in accordance with French national guidelines on the care and use of animals for research purposes, approved by the “ComEth ANSES/ENVA/UPEC” ethics committee and authorised by the French Ministry of Higher Education, Research and Innovation (reference APAFIS#27000-2020082011122238 v2).

Data Availability Statement

Not applicable.

Acknowledgments

The authors would like to thank SEPPIC for kindly supplying MONTANIDE™ ISA78VG. We are also grateful to the Genomer platform, an EMBRC France partner core facility, for its technical support.

Conflicts of Interest

The authors declare no conflict of interest. The funders had no role in the design of the study; in the collection, analyses, or interpretation of data; in the writing of the manuscript; or in the decision to publish the results.

References

  1. European Food Safety Authority; European Centre for Disease Prevention and Control. The European Union One Health 2021 Zoonoses Report. EFSA J. 2022, 20, 7666. [Google Scholar] [CrossRef]
  2. Coker, A.O.; Isokpehi, R.D.; Thomas, B.N.; Amisu, K.O.; Obi, C.L. Human Campylobacteriosis in Developing Countries1. Emerg. Infect. Dis. 2002, 8, 237–243. [Google Scholar] [CrossRef]
  3. Sahin, O.; Yaeger, M.; Wu, Z.; Zhang, Q. Campylobacter-Associated Diseases in Animals. Annu. Rev. Anim. Biosci. 2017, 5, 21–42. [Google Scholar] [CrossRef]
  4. Acke, E. Campylobacteriosis in Dogs and Cats: A Review. N. Z. Vet. J. 2018, 66, 221–228. [Google Scholar] [CrossRef]
  5. Humphrey, T.; O’Brien, S.; Madsen, M. Campylobacters as Zoonotic Pathogens: A Food Production Perspective. Int. J. Food Microbiol. 2007, 117, 237–257. [Google Scholar] [CrossRef]
  6. Godschalk, P.C.R.; Kuijf, M.L.; Li, J.; St. Michael, F.; Ang, C.W.; Jacobs, B.C.; Karwaski, M.-F.; Brochu, D.; Moterassed, A.; Endtz, H.P.; et al. Structural Characterization of Campylobacter jejuni Lipooligosaccharide Outer Cores Associated with Guillain-Barré and Miller Fisher Syndromes. Infect. Immun. 2007, 75, 1245–1254. [Google Scholar] [CrossRef]
  7. Hansson, I.; Pudas, N.; Harbom, B.; Engvall, E.O. Within-Flock Variations of Campylobacter Loads in Caeca and on Carcasses from Broilers. Int. J. Food Microbiol. 2010, 141, 51–55. [Google Scholar] [CrossRef]
  8. Hue, O.; Allain, V.; Laisney, M.-J.; Le Bouquin, S.; Lalande, F.; Petetin, I.; Rouxel, S.; Quesne, S.; Gloaguen, P.-Y.; Picherot, M.; et al. Campylobacter Contamination of Broiler Caeca and Carcasses at the Slaughterhouse and Correlation with Salmonella Contamination. Food Microbiol. 2011, 28, 862–868. [Google Scholar] [CrossRef]
  9. Allain, V.; Chemaly, M.; Laisney, M.-J.; Rouxel, S.; Quesne, S.; Bouquin, S.L. Prevalence of and Risk Factors for Campylobacter Colonisation in Broiler Flocks at the End of the Rearing Period in France. Br. Poult. Sci. 2014, 55, 452–459. [Google Scholar] [CrossRef]
  10. Meade, K.G.; Narciandi, F.; Cahalane, S.; Reiman, C.; Allan, B.; O’Farrelly, C. Comparative in Vivo Infection Models Yield Insights on Early Host Immune Response to Campylobacter in Chickens. Immunogenetics 2009, 61, 101–110. [Google Scholar] [CrossRef]
  11. Awad, W.A.; Ruhnau, D.; Hess, C.; Hess, M. Campylobacter jejuni Increases the Paracellular Permeability of Broiler Chickens in a Dose-Dependent Manner. Poult. Sci. 2020, 99, 5407–5414. [Google Scholar] [CrossRef]
  12. EFSA. Analysis of the Baseline Survey on the Prevalence of Campylobacter in Broiler Batches and of Campylobacter and Salmonella on Broiler Carcasses in the EU, 2008—Part A: Campylobacter and Salmonella Prevalence Estimates. EFSA J. 2010, 8, 1503. [Google Scholar] [CrossRef]
  13. EFSA. Update and Review of Control Options for Campylobacter in Broilers at Primary Production. EFSA J. 2020, 18, e06090. [Google Scholar] [CrossRef]
  14. Vandeputte, J.; Martel, A.; Van Rysselberghe, N.; Antonissen, G.; Verlinden, M.; De Zutter, L.; Heyndrickx, M.; Haesebrouck, F.; Pasmans, F.; Garmyn, A. In Ovo Vaccination of Broilers against Campylobacter jejuni Using a Bacterin and Subunit Vaccine. Poult. Sci. 2019, 98, 5999–6004. [Google Scholar] [CrossRef]
  15. Nothaft, H.; Perez-Muñoz, M.E.; Yang, T.; Murugan, A.V.M.; Miller, M.; Kolarich, D.; Plastow, G.S.; Walter, J.; Szymanski, C.M. Improving Chicken Responses to Glycoconjugate Vaccination Against Campylobacter jejuni. Front. Microbiol. 2021, 12, 734526. [Google Scholar] [CrossRef]
  16. Liu, X.; Adams, L.J.; Zeng, X.; Lin, J. Evaluation of in Ovo Vaccination of DNA Vaccines for Campylobacter Control in Broiler Chickens. Vaccine 2019, 37, 3785–3792. [Google Scholar] [CrossRef]
  17. Gloanec, N.; Dory, D.; Quesne, S.; Béven, V.; Poezevara, T.; Keita, A.; Chemaly, M.; Guyard-Nicodème, M. Impact of DNA Prime/Protein Boost Vaccination against Campylobacter jejuni on Immune Responses and Gut Microbiota in Chickens. Vaccines 2022, 10, 981. [Google Scholar] [CrossRef]
  18. Cui, Y.; Guo, F.; Guo, J.; Cao, X.; Wang, H.; Yang, B.; Zhou, H.; Su, X.; Zeng, X.; Lin, J.; et al. Immunization of Chickens with the Enterobactin Conjugate Vaccine Reduced Campylobacter jejuni Colonization in the Intestine. Vaccines 2020, 8, 747. [Google Scholar] [CrossRef]
  19. Jeon, B.; Saisom, T.; Sasipreeyajan, J.; Luangtongkum, T. Live-Attenuated Oral Vaccines to Reduce Campylobacter Colonization in Poultry. Vaccines 2022, 10, 685. [Google Scholar] [CrossRef]
  20. Nothaft, H.; Davis, B.; Lock, Y.Y.; Perez-Munoz, M.E.; Vinogradov, E.; Walter, J.; Coros, C.; Szymanski, C.M. Engineering the Campylobacter jejuni N-Glycan to Create an Effective Chicken Vaccine. Sci. Rep. 2016, 6, 26511. [Google Scholar] [CrossRef]
  21. Annamalai, T.; Pina-Mimbela, R.; Kumar, A.; Binjawadagi, B.; Liu, Z.; Renukaradhya, G.J.; Rajashekara, G. Evaluation of Nanoparticle-Encapsulated Outer Membrane Proteins for the Control of Campylobacter jejuni Colonization in Chickens. Poult. Sci. 2013, 92, 2201–2211. [Google Scholar] [CrossRef]
  22. Gorain, C.; Singh, A.; Bhattacharyya, S.; Kundu, A.; Lahiri, A.; Gupta, S.; Mallick, A.I. Mucosal Delivery of Live Lactococcus Lactis Expressing Functionally Active JlpA Antigen Induces Potent Local Immune Response and Prevent Enteric Colonization of Campylobacter jejuni in Chickens. Vaccine 2020, 38, 1630–1642. [Google Scholar] [CrossRef]
  23. Hodgins, D.C.; Barjesteh, N.; St. Paul, M.; Ma, Z.; Monteiro, M.A.; Sharif, S. Evaluation of a Polysaccharide Conjugate Vaccine to Reduce Colonization by Campylobacter jejuni in Broiler Chickens. BMC Res. Notes 2015, 8, 204. [Google Scholar] [CrossRef]
  24. Meunier, M.; Guyard-Nicodème, M.; Vigouroux, E.; Poezevara, T.; Beven, V.; Quesne, S.; Bigault, L.; Amelot, M.; Dory, D.; Chemaly, M. Promising New Vaccine Candidates against Campylobacter in Broilers. PLoS ONE 2017, 12, e0188472. [Google Scholar] [CrossRef]
  25. Meunier, M.; Guyard-Nicodème, M.; Vigouroux, E.; Poezevara, T.; Béven, V.; Quesne, S.; Amelot, M.; Parra, A.; Chemaly, M.; Dory, D. A DNA Prime/Protein Boost Vaccine Protocol Developed against Campylobacter jejuni for Poultry. Vaccine 2018, 36, 2119–2125. [Google Scholar] [CrossRef]
  26. Nothaft, H.; Perez-Muñoz, M.E.; Gouveia, G.J.; Duar, R.M.; Wanford, J.J.; Lango-Scholey, L.; Panagos, C.G.; Srithayakumar, V.; Plastow, G.S.; Coros, C.; et al. Coadministration of the Campylobacter jejuni N-Glycan-Based Vaccine with Probiotics Improves Vaccine Performance in Broiler Chickens. Appl. Environ. Microbiol. 2017, 83, e01523-17. [Google Scholar] [CrossRef]
  27. Neal-McKinney, J.M.; Samuelson, D.R.; Eucker, T.P.; Nissen, M.S.; Crespo, R.; Konkel, M.E. Reducing Campylobacter jejuni Colonization of Poultry via Vaccination. PLoS ONE 2014, 9, e114254. [Google Scholar] [CrossRef]
  28. Radomska, K.A.; Vaezirad, M.M.; Verstappen, K.M.; Wösten, M.M.S.M.; Wagenaar, J.A.; Putten, J.P.M. van Chicken Immune Response after In Ovo Immunization with Chimeric TLR5 Activating Flagellin of Campylobacter jejuni. PLoS ONE 2016, 11, e0164837. [Google Scholar] [CrossRef]
  29. Taha-Abdelaziz, K.; Hodgins, D.C.; Alkie, T.N.; Quinteiro-Filho, W.; Yitbarek, A.; Astill, J.; Sharif, S. Oral Administration of PLGA-Encapsulated CpG ODN and Campylobacter jejuni Lysate Reduces Cecal Colonization by Campylobacter jejuni in Chickens. Vaccine 2018, 36, 388–394. [Google Scholar] [CrossRef]
  30. Layton, S.L.; Morgan, M.J.; Cole, K.; Kwon, Y.M.; Donoghue, D.J.; Hargis, B.M.; Pumford, N.R. Evaluation of Salmonella-Vectored Campylobacter Peptide Epitopes for Reduction of Campylobacter jejuni in Broiler Chickens. Clin. Vaccine Immunol. CVI 2011, 18, 449–454. [Google Scholar] [CrossRef]
  31. Theoret, J.R.; Cooper, K.K.; Zekarias, B.; Roland, K.L.; Law, B.F.; Curtiss, R.; Joens, L.A. The Campylobacter jejuni Dps Homologue Is Important for in Vitro Biofilm Formation and Cecal Colonization of Poultry and May Serve as a Protective Antigen for Vaccination. Clin. Vaccine Immunol. 2012, 19, 1426–1431. [Google Scholar] [CrossRef]
  32. Connerton, P.L.; Richards, P.J.; Lafontaine, G.M.; O’Kane, P.M.; Ghaffar, N.; Cummings, N.J.; Smith, D.L.; Fish, N.M.; Connerton, I.F. The Effect of the Timing of Exposure to Campylobacter jejuni on the Gut Microbiome and Inflammatory Responses of Broiler Chickens. Microbiome 2018, 6, 88. [Google Scholar] [CrossRef]
  33. Han, Z.; Pielsticker, C.; Gerzova, L.; Rychlik, I.; Rautenschlein, S. The Influence of Age on Campylobacter jejuni Infection in Chicken. Dev. Comp. Immunol. 2016, 62, 58–71. [Google Scholar] [CrossRef]
  34. Han, Z.; Willer, T.; Li, L.; Pielsticker, C.; Rychlik, I.; Velge, P.; Kaspers, B.; Rautenschlein, S. Influence of the Gut Microbiota Composition on Campylobacter jejuni Colonization in Chickens. Infect. Immun. 2017, 85, e00380-17. [Google Scholar] [CrossRef]
  35. Han, Z.; Willer, T.; Pielsticker, C.; Gerzova, L.; Rychlik, I.; Rautenschlein, S. Differences in Host Breed and Diet Influence Colonization by Campylobacter jejuni and Induction of Local Immune Responses in Chicken. Gut Pathog. 2016, 8, 56. [Google Scholar] [CrossRef]
  36. Reid, W.D.K.; Close, A.J.; Humphrey, S.; Chaloner, G.; Lacharme-Lora, L.; Rothwell, L.; Kaiser, P.; Williams, N.J.; Humphrey, T.J.; Wigley, P.; et al. Cytokine Responses in Birds Challenged with the Human Food-Borne Pathogen Campylobacter jejuni Implies a Th17 Response. R. Soc. Open Sci. 2016, 3, 150541. [Google Scholar] [CrossRef]
  37. Garcia, J.S.; Byrd, J.A.; Wong, E.A. Expression of Nutrient Transporters and Host Defense Peptides in Campylobacter Challenged Broilers. Poult. Sci. 2018, 97, 3671–3680. [Google Scholar] [CrossRef]
  38. Meunier, M.; Guyard-Nicodème, M.; Hirchaud, E.; Parra, A.; Chemaly, M.; Dory, D. Identification of Novel Vaccine Candidates against Campylobacter through Reverse Vaccinology. J. Immunol. Res. 2016, 2016, 5715790. [Google Scholar] [CrossRef]
  39. Awad, W.A.; Aschenbach, J.R.; Ghareeb, K.; Khayal, B.; Hess, C.; Hess, M. Campylobacter jejuni Influences the Expression of Nutrient Transporter Genes in the Intestine of Chickens. Vet. Microbiol. 2014, 172, 195–201. [Google Scholar] [CrossRef]
  40. Yu, H.; Zou, W.; Xin, S.; Wang, X.; Mi, C.; Dai, G.; Zhang, T.; Zhang, G.; Xie, K.; Wang, J.; et al. Association Analysis of Single Nucleotide Polymorphisms in the 5′ Regulatory Region of the IL-6 Gene with Eimeria Tenella Resistance in Jinghai Yellow Chickens. Genes 2019, 10, 890. [Google Scholar] [CrossRef]
  41. Gloanec, N.; Dory, D.; Quesne, S.; Béven, V.; Poezevara, T.; Amelot, M.; Chemaly, M.; Guyard-Nicodème, M. Research Note: Analysis of Immune Responses in Broilers after Vaccination against Campylobacter jejuni. Poult. Sci. 2023, 102, 102510. [Google Scholar] [CrossRef]
  42. Paul, M.S.; Paolucci, S.; Barjesteh, N.; Wood, R.D.; Schat, K.A.; Sharif, S. Characterization of Chicken Thrombocyte Responses to Toll-Like Receptor Ligands. PLoS ONE 2012, 7, e43381. [Google Scholar] [CrossRef]
  43. R Core Team. R: A Language and Environment for Statistical Computing; R Foundation for Statistical Computing: Vienna, Austria, 2022. [Google Scholar]
  44. Escudié, F.; Auer, L.; Bernard, M.; Mariadassou, M.; Cauquil, L.; Vidal, K.; Maman, S.; Hernandez-Raquet, G.; Combes, S.; Pascal, G. FROGS: Find, Rapidly, OTUs with Galaxy Solution. Bioinformatics 2018, 34, 1287–1294. [Google Scholar] [CrossRef]
  45. Pumtang-on, P.; Mahony, T.J.; Hill, R.A.; Vanniasinkam, T. A Systematic Review of Campylobacter jejuni Vaccine Candidates for Chickens. Microorganisms 2021, 9, 397. [Google Scholar] [CrossRef]
  46. Meunier, M.; Guyard-Nicodème, M.; Dory, D.; Chemaly, M. Control Strategies against Campylobacter at the Poultry Production Level: Biosecurity Measures, Feed Additives and Vaccination. J. Appl. Microbiol. 2016, 120, 1139–1173. [Google Scholar] [CrossRef]
  47. Abd El-Hack, M.E.; El-Saadony, M.T.; Shehata, A.M.; Arif, M.; Paswan, V.K.; Batiha, G.E.-S.; Khafaga, A.F.; Elbestawy, A.R. Approaches to Prevent and Control Campylobacter Spp. Colonization in Broiler Chickens: A Review. Environ. Sci. Pollut. Res. 2021, 28, 4989–5004. [Google Scholar] [CrossRef]
  48. Meunier, M.; Chemaly, M.; Dory, D. DNA Vaccination of Poultry: The Current Status in 2015. Vaccine 2016, 34, 202–211. [Google Scholar] [CrossRef]
  49. Saint-Cyr, M.J.; Haddad, N.; Taminiau, B.; Poezevara, T.; Quesne, S.; Amelot, M.; Daube, G.; Chemaly, M.; Dousset, X.; Guyard-Nicodème, M. Use of the Potential Probiotic Strain Lactobacillus Salivarius SMXD51 to Control Campylobacter jejuni in Broilers. Int. J. Food Microbiol. 2017, 247, 9–17. [Google Scholar] [CrossRef]
  50. Guyard-Nicodème, M.; Keita, A.; Quesne, S.; Amelot, M.; Poezevara, T.; Le Berre, B.; Sánchez, J.; Vesseur, P.; Martín, Á.; Medel, P.; et al. Efficacy of Feed Additives against Campylobacter in Live Broilers during the Entire Rearing Period1. Poult. Sci. 2016, 95, 298–305. [Google Scholar] [CrossRef]
  51. Chalghoumi, R.; Marcq, C.; Théwis, A.; Portetelle, D.; Beckers, Y. Effects of Feed Supplementation with Specific Hen Egg Yolk Antibody (Immunoglobin Y) on Salmonella Species Cecal Colonization and Growth Performances of Challenged Broiler Chickens. Poult. Sci. 2009, 88, 2081–2092. [Google Scholar] [CrossRef]
  52. Paul, N.C.; Al-Adwani, S.; Crespo, R.; Shah, D.H. Evaluation of Passive Immunotherapeutic Efficacy of Hyperimmunized Egg Yolk Powder against Intestinal Colonization of Campylobacter jejuni in Chickens. Poult. Sci. 2014, 93, 2779–2787. [Google Scholar] [CrossRef] [PubMed]
  53. Mortada, M.; Cosby, D.E.; Akerele, G.; Ramadan, N.; Oxford, J.; Shanmugasundaram, R.; Ng, T.T.; Selvaraj, R.K. Characterizing the Immune Response of Chickens to Campylobacter jejuni (Strain A74C). PLoS ONE 2021, 16, e0247080. [Google Scholar] [CrossRef]
  54. Davis, S.K.; Selva, K.J.; Kent, S.J.; Chung, A.W. Serum IgA Fc Effector Functions in Infectious Disease and Cancer. Immunol. Cell Biol. 2020, 98, 276–286. [Google Scholar] [CrossRef] [PubMed]
  55. Klipper, E.; Sklan, D.; Friedman, A. Maternal Antibodies Block Induction of Oral Tolerance in Newly Hatched Chicks. Vaccine 2004, 22, 493–502. [Google Scholar] [CrossRef] [PubMed]
  56. Lacharme-Lora, L.; Chaloner, G.; Gilroy, R.; Humphrey, S.; Gibbs, K.; Jopson, S.; Wright, E.; Reid, W.; Ketley, J.; Humphrey, T.; et al. B Lymphocytes Play a Limited Role in Clearance of Campylobacter jejuni from the Chicken Intestinal Tract. Sci. Rep. 2017, 7, 45090. [Google Scholar] [CrossRef] [PubMed]
  57. Li, L.; Pielsticker, C.; Han, Z.; Kubasová, T.; Rychlik, I.; Kaspers, B.; Rautenschlein, S. Infectious Bursal Disease Virus Inoculation Infection Modifies Campylobacter jejuni–Host Interaction in Broilers. Gut Pathog. 2018, 10, 13. [Google Scholar] [CrossRef]
  58. Rice, B.E.; Rollins, D.M.; Mallinson, E.T.; Carr, L.; Joseph, S.W. Campylobacter jejuni in Broiler Chickens: Colonization and Humoral Immunity Following Oral Vaccination and Experimental Infection. Vaccine 1997, 15, 1922–1932. [Google Scholar] [CrossRef]
  59. Łaniewski, P.; Kuczkowski, M.; Chrząstek, K.; Woźniak, A.; Wyszyńska, A.; Wieliczko, A.; Jagusztyn-Krynicka, E.K. Evaluation of the Immunogenicity of Campylobacter jejuni CjaA Protein Delivered by Salmonella Enterica Sv. Typhimurium Strain with Regulated Delayed Attenuation in Chickens. World J. Microbiol. Biotechnol. 2014, 30, 281–292. [Google Scholar] [CrossRef]
  60. Bager, R.J.; Kudirkiene, E.; da Piedade, I.; Seemann, T.; Nielsen, T.K.; Pors, S.E.; Mattsson, A.H.; Boyce, J.D.; Adler, B.; Bojesen, A.M. In Silico Prediction of Gallibacterium Anatis Pan-Immunogens. Vet. Res. 2014, 45, 80. [Google Scholar] [CrossRef]
  61. Li, X.; Swaggerty, C.L.; Kogut, M.H.; Chiang, H.-I.; Wang, Y.; Genovese, K.J.; He, H.; Zhou, H. Gene Expression Profiling of the Local Cecal Response of Genetic Chicken Lines That Differ in Their Susceptibility to Campylobacter jejuni Colonization. PLoS ONE 2010, 5, e11827. [Google Scholar] [CrossRef]
  62. Hermans, D.; Pasmans, F.; Heyndrickx, M.; Immerseel, F.V.; Martel, A.; Deun, K.V.; Haesebrouck, F. A Tolerogenic Mucosal Immune Response Leads to Persistent Campylobacter jejuni Colonization in the Chicken Gut. Crit. Rev. Microbiol. 2012, 38, 17–29. [Google Scholar] [CrossRef] [PubMed]
  63. Horsfall, A.C.; Hay, F.C.; Soltys, A.J.; Jones, M.G. Epitope Mapping. Immunol. Today 1991, 12, 211–213. [Google Scholar] [CrossRef] [PubMed]
  64. Wei, S.; Morrison, M.; Yu, Z. Bacterial Census of Poultry Intestinal Microbiome. Poult. Sci. 2013, 92, 671–683. [Google Scholar] [CrossRef] [PubMed]
  65. Zou, A.; Sharif, S.; Parkinson, J. Lactobacillus Elicits a “Marmite Effect” on the Chicken Cecal Microbiome. Npj. Biofilms Microbiomes 2018, 4, 27. [Google Scholar] [CrossRef]
  66. Xi, Y.; Shuling, N.; Kunyuan, T.; Qiuyang, Z.; Hewen, D.; ChenCheng, G.; Tianhe, Y.; Liancheng, L.; Xin, F. Characteristics of the Intestinal Flora of Specific Pathogen Free Chickens with Age. Microb. Pathog. 2019, 132, 325–334. [Google Scholar] [CrossRef]
  67. Du, W.; Deng, J.; Yang, Z.; Zeng, L.; Yang, X. Metagenomic Analysis Reveals Linkages between Cecal Microbiota and Feed Efficiency in Xiayan Chickens. Poult. Sci. 2020, 99, 7066–7075. [Google Scholar] [CrossRef]
  68. Qu, A.; Brulc, J.M.; Wilson, M.K.; Law, B.F.; Theoret, J.R.; Joens, L.A.; Konkel, M.E.; Angly, F.; Dinsdale, E.A.; Edwards, R.A.; et al. Comparative Metagenomics Reveals Host Specific Metavirulomes and Horizontal Gene Transfer Elements in the Chicken Cecum Microbiome. PLoS ONE 2008, 3, e2945. [Google Scholar] [CrossRef]
  69. Awad, W.A.; Mann, E.; Dzieciol, M.; Hess, C.; Schmitz-Esser, S.; Wagner, M.; Hess, M. Age-Related Differences in the Luminal and Mucosa-Associated Gut Microbiome of Broiler Chickens and Shifts Associated with Campylobacter jejuni Infection. Front. Cell. Infect. Microbiol. 2016, 6, 154. [Google Scholar] [CrossRef]
  70. Hertogs, K.; Haegeman, A.; Schaumont, D.; Gelaude, P.; De Zutter, L.; Dewulf, J.; Heyndrickx, M.; Rasschaert, G. Contamination Sources and Transmission Routes for Campylobacter on (Mixed) Broiler Farms in Belgium, and Comparison of the Gut Microbiota of Flocks Colonized and Uncolonized with Campylobacter. Pathogens 2021, 10, 66. [Google Scholar] [CrossRef]
  71. Taha-Abdelaziz, K.; Yitbarek, A.; Alkie, T.N.; Hodgins, D.C.; Read, L.R.; Weese, J.S.; Sharif, S. PLGA-Encapsulated CpG ODN and Campylobacter jejuni Lysate Modulate Cecal Microbiota Composition in Broiler Chickens Experimentally Challenged with C. Jejuni. Sci. Rep. 2018, 8, 12076. [Google Scholar] [CrossRef]
  72. Wang, C.; Zhou, H.; Guo, F.; Yang, B.; Su, X.; Lin, J.; Xu, F. Oral Immunization of Chickens with Lactococcus Lactis Expressing CjaA Temporarily Reduces Campylobacter jejuni Colonization. Foodborne Pathog. Dis. 2020, 17, 366–372. [Google Scholar] [CrossRef] [PubMed]
Figure 1. The experimental design. The number of chickens (n) necropsied per group on each euthanisation day is shown. The YP9817P group was composed of fewer chickens, because a smaller quantity of recombinant proteins was available than for the other groups (YP437A and YP437P) after purification.
Pharmaceutics 15 01397 g001
Figure 2. Caecal Campylobacter load from D22 to D42 in vaccinated groups and control groups. Each point represents one chicken. For each time point, the inter-group caecal Campylobacter load was compared using an ANOVA parametric test when the normality and homogeneity criteria of the variances had been validated; otherwise, the non-parametric Kruskall-Wallis test was applied. Significant differences (p ≤ 0.05) between groups were estimated using the Tukey test after an ANOVA parametric test or the Wilcoxon test after the Kruskall-Wallis test.
Pharmaceutics 15 01397 g002
Figure 3. Specific anti-YP437A, anti-YP437P and anti-YP9817P IgY levels in serum from D19 to D42 in vaccinated groups and control groups. Each point represents one chicken. (A) Specific anti-YP437A IgY (B) Specific anti-YP437P IgY (C) Specific anti-YP9817P IgY. To compare antibody levels between the groups on each test day, an ANOVA parametric test was used when the normality and homogeneity criteria of the variances had been validated; otherwise, the non-parametric Kruskall-Wallis test was applied. Significant differences (p ≤ 0.05) between groups estimated using the Tukey test after an ANOVA parametric test or the Wilcoxon test after the Kruskall-Wallis test are represented by superscript letters abc.
Pharmaceutics 15 01397 g003
Figure 4. Specific anti-YP437A, anti-YP437P and anti-YP9817P IgA levels in bile from D19 to D42 in vaccinated groups and control groups. Each point represents one chicken. (A) Specific anti-YP437A IgA (B) Specific anti-YP437P IgA (C) Specific anti-YP9817P IgA. To compare antibody levels between the groups on each test day, an ANOVA parametric test was used when the normality and homogeneity criteria of the variances had been validated; otherwise, the non-parametric Kruskall-Wallis test was applied. Significant differences (p ≤ 0.05) between groups estimated using the Tukey test after an ANOVA parametric test or the Wilcoxon test after the Kruskall-Wallis test are represented by superscript letters abc.
Pharmaceutics 15 01397 g004
Figure 5. Expressions of cytokines and β-defensins in the caecum on D42. Each gene’s expression, represented by delta Ct, corresponds to the average of the differences in the duplicate Ct for each gene and the duplicate Ct for each of the two reference genes (GAPDH and β-actin). Each point represents one chicken. The higher values represent a lower expression while smaller values represent a higher expression. For each gene, statistical tests were performed using the mean of the duplicates of 2-ΔCt data obtained thanks to the two reference genes. The non-parametric Kruskall-Wallis test was applied. Significant differences (p ≤ 0.05) between groups were estimated using the Wilcoxon test and are represented by superscript letters abc. The genes evaluated were host defence peptide avian β-defensins 10 (AvBD10) and AvBD12, interleukin (IL)17-A, IL-1β, IL8L1, IL8L2, interferon (IFN)-γ, IL-10, IL-4, IL-6.
Pharmaceutics 15 01397 g005
Figure 6. Richness and alpha diversity indices for the chickens’ caecal microbiota on D42. Each point represents one chicken. To compare the groups, the parametric ANOVA test was applied. Significant differences (p ≤ 0.05) between groups were estimated using the Tukey test and are represented by superscript letters abc.
Pharmaceutics 15 01397 g006
Figure 7. Representation of the beta diversity for the chickens’ caecal microbiota on D42. (A) MDS based on weighted UniFrac distance. Each point represents one chicken. (B) The heatmap represents the community structure. The relative abundance of OTUs is represented by the colour scale, yellow being the least and red the most abundant.
Pharmaceutics 15 01397 g007
Figure 8. Composition of the caecal microbiota structure at the phylum level on D42. (A) Relative abundance of the six phyla identified in caecal microbiota. Each bar represents one sample. (B) Relative abundance of the two phyla which differed significantly between groups. Each point represents one chicken. To compare the groups, the non-parametric Kruskall-Wallis test was applied. Significant differences (p ≤ 0.05) between groups were estimated using the Wilcoxon test and are represented by superscript letters ab.
Pharmaceutics 15 01397 g008
Figure 9. Composition of the caecal microbiota structure at the genus level. (A) Relative abundance of the nine main genera identified in caecal microbiota represented by a bar for each sample. (B) Relative abundance of the major genus with a significant difference between the groups. Each point represents one chicken. To compare the groups, the non-parametric Kruskall-Wallis test was applied. Significant differences (p ≤ 0.05) between groups were estimated using the Wilcoxon test and are represented by superscript letters ab.
Pharmaceutics 15 01397 g009
Table 1. Conditions of protein coating and antibody dilutions for each protein in serum and bile.
ProteinCoating (µg/mL)Dilution of
Primary Antibody
Dilution of
Secondary Antibody
Serum
YP437A0.51:1001:25,000
YP437P2.01:501:25,000
YP9817P0.21:1001:35,000
Bile
YP437A0.51:1001:5000
YP437P2.01:501:2000
YP9817P0.21:1001:2000
Table 2. Primer sequences for the gene expression of IL-6 and GAPDH determined by qPCR.
Target GenePrimer Sequence (5′-3′)Product Size (bp)NCBI Accession
Number
Reference
IL-6F: CGTGTGCGAGAACAGCATGGAGA
R: TCAGGCATTTCTCCTCGTCGAAGC
110NM_204628.1[42]
GAPDHF: TGACGTGCAGCAGGAACACT
R: AATACGGCCAAATCCGTTGAC
67NM_204305.1Determined using Primer Express®
Table 3. Body weights (presented as mean ± SD in g) of chicken groups at different time points during the trial. To compare body weights between the different groups each day, an ANOVA parametric test was used when the normality and homogeneity criteria of the variances had been validated; otherwise, the non-parametric Kruskall-Wallis test was applied. Significant differences (p ≤ 0.05) between groups and the negative group were estimated using the Tukey test after an ANOVA parametric test or the Wilcoxon test after the Kruskall-Wallis test and are indicated by “(p ≤ 0.05)”.
GroupsDay 5Day 12Day 19Day 22Day 28Day 35Day 42
YP437A113 ± 9353 ± 30776 ± 86995 ± 1161538 ± 2522283 ± 3733042 ± 517
YP437P111 ± 9354 ± 24788 ± 731031 ± 1061582 ± 1692355 ± 2653285 ± 255
YP9817P115 ± 7355 ± 23763 ± 861091 ± 2401606 ± 2322296 ± 3763060 ± 446
Placebo114 ± 9352 ± 31767 ± 74
(p < 0.05)
1018 ± 1091629 ± 2032506 ± 3753314 ± 509
Challenge111 ± 8377 ± 27846 ± 721095 ± 921724 ± 1742574 ± 2743927 ± 484
Negative109 ± 9362 ± 36812 ± 1361069 ± 1481610 ± 2922462 ± 4723483 ± 526
Table 4. Minimum and maximum OTUs per group.
GroupsOTUs (Min)OTUs (Max)
YP437A424567
YP9817P370435
Placebo343484
Challenge402503
Negative349519
Disclaimer/Publisher’s Note: The statements, opinions and data contained in all publications are solely those of the individual author(s) and contributor(s) and not of MDPI and/or the editor(s). MDPI and/or the editor(s) disclaim responsibility for any injury to people or property resulting from any ideas, methods, instructions or products referred to in the content.

