
Use of In Vivo Imaging and Physiologically-Based Kinetic Modelling to Predict Hepatic Transporter Mediated Drug–Drug Interactions in Rats
 , , , ,
Abstract
:1. Introduction
2. Materials and Methods
2.1. Source of Test Chemicals
2.2. Review of Inhibitory Potency and Model-Based Dose Selection for Drugs
2.3. Animal Handling and In Vivo Study Design
2.4. Gadoxetate DCE-MRI Data Acquisition and Elaboration
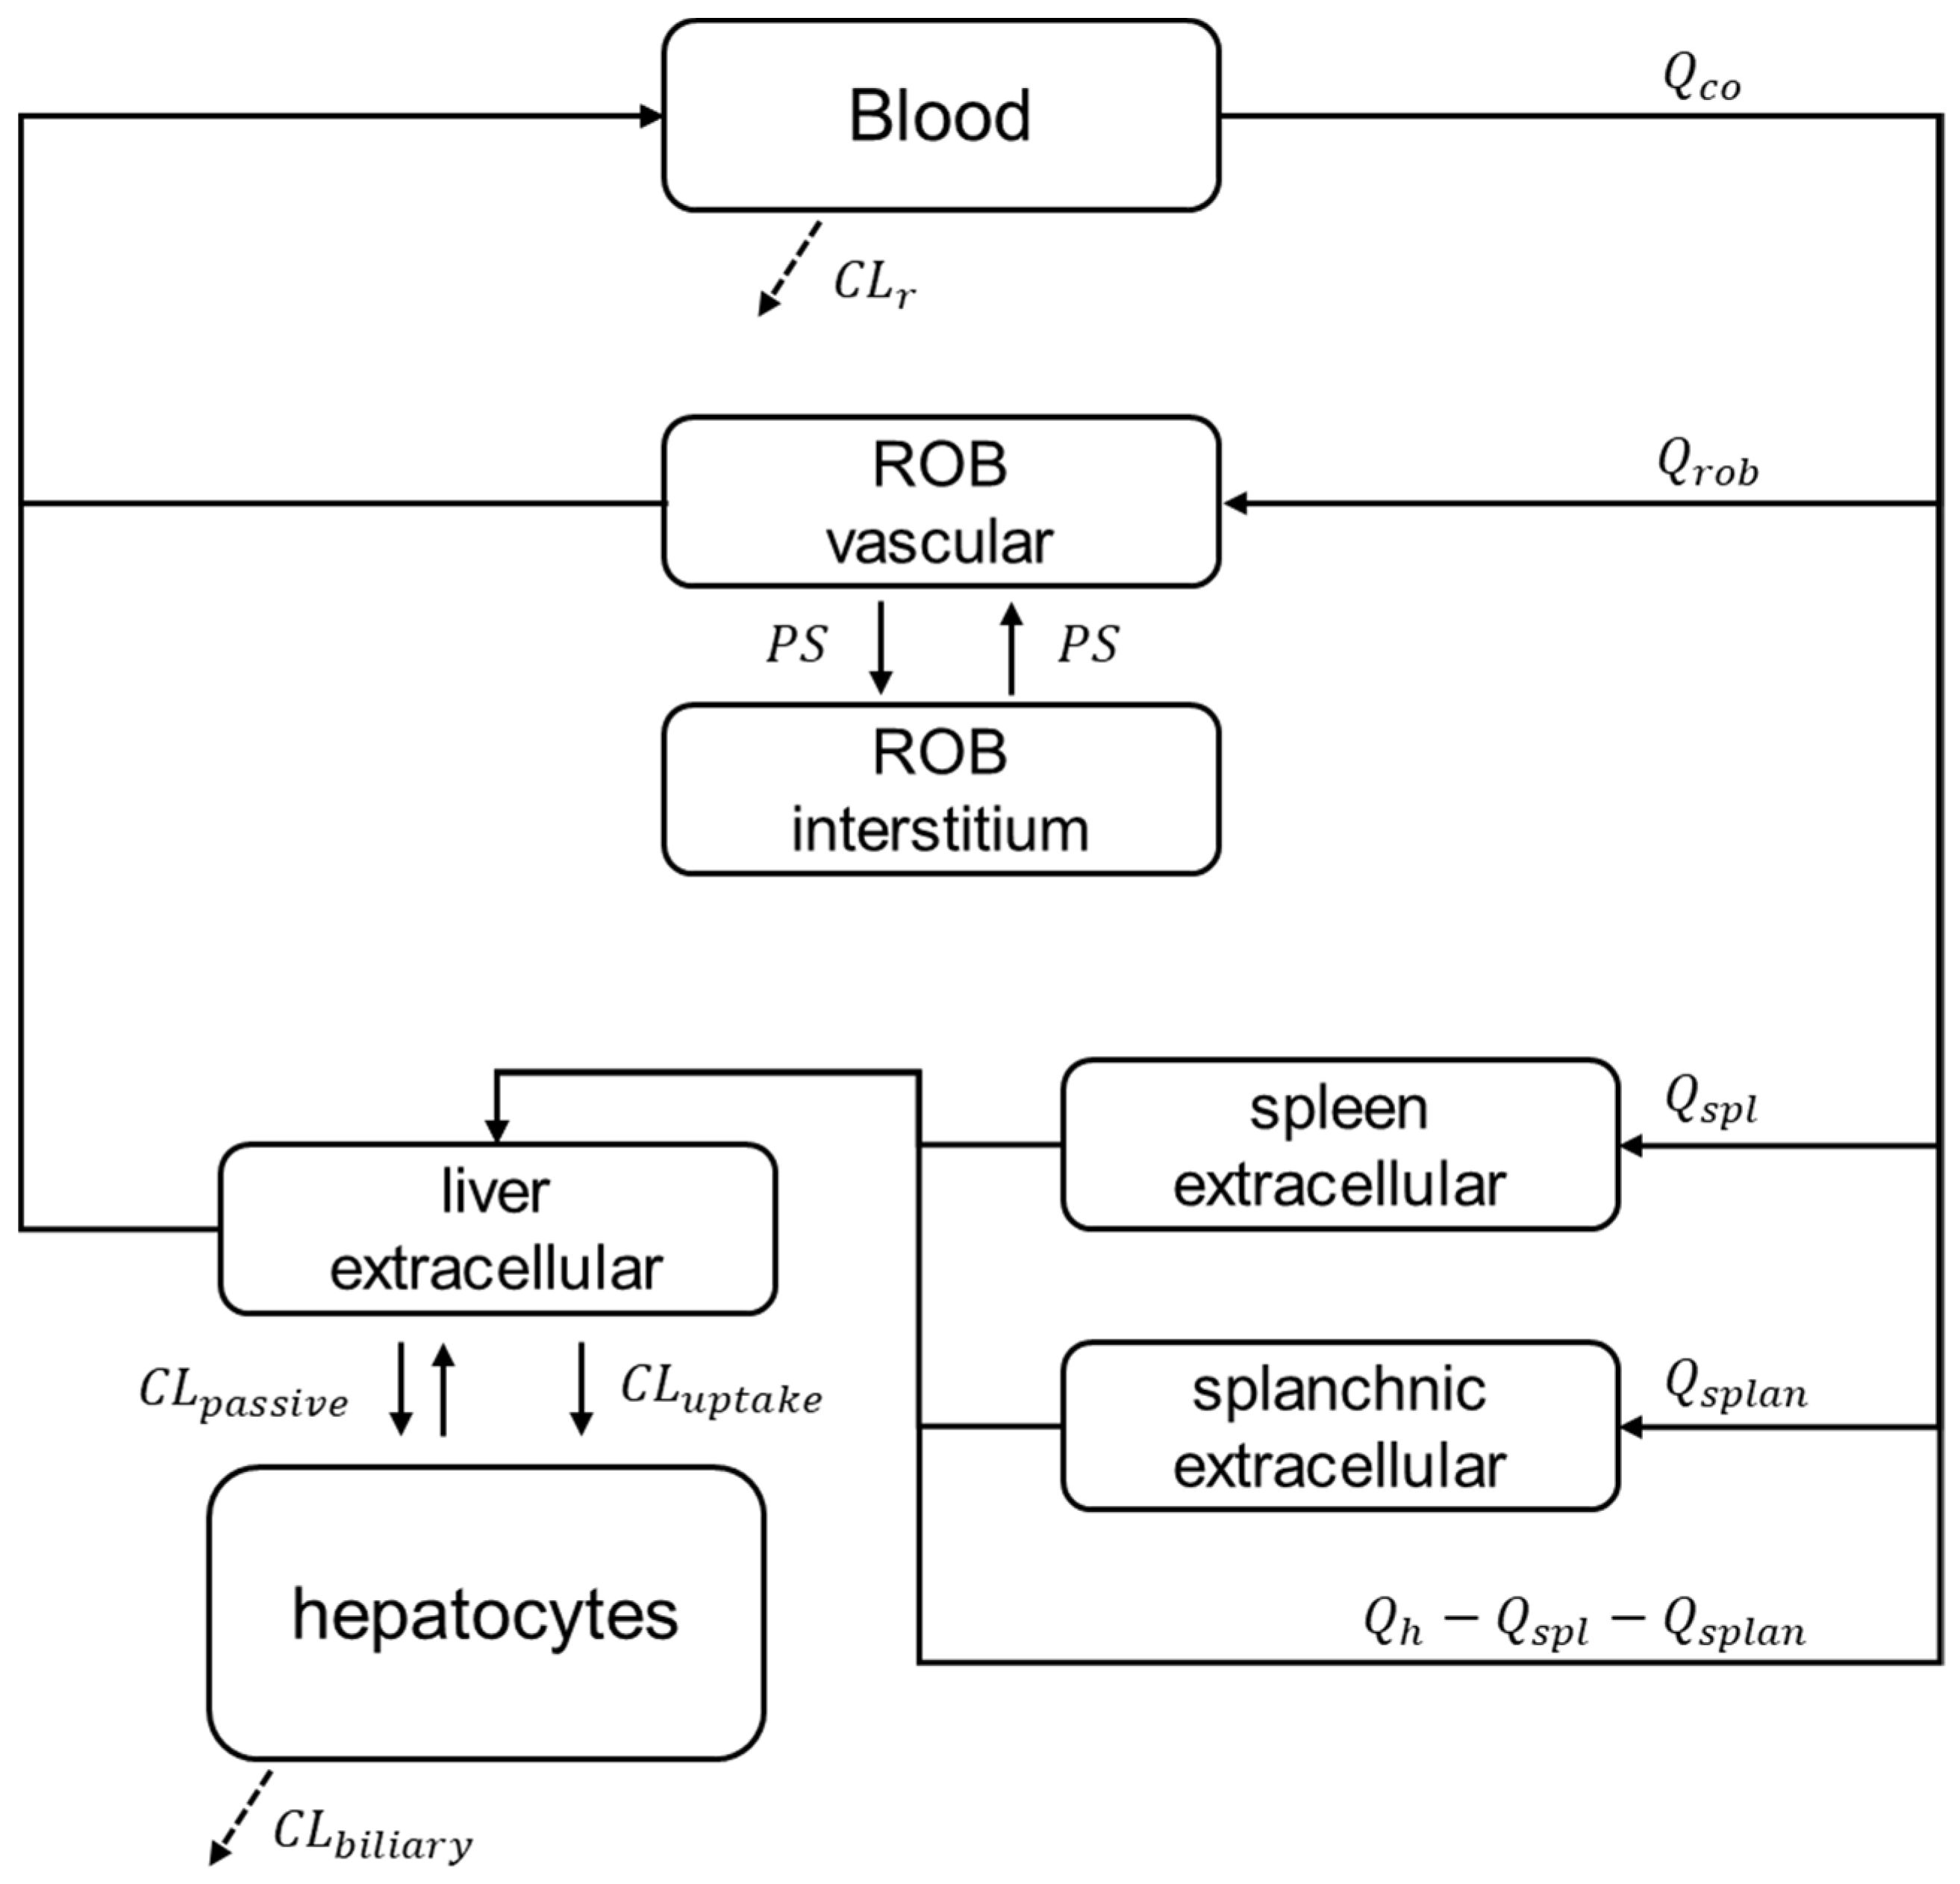
2.5. PBPK Modelling and Prospective Hepatic Transporters DDI Prediction
2.6. Tracer-Kinetic Model and Ktrans, khe, and kbh Calculation
3. Results
3.1. Drug Inhibitory Potency and Model-Based Dose Selection

| Drug | Ki (µM) rOatp1a4 | IC50 (µM) rOatp1a4 | IC50 (µM) rOatp1b2 | IC50 (µM) rOatp1b2 | IC50 (µM) rNtcp | IC50 (µM) rMrp2 |
|---|---|---|---|---|---|---|
| Rifampicin | 2.9 | 1.3 | 0.79 | 0.6–1.1 | NA | 20–53 |
| Asunaprevir | NA | NA | NA | NA | 0.6 | 11 |
| Bosentan | NA | NA | NA | NA | 0.4 | NI |
| Ciclosporin | NA | 3–30 | 1.2 | NA | 1.5 | 5–15 |
| Ketoconazole | NA | NA | NA | NA | NA | NA |
| Pioglitazone | NA | NA | NA | NA | NA | NA |
| Drug | Ki (µM) OATP1B1 a | IC50 (µM) OATP1B1 a | IC50 (µM) OATP1B3 | IC50 (µM) NTCP | Ki (µM) MRP2 a | IC50 (µM) MRP2 a | Cmax (µM) [Daily Dose] | fu |
|---|---|---|---|---|---|---|---|---|
| Rifampicin | 0.67 (0.22–17) | 1.90 (0.24–120) | 0.11 | 277 | 24.3 (7.9–40.6) | 55 (14.7–144) | 0.85 [600 mg] | 0.2 |
| Asunaprevir | NA | 0.55 (0.3–0.79) | 0.65 | NA | NA | 4 | 0.76 [200 mg] | 0.012 |
| Bosentan | NA | 6.6 (5.0–8.2) | 5.2 | 18 | NA | >100 | 3.3 [250 mg] | <0.02 |
| Ciclosporin | 0.014 (0.22–2.32) | 0.50 (0.02–3.5) | 0.032 | 0.37 | 4.7 (21–24) | 2.7 (5.6–45.3) | 1.5 [4 mg/kg] | 0.1 |
| Ketoconazole | 50.7 (11.5–107.7) | 15.4 (1.8–60.9) | 3.9 | 202 | NA | >20 | 6.6 [200 mg] | 0.01 |
| Pioglitazone | NA | 5.09 (11.1–39.6) | 3.41 | 4.04 | NA | >133 | 4.8 [30 mg] | <0.01 |
3.2. DCE-MRI Interaction Data
3.3. Prospective Prediction of Gadoxetate Hepatic Transporter-Mediated DDIs with PBPK Model
3.4. Tracer-Kinetic Model Based Analysis
4. Discussion
4.1. Data Analysis and Endpoints for Transporter Interaction Assessment with Imaging Data
4.2. Integrative Approach Needed to Interpret Imaging Data
4.3. Biological Relevance of Interaction Effects on Ktrans, khe, and kbh
4.4. Imaging Data to Support PBPK-Based Quantitative Translation
5. Conclusions
Supplementary Materials
Author Contributions
Funding
Institutional Review Board Statement
Informed Consent Statement
Data Availability Statement
Acknowledgments
Conflicts of Interest
References
- Neuvonen, P.J.; Niemi, M.; Backman, J.T. Drug interactions with lipid-lowering drugs: Mechanisms and clinical relevance. Clin. Pharmacol. Ther. 2006, 80, 565–581. [Google Scholar] [CrossRef] [PubMed]
- Galetin, A.; Zhao, P.; Huang, S.M. Physiologically Based Pharmacokinetic Modeling of Drug Transporters to Facilitate Individualized Dose Prediction. J. Pharm. Sci. 2017, 106, 2204–2208. [Google Scholar] [CrossRef] [PubMed] [Green Version]
- Zamek-Gliszczynski, M.J.; Chu, X.; Cook, J.A.; Custodio, J.M.; Galetin, A.; Giacomini, K.M.; Lee, C.A.; Paine, M.F.; Ray, A.S.; Ware, J.A.; et al. ITC Commentary on Metformin Clinical Drug-Drug Interaction Study Design That Enables an Efficacy- and Safety-Based Dose Adjustment Decision. Clin. Pharmacol. Ther. 2018, 104, 781–784. [Google Scholar] [CrossRef] [Green Version]
- Taskar, K.S.; Pilla Reddy, V.; Burt, H.; Posada, M.M.; Varma, M.; Zheng, M.; Ullah, M.; Emami Riedmaier, A.; Umehara, K.I.; Snoeys, J.; et al. Physiologically-Based Pharmacokinetic Models for Evaluating Membrane Transporter Mediated Drug-Drug Interactions: Current Capabilities, Case Studies, Future Opportunities, and Recommendations. Clin. Pharmacol. Ther. 2020, 107, 1082–1115. [Google Scholar] [CrossRef] [PubMed] [Green Version]
- Yoshida, K.; Zhao, P.; Zhang, L.; Abernethy, D.R.; Rekic, D.; Reynolds, K.S.; Galetin, A.; Huang, S.M. In Vitro-In Vivo Extrapolation of Metabolism- and Transporter-Mediated Drug-Drug Interactions-Overview of Basic Prediction Methods. J. Pharm. Sci. 2017, 106, 2209–2213. [Google Scholar] [CrossRef] [Green Version]
- Guo, Y.; Chu, X.; Parrott, N.J.; Brouwer, K.L.R.; Hsu, V.; Nagar, S.; Matsson, P.; Sharma, P.; Snoeys, J.; Sugiyama, Y.; et al. Advancing Predictions of Tissue and Intracellular Drug Concentrations Using In Vitro, Imaging and Physiologically Based Pharmacokinetic Modeling Approaches. Clin. Pharmacol. Ther. 2018, 104, 865–889. [Google Scholar] [CrossRef]
- Grimstein, M.; Yang, Y.; Zhang, X.; Grillo, J.; Huang, S.M.; Zineh, I.; Wang, Y. Physiologically Based Pharmacokinetic Modeling in Regulatory Science: An Update From the U.S. Food and Drug Administration’s Office of Clinical Pharmacology. J. Pharm. Sci. 2019, 108, 21–25. [Google Scholar] [CrossRef] [Green Version]
- Snyder, E.; Banks, K.P. Hepatobiliary Scintigraphy. In StatPearls; StatPearls Publishing LLC.: Treasure Island, FL, USA, 2022. [Google Scholar]
- US Food Drug Admin. Physiologically Based Pharmacokinetic Analyses—Format and Content: Guidance for Industry; Silver Spring, MD, USA, 2018. 2018. Available online: https://www.fda.gov/media/101469/download (accessed on 1 March 2023).
- The International Council for Harmonisation of Technical Requirements for Pharmaceuticals for Human Use. ICH Harmonised Guidline M12 Drug Interaction Studies [Draft Version]. Geneva, Switzerland, 2022. Available online: https://www.ema.europa.eu/en/documents/scientific-guideline/draft-ich-guideline-m12-drug-interaction-studies-step-2b_en.pdf (accessed on 1 March 2023).
- Billington, S.; Shoner, S.; Lee, S.; Clark-Snustad, K.; Pennington, M.; Lewis, D.; Muzi, M.; Rene, S.; Lee, J.; Nguyen, T.B.; et al. Positron Emission Tomography Imaging of [(11) C]Rosuvastatin Hepatic Concentrations and Hepatobiliary Transport in Humans in the Absence and Presence of Cyclosporin A. Clin. Pharmacol. Ther. 2019, 106, 1056–1066. [Google Scholar] [CrossRef]
- Levesque, E.; Martin, E.; Dudau, D.; Lim, C.; Dhonneur, G.; Azoulay, D. Current use and perspective of indocyanine green clearance in liver diseases. Anaesth. Crit. Care Pain Med. 2016, 35, 49–57. [Google Scholar] [CrossRef]
- Lu, H.; Clingman, C.; Golay, X.; van Zijl, P.C. Determining the longitudinal relaxation time (T1) of blood at 3.0 Tesla. Magn. Reson. Med. 2004, 52, 679–682. [Google Scholar] [CrossRef]
- US Food Drug Admin. Drug Labeling-Package Insert: EOVIST (Gadoxetate Disodium) Injection [FDA Application No, (NDA) 022090]. 2018. Available online: https://www.accessdata.fda.gov/drugsatfda_docs/label/2018/022090s016lbl.pdf (accessed on 5 April 2019).
- Sourbron, S.P.; Buckley, D.L. Classic models for dynamic contrast-enhanced MRI. NMR Biomed. 2013, 26, 1004–1027. [Google Scholar] [CrossRef] [PubMed]
- Sourbron, S.; Sommer, W.H.; Reiser, M.F.; Zech, C.J. Combined quantification of liver perfusion and function with dynamic gadoxetic acid-enhanced MR imaging. Radiology 2012, 263, 874–883. [Google Scholar] [CrossRef]
- Karageorgis, A.; Lenhard, S.C.; Yerby, B.; Forsgren, M.F.; Liachenko, S.; Johansson, E.; Pilling, M.A.; Peterson, R.A.; Yang, X.; Williams, D.P.; et al. A multi-center preclinical study of gadoxetate DCE-MRI in rats as a biomarker of drug induced inhibition of liver transporter function. PLoS ONE 2018, 13, e0197213. [Google Scholar] [CrossRef] [PubMed]
- Giraudeau, C.; Leporq, B.; Doblas, S.; Lagadec, M.; Pastor, C.M.; Daire, J.L.; Van Beers, B.E. Gadoxetate-enhanced MR imaging and compartmental modelling to assess hepatocyte bidirectional transport function in rats with advanced liver fibrosis. Eur. Radiol. 2017, 27, 1804–1811. [Google Scholar] [CrossRef]
- Forsgren, M.F.; Dahlqvist Leinhard, O.; Dahlstrom, N.; Cedersund, G.; Lundberg, P. Physiologically realistic and validated mathematical liver model reveals [corrected] hepatobiliary transfer rates for Gd-EOB-DTPA using human DCE-MRI data. PLoS ONE 2014, 9, e95700. [Google Scholar] [CrossRef] [PubMed]
- Georgiou, L.; Penny, J.; Nicholls, G.; Woodhouse, N.; Ble, F.X.; Hubbard Cristinacce, P.L.; Naish, J.H. Quantitative Assessment of Liver Function Using Gadoxetate-Enhanced Magnetic Resonance Imaging: Monitoring Transporter-Mediated Processes in Healthy Volunteers. Investig. Radiol. 2017, 52, 111–119. [Google Scholar] [CrossRef] [Green Version]
- Spanakis, M.; Marias, K. In silico evaluation of gadofosveset pharmacokinetics in different population groups using the Simcyp® simulator platform. Silico Pharm. 2014, 2, 2. [Google Scholar] [CrossRef] [Green Version]
- Spanakis, M.; Kontopodis, E.; Van Cauter, S.; Sakkalis, V.; Marias, K. Assessment of DCE-MRI parameters for brain tumors through implementation of physiologically-based pharmacokinetic model approaches for Gd-DOTA. J. Pharmacokinet. Pharmacodyn. 2016, 43, 529–547. [Google Scholar] [CrossRef]
- Scotcher, D.; Melillo, N.; Tadimalla, S.; Darwich, A.S.; Ziemian, S.; Ogungbenro, K.; Schutz, G.; Sourbron, S.; Galetin, A. Physiologically Based Pharmacokinetic Modeling of Transporter-Mediated Hepatic Disposition of Imaging Biomarker Gadoxetate in Rats. Mol. Pharm. 2021, 18, 2997–3009. [Google Scholar] [CrossRef]
- Green, C.; Tadimalla, S.; Steinmann, D.; Sourbron, S.; Koehler, S.; Juretschke, H.-P.; Laitinen, I.; Waterton, J.C.; Hockings, P.D.; Hines, C.D.G.; et al. Inter-site repeatability and quantitative assessment of hepatic transporter function with DCE-MRI in rats [Abstract #1773]. In Proceedings of the ISMRM 27th Annual Meeting and Exhibition, Montreal, QC, Canada, 11–16 May 2019. [Google Scholar]
- Waterton, J.C.; Hines, C.D.G.; Hockings, P.D.; Laitinen, I.; Ziemian, S.; Campbell, S.; Gottschalk, M.; Green, C.; Haase, M.; Hassemer, K.; et al. Repeatability and reproducibility of longitudinal relaxation rate in 12 small-animal MRI systems. Magn. Reson. Imaging 2019, 59, 121–129. [Google Scholar] [CrossRef]
- Schuhmann-Giampieri, G.; Schmitt-Willich, H.; Press, W.R.; Negishi, C.; Weinmann, H.J.; Speck, U. Preclinical evaluation of Gd-EOB-DTPA as a contrast agent in MR imaging of the hepatobiliary system. Radiology 1992, 183, 59–64. [Google Scholar] [CrossRef]
- Ulloa, J.L.; Stahl, S.; Yates, J.; Woodhouse, N.; Kenna, J.G.; Jones, H.B.; Waterton, J.C.; Hockings, P.D. Assessment of gadoxetate DCE-MRI as a biomarker of hepatobiliary transporter inhibition. NMR Biomed. 2013, 26, 1258–1270. [Google Scholar] [CrossRef] [Green Version]
- Sourbron, S. Plaresmedima/PMI-0.4-TRISTAN-RATS: TRISTAN RATS v3.1 (v3.1); Zenodo: Genève, Switzerland, 2020. [Google Scholar] [CrossRef]
- Gertz, M.; Tsamandouras, N.; Sall, C.; Houston, J.B.; Galetin, A. Reduced physiologically-based pharmacokinetic model of repaglinide: Impact of OATP1B1 and CYP2C8 genotype and source of in vitro data on the prediction of drug-drug interaction risk. Pharm. Res. 2014, 31, 2367–2382. [Google Scholar] [CrossRef]
- Gertz, M.; Cartwright, C.M.; Hobbs, M.J.; Kenworthy, K.E.; Rowland, M.; Houston, J.B.; Galetin, A. Cyclosporine inhibition of hepatic and intestinal CYP3A4, uptake and efflux transporters: Application of PBPK modeling in the assessment of drug-drug interaction potential. Pharm. Res. 2013, 30, 761–780. [Google Scholar] [CrossRef]
- Sourbron, S. Technical aspects of MR perfusion. Eur. J. Radiol. 2010, 76, 304–313. [Google Scholar] [CrossRef]
- Ziemian, S.; Green, C.; Sourbron, S.; Jost, G.; Schütz, G.; Hines, C.D.G. Ex vivo gadoxetate relaxivities in rat liver tissue and blood at five magnetic field strengths from 1.41 to 7 T. NMR Biomed. 2021, 34, e4401. [Google Scholar] [CrossRef]
- Gunwhy, E.; Sourbron, S. TRISTAN-Rat (v1.0.0); Zenodo: Genève, Switzerland, 2023. [Google Scholar] [CrossRef]
- Barnett, S.; Ogungbenro, K.; Menochet, K.; Shen, H.; Lai, Y.; Humphreys, W.G.; Galetin, A. Gaining Mechanistic Insight Into Coproporphyrin I as Endogenous Biomarker for OATP1B-Mediated Drug-Drug Interactions Using Population Pharmacokinetic Modeling and Simulation. Clin. Pharmacol. Ther. 2018, 104, 564–574. [Google Scholar] [CrossRef] [Green Version]
- Lau, Y.Y.; Okochi, H.; Huang, Y.; Benet, L.Z. Multiple transporters affect the disposition of atorvastatin and its two active hydroxy metabolites: Application of in vitro and ex situ systems. J. Pharmacol. Exp. Ther. 2006, 316, 762–771. [Google Scholar] [CrossRef]
- Ishida, K.; Ullah, M.; Tóth, B.; Juhasz, V.; Unadkat, J.D. Transport Kinetics, Selective Inhibition, and Successful Prediction of In Vivo Inhibition of Rat Hepatic Organic Anion Transporting Polypeptides. Drug Metab. Dispos. 2018, 46, 1251–1258. [Google Scholar] [CrossRef]
- Nakanishi, T.; Shibue, Y.; Fukuyama, Y.; Yoshida, K.; Fukuda, H.; Shirasaka, Y.; Tamai, I. Quantitative time-lapse imaging-based analysis of drug-drug interaction mediated by hepatobiliary transporter, multidrug resistance-associated protein 2, in sandwich-cultured rat hepatocytes. Drug Metab. Dispos. 2011, 39, 984–991. [Google Scholar] [CrossRef] [Green Version]
- Shitara, Y.; Sugiyama, D.; Kusuhara, H.; Kato, Y.; Abe, T.; Meier, P.J.; Itoh, T.; Sugiyama, Y. Comparative inhibitory effects of different compounds on rat oatpl (slc21a1)- and Oatp2 (Slc21a5)-mediated transport. Pharm. Res. 2002, 19, 147–153. [Google Scholar] [CrossRef]
- Shitara, Y.; Hirano, M.; Adachi, Y.; Itoh, T.; Sato, H.; Sugiyama, Y. In vitro and in vivo correlation of the inhibitory effect of cyclosporin A on the transporter-mediated hepatic uptake of cerivastatin in rats. Drug Metab. Dispos. 2004, 32, 1468–1475. [Google Scholar] [CrossRef]
- Tang, W.; Stearns, R.A.; Chen, Q.; Bleasby, K.; Teffera, Y.; Colletti, A.; Hafey, M.; Evers, R.; Dean, D.C.; Magriotis, P.A.; et al. Importance of mechanistic drug metabolism studies in support of drug discovery: A case study with an N -sulfonylated dipeptide VLA-4 antagonist in rats. Xenobiotica 2008, 38, 223–237. [Google Scholar] [CrossRef] [PubMed]
- Li, Y.; Evers, R.; Hafey, M.J.; Cheon, K.; Duong, H.; Lynch, D.; LaFranco-Scheuch, L.; Pacchione, S.; Tamburino, A.M.; Tanis, K.Q.; et al. Use of a Bile Salt Export Pump Knockdown Rat Susceptibility Model to Interrogate Mechanism of Drug-Induced Liver Toxicity. Toxicol. Sci. 2019, 170, 180–198. [Google Scholar] [CrossRef] [PubMed]
- Barber, J.A.; Stahl, S.H.; Summers, C.; Barrett, G.; Park, B.K.; Foster, J.R.; Kenna, J.G. Quantification of Drug-Induced Inhibition of Canalicular Cholyl-l-Lysyl-Fluorescein Excretion from Hepatocytes by High Content Cell Imaging. Toxicol. Sci. 2015, 148, 48–59. [Google Scholar] [CrossRef] [PubMed] [Green Version]
- McPhee, F.; Sheaffer, A.K.; Friborg, J.; Hernandez, D.; Falk, P.; Zhai, G.; Levine, S.; Chaniewski, S.; Yu, F.; Barry, D.; et al. Preclinical Profile and Characterization of the Hepatitis C Virus NS3 Protease Inhibitor Asunaprevir (BMS-650032). Antimicrob. Agents Chemother. 2012, 56, 5387–5396. [Google Scholar] [CrossRef] [Green Version]
- Dingemanse, J.; van Giersbergen, P.L. Clinical pharmacology of bosentan, a dual endothelin receptor antagonist. Clin. Pharmacokinet. 2004, 43, 1089–1115. [Google Scholar] [CrossRef]
- Pedersen, J.M.; Matsson, P.; Bergstrom, C.A.; Norinder, U.; Hoogstraate, J.; Artursson, P. Prediction and identification of drug interactions with the human ATP-binding cassette transporter multidrug-resistance associated protein 2 (MRP2; ABCC2). J. Med. Chem. 2008, 51, 3275–3287. [Google Scholar] [CrossRef]
- Vermeer, L.M.; Isringhausen, C.D.; Ogilvie, B.W.; Buckley, D.B. Evaluation of Ketoconazole and Its Alternative Clinical CYP3A4/5 Inhibitors as Inhibitors of Drug Transporters: The In Vitro Effects of Ketoconazole, Ritonavir, Clarithromycin, and Itraconazole on 13 Clinically-Relevant Drug Transporters. Drug Metab. Dispos. 2016, 44, 453–459. [Google Scholar] [CrossRef] [Green Version]
- Morgan, R.E.; van Staden, C.J.; Chen, Y.; Kalyanaraman, N.; Kalanzi, J.; Dunn, R.T., 2nd; Afshari, C.A.; Hamadeh, H.K. A multifactorial approach to hepatobiliary transporter assessment enables improved therapeutic compound development. Toxicol. Sci. 2013, 136, 216–241. [Google Scholar] [CrossRef] [Green Version]
- Gillies, P.S.; Dunn, C.J. Pioglitazone. Drugs 2000, 60, 333–343. [Google Scholar] [CrossRef]
- Hachad, H.; Ragueneau-Majlessi, I.; Levy, R.H. A useful tool for drug interaction evaluation: The University of Washington Metabolism and Transport Drug Interaction Database. Hum. Genom. 2010, 5, 61–72. [Google Scholar] [CrossRef] [Green Version]
- US Food Drug Admin. Drug Labeling-Package Insert: RIFADIN® (Rifampin Capsules USP) and RIFADIN® IV (Rifampin for Injection USP) [FDA Application No, (NDA) #050627]. 2022. Available online: https://www.accessdata.fda.gov/drugsatfda_docs/label/2022/050420s087,050627s030lbl.pdf (accessed on 1 July 2022).
- Australia Therapeutic Goods Administration. Product Information for AusPAR Sunvepra Asunaprevir. 2015. Available online: https://www.tga.gov.au/sites/default/files/auspar-asunaprevir-151214-pi.pdf (accessed on 1 July 2022).
- US Food Drug Admin. Drug Labeling-Package Insert: TRACLEER® (Bosentan) Tablets, for Oral Use TRACLEER® (Bosentan) Tablets for Oral Suspension [FDA Application No, (NDA) #209279]. 2017. Available online: www.accessdata.fda.gov/drugsatfda_docs/label/2017/209279s000lbl.pdf (accessed on 1 July 2022).
- US Food Drug Admin. Drug Labeling-Package Insert: NEORAL(Cyclosporine) Capsules and Oral Solution [FDA Application No, (NDA) 050715]. 2009. Available online: https://www.accessdata.fda.gov/drugsatfda_docs/label/2009/050715s027,050716s028lbl.pdf (accessed on 1 March 2022).
- US Food Drug Admin. Drug Labeling-Package Insert: Sandimmune® Soft Gelatin Capsules (Cyclosporine Capsules, USP) Sandimmune® Oral Solution (Cyclosporine Oral Solution, USP) Sandimmune® Injection (Cyclosporine Injection, USP) [FDA Application no, (NDA) 050573]. 2015. Available online: https://www.accessdata.fda.gov/drugsatfda_docs/label/2015/050573s041,050574s051,050625s055lbl.pdf (accessed on 1 July 2022).
- US Food Drug Admin. Drug Labeling-Package Insert: ACTOS (Pioglitazone) Tablets for Oral Use [FDA Application No, (NDA) 021073]. 2016. Available online: www.accessdata.fda.gov/drugsatfda_docs/label/2017/021073s049lbl.pdf (accessed on 1 July 2022).
- Kimoto, E.; Costales, C.; West, M.A.; Bi, Y.A.; Vourvahis, M.; David Rodrigues, A.; Varma, M.V.S. Biomarker-Informed Model-Based Risk Assessment of Organic Anion Transporting Polypeptide 1B Mediated Drug-Drug Interactions. Clin. Pharmacol. Ther. 2022, 111, 404–415. [Google Scholar] [CrossRef] [PubMed]
- Sasongko, L.; Link, J.M.; Muzi, M.; Mankoff, D.A.; Yang, X.; Collier, A.C.; Shoner, S.C.; Unadkat, J.D. Imaging P-glycoprotein transport activity at the human blood-brain barrier with positron emission tomography. Clin. Pharmacol. Ther. 2005, 77, 503–514. [Google Scholar] [CrossRef] [PubMed]
- Takashima, T.; Kitamura, S.; Wada, Y.; Tanaka, M.; Shigihara, Y.; Ishii, H.; Ijuin, R.; Shiomi, S.; Nakae, T.; Watanabe, Y.; et al. PET imaging-based evaluation of hepatobiliary transport in humans with (15R)-11C-TIC-Me. J. Nucl. Med. 2012, 53, 741–748. [Google Scholar] [CrossRef] [Green Version]
- Pfeifer, N.D.; Goss, S.L.; Swift, B.; Ghibellini, G.; Ivanovic, M.; Heizer, W.D.; Gangarosa, L.M.; Brouwer, K.L. Effect of Ritonavir on (99m)Technetium-Mebrofenin Disposition in Humans: A Semi-PBPK Modeling and In Vitro Approach to Predict Transporter-Mediated DDIs. CPT Pharmacomet. Syst. Pharm. 2013, 2, e20. [Google Scholar] [CrossRef] [PubMed]
- Hernández Lozano, I.; Langer, O. Use of imaging to assess the activity of hepatic transporters. Expert Opin. Drug Metab. Toxicol. 2020, 16, 149–164. [Google Scholar] [CrossRef] [PubMed] [Green Version]
- Kenna, J.G.; Waterton, J.C.; Baudy, A.; Galetin, A.; Hines, C.D.G.; Hockings, P.; Patel, M.; Scotcher, D.; Sourbron, S.; Ziemian, S.; et al. Noninvasive Preclinical and Clinical Imaging of Liver Transporter Function Relevant to Drug-Induced Liver Injury. In Drug-Induced Liver Toxicity; Chen, M., Will, Y., Eds.; Springer: New York, NY, USA, 2018; pp. 627–651. [Google Scholar]
- Slobbe, P.; Windhorst, A.D.; Stigter-van Walsum, M.; Smit, E.F.; Niessen, H.G.; Solca, F.; Stehle, G.; van Dongen, G.A.; Poot, A.J. A comparative PET imaging study with the reversible and irreversible EGFR tyrosine kinase inhibitors [(11)C]erlotinib and [(18)F]afatinib in lung cancer-bearing mice. EJNMMI Res. 2015, 5, 14. [Google Scholar] [CrossRef] [Green Version]
- US Food Drug Admin. Clinical Drug Interaction Studies—Cytochrome P450 Enzyme- and Transporter-Mediated Drug Interactions Guidance for Industry; U.S. Food and Drug Administration: Silver Spring, MD, USA, 2020. Available online: https://www.fda.gov/media/134581/download (accessed on 1 March 2022).
- US Food Drug Admin. In Vitro Drug Interaction Studies—Cytochrome P450 Enzyme- and Transporter-Mediated Drug Interactions Guidance for Industry. U.S. Food and Drug Administration: Silver Spring, MD, USA, 2020. Available online: https://www.fda.gov/media/134582/download (accessed on 1 March 2022).
- Kuo, K.-L.; Zhu, H.; McNamara, P.J.; Leggas, M. Localization and functional characterization of the rat Oatp4c1 transporter in an in vitro cell system and rat tissues. PLoS ONE 2012, 7, e39641. [Google Scholar] [CrossRef] [Green Version]
- Varma, M.V.; Steyn, S.J.; Allerton, C.; El-Kattan, A.F. Predicting Clearance Mechanism in Drug Discovery: Extended Clearance Classification System (ECCS). Pharm. Res. 2015, 32, 3785–3802. [Google Scholar] [CrossRef]
- Greenblatt, H.K.; Greenblatt, D.J. Liver injury associated with ketoconazole: Review of the published evidence. J. Clin. Pharmacol. 2014, 54, 1321–1329. [Google Scholar] [CrossRef] [PubMed]
- Choi, M.K.; Jin, Q.R.; Choi, Y.L.; Ahn, S.H.; Bae, M.A.; Song, I.S. Inhibitory effects of ketoconazole and rifampin on OAT1 and OATP1B1 transport activities: Considerations on drug-drug interactions. Biopharm. Drug Dispos. 2011, 32, 175–184. [Google Scholar] [CrossRef]
- Weiss, M.; Siegmund, W. Unusual Distribution Kinetics of Gadoxetate in Healthy Human Subjects Genotyped for OATP1B1: Application of Population Analysis and a Minimal Physiological-Based Pharmacokinetic Model. J. Clin. Pharmacol. 2021, 61, 506–514. [Google Scholar] [CrossRef]
- Nilsson, H.; Nordell, A.; Vargas, R.; Douglas, L.; Jonas, E.; Blomqvist, L. Assessment of hepatic extraction fraction and input relative blood flow using dynamic hepatocyte-specific contrast-enhanced MRI. J. Magn. Reson. Imaging 2009, 29, 1323–1331. [Google Scholar] [CrossRef]
- Yoshida, K.; Guo, C.; Sane, R. Quantitative Prediction of OATP-Mediated Drug-Drug Interactions With Model-Based Analysis of Endogenous Biomarker Kinetics. CPT Pharmacomet. Syst. Pharm. 2018, 7, 517–524. [Google Scholar] [CrossRef]
- Westley, I.S.; Brogan, L.R.; Morris, R.G.; Evans, A.M.; Sallustio, B.C. Role of Mrp2 in the hepatic disposition of mycophenolic acid and its glucuronide metabolites: Effect of cyclosporine. Drug Metab. Dispos. 2006, 34, 261–266. [Google Scholar] [CrossRef] [PubMed] [Green Version]
- Guest, E.J.; Aarons, L.; Houston, J.B.; Rostami-Hodjegan, A.; Galetin, A. Critique of the two-fold measure of prediction success for ratios: Application for the assessment of drug-drug interactions. Drug Metab. Dispos. 2011, 39, 170–173. [Google Scholar] [CrossRef] [Green Version]
- Lau, Y.Y.; Okochi, H.; Huang, Y.; Benet, L.Z. Pharmacokinetics of atorvastatin and its hydroxy metabolites in rats and the effects of concomitant rifampicin single doses: Relevance of first-pass effect from hepatic uptake transporters, and intestinal and hepatic metabolism. Drug Metab. Dispos. 2006, 34, 1175–1181. [Google Scholar] [CrossRef] [PubMed] [Green Version]
- Jiang, R.; Dong, J.; Li, X.; Du, F.; Jia, W.; Xu, F.; Wang, F.; Yang, J.; Niu, W.; Li, C. Molecular mechanisms governing different pharmacokinetics of ginsenosides and potential for ginsenoside-perpetrated herb-drug interactions on OATP1B3. Br. J. Pharmacol. 2015, 172, 1059–1073. [Google Scholar] [CrossRef] [Green Version]
- Mosure, K.W.; Knipe, J.O.; Browning, M.; Arora, V.; Shu, Y.Z.; Phillip, T.; McPhee, F.; Scola, P.; Balakrishnan, A.; Soars, M.G.; et al. Preclinical Pharmacokinetics and In Vitro Metabolism of Asunaprevir (BMS-650032), a Potent Hepatitis C Virus NS3 Protease Inhibitor. J. Pharm. Sci. 2015, 104, 2813–2823. [Google Scholar] [CrossRef]
- Kawai, R.; Mathew, D.; Tanaka, C.; Rowland, M. Physiologically based pharmacokinetics of cyclosporine A: Extension to tissue distribution kinetics in rats and scale-up to human. J. Pharmacol. Exp. Ther. 1998, 287, 457–468. [Google Scholar] [PubMed]
- Lindberg-Freijs, A.; Karlsson, M.O. Dose dependent absorption and linear disposition of cyclosporin A in rat. Biopharm. Drug Dispos. 1994, 15, 75–86. [Google Scholar] [CrossRef]
- Fujita, Y.; Yamada, Y.; Kusama, M.; Yamauchi, T.; Kamon, J.; Kadowaki, T.; Iga, T. Sex differences in the pharmacokinetics of pioglitazone in rats. Comp. Biochem. Physiol. C Toxicol. Pharmacol. 2003, 136, 85–94. [Google Scholar] [CrossRef]
- Maeshiba, Y.; Kiyota, Y.; Yamashita, K.; Yoshimura, Y.; Motohashi, M.; Tanayama, S. Disposition of the new antidiabetic agent pioglitazone in rats, dogs, and monkeys. Arzneimittelforschung 1997, 47, 29–35. [Google Scholar]
- Umathe, S.N.; Dixit, P.V.; Kumar, V.; Bansod, K.U.; Wanjari, M.M. Quercetin pretreatment increases the bioavailability of pioglitazone in rats: Involvement of CYP3A inhibition. Biochem. Pharmacol. 2008, 75, 1670–1676. [Google Scholar] [CrossRef] [PubMed]
- Treiber, A.; Schneiter, R.; Delahaye, S.; Clozel, M. Inhibition of organic anion transporting polypeptide-mediated hepatic uptake is the major determinant in the pharmacokinetic interaction between bosentan and cyclosporin A in the rat. J. Pharmacol. Exp. Ther. 2004, 308, 1121–1129. [Google Scholar] [CrossRef] [Green Version]
- Li, R.; Niosi, M.; Johnson, N.; Tess, D.A.; Kimoto, E.; Lin, J.; Yang, X.; Riccardi, K.A.; Ryu, S.; El-Kattan, A.F.; et al. A Study on Pharmacokinetics of Bosentan with Systems Modeling, Part 1: Translating Systemic Plasma Concentration to Liver Exposure in Healthy Subjects. Drug Metab. Dispos. 2018, 46, 346–356. [Google Scholar] [CrossRef] [Green Version]
- Francis, L.J.; Houston, J.B.; Hallifax, D. Impact of Plasma Protein Binding in Drug Clearance Prediction: A Data Base Analysis of Published Studies and Implications for In Vitro-In Vivo Extrapolation. Drug Metab. Dispos. 2021, 49, 188–201. [Google Scholar] [CrossRef]
- Barnett, S.; Ogungbenro, K.; Ménochet, K.; Shen, H.; Humphreys, W.G.; Galetin, A. Comprehensive Evaluation of the Utility of 20 Endogenous Molecules as Biomarkers of OATP1B Inhibition Compared with Rosuvastatin and Coproporphyrin I. J. Pharmacol. Exp. Ther. 2019, 368, 125–135. [Google Scholar] [CrossRef]
- US Food Drug Admin. Drug Development and Drug Interactions: Table of Substrates, Inhibitors and Inducers. Available online: https://www.fda.gov/drugs/drug-interactions-labeling/drug-development-and-drug-interactions-table-substrates-inhibitors-and-inducers (accessed on 18 March 2022).
- Rifampin. LiverTox: Clinical and Research Information on Drug-Induced Liver Injury; National Institute of Diabetes and Digestive and Kidney Diseases: Bethesda, MD, USA, 2012. [Google Scholar]
- Abulfathi, A.A.; Decloedt, E.H.; Svensson, E.M.; Diacon, A.H.; Donald, P.; Reuter, H. Clinical Pharmacokinetics and Pharmacodynamics of Rifampicin in Human Tuberculosis. Clin. Pharmacokinet. 2019, 58, 1103–1129. [Google Scholar] [CrossRef]
- Eley, T.; Han, Y.H.; Huang, S.P.; He, B.; Li, W.; Bedford, W.; Stonier, M.; Gardiner, D.; Sims, K.; Rodrigues, A.D.; et al. Organic anion transporting polypeptide-mediated transport of, and inhibition by, asunaprevir, an inhibitor of hepatitis C virus NS3 protease. Clin. Pharmacol. Ther. 2015, 97, 159–166. [Google Scholar] [CrossRef] [PubMed]
- Miyashima, Y.; Honma, Y.; Miyagawa, K.; Oe, S.; Senju, M.; Shibata, M.; Hiura, M.; Abe, S.; Harada, M. Daclatasvir and Asunaprevir Combination Therapy-induced Hepatitis and Cholecystitis with Coagulation Disorder due to Hypersensitivity Reactions. Intern. Med. 2016, 55, 3595–3601. [Google Scholar] [CrossRef] [Green Version]
- Eley, T.; Sevinsky, H.; Huang, S.P.; He, B.; Zhu, K.; Kandoussi, H.; Gardiner, D.; Grasela, D.M.; Bertz, R.; Bifano, M. The pharmacokinetics of daclatasvir and asunaprevir administered in combination in studies in healthy subjects and patients infected with hepatitis C virus. Clin. Drug Investig. 2014, 34, 661–671. [Google Scholar] [CrossRef] [PubMed]
- Duan, P.; Zhao, P.; Zhang, L. Physiologically Based Pharmacokinetic (PBPK) Modeling of Pitavastatin and Atorvastatin to Predict Drug-Drug Interactions (DDIs). Eur. J. Drug Metab. Pharmacokinet. 2017, 42, 689–705. [Google Scholar] [CrossRef]
- Reuben, A. Chapter 31—Hepatotoxicity of Immunosuppressive Drugs. In Drug-Induced Liver Disease, 3rd ed.; Kaplowitz, N., DeLeve, L.D., Eds.; Academic Press: Boston, MA, USA, 2013; pp. 569–591. [Google Scholar]
- Tanaka, C.; Kawai, R.; Rowland, M. Dose-dependent pharmacokinetics of cyclosporin A in rats: Events in tissues. Drug Metab. Dispos. 2000, 28, 582–589. [Google Scholar]
- Matthew, D.; Brennan, B.; Zomorodi, K.; Houston, J.B. Disposition of azole antifungal agents. I. Nonlinearities in ketoconazole clearance and binding in rat liver. Pharm. Res. 1993, 10, 418–422. [Google Scholar] [CrossRef]
- Daneshmend, T.K.; Warnock, D.W.; Ene, M.D.; Johnson, E.M.; Parker, G.; Richardson, M.D.; Roberts, C.J. Multiple dose pharmacokinetics of ketoconazole and their effects on antipyrine kinetics in man. J. Antimicrob. Chemother. 1983, 12, 185–188. [Google Scholar] [CrossRef] [PubMed]
- Marcy, T.R.; Britton, M.L.; Blevins, S.M. Second-generation thiazolidinediones and hepatotoxicity. Ann. Pharmacother. 2004, 38, 1419–1423. [Google Scholar] [CrossRef]
- Chen, M.; Zhang, J.; Wang, Y.; Liu, Z.; Kelly, R.; Zhou, G.; Fang, H.; Borlak, J.; Tong, W. The liver toxicity knowledge base: A systems approach to a complex end point. Clin. Pharmacol. Ther. 2013, 93, 409–412. [Google Scholar] [CrossRef]
- U.S. Food and Drug Administration. Clinical Pharmacology and Biopharmaceutics Review; ACTOS (Pioglitazone Hydrochloride) [FDA Application No, (NDA)021073]; U.S. Food and Drug Administration: Silver Spring, MD, USA, 1999. [Google Scholar]
- Eriksson, C.; Gustavsson, A.; Kronvall, T.; Tysk, C. Hepatotoxicity by bosentan in a patient with portopulmonary hypertension: A case-report and review of the literature. J. Gastrointestin. Liver Dis. 2011, 20, 77–80. [Google Scholar]
- Scotcher, D.; Jones, C.R.; Galetin, A.; Rostami-Hodjegan, A. Delineating the Role of Various Factors in Renal Disposition of Digoxin through Application of Physiologically Based Kidney Model to Renal Impairment Populations. J. Pharmacol. Exp. Ther. 2017, 360, 484–495. [Google Scholar] [CrossRef] [PubMed] [Green Version]
- Scotcher, D.; Arya, V.; Yang, X.; Zhao, P.; Zhang, L.; Huang, S.M.; Rostami-Hodjegan, A.; Galetin, A. Mechanistic Models as Framework for Understanding Biomarker Disposition: Prediction of Creatinine-Drug Interactions. CPT Pharmacomet. Syst. Pharmacol. 2020, 9, 282–293. [Google Scholar] [CrossRef] [PubMed]
- Asaumi, R.; Nunoya, K.I.; Yamaura, Y.; Taskar, K.S.; Sugiyama, Y. Robust physiologically based pharmacokinetic model of rifampicin for predicting drug-drug interactions via P-glycoprotein induction and inhibition in the intestine, liver, and kidney. CPT Pharmacomet. Syst. Pharmacol. 2022, 11, 919–933. [Google Scholar] [CrossRef] [PubMed]
- Jamei, M.; Bajot, F.; Neuhoff, S.; Barter, Z.; Yang, J.; Rostami-Hodjegan, A.; Rowland-Yeo, K. A mechanistic framework for in vitro-in vivo extrapolation of liver membrane transporters: Prediction of drug-drug interaction between rosuvastatin and cyclosporine. Clin. Pharmacokinet. 2014, 53, 73–87. [Google Scholar] [CrossRef] [PubMed] [Green Version]
- Sun, Y.; Chothe, P.P.; Sager, J.E.; Tsao, H.; Moore, A.; Laitinen, L.; Hariparsad, N. Quantitative Prediction of CYP3A4 Induction: Impact of Measured, Free, and Intracellular Perpetrator Concentrations from Human Hepatocyte Induction Studies on Drug-Drug Interaction Predictions. Drug Metab. Dispos. 2017, 45, 692–705. [Google Scholar] [CrossRef] [PubMed] [Green Version]
- Li, N.; Badrinarayanan, A.; Ishida, K.; Li, X.; Roberts, J.; Wang, S.; Hayashi, M.; Gupta, A. Albumin-Mediated Uptake Improves Human Clearance Prediction for Hepatic Uptake Transporter Substrates Aiding a Mechanistic In Vitro-In Vivo Extrapolation (IVIVE) Strategy in Discovery Research. AAPS J. 2020, 23, 1. [Google Scholar] [CrossRef]
- Riede, J.; Camenisch, G.; Huwyler, J.; Poller, B. Current In Vitro Methods to Determine Hepatic Kp(uu): A Comparison of Their Usefulness and Limitations. J. Pharm. Sci. 2017, 106, 2805–2814. [Google Scholar] [CrossRef] [PubMed] [Green Version]
- Cremer, J.E.; Seville, M.P. Regional brain blood flow, blood volume, and haematocrit values in the adult rat. J. Cereb. Blood Flow Metab. 1983, 3, 254–256. [Google Scholar] [CrossRef] [PubMed]
- Lee, H.B.; Blaufox, M.D. Blood volume in the rat. J. Nucl. Med. 1985, 26, 72–76. [Google Scholar] [PubMed]
- Jobin, J.; Bonjour, J. Measurement of glomerular filtration rate in conscious unrestrained rats with inulin infused by implanted osmotic pumps. Am. J. Physiol. Renal Physiol. 1985, 248, F734–F738. [Google Scholar] [CrossRef] [PubMed]


 ) versus observed (
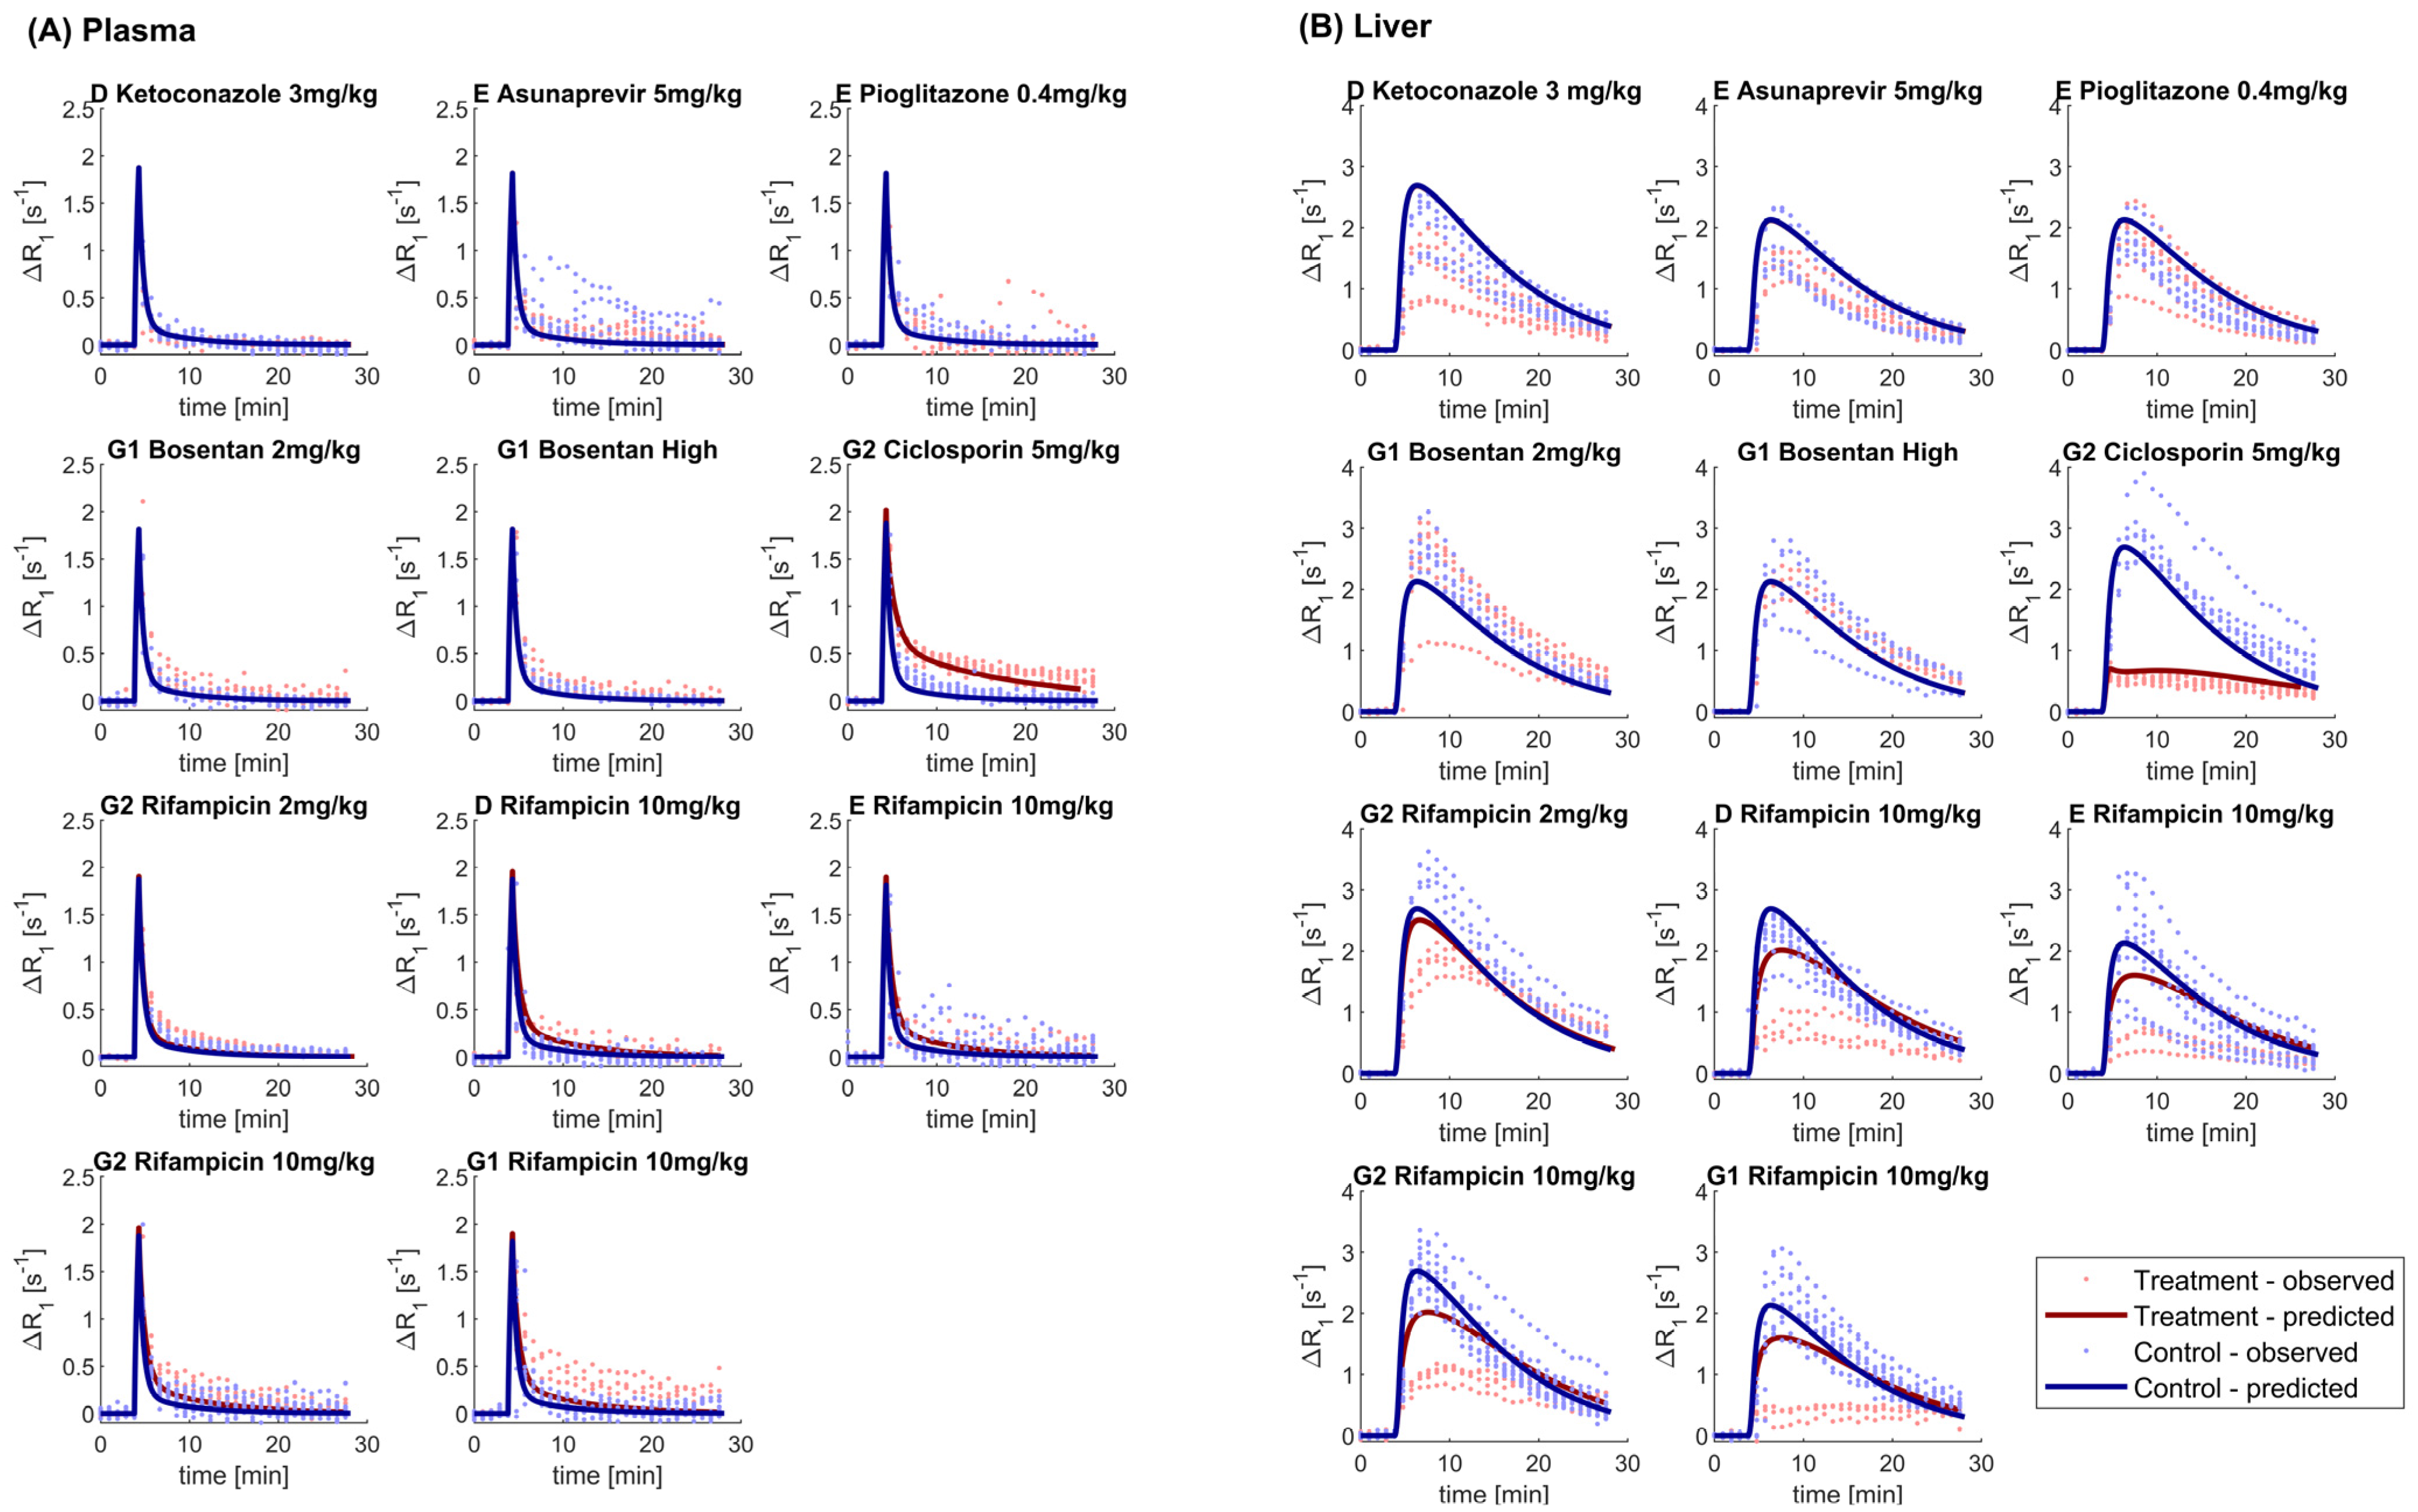
 ) plasma (Panel A) and liver (Panel B) for different sites (D, E, G1, and G2) and drugs. Solid black line corresponds to the line of unity. Predictions using the gadoxetate physiologically-based pharmacokinetic model considered inhibition of both and , assuming unbound plasma concentrations to drive inhibition of each transporter of interest. = ratio of treated vs. control area under the curve of gadoxetate -time profiles (Equation (3)). Doses for each drug are listed in Table 1; “Bosentan_high” refers to the 4–6 mg/kg doses of bosentan.
) versus observed () plasma (Panel A) and liver (Panel B) for different sites (D, E, G1, and G2) and drugs. Solid black line corresponds to the line of unity. Predictions using the gadoxetate physiologically-based pharmacokinetic model considered inhibition of both and , assuming unbound plasma concentrations to drive inhibition of each transporter of interest. = ratio of treated vs. control area under the curve of gadoxetate -time profiles (Equation (3)). Doses for each drug are listed in Table 1; “Bosentan_high” refers to the 4–6 mg/kg doses of bosentan.
) plasma (Panel A) and liver (Panel B) for different sites (D, E, G1, and G2) and drugs. Solid black line corresponds to the line of unity. Predictions using the gadoxetate physiologically-based pharmacokinetic model considered inhibition of both and , assuming unbound plasma concentrations to drive inhibition of each transporter of interest. = ratio of treated vs. control area under the curve of gadoxetate -time profiles (Equation (3)). Doses for each drug are listed in Table 1; “Bosentan_high” refers to the 4–6 mg/kg doses of bosentan.
) versus observed () plasma (Panel A) and liver (Panel B) for different sites (D, E, G1, and G2) and drugs. Solid black line corresponds to the line of unity. Predictions using the gadoxetate physiologically-based pharmacokinetic model considered inhibition of both and , assuming unbound plasma concentrations to drive inhibition of each transporter of interest. = ratio of treated vs. control area under the curve of gadoxetate -time profiles (Equation (3)). Doses for each drug are listed in Table 1; “Bosentan_high” refers to the 4–6 mg/kg doses of bosentan.


| Drug | Dose | Number of Animals | Dose Staggering Time a (min) | Site (Field Strength) b |
|---|---|---|---|---|
| Rifampicin | 2 mg/kg | 4 | 60 | G2 (4.7 T) |
| Asunaprevir | 5 mg/kg | 6 | 30 | E (7 T) |
| Bosentan | 2 mg/kg | 6 | 60 | G1 (7 T) |
| Bosentan | 4–6 mg/kg c | 4 c | 60 | G1 (7 T) |
| Ciclosporin | 5 mg/kg | 6 | 60 | G2 (4.7 T) |
| Ketoconazole | 3 mg/kg | 6 | 30 | D (4.7 T) |
| Pioglitazone | 0.4 mg/kg | 6 | 30 | E (7 T) |
| Site and Drug a | Plasma b | Liver | ||
|---|---|---|---|---|
Median (min, max) [%CV; n c] | Median (min, max) [%CV; n c] | |||
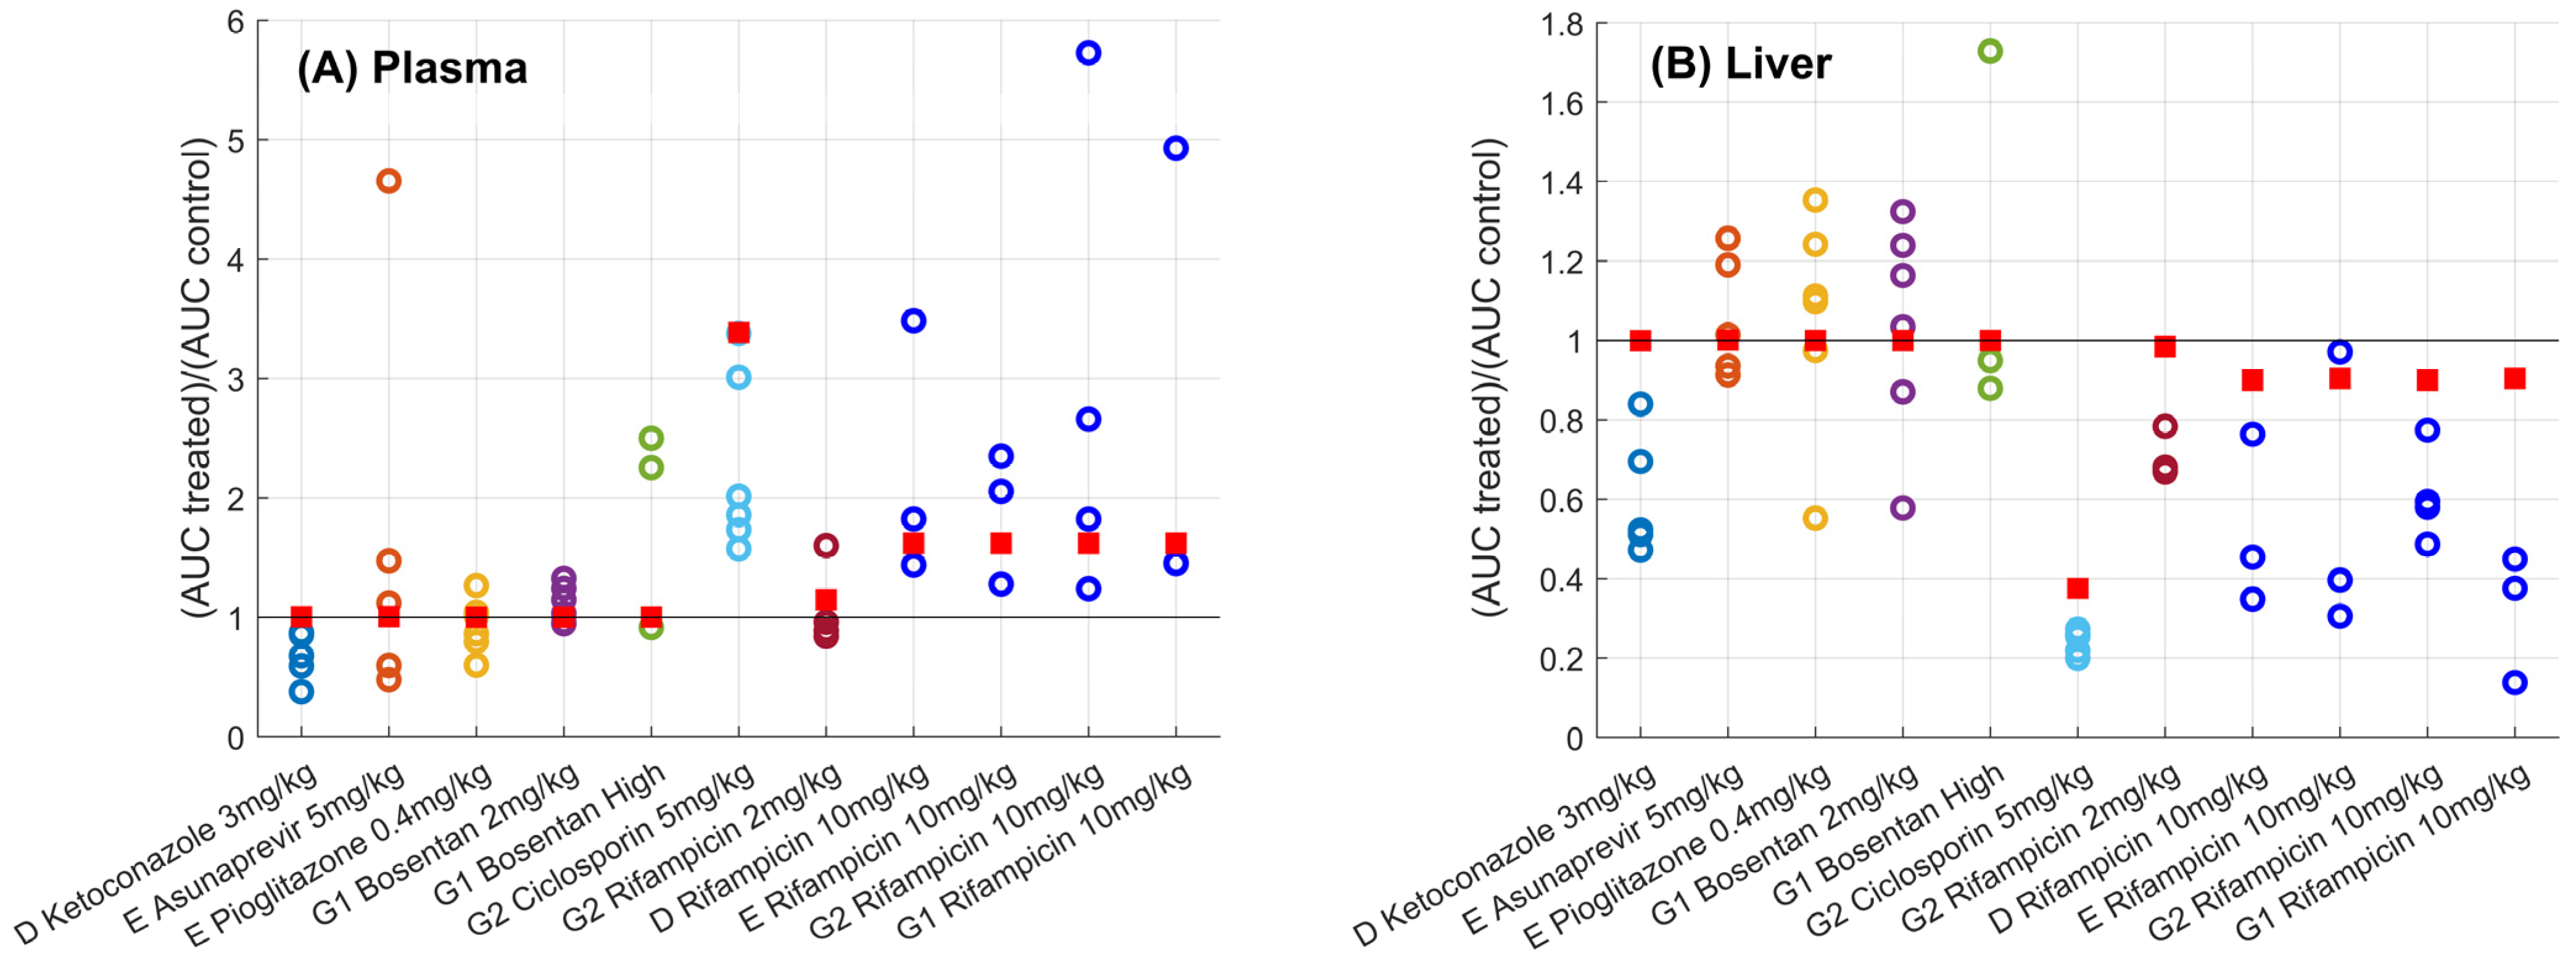
| D Ketoconazole 3 mg/kg | 0.68 (0.38, 0.87) [30%; n = 5] | 1.00 | 0.52 (0.47, 0.84) [26%; n = 5] | 1.00 |
| E Asunaprevir 5 mg/kg | 1.12 (0.48, 4.66) [103%; n = 6] | 1.01 | 1.01 (0.91, 1.26) [15%; n = 6] | 1.00 |
| E Pioglitazone 0.4 mg/kg | 0.94 (0.6, 1.27) [25%; n = 6] | 1.00 | 1.1 (0.55, 1.35) [26%; n = 6] | 1.00 |
| G1 Bosentan 2 mg/kg | 1.09 (0.95, 1.33) [14%; n = 6] | 1.00 | 1.1 (0.58, 1.32) [27%; n = 6] | 1.00 |
| G2 Bosentan 4–6 mg/kg | 2.25 (0.92, 2.5) [45%; n = 4] | 1.00 | 0.95 (0.88, 1.73) [40%; n = 4] | 1.00 |
| G2 Ciclosporin 5 mg/kg | 1.94 (1.57, 3.38) [33%; n = 6] | 3.39 | 0.26 (0.2, 0.27) [12%; n = 6] | 0.38 |
| G2 Rifampicin 2 mg/kg | 0.92 (0.84, 1.6) [33%; n = 4] | 1.15 | 0.68 (0.67, 0.78) [8%; n = 4] | 0.98 |
| D Rifampicin 10 mg/kg [24] | 1.82 (1.44, 3.48) [48%; n = 3] | 1.62 | 0.45 (0.35, 0.76) [41%; n = 3] | 0.90 |
| E Rifampicin 10 mg/kg [24] | 2.06 (1.28, 2.35) [29%; n = 3] | 1.62 | 0.4 (0.31, 0.97) [64%; n = 3] | 0.90 |
| G2 Rifampicin 10 mg/kg [24] | 2.24 (1.24, 5.73) [70%; n = 4] | 1.62 | 0.59 (0.49, 0.77) [20%; n = 4] | 0.90 |
| G1 Rifampicin 10 mg/kg [24] | 1.45 (1.45, 4.93) [77%; n = 3] | 1.62 | 0.38 (0.14, 0.45) [50%; n = 3] | 0.90 |
| Simple Effect Size (95% CI) [mL/min/mL liver] a | |||
|---|---|---|---|
| Site and Drug b | Ktrans | khe | kbh |
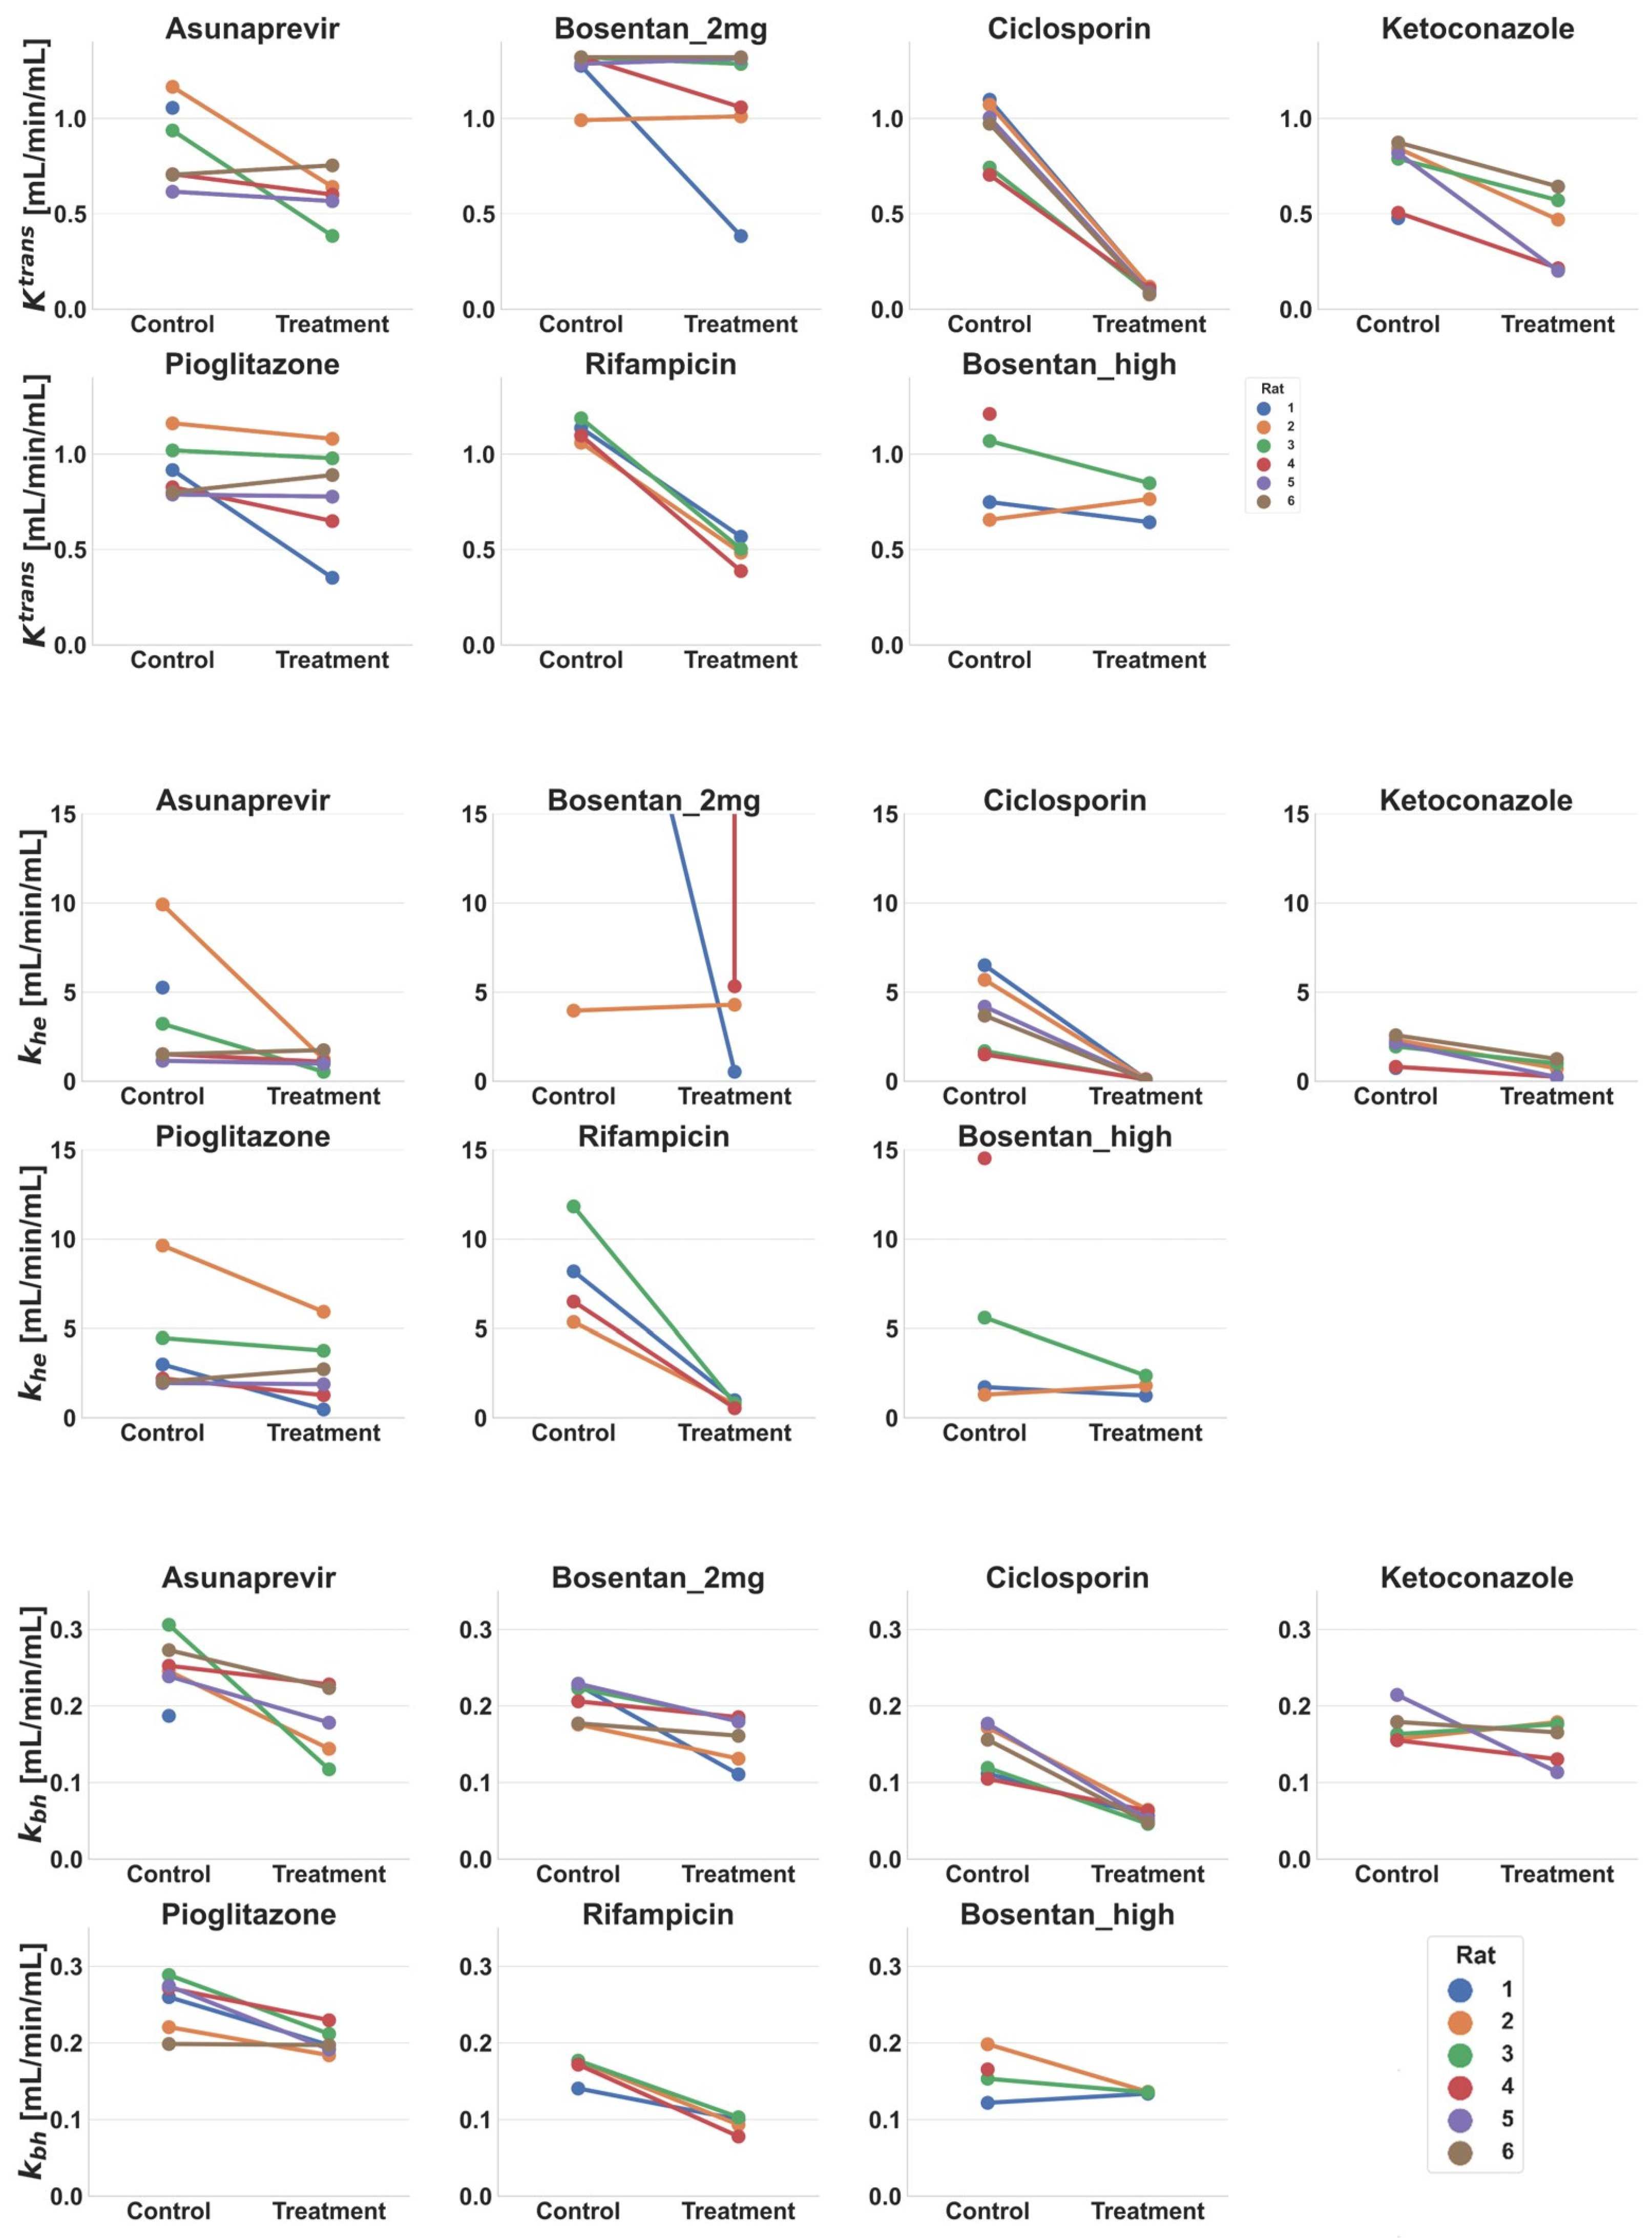
| D Ketoconazole 3 mg/kg c | 0.35 ** (0.20, 0.49) | 1.27 ** (0.81, 1.74) | 0.02 (−0.02, 0.06) |
| E Asunaprevir 5 mg/kg c | 0.24 (−0.01, 0.48) | 2.34 (−0.92, 5.60) | 0.09 * (0.03, 0.14) |
| E Pioglitazone 0.4 mg/kg | 0.13 (−0.05, 0.32) | 1.21 (−0.10, 2.51) | 0.05 ** (0.03, 0.08) |
| G1 Bosentan 2 mg/kg d | 0.28 (−0.32, 0.88) | −54.22 (−197.97, 89.53) | 0.07 (0.03, 0.12) |
| G2 Bosentan 4–6 mg/kg | 0.07 (−0.12, 0.26) | 1.07 (−1.13, 3.26) | 0.02 (−0.02, 0.07) |
| G2 Ciclosporin 5 mg/kg | 0.83 ** (0.70, 0.97) | 3.78 ** (2.16, 5.4) | 0.09 ** (0.06, 0.11) |
| G2 Rifampicin 2 mg/kg | 0.64 ** (0.56, 0.71) | 7.20 * (4.49, 9.91) | 0.07 ** (0.05, 0.10) |
Disclaimer/Publisher’s Note: The statements, opinions and data contained in all publications are solely those of the individual author(s) and contributor(s) and not of MDPI and/or the editor(s). MDPI and/or the editor(s) disclaim responsibility for any injury to people or property resulting from any ideas, methods, instructions or products referred to in the content. |
© 2023 by the authors. Licensee MDPI, Basel, Switzerland. This article is an open access article distributed under the terms and conditions of the Creative Commons Attribution (CC BY) license (https://creativecommons.org/licenses/by/4.0/).
Share and Cite
Melillo, N.; Scotcher, D.; Kenna, J.G.; Green, C.; Hines, C.D.G.; Laitinen, I.; Hockings, P.D.; Ogungbenro, K.; Gunwhy, E.R.; Sourbron, S.; et al. Use of In Vivo Imaging and Physiologically-Based Kinetic Modelling to Predict Hepatic Transporter Mediated Drug–Drug Interactions in Rats. Pharmaceutics 2023, 15, 896. https://doi.org/10.3390/pharmaceutics15030896
Melillo N, Scotcher D, Kenna JG, Green C, Hines CDG, Laitinen I, Hockings PD, Ogungbenro K, Gunwhy ER, Sourbron S, et al. Use of In Vivo Imaging and Physiologically-Based Kinetic Modelling to Predict Hepatic Transporter Mediated Drug–Drug Interactions in Rats. Pharmaceutics. 2023; 15(3):896. https://doi.org/10.3390/pharmaceutics15030896
Chicago/Turabian StyleMelillo, Nicola, Daniel Scotcher, J. Gerry Kenna, Claudia Green, Catherine D. G. Hines, Iina Laitinen, Paul D. Hockings, Kayode Ogungbenro, Ebony R. Gunwhy, Steven Sourbron, and et al. 2023. "Use of In Vivo Imaging and Physiologically-Based Kinetic Modelling to Predict Hepatic Transporter Mediated Drug–Drug Interactions in Rats" Pharmaceutics 15, no. 3: 896. https://doi.org/10.3390/pharmaceutics15030896