Figure 1.
Results of solubility studies of SLM in various solubilizers.
Figure 1.
Results of solubility studies of SLM in various solubilizers.
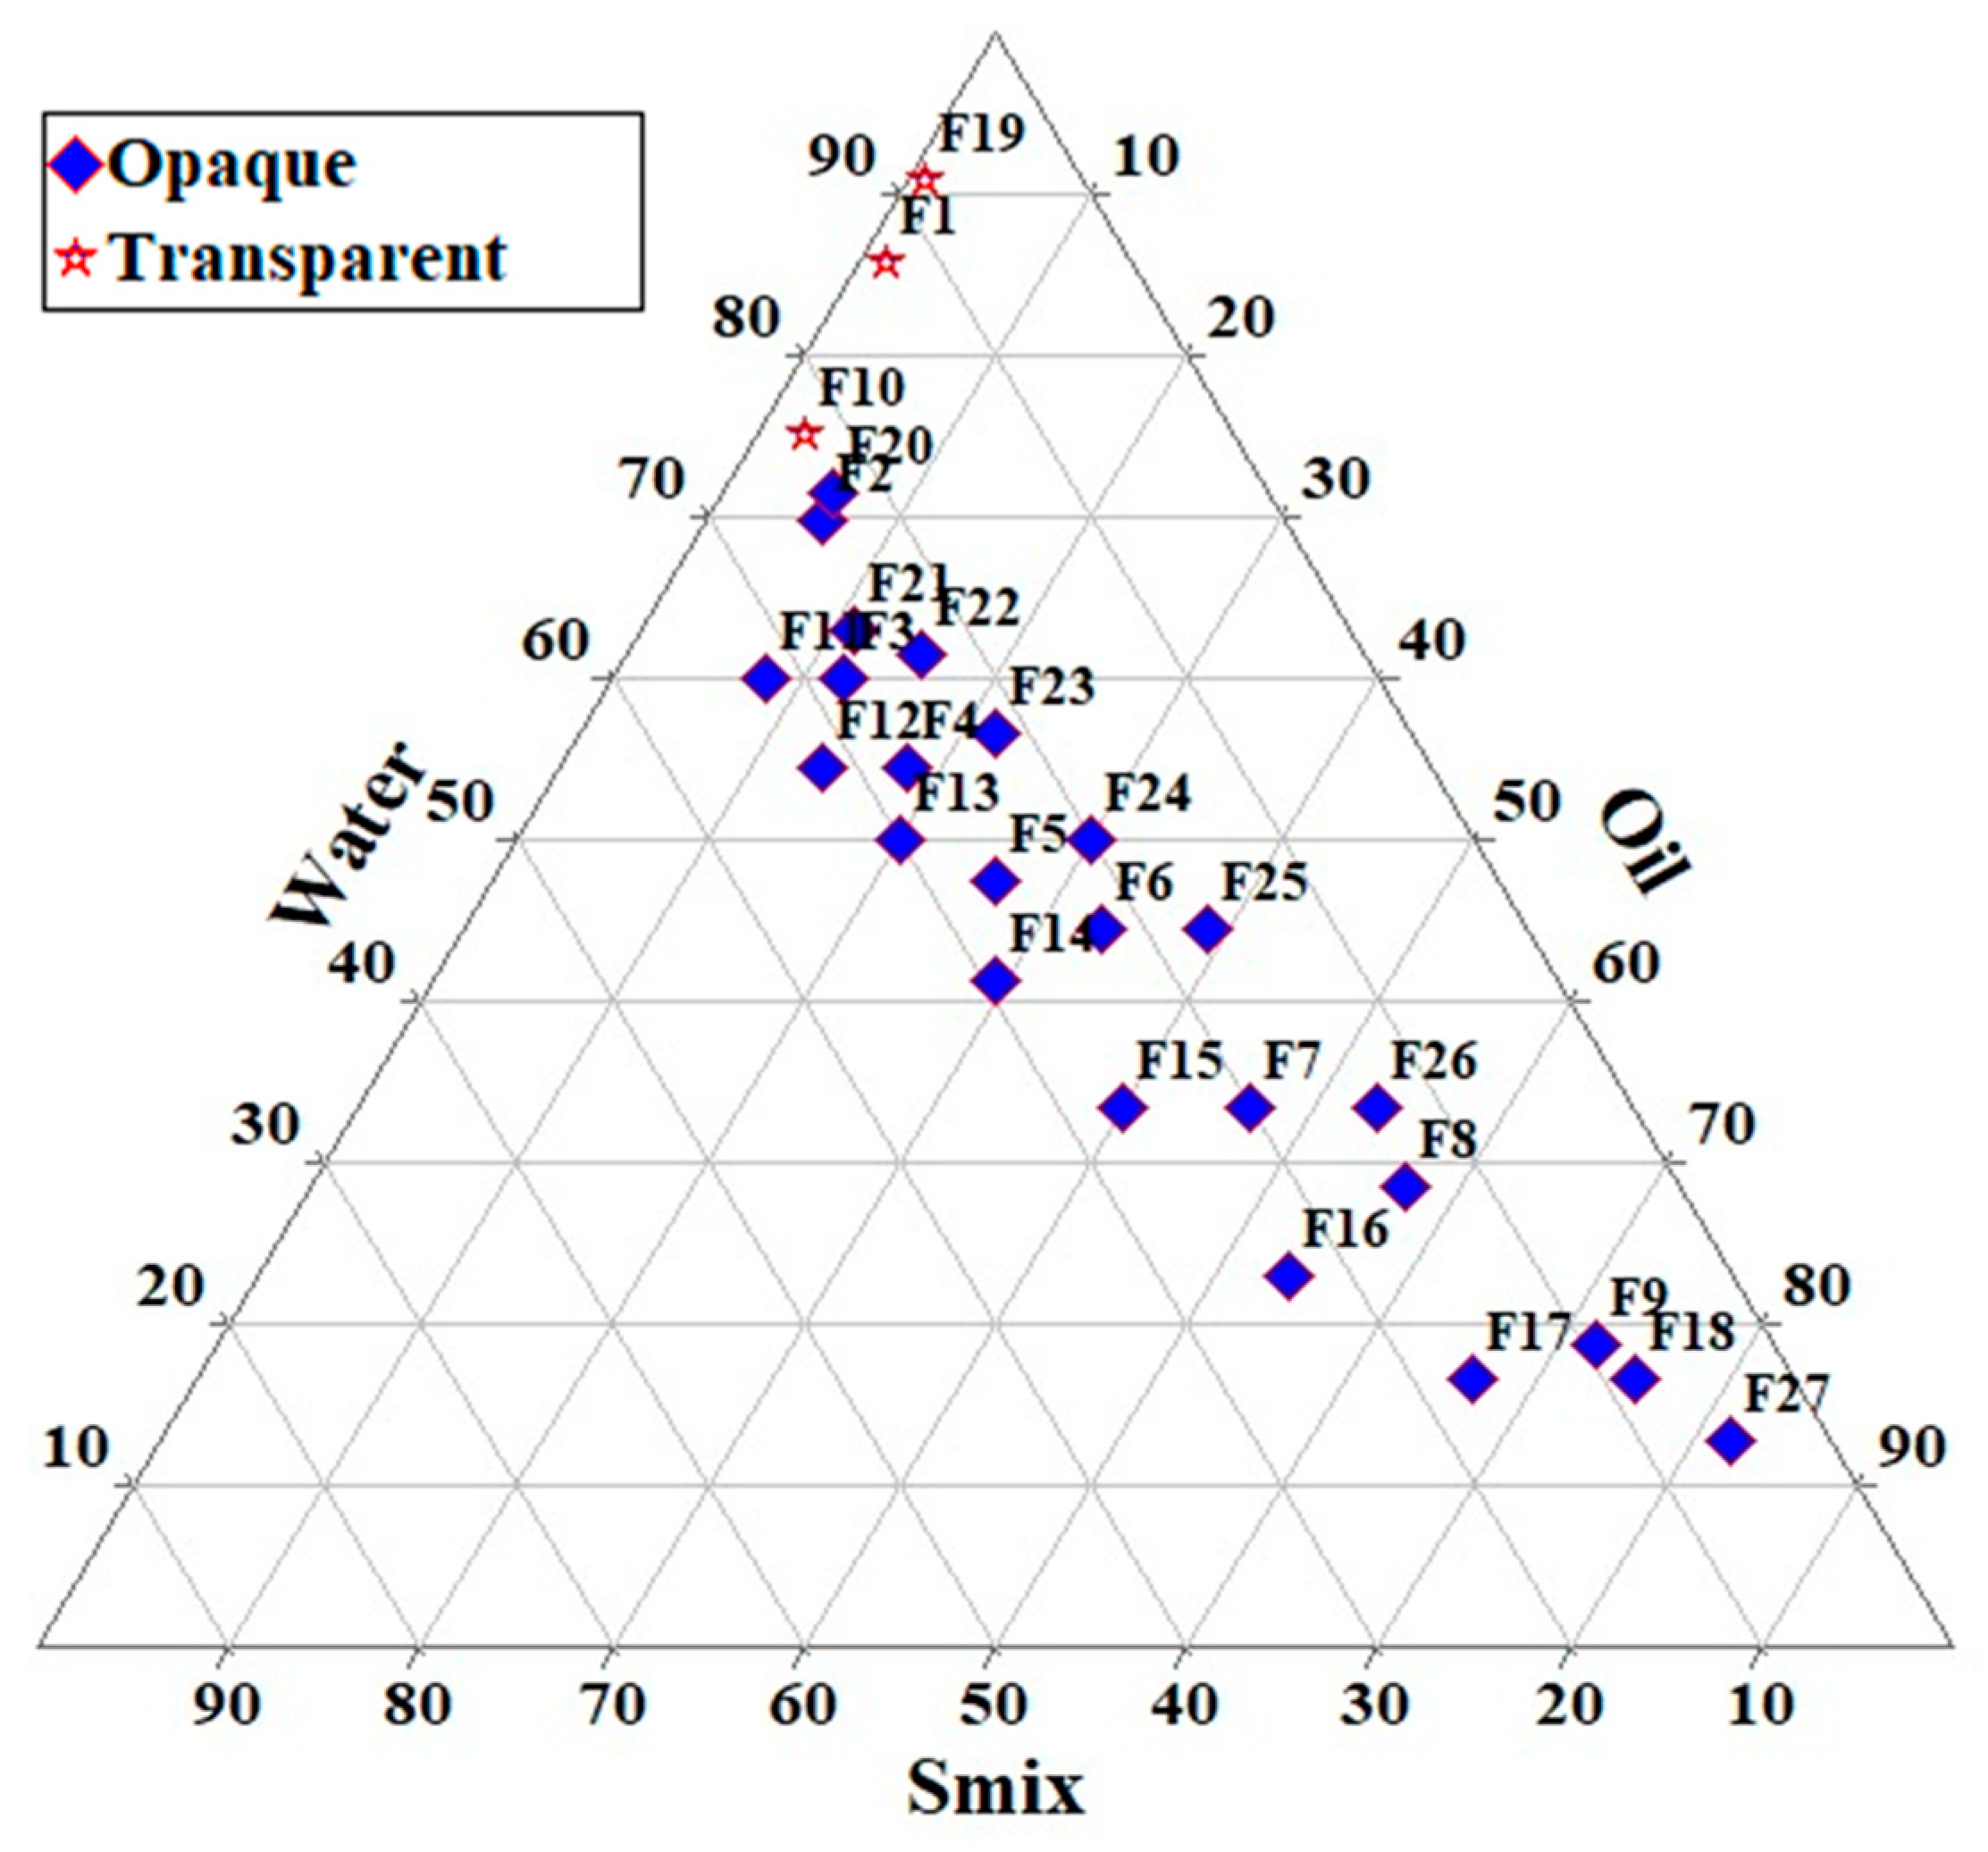
Figure 2.
Ternary phase diagram indicating microemulsion region.
Figure 2.
Ternary phase diagram indicating microemulsion region.
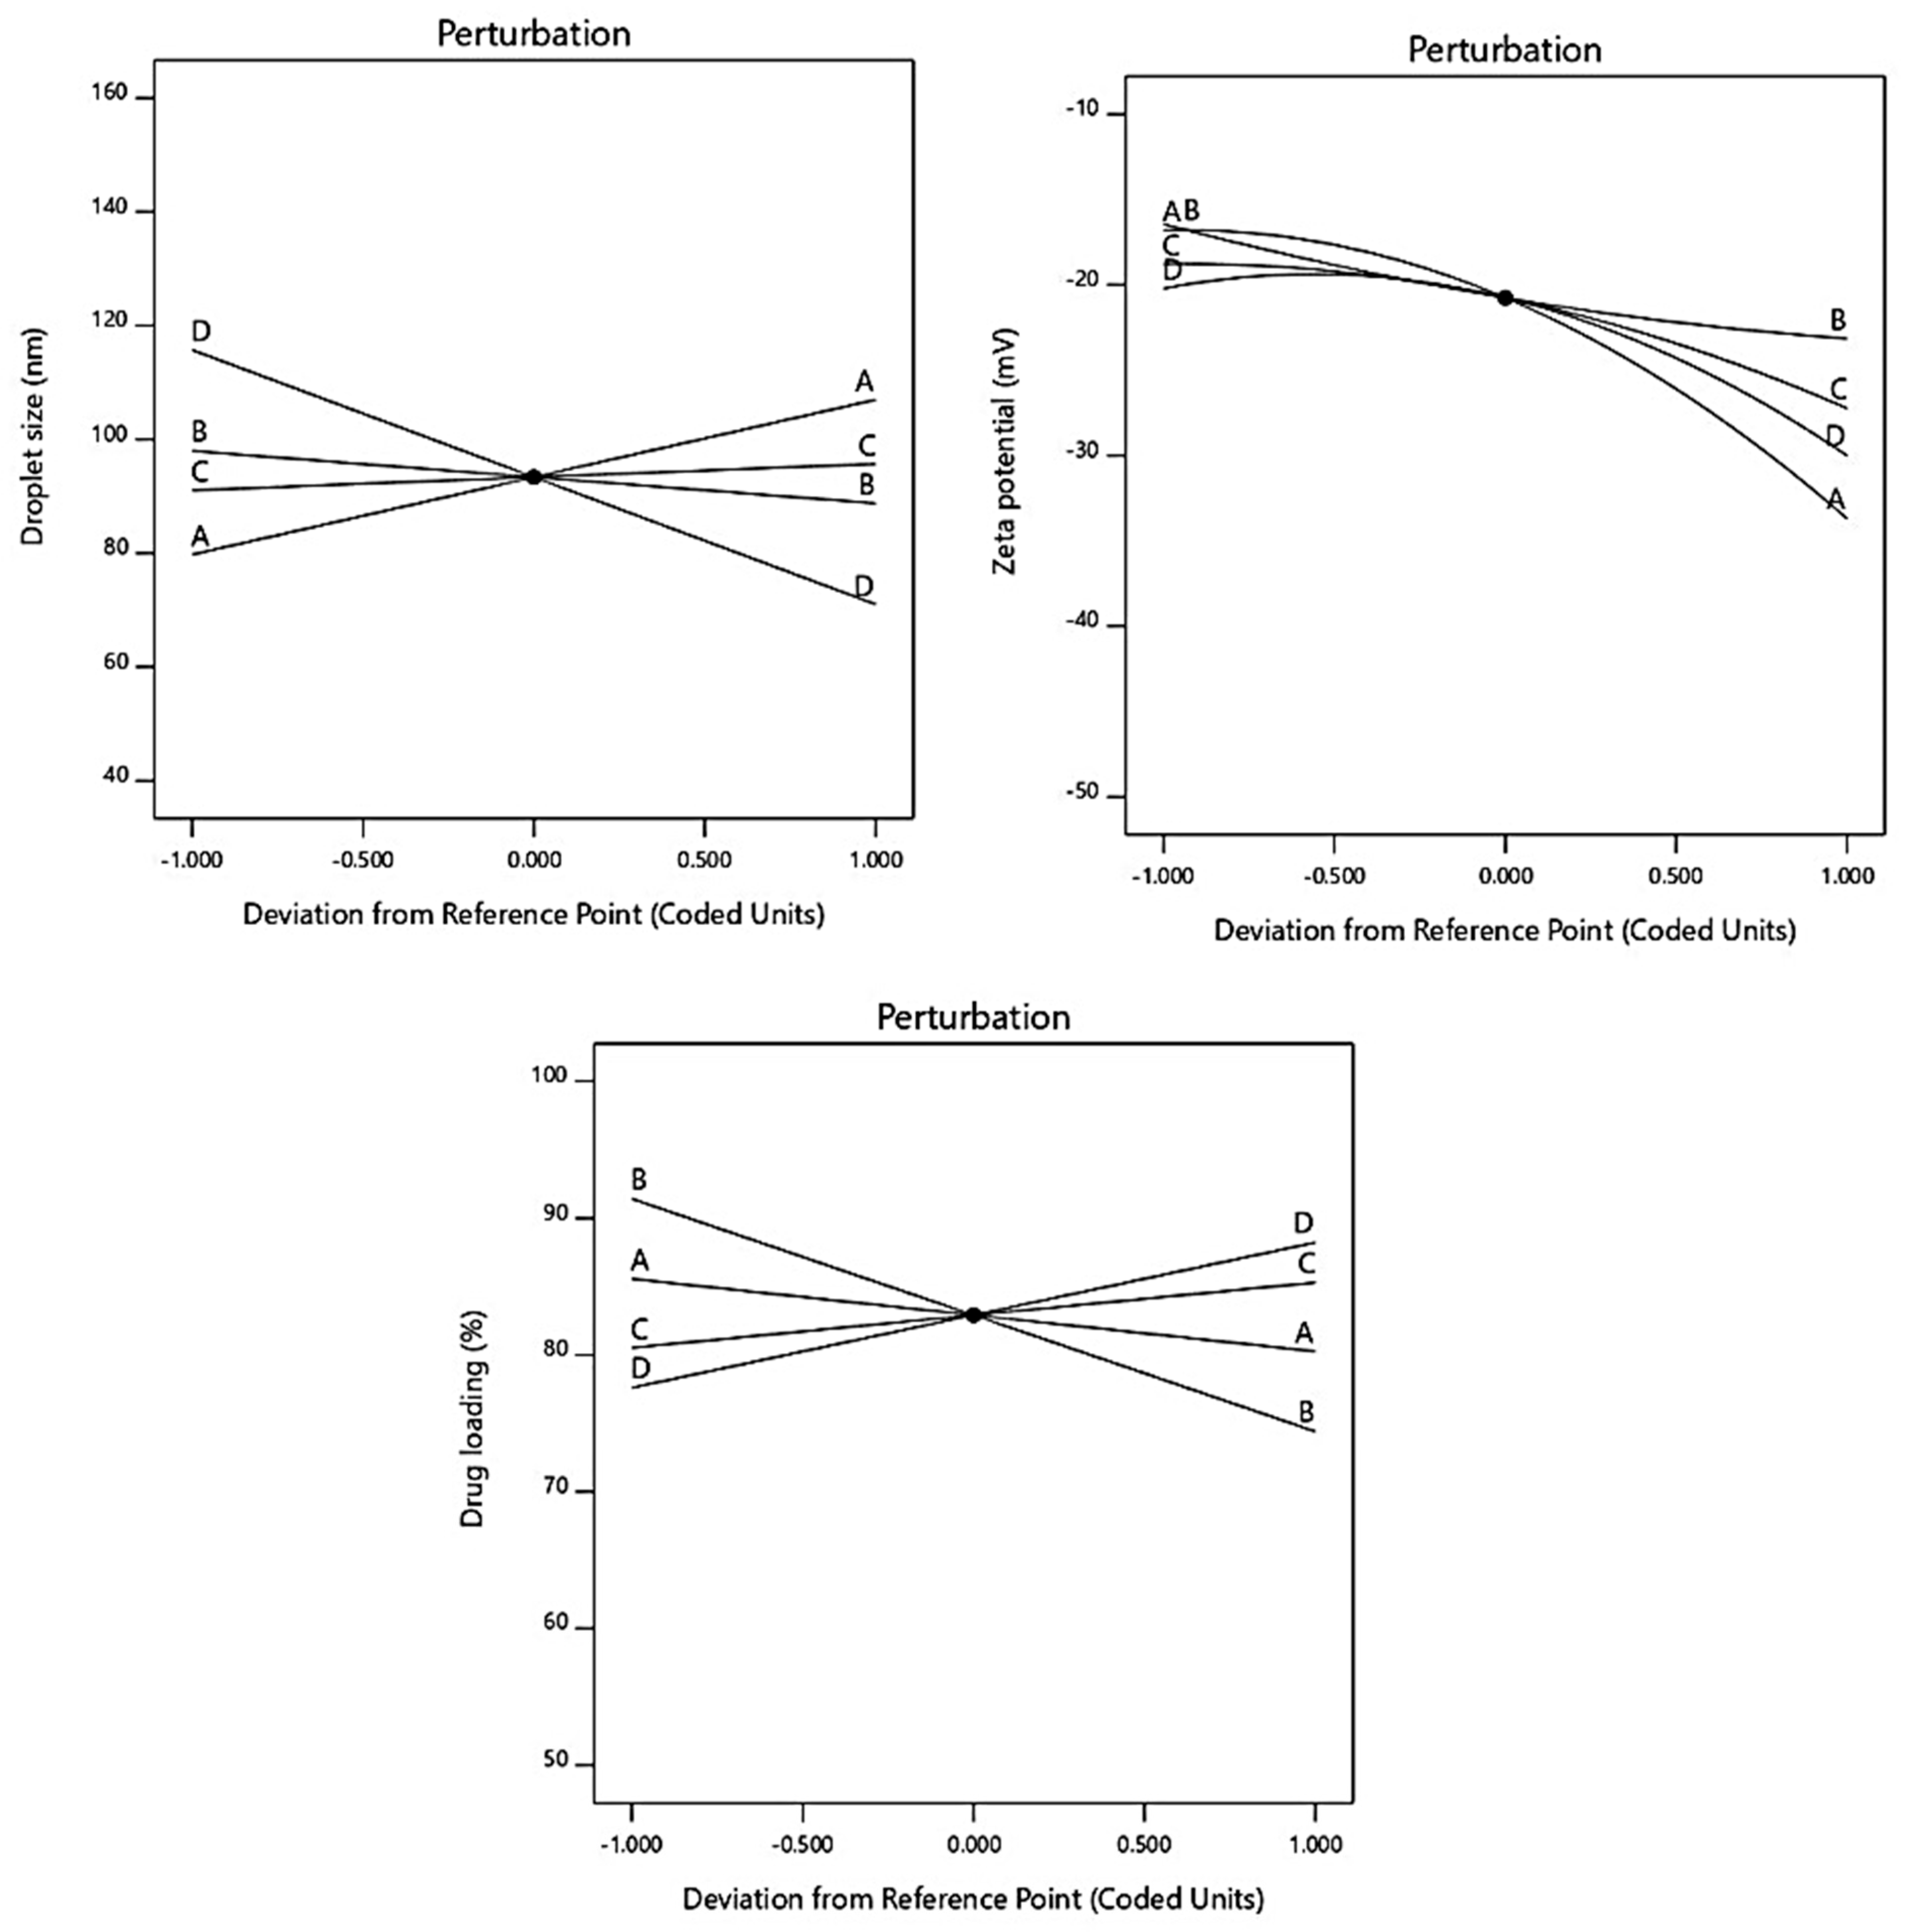
Figure 3.
Figure indicating influence of various factors on responses through perturbation graph.
Figure 3.
Figure indicating influence of various factors on responses through perturbation graph.
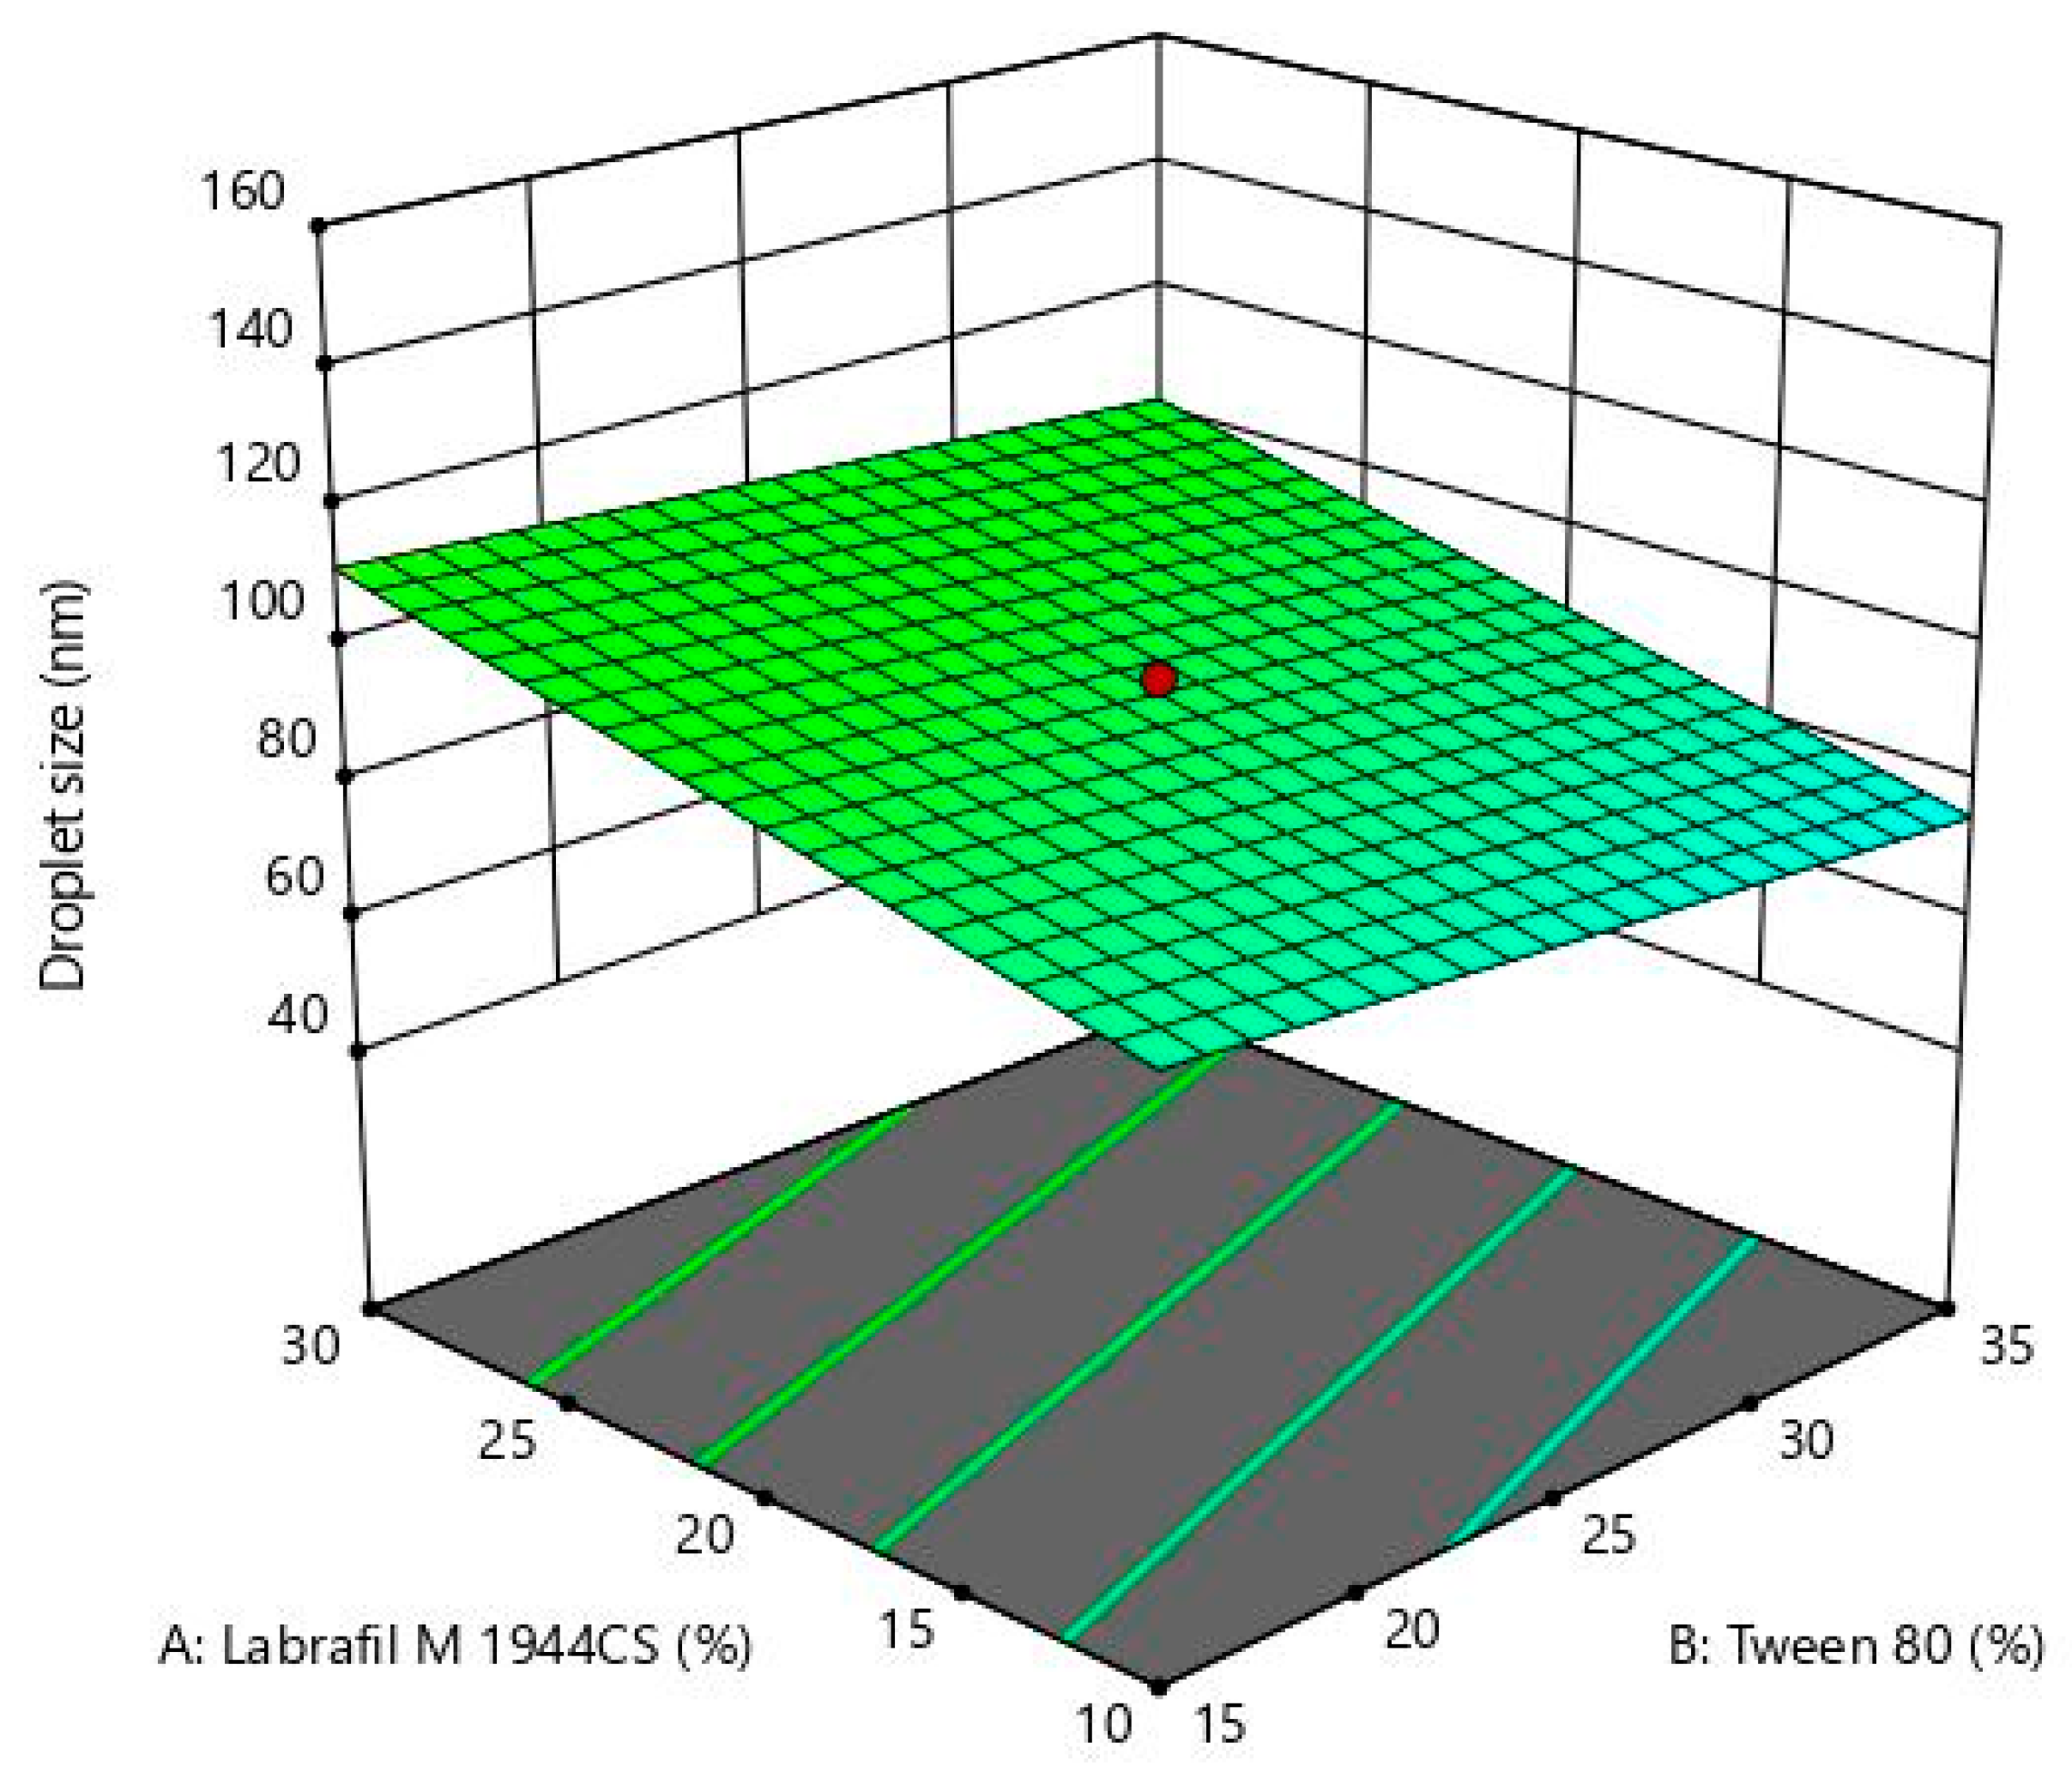
Figure 4.
3D response surface plot for Labrafil M 1944CS, Tween 80, Transcutol P, and water on droplet size.
Figure 4.
3D response surface plot for Labrafil M 1944CS, Tween 80, Transcutol P, and water on droplet size.
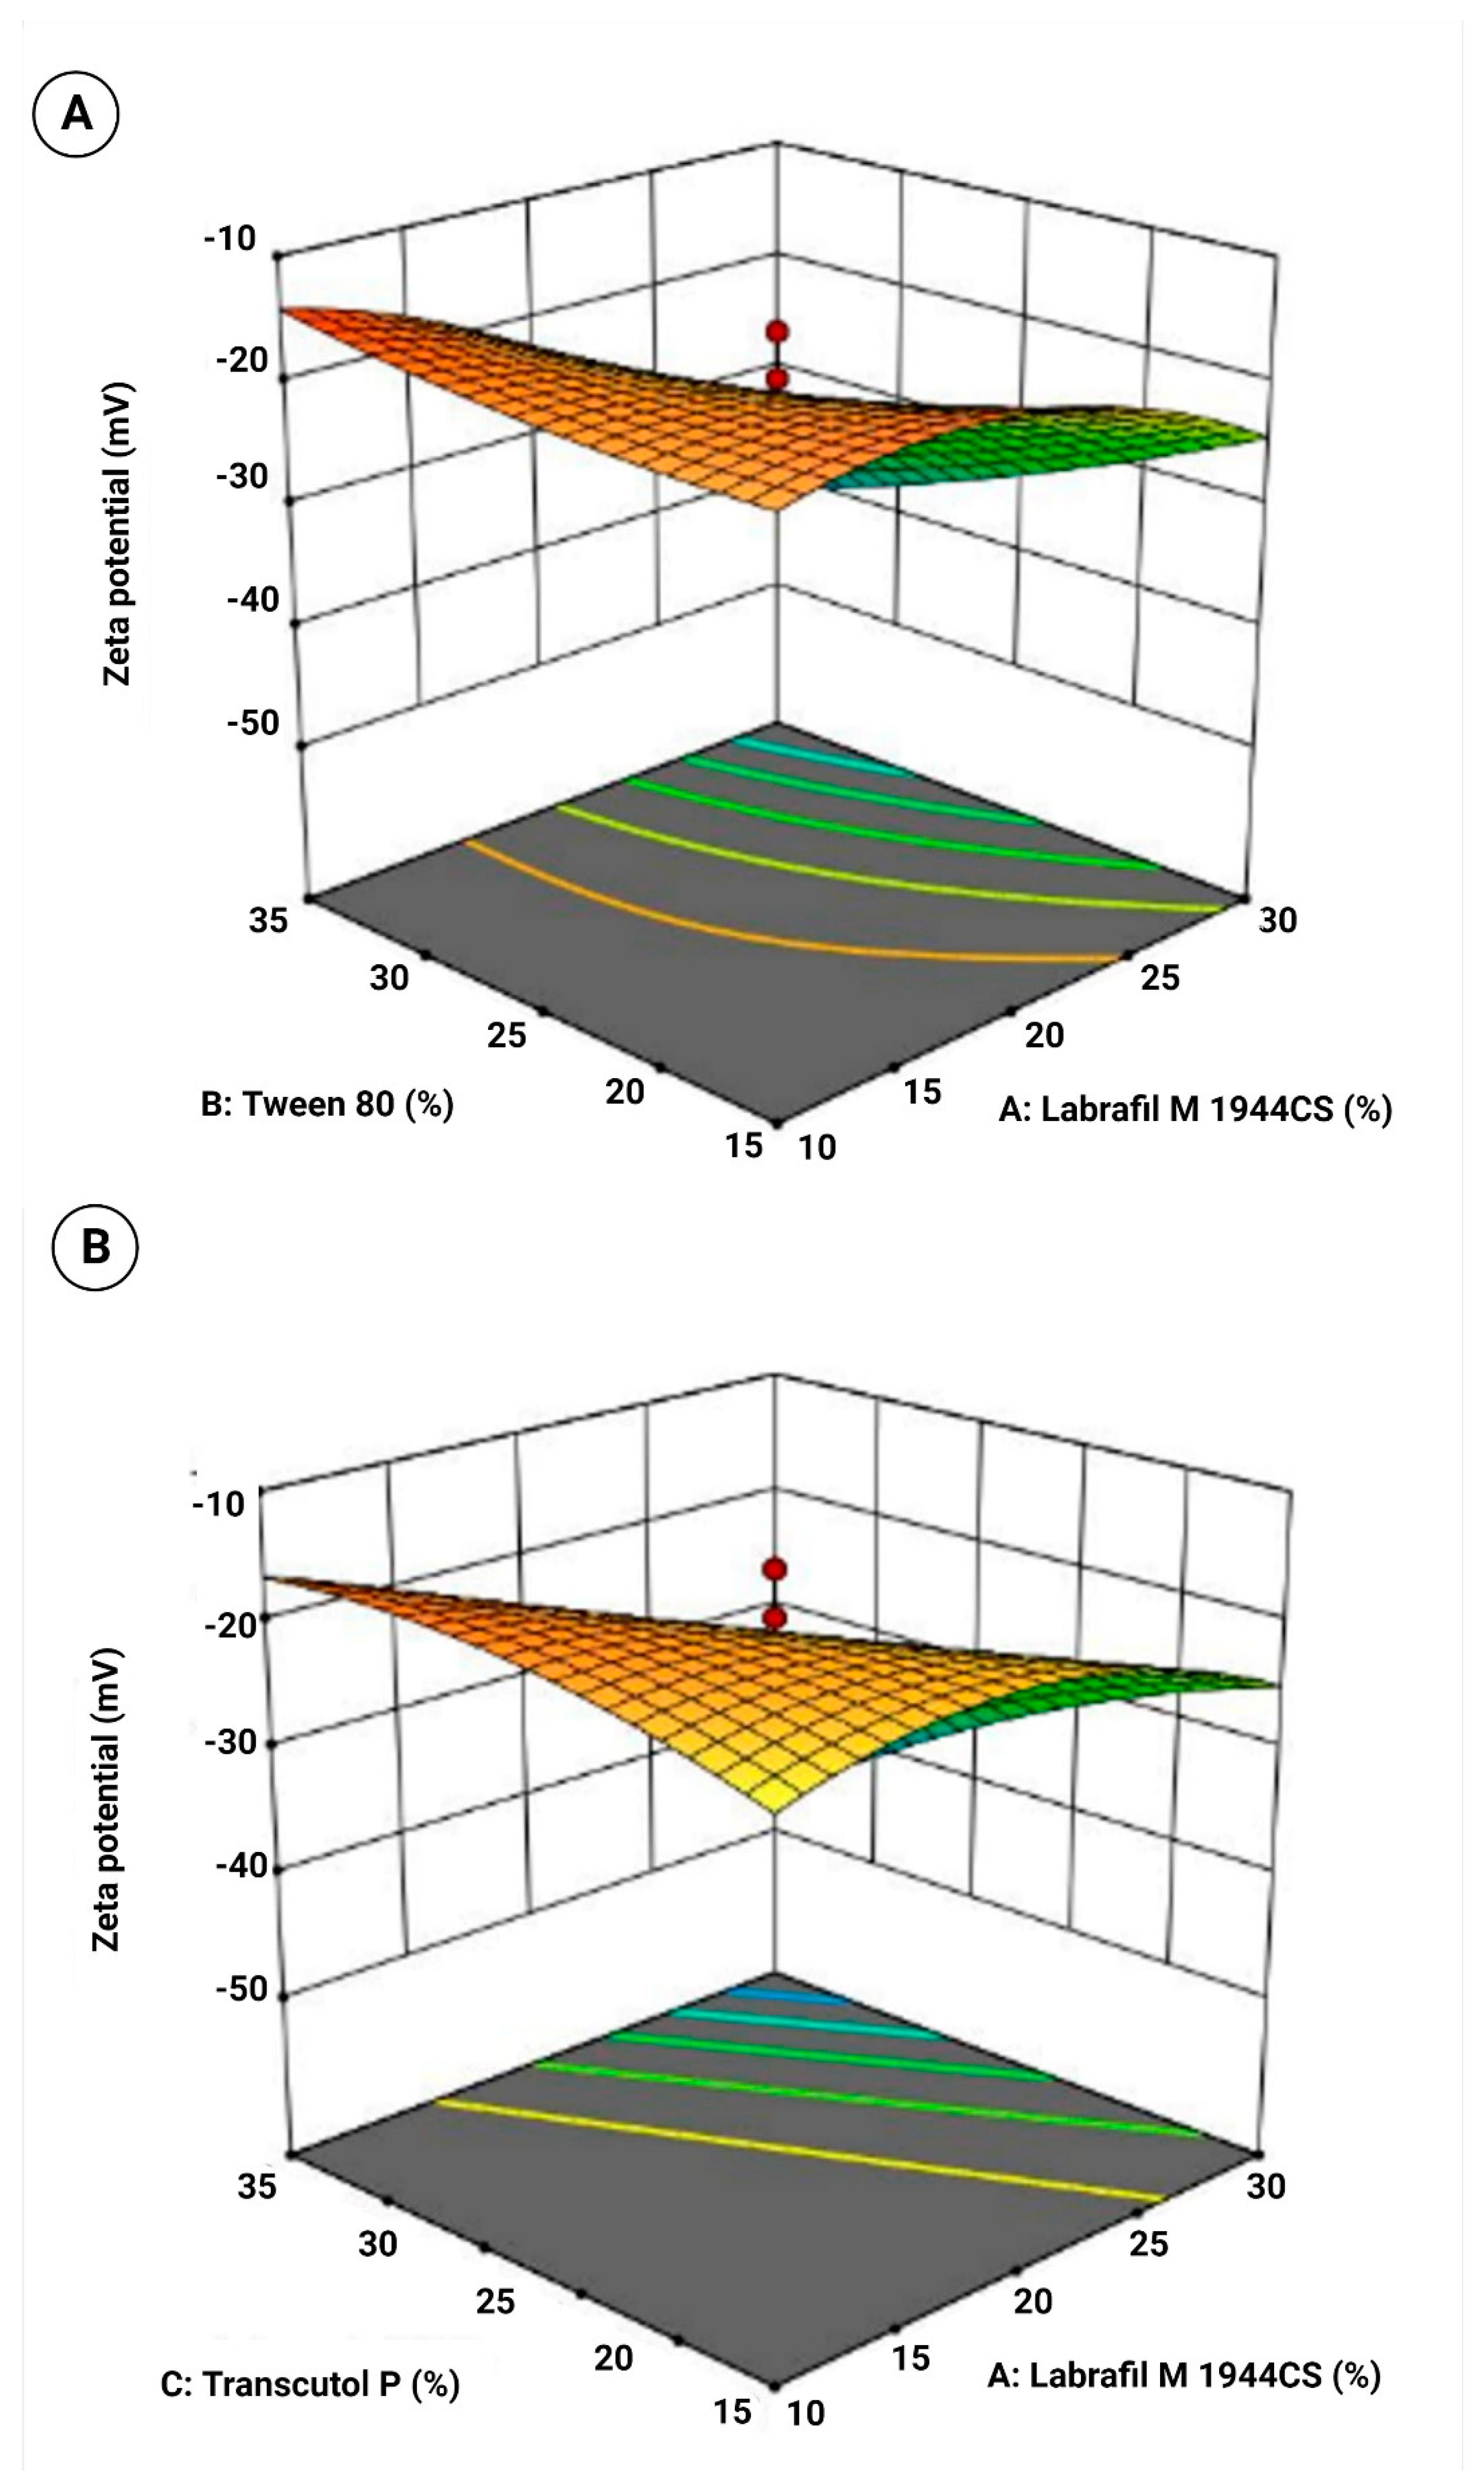
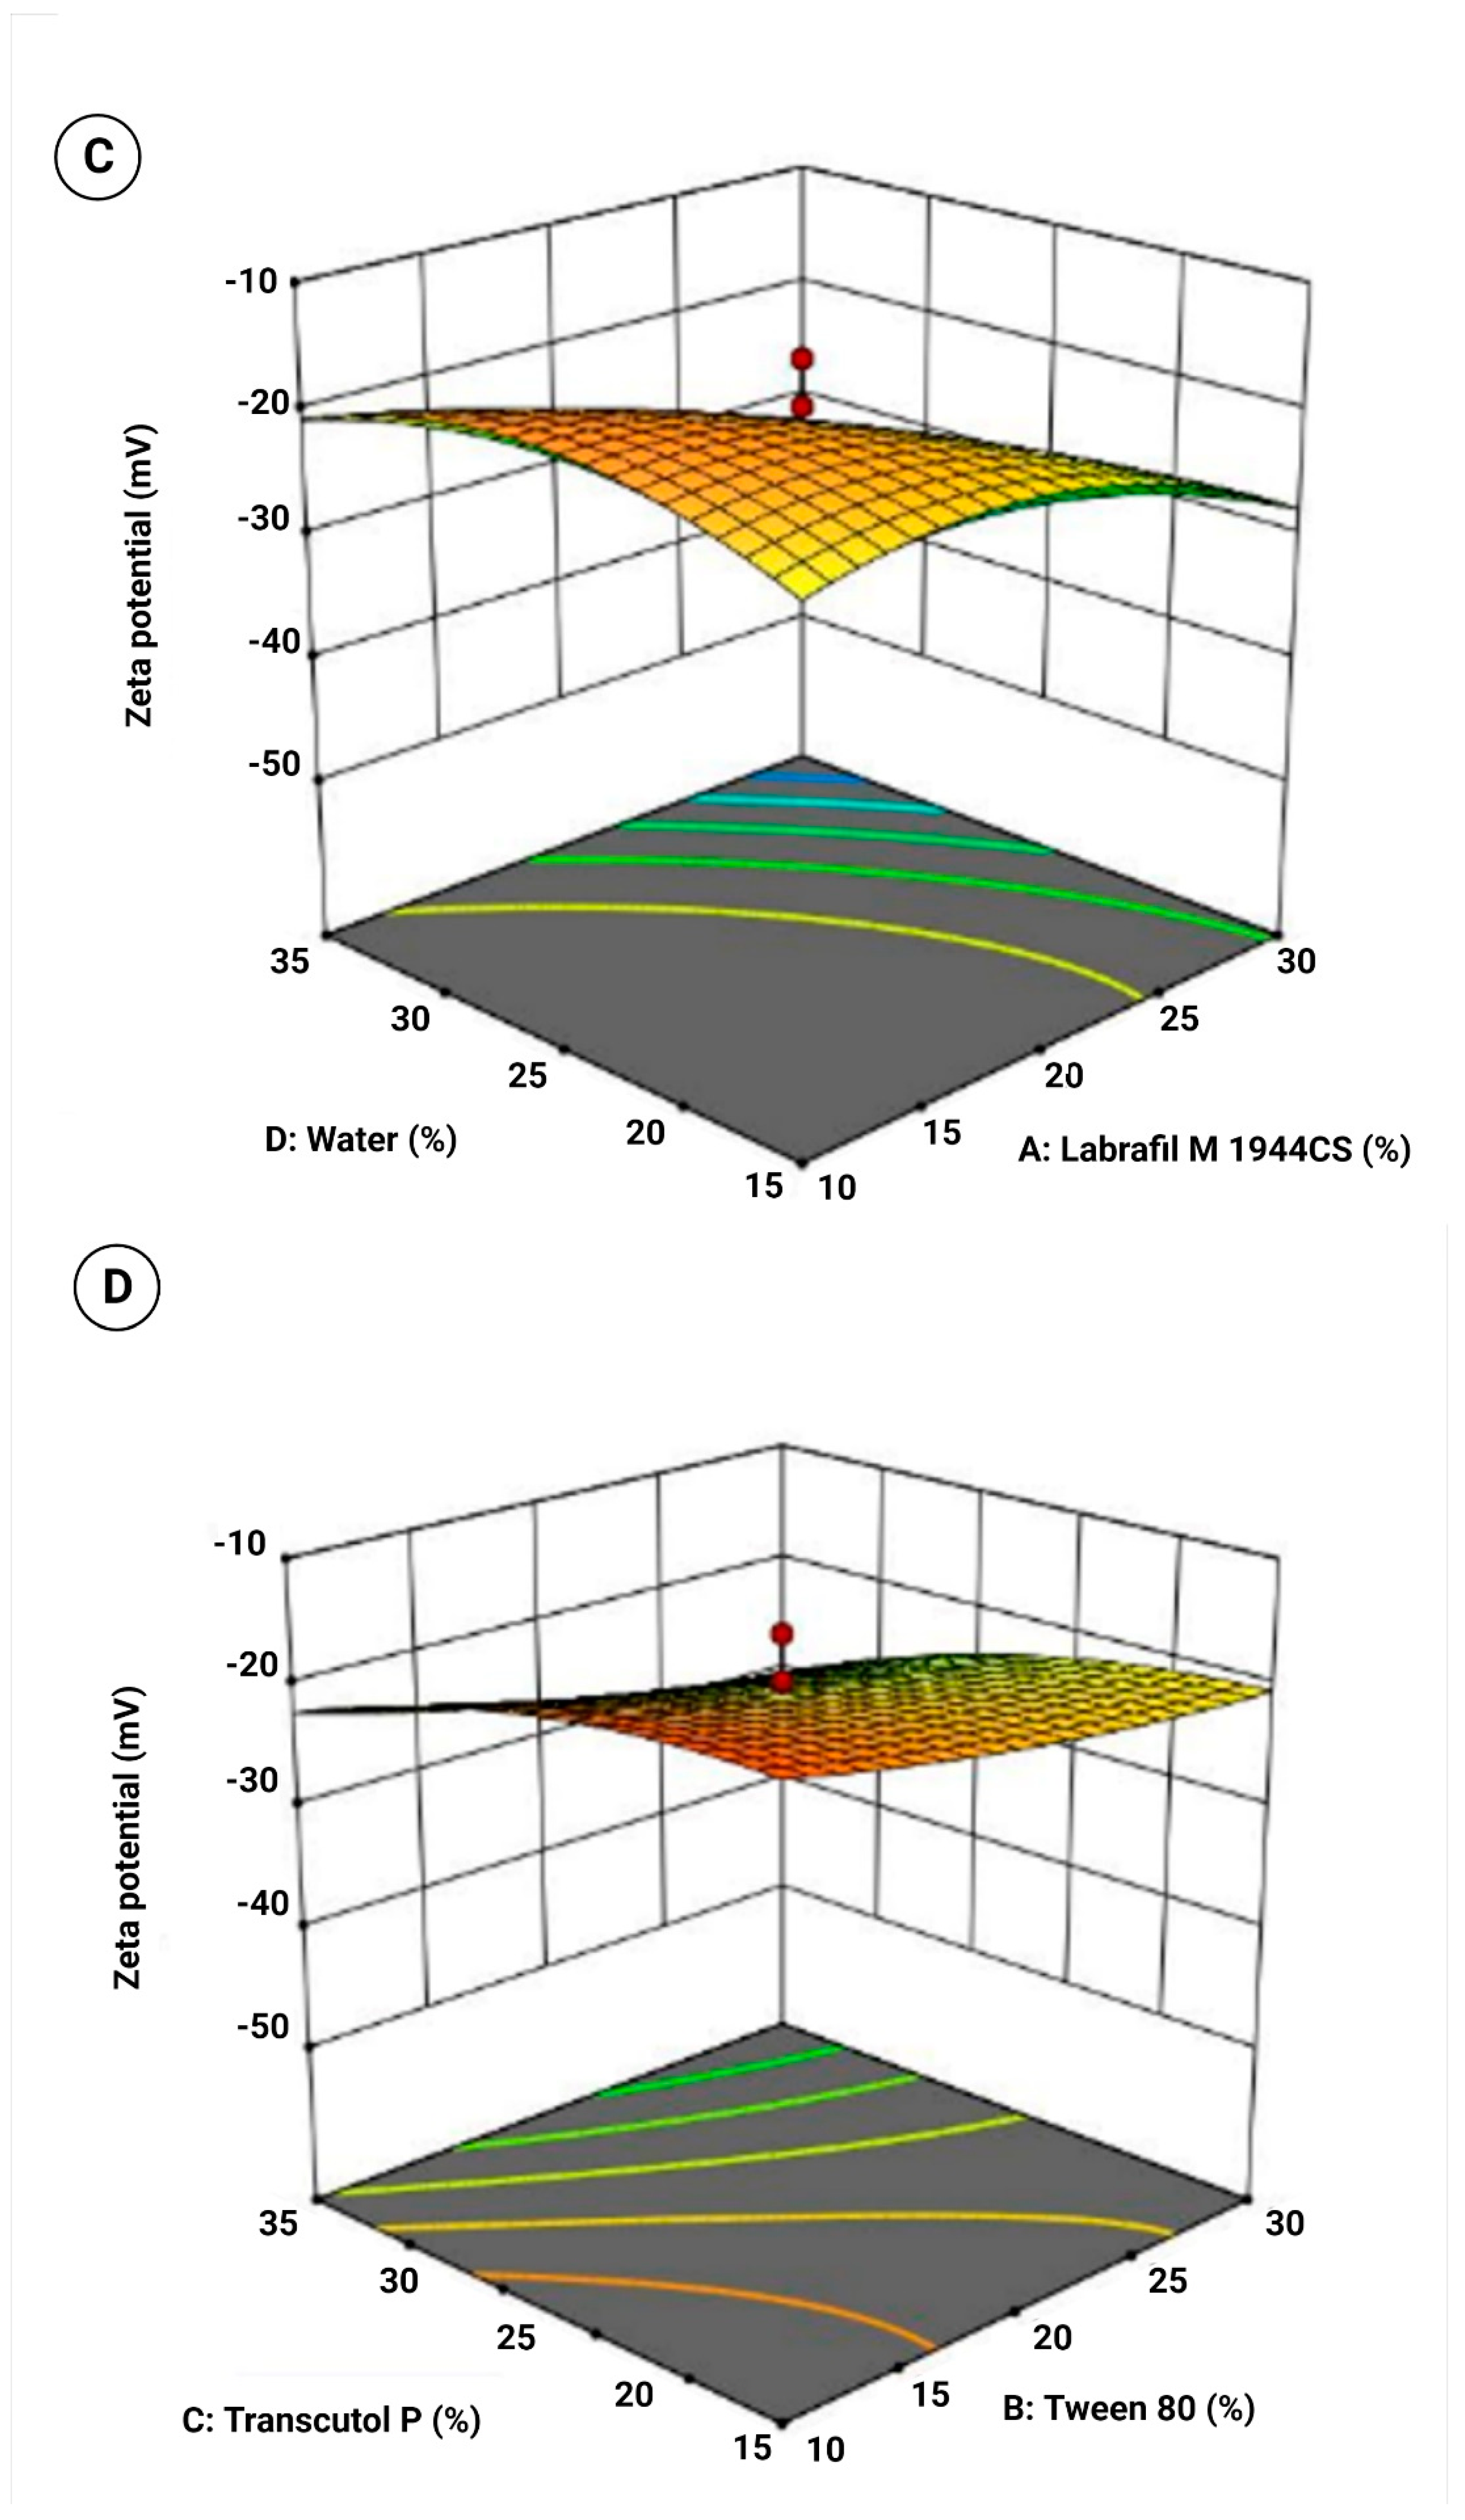
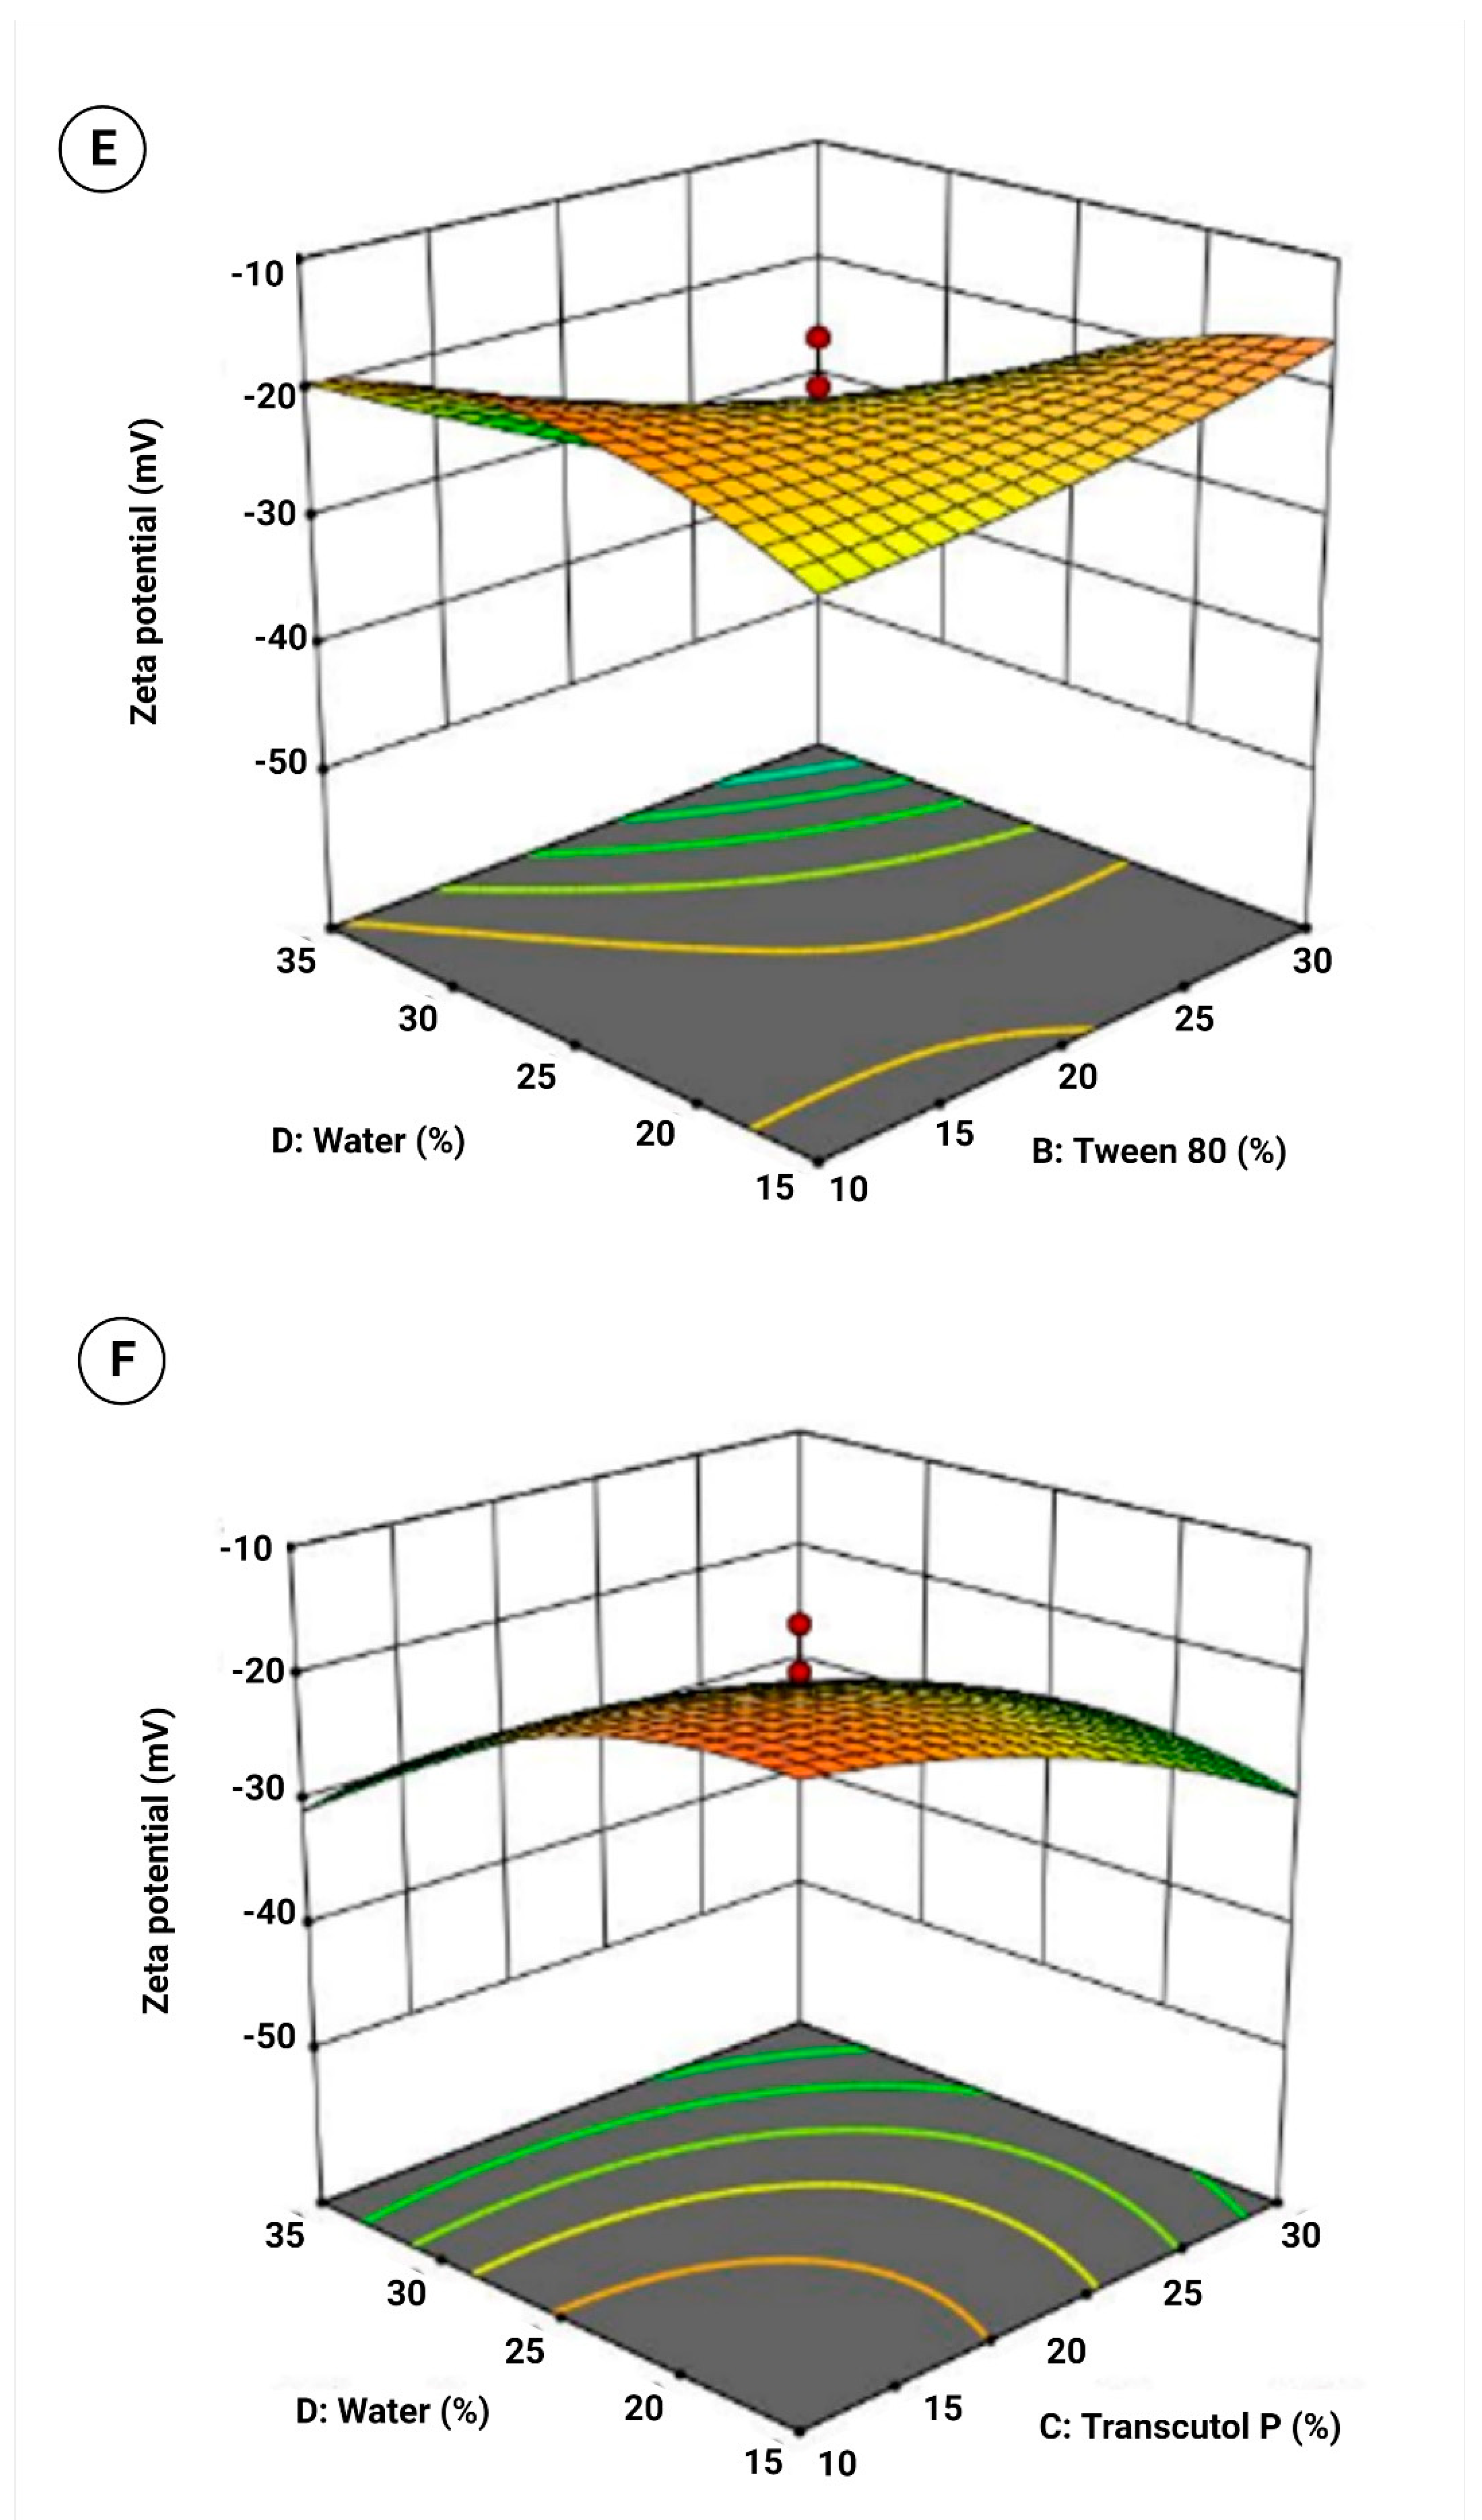
Figure 5.
3D response surface plot for (A) Labrafil M 1944CS and Tween 80, (B) Labrafil M 1944CS and Transcutol P, (C) Labrafil M 1944CS and water, (D) Tween 80 and Transcutol P, (E) Tween 80 and water, and (F) Transcutol P and water on zeta potential.
Figure 5.
3D response surface plot for (A) Labrafil M 1944CS and Tween 80, (B) Labrafil M 1944CS and Transcutol P, (C) Labrafil M 1944CS and water, (D) Tween 80 and Transcutol P, (E) Tween 80 and water, and (F) Transcutol P and water on zeta potential.
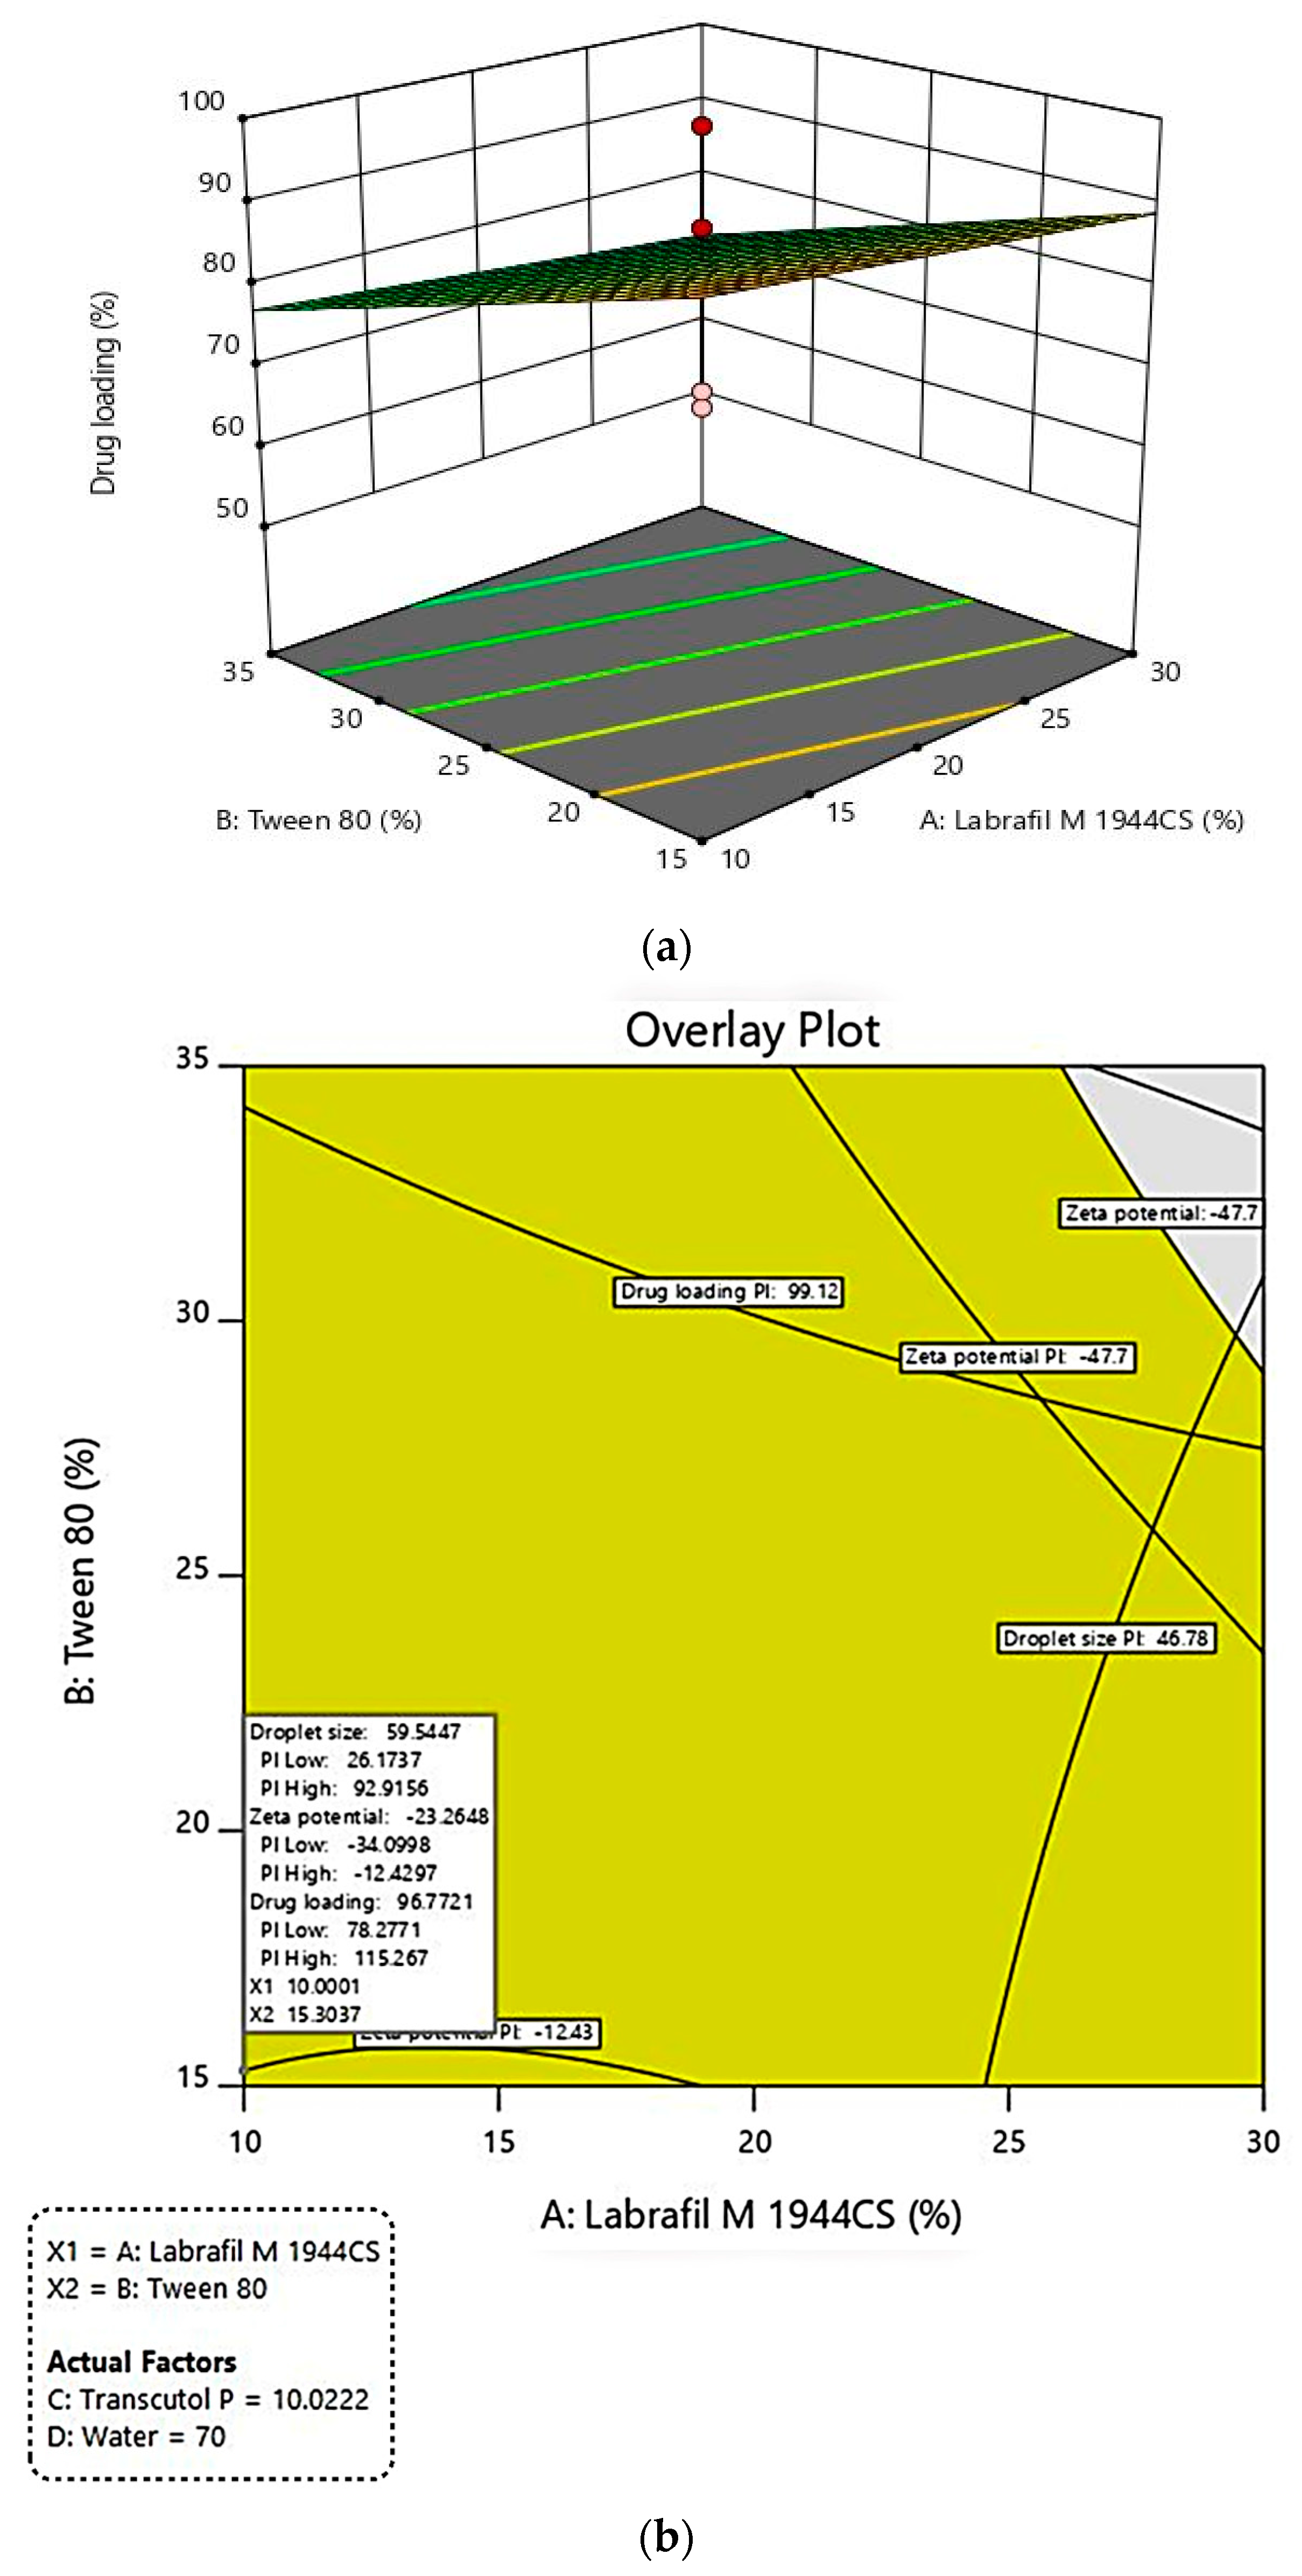
Figure 6.
(a). 3D response surface plot for effect of formulation variables on drug loading; (b). Graphical plot showing predicted values for variables and responses for formulating SLMME.
Figure 6.
(a). 3D response surface plot for effect of formulation variables on drug loading; (b). Graphical plot showing predicted values for variables and responses for formulating SLMME.
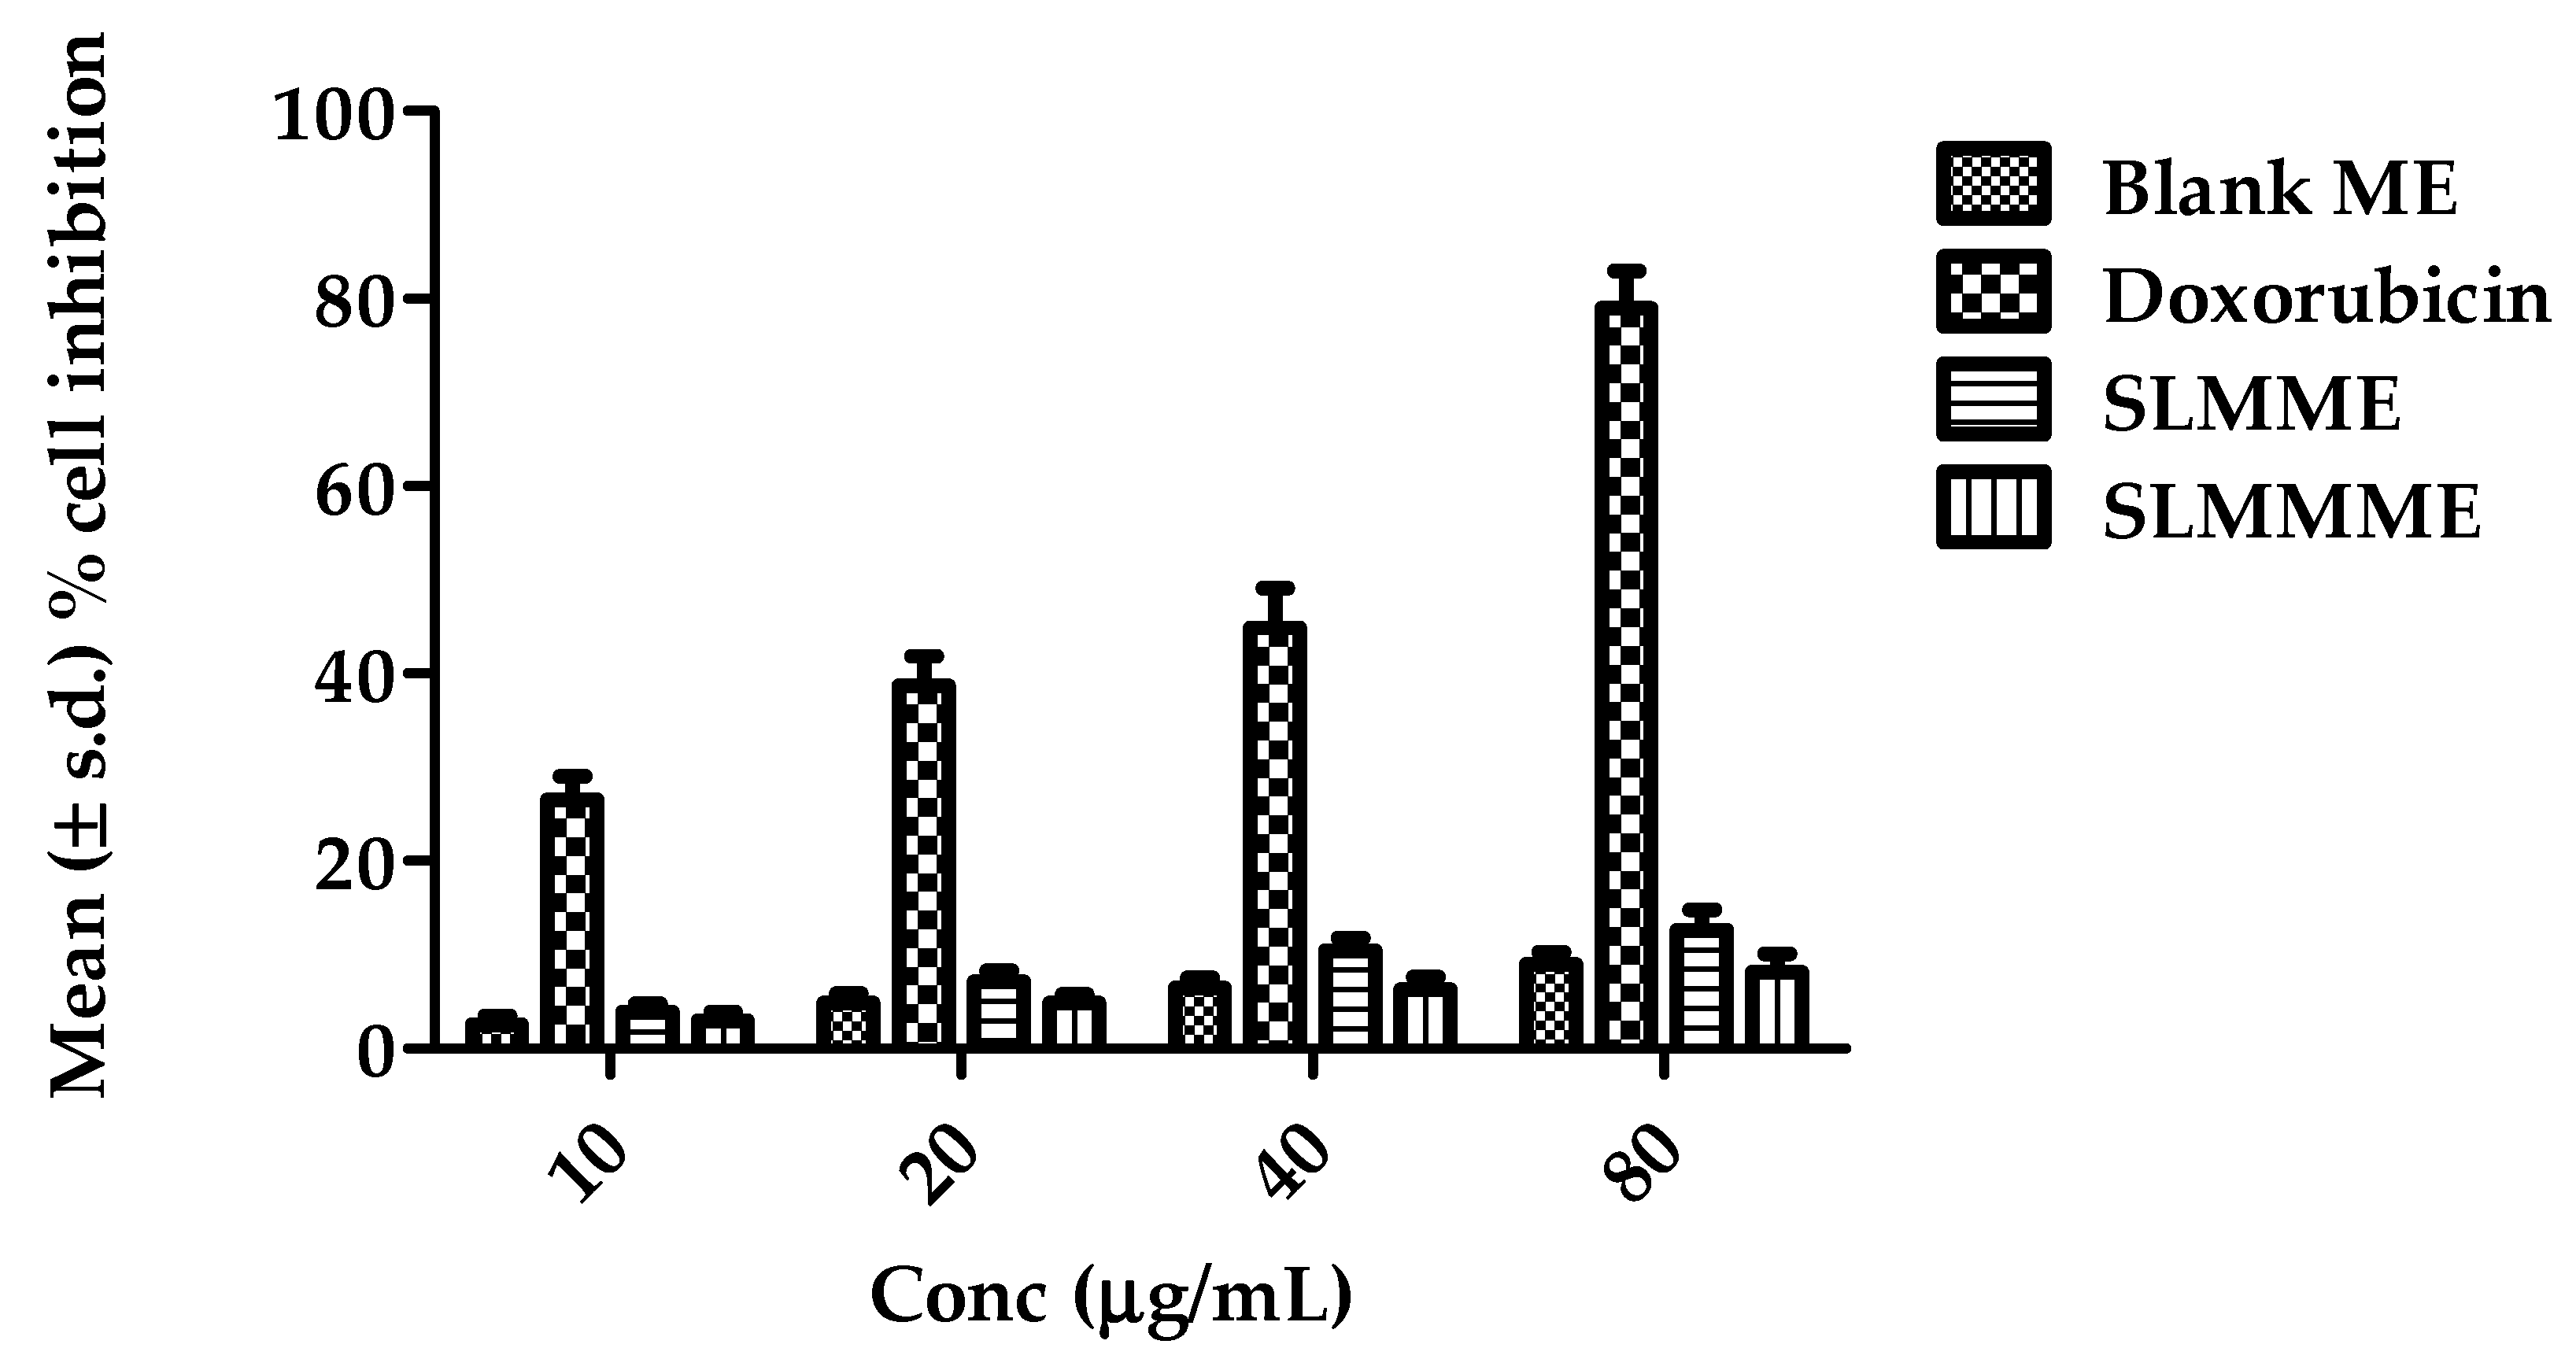
Figure 7.
Results of cytotoxicity studies in terms of % cell inhibition of blank ME, Doxorubicin, SLMME, and SLMMME [number of replicates (n) = 3].
Figure 7.
Results of cytotoxicity studies in terms of % cell inhibition of blank ME, Doxorubicin, SLMME, and SLMMME [number of replicates (n) = 3].
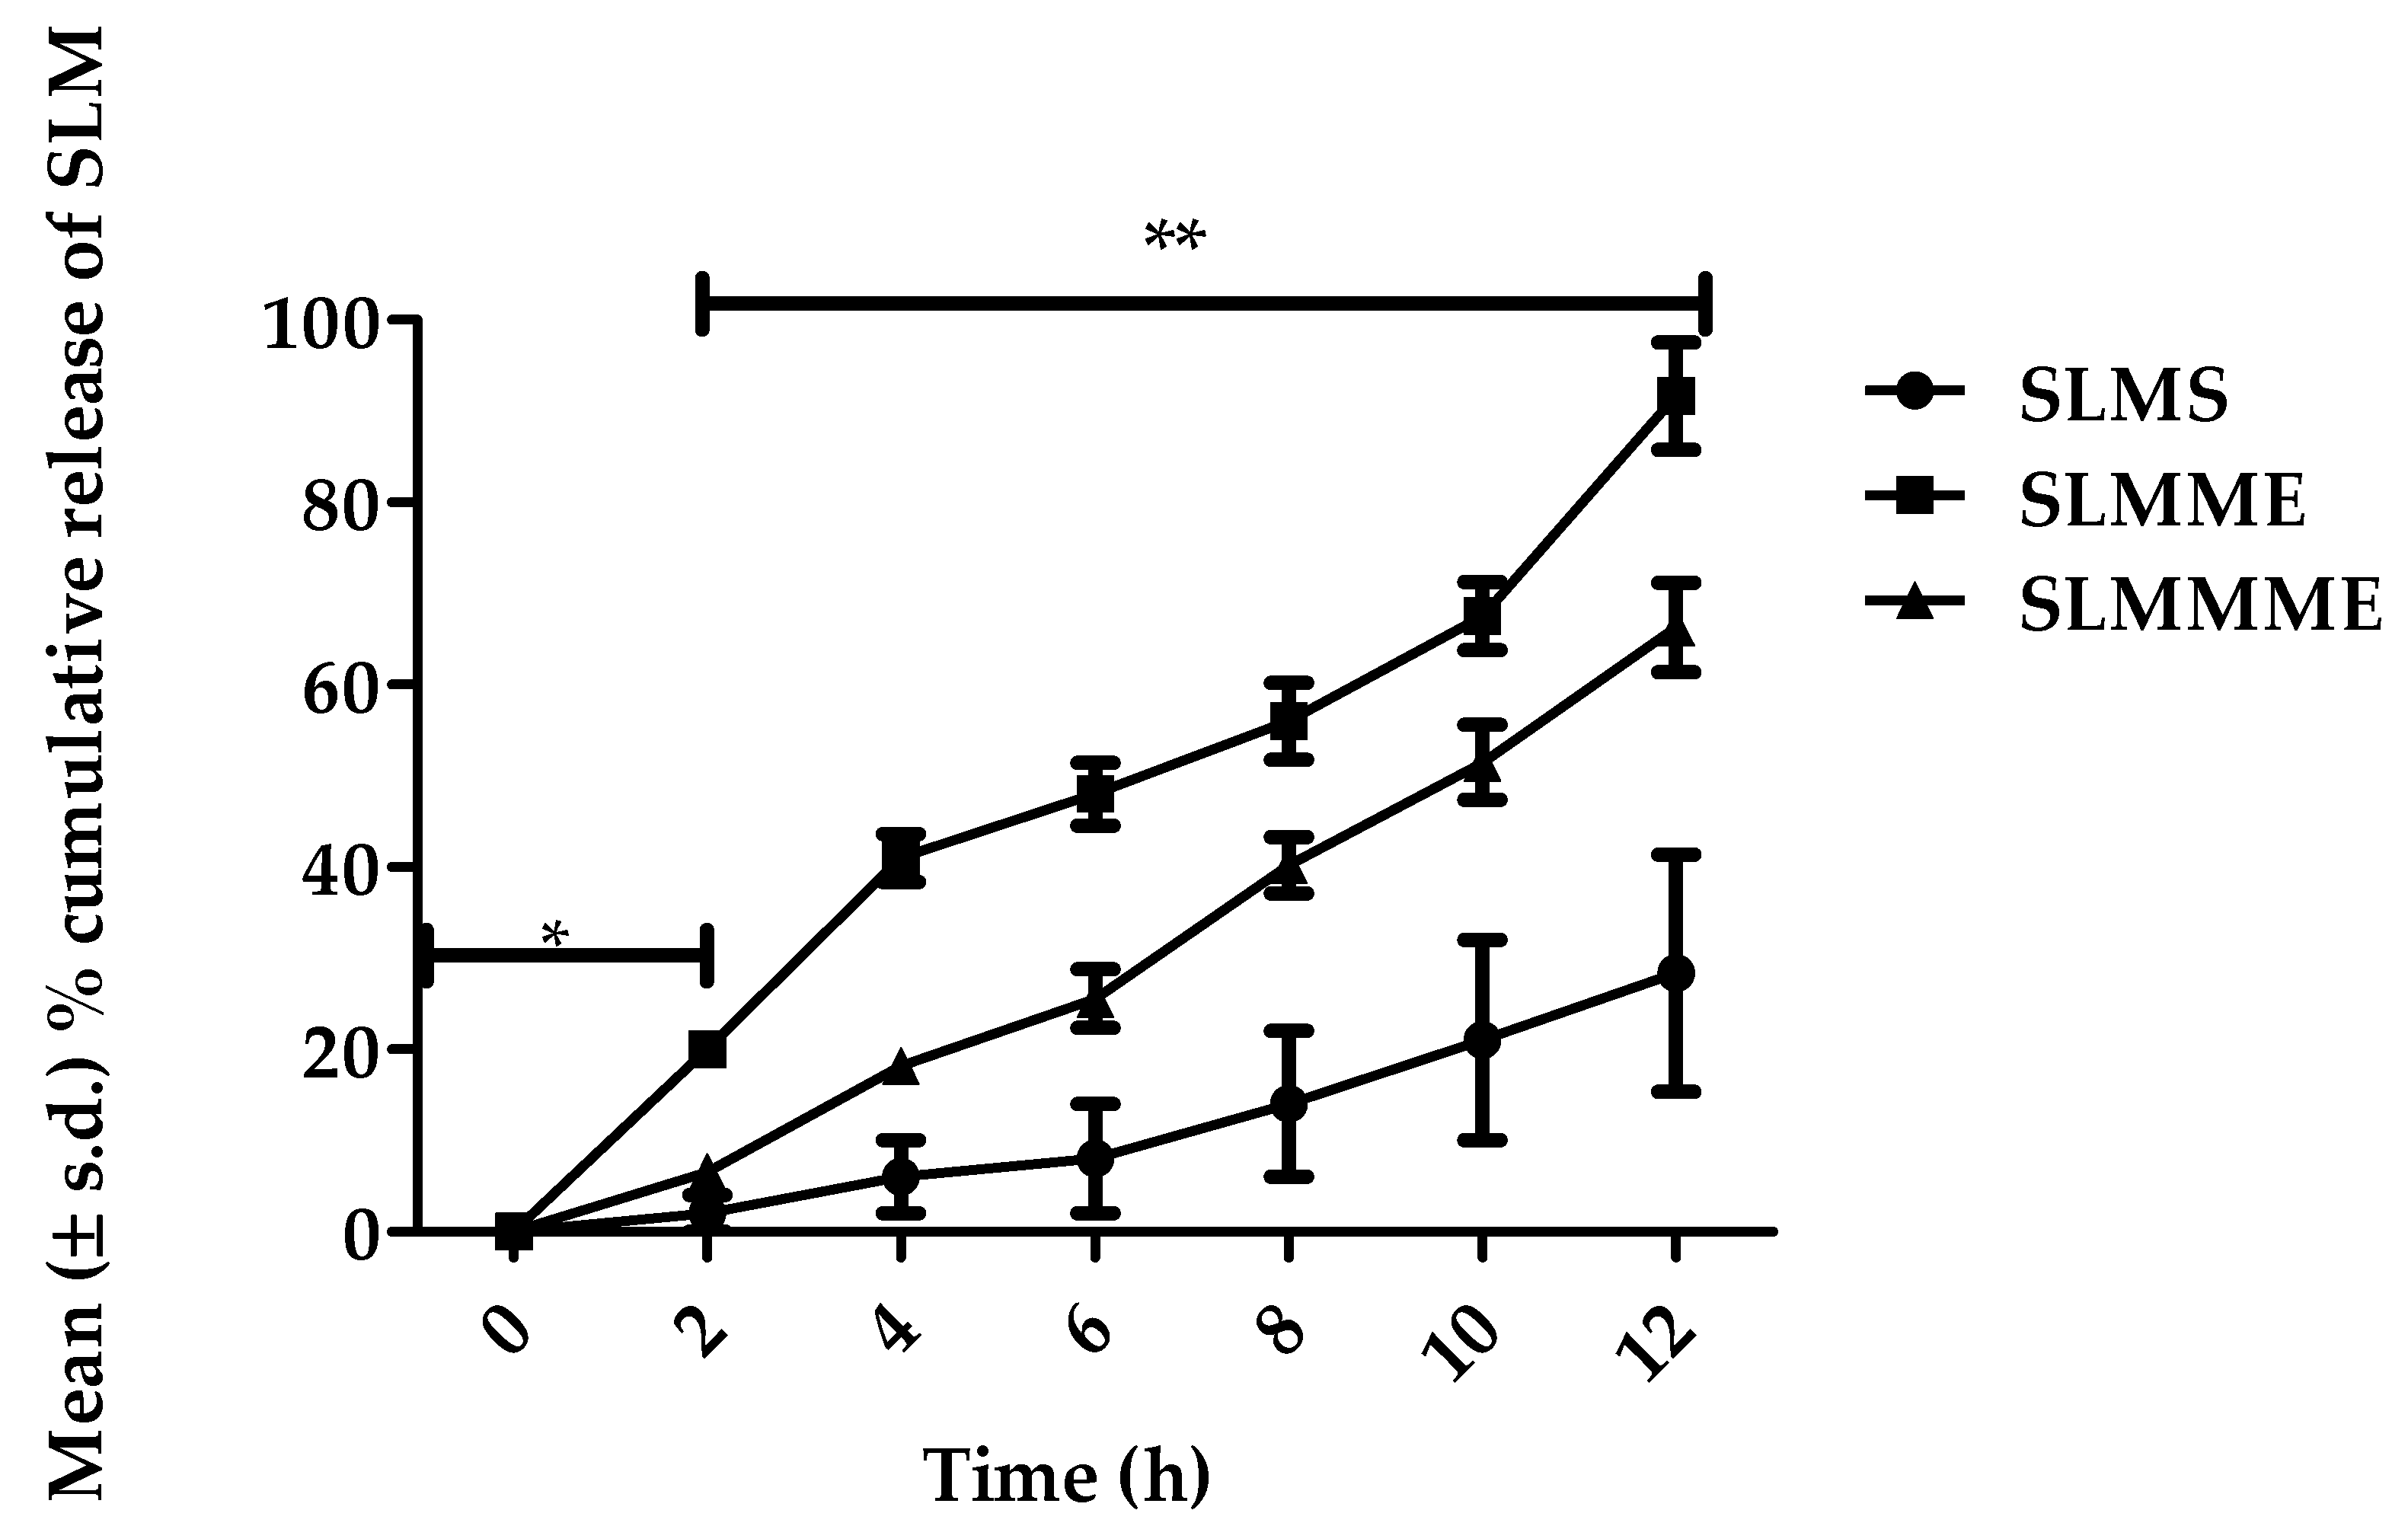
Figure 8.
In vitro release profile for SLMME, SLMMME, and SLM drug solutions (SLMCS); * resembles the release profile of SLM in simulated nasal fluid, and ** resembles the release profile of SLM in brain simulated fluid.
Figure 8.
In vitro release profile for SLMME, SLMMME, and SLM drug solutions (SLMCS); * resembles the release profile of SLM in simulated nasal fluid, and ** resembles the release profile of SLM in brain simulated fluid.
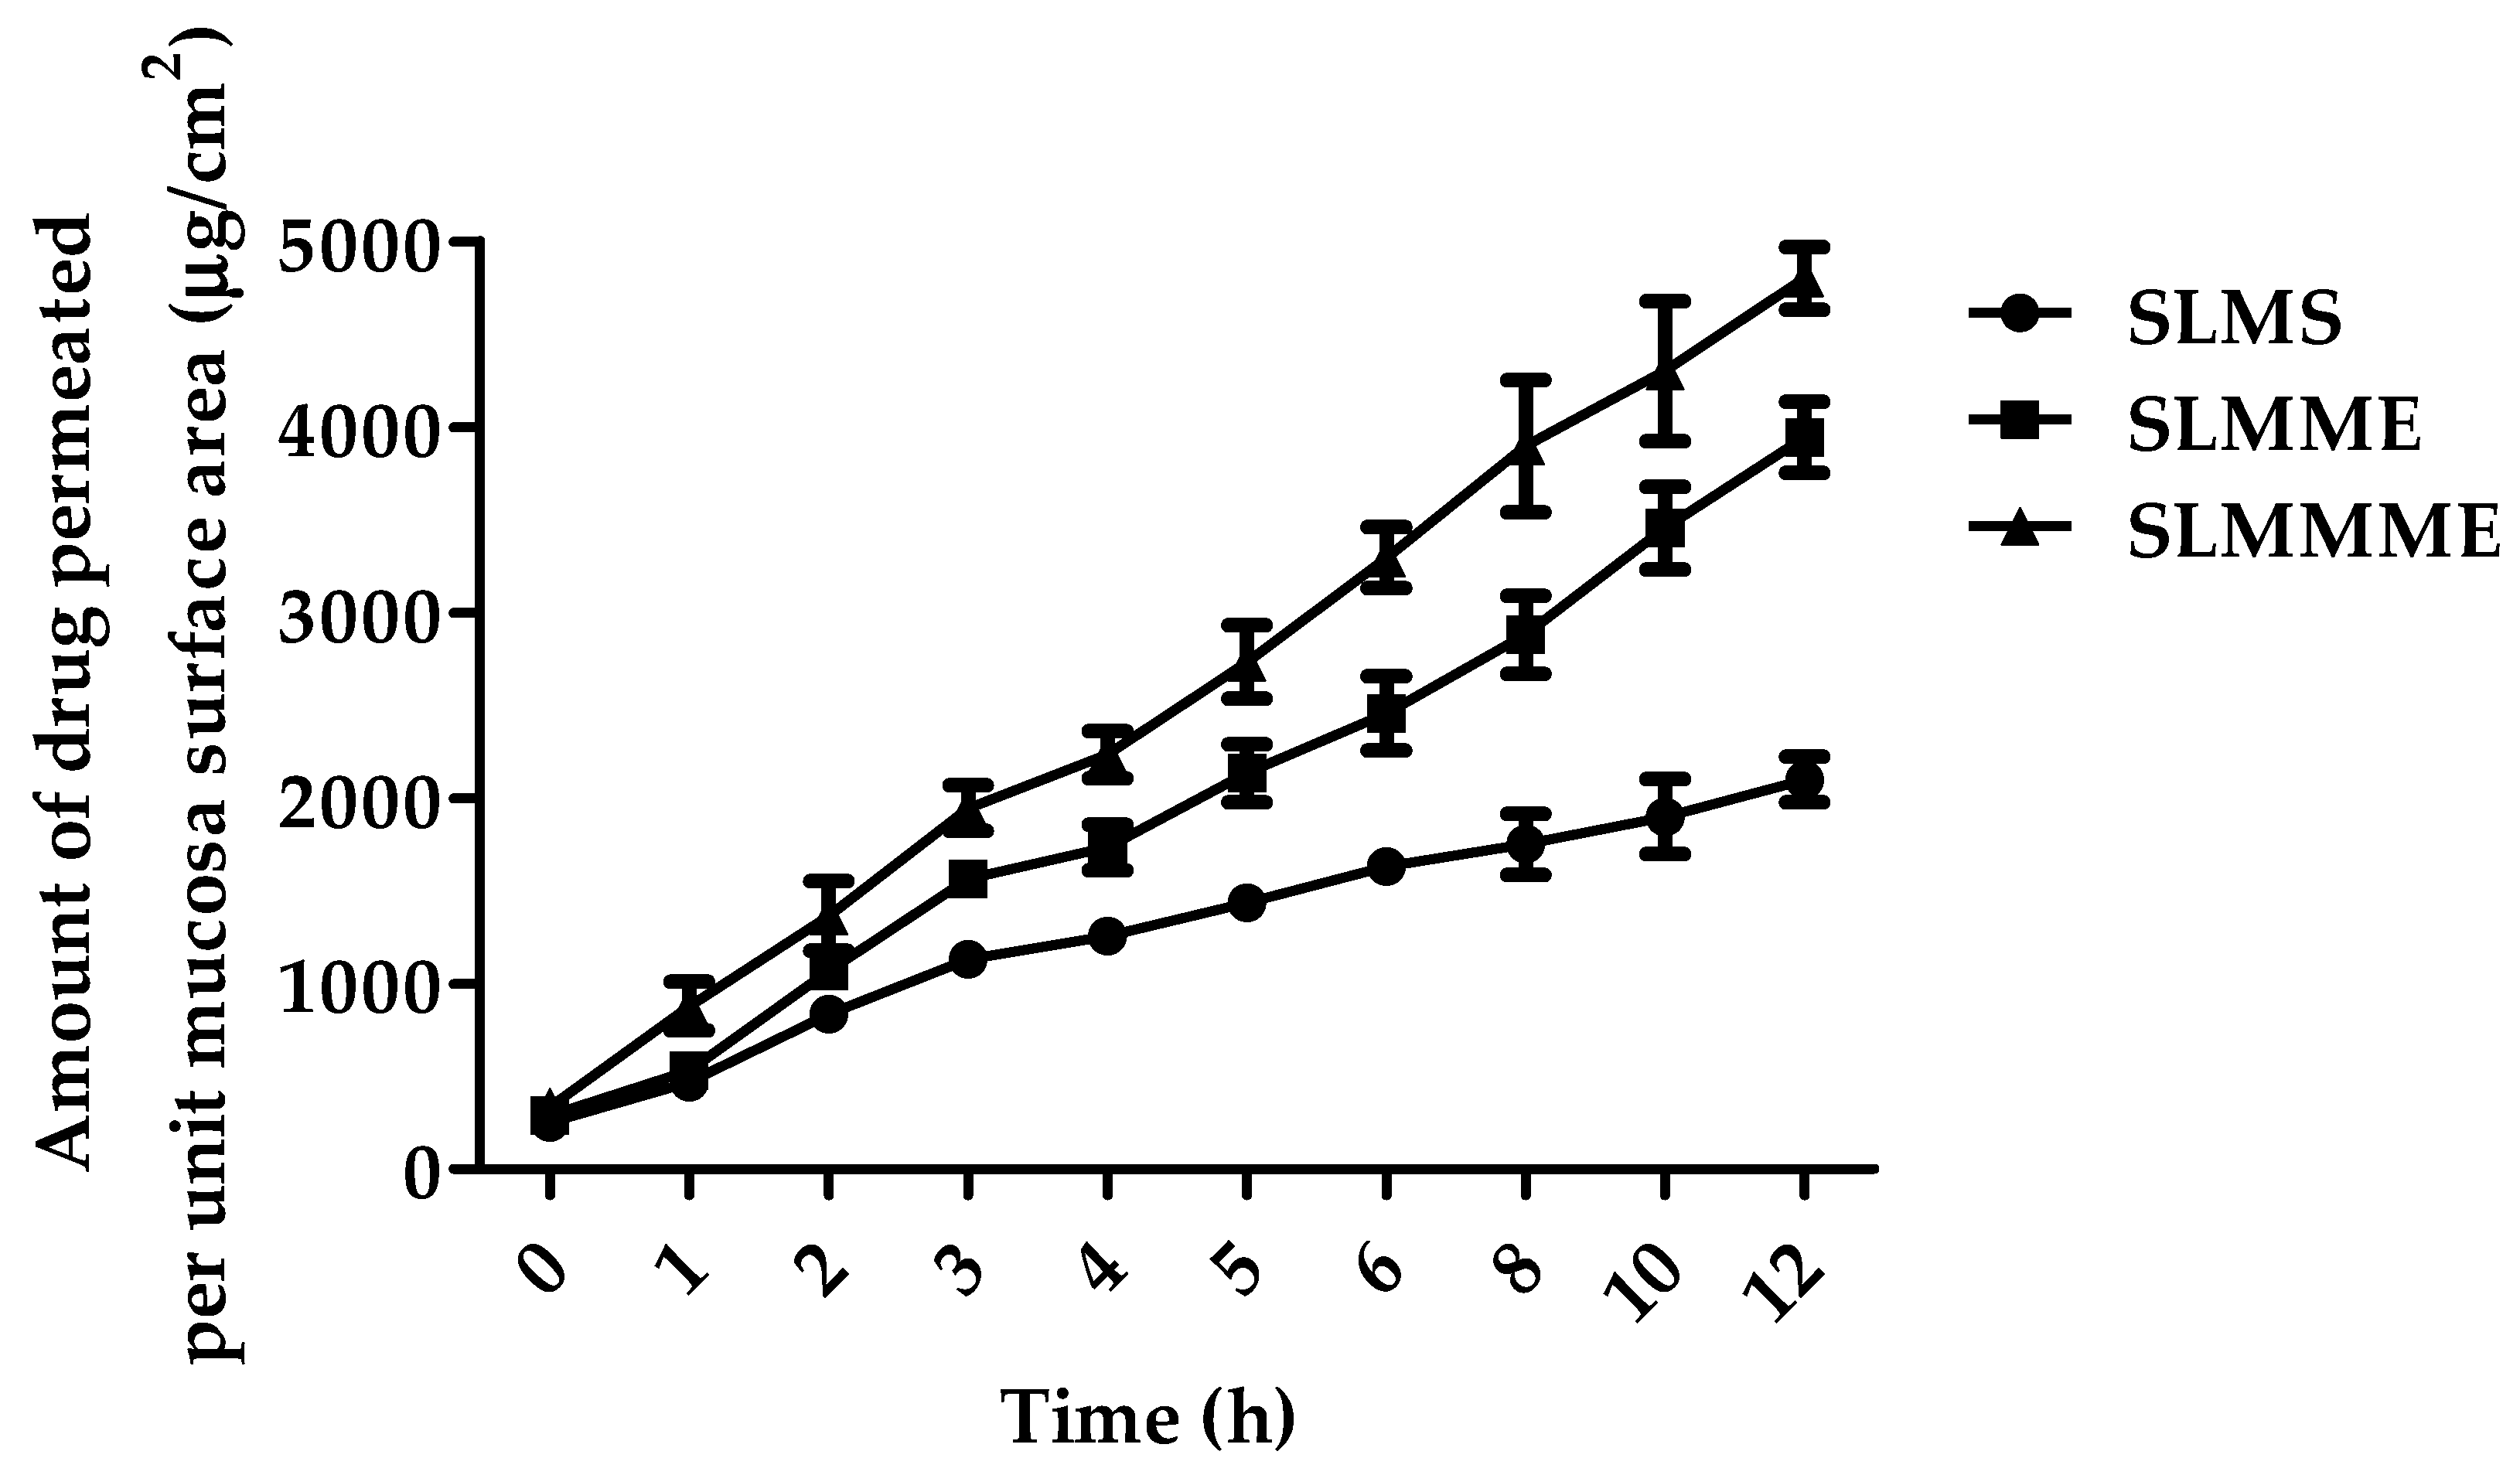
Figure 9.
Figure depicting the mean percentage of SLM diffused through sheep nasal mucosa from SLMS, SLMME, and SLMMME.
Figure 9.
Figure depicting the mean percentage of SLM diffused through sheep nasal mucosa from SLMS, SLMME, and SLMMME.
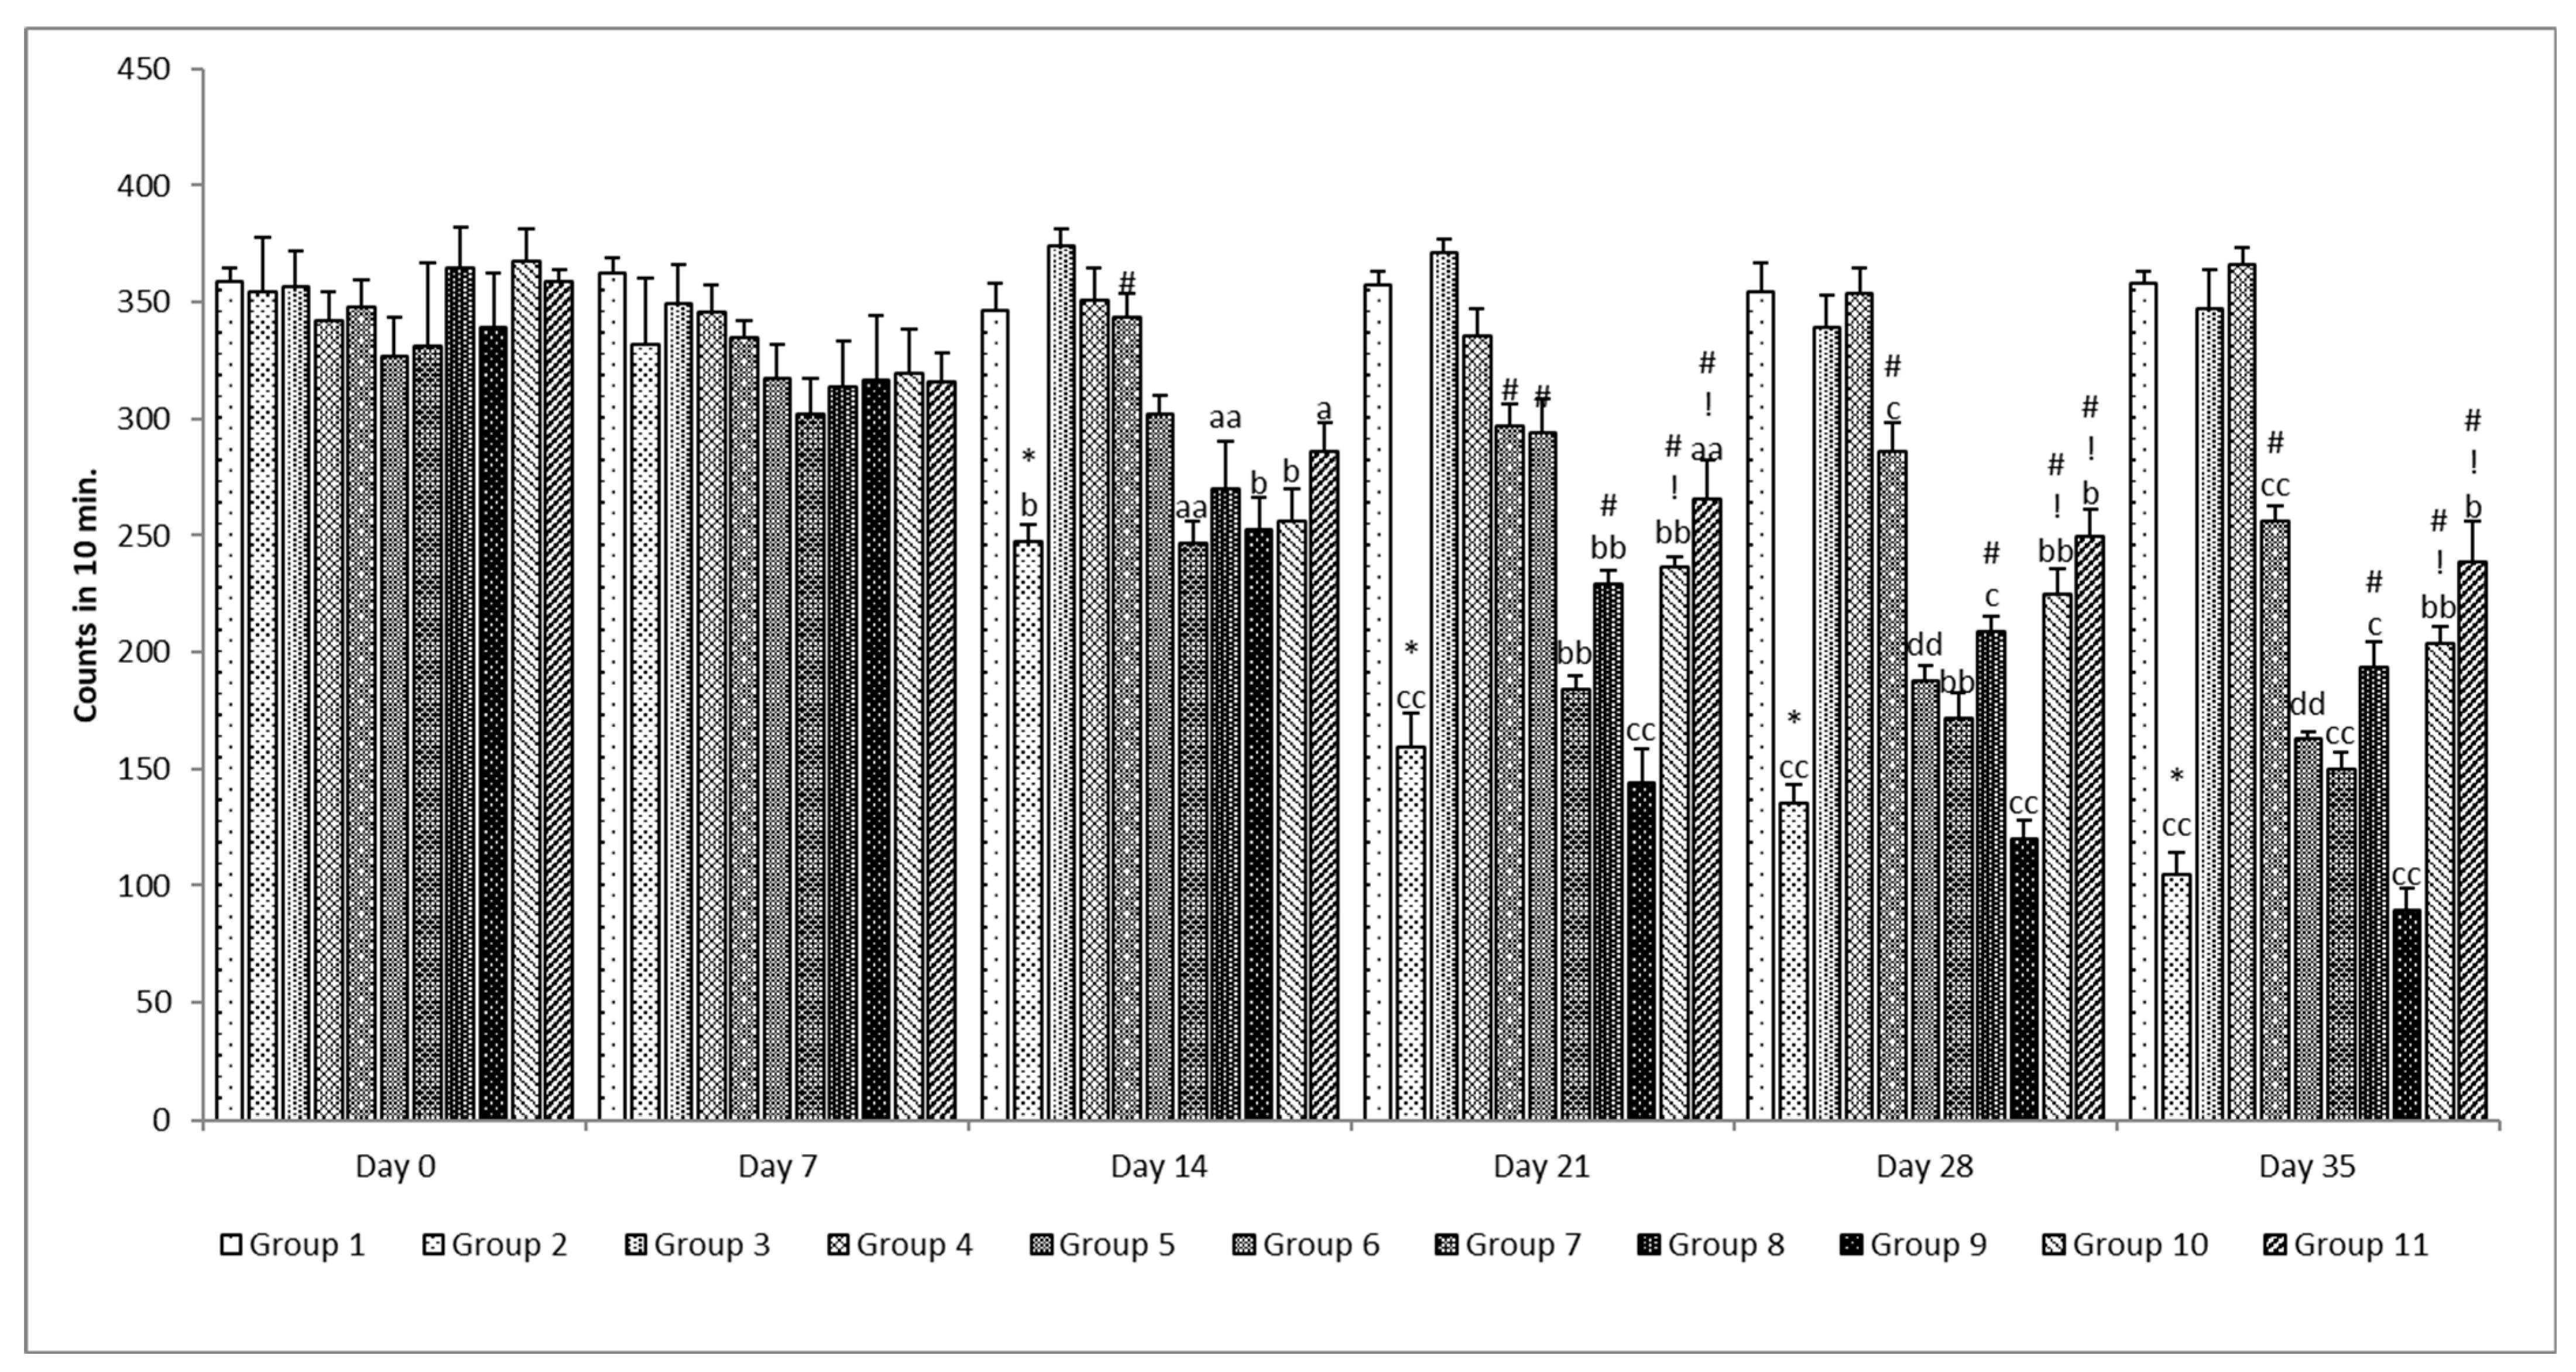
Figure 10.
Effect of various treatments on locomotor activity. Note, *, #, and ! represents p < 0.05 vs. group 1, 2, 5, 6, 7, 8, 9 and 10. a, b, c, aa, bb, cc and dd represent p < 0.05 and p < 0.001 vs. day 0, 7, 14, 21 and 28 respectively.
Figure 10.
Effect of various treatments on locomotor activity. Note, *, #, and ! represents p < 0.05 vs. group 1, 2, 5, 6, 7, 8, 9 and 10. a, b, c, aa, bb, cc and dd represent p < 0.05 and p < 0.001 vs. day 0, 7, 14, 21 and 28 respectively.
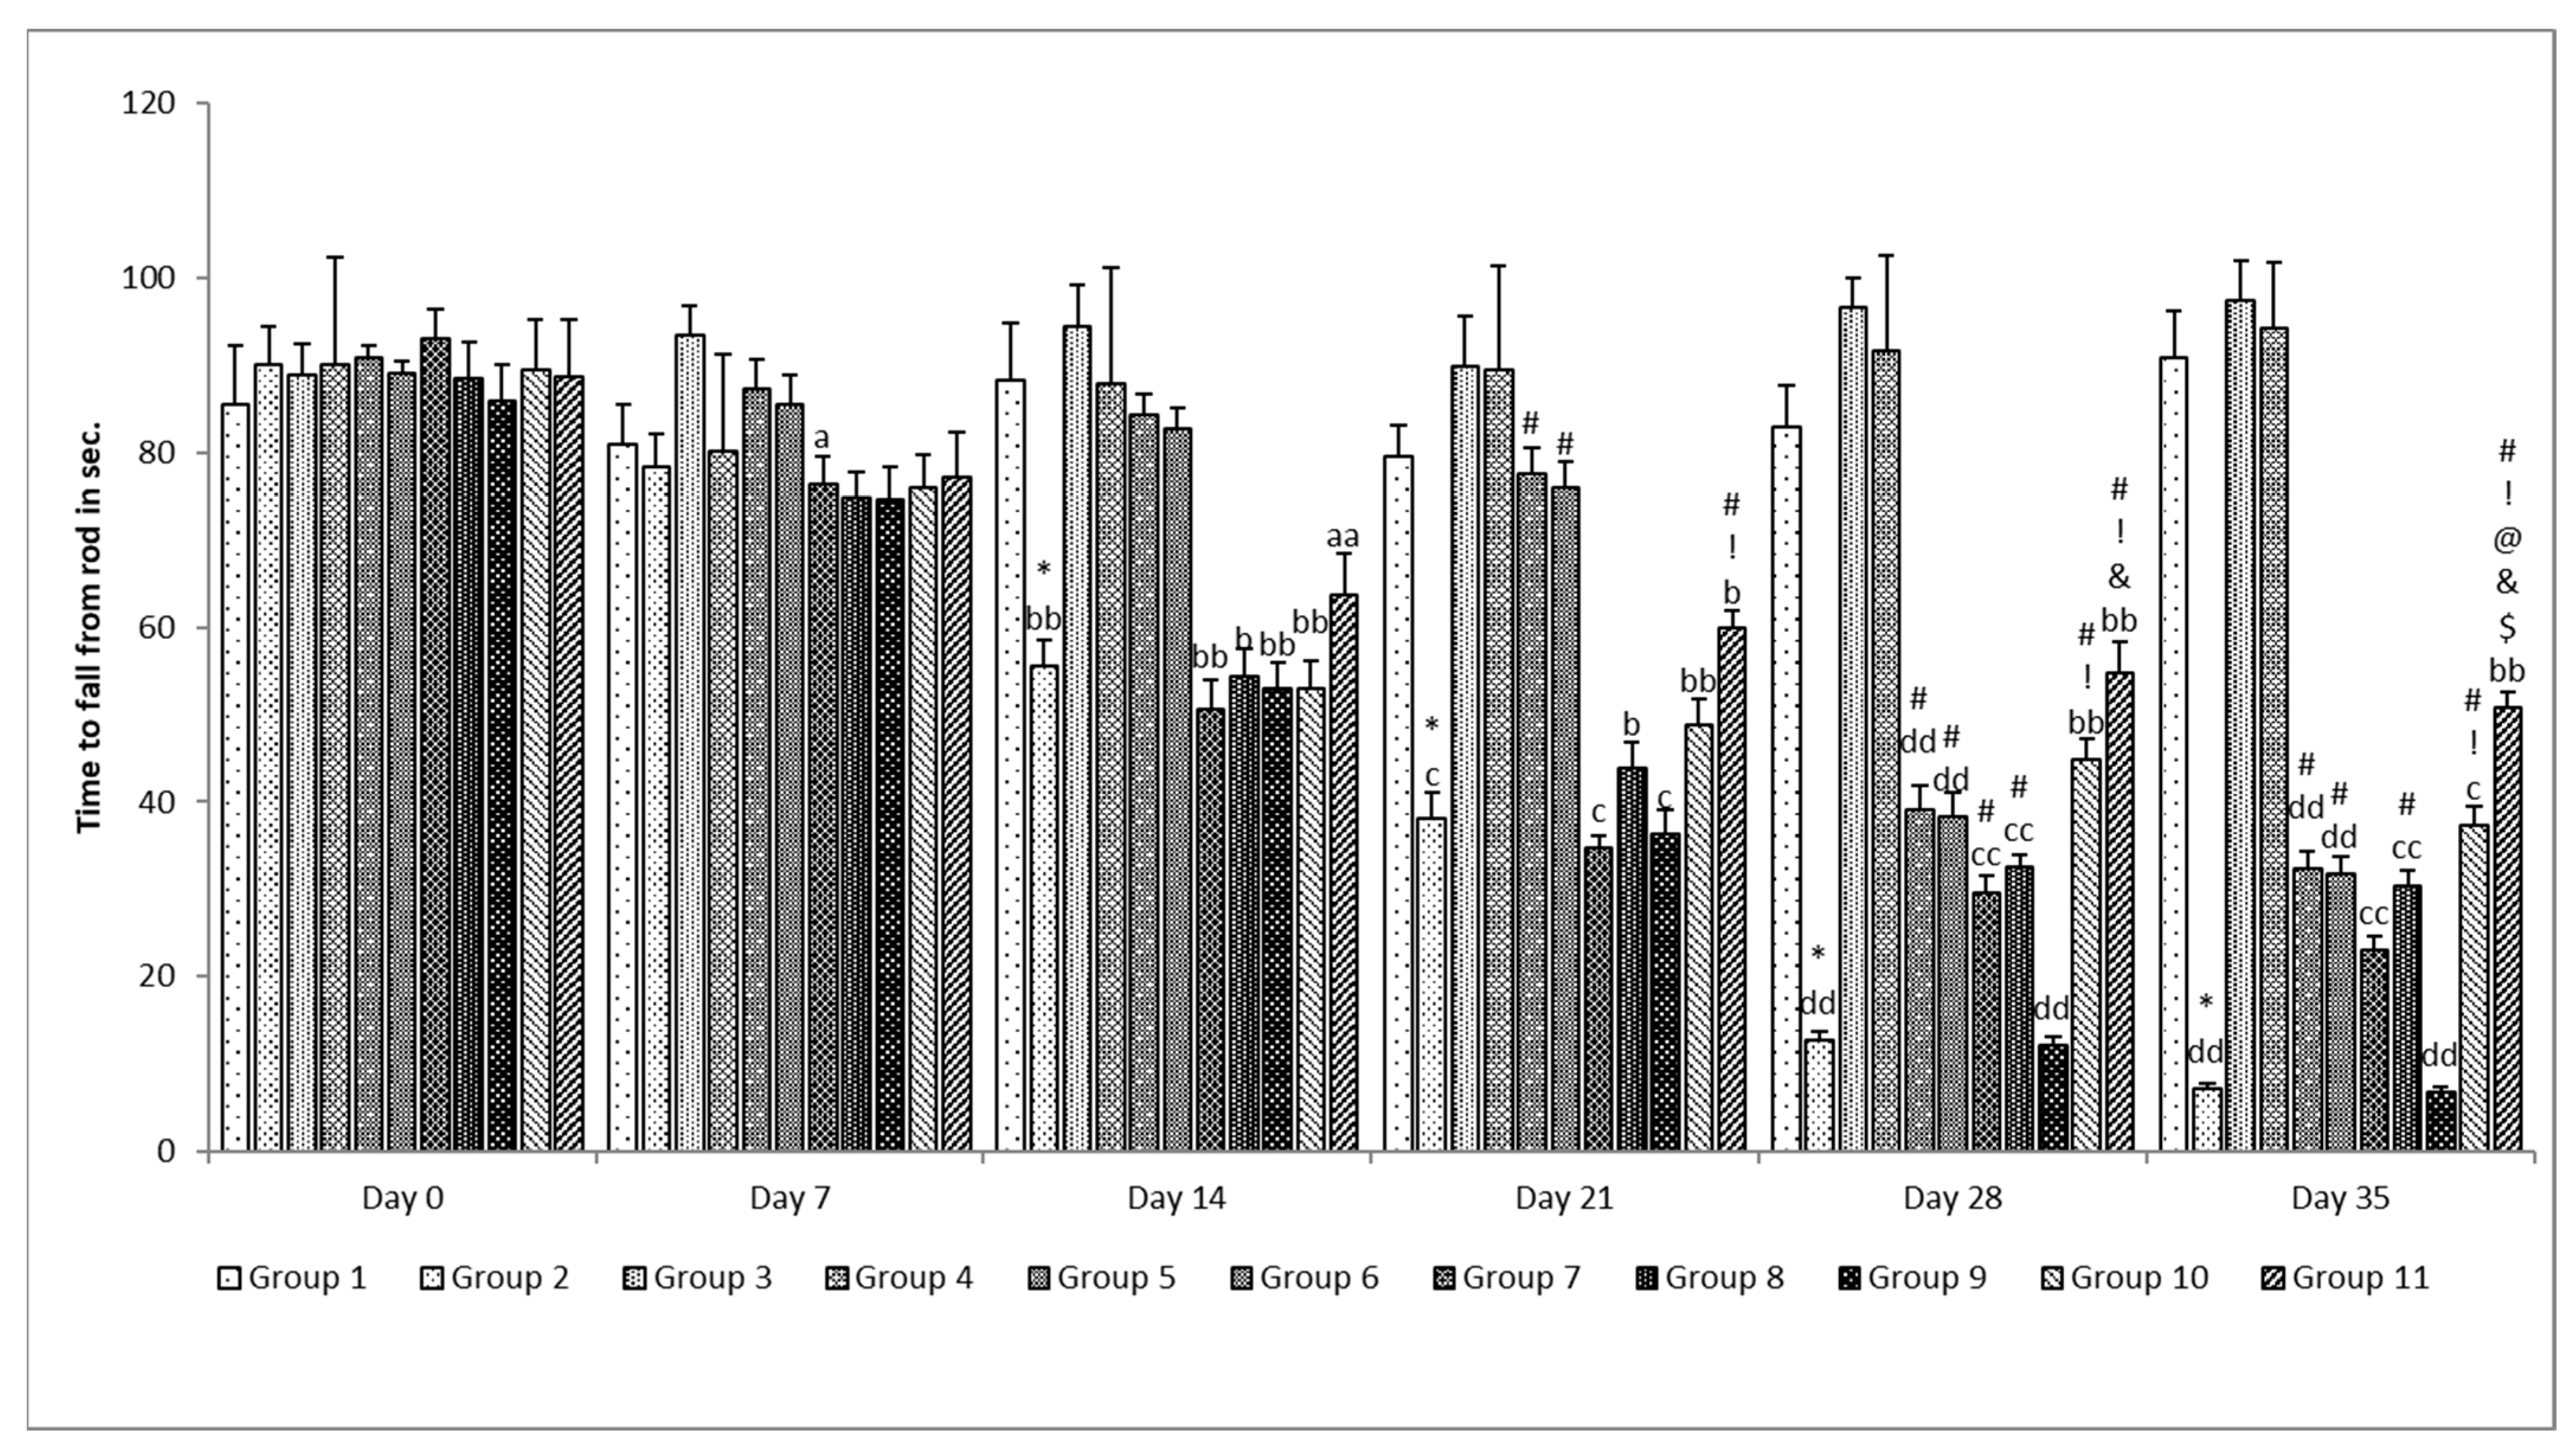
Figure 11.
Effect of various treatments on muscle coordination. Note, *, #, @, $, &, and ! represents p < 0.05 vs. group 1, 2, 5, 6, 7, 8, 9 and 10. a, b, c, d and aa, bb, cc and dd represent p < 0.05 and p < 0.001 vs. day 0, 7, 14, 21 and 28 respectively.
Figure 11.
Effect of various treatments on muscle coordination. Note, *, #, @, $, &, and ! represents p < 0.05 vs. group 1, 2, 5, 6, 7, 8, 9 and 10. a, b, c, d and aa, bb, cc and dd represent p < 0.05 and p < 0.001 vs. day 0, 7, 14, 21 and 28 respectively.
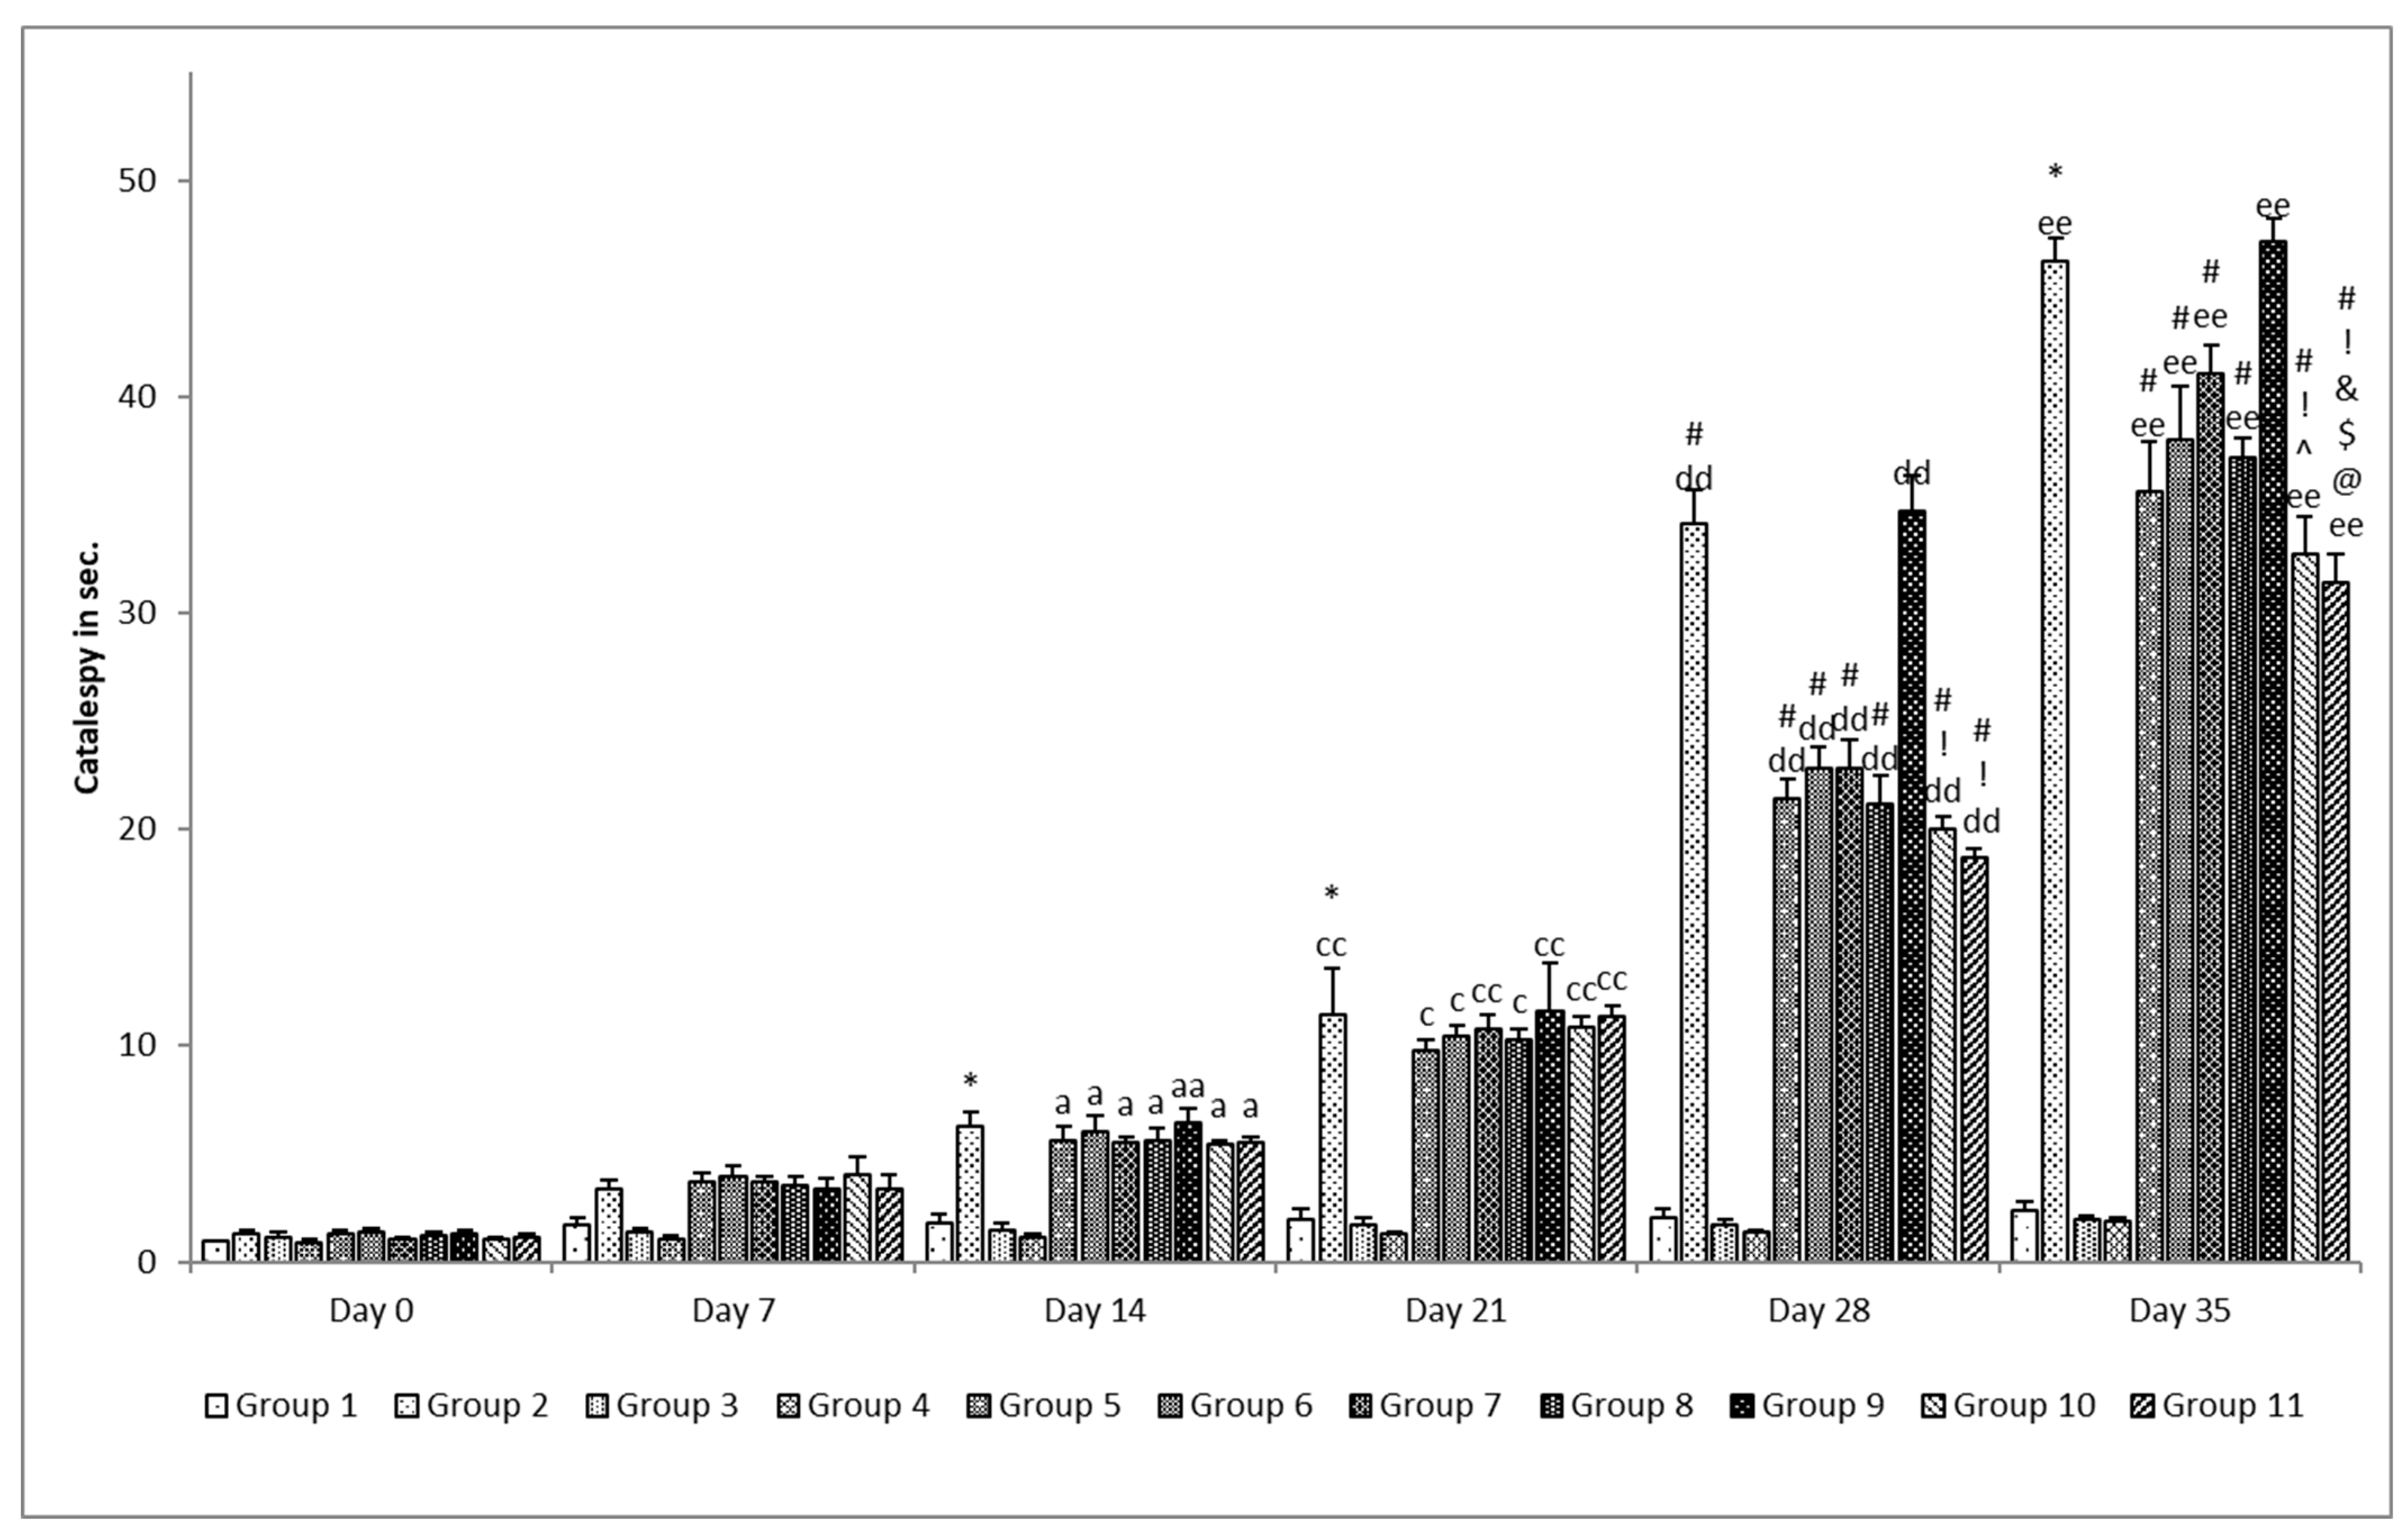
Figure 12.
Effect of various treatments on catalepsy in rats. Note, *, #, @, $, ^, &, and ! represents p < 0.05 vs. group 1, 2, 5, 6, 7, 8, 9 and 10. a, e and aa, cc, dd and ee represents p < 0.05 and p < 0.001 vs. day 0, 7, 14, 21 and 28 respectively.
Figure 12.
Effect of various treatments on catalepsy in rats. Note, *, #, @, $, ^, &, and ! represents p < 0.05 vs. group 1, 2, 5, 6, 7, 8, 9 and 10. a, e and aa, cc, dd and ee represents p < 0.05 and p < 0.001 vs. day 0, 7, 14, 21 and 28 respectively.
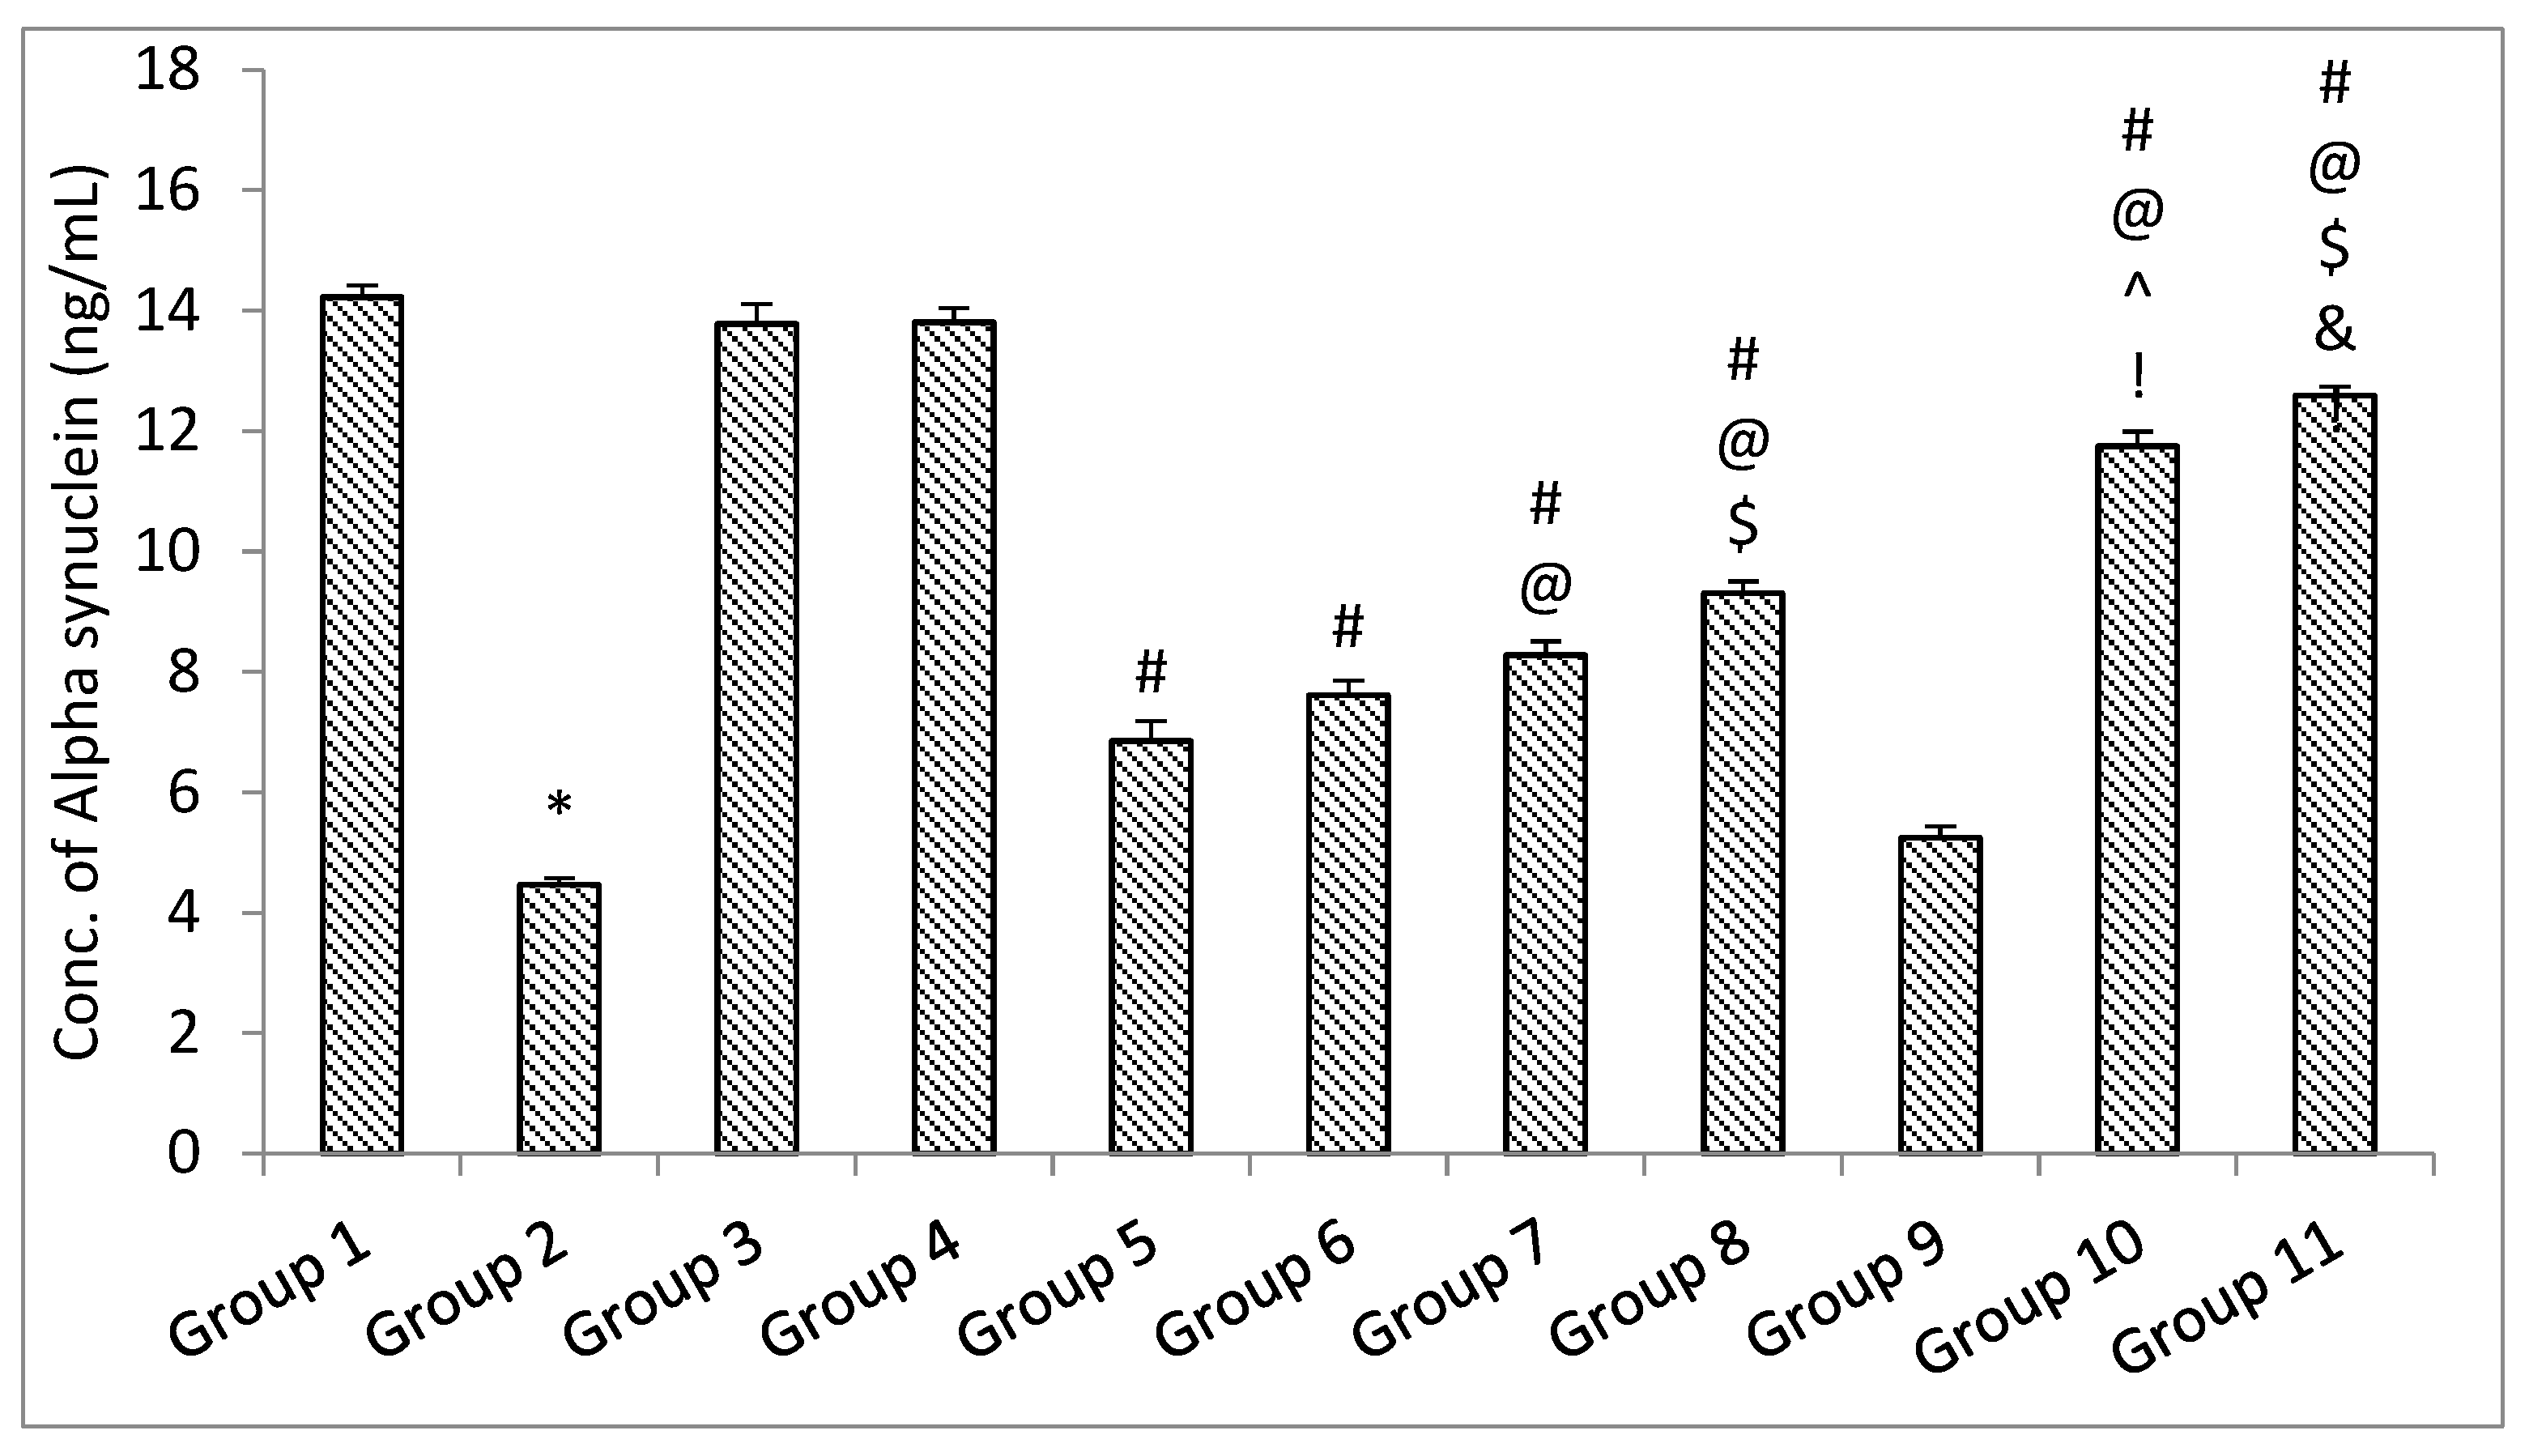
Figure 13.
The impact of different treatments on Alfa Synuclein. Data represented as mean ± S.E.M. Note: Data represented as mean ± S.E.M. *, #, @, $, ^, & and ! represent p < 0.05 vs. group 1, 2, 5, 6, 7, 8, 9 and 10 respectively.
Figure 13.
The impact of different treatments on Alfa Synuclein. Data represented as mean ± S.E.M. Note: Data represented as mean ± S.E.M. *, #, @, $, ^, & and ! represent p < 0.05 vs. group 1, 2, 5, 6, 7, 8, 9 and 10 respectively.
Figure 14.
The impact of different treatments on brain-derived neurotropic factor (BDNF). Data represented as mean ± S.E.M. Note: Data represented as mean ± S.E.M. *, #, @, $, ^, &, ! and λ represent p < 0.05 vs. group 1, 2, 5, 6, 7, 8, 9 and 10 respectively.
Figure 14.
The impact of different treatments on brain-derived neurotropic factor (BDNF). Data represented as mean ± S.E.M. Note: Data represented as mean ± S.E.M. *, #, @, $, ^, &, ! and λ represent p < 0.05 vs. group 1, 2, 5, 6, 7, 8, 9 and 10 respectively.
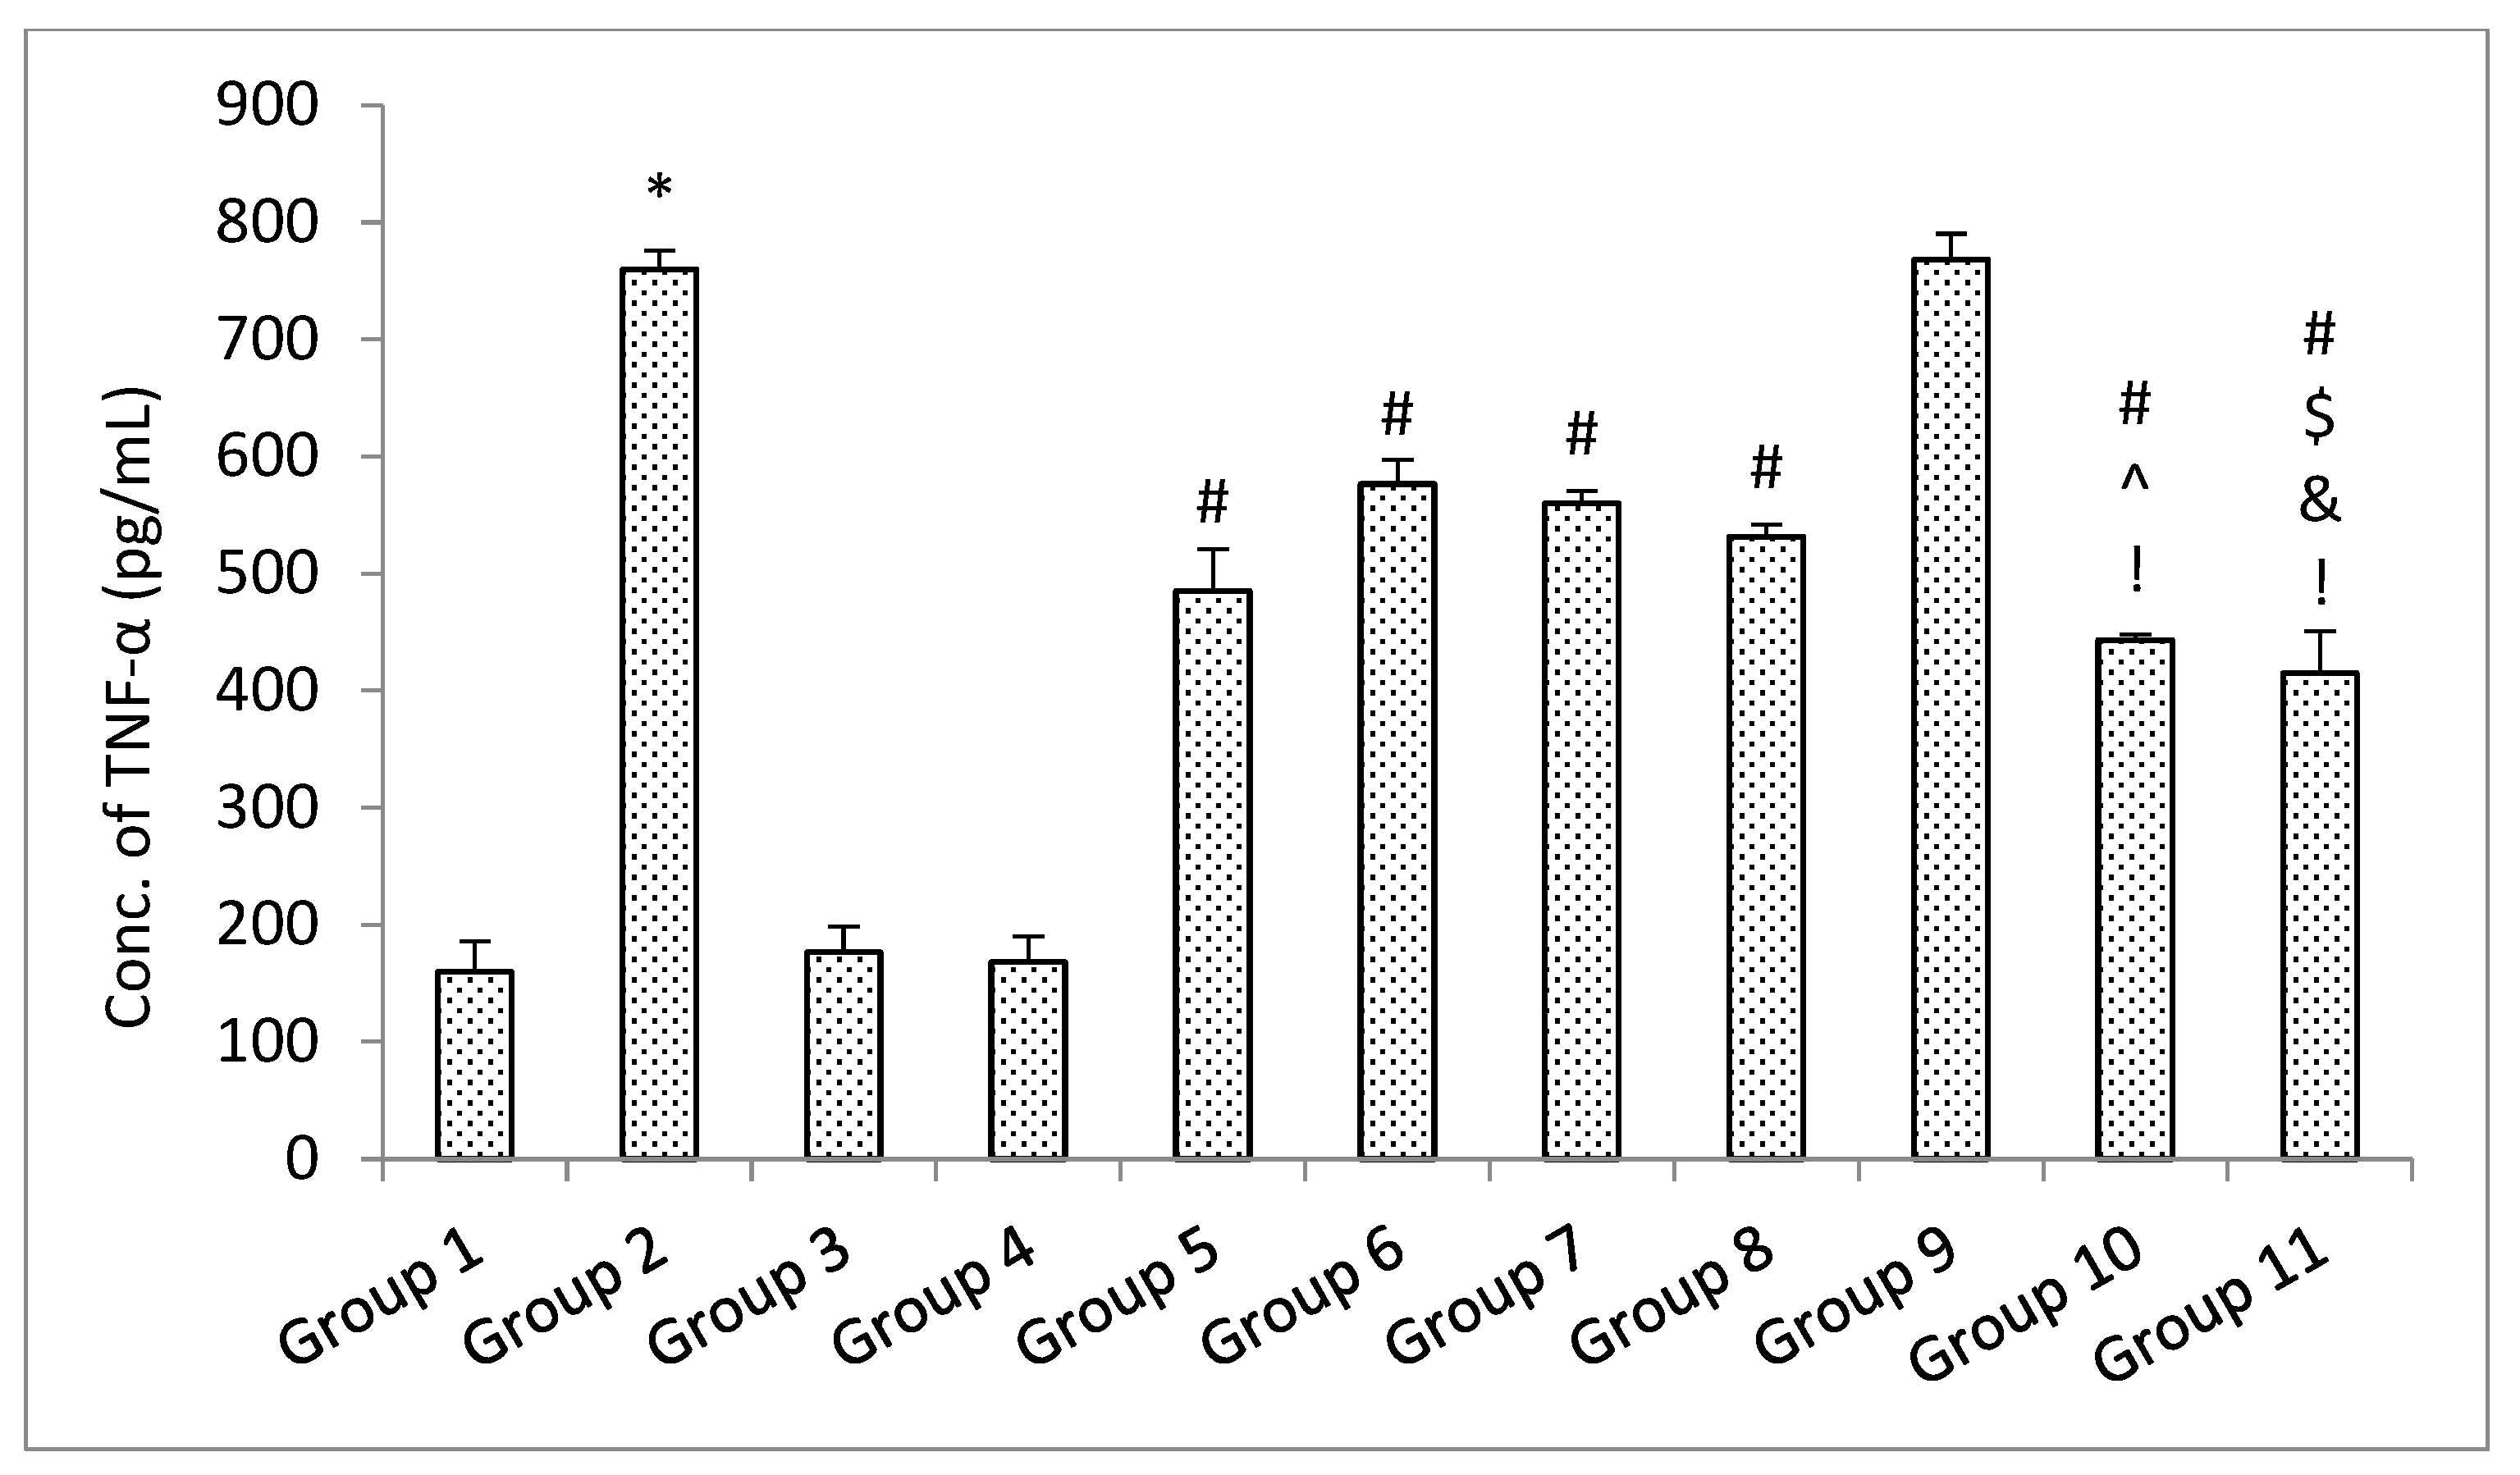
Figure 15.
The impact of different treatments on TNF-α. Data represented as mean ± S.E.M. Data represented as mean ± S.E.M. Note: Data represented as mean ± S.E.M. *, #, $, ^, &, and ! represent p < 0.05 vs. group 1, 2, 5, 6, 7, 8, 9 and 10 respectively.
Figure 15.
The impact of different treatments on TNF-α. Data represented as mean ± S.E.M. Data represented as mean ± S.E.M. Note: Data represented as mean ± S.E.M. *, #, $, ^, &, and ! represent p < 0.05 vs. group 1, 2, 5, 6, 7, 8, 9 and 10 respectively.
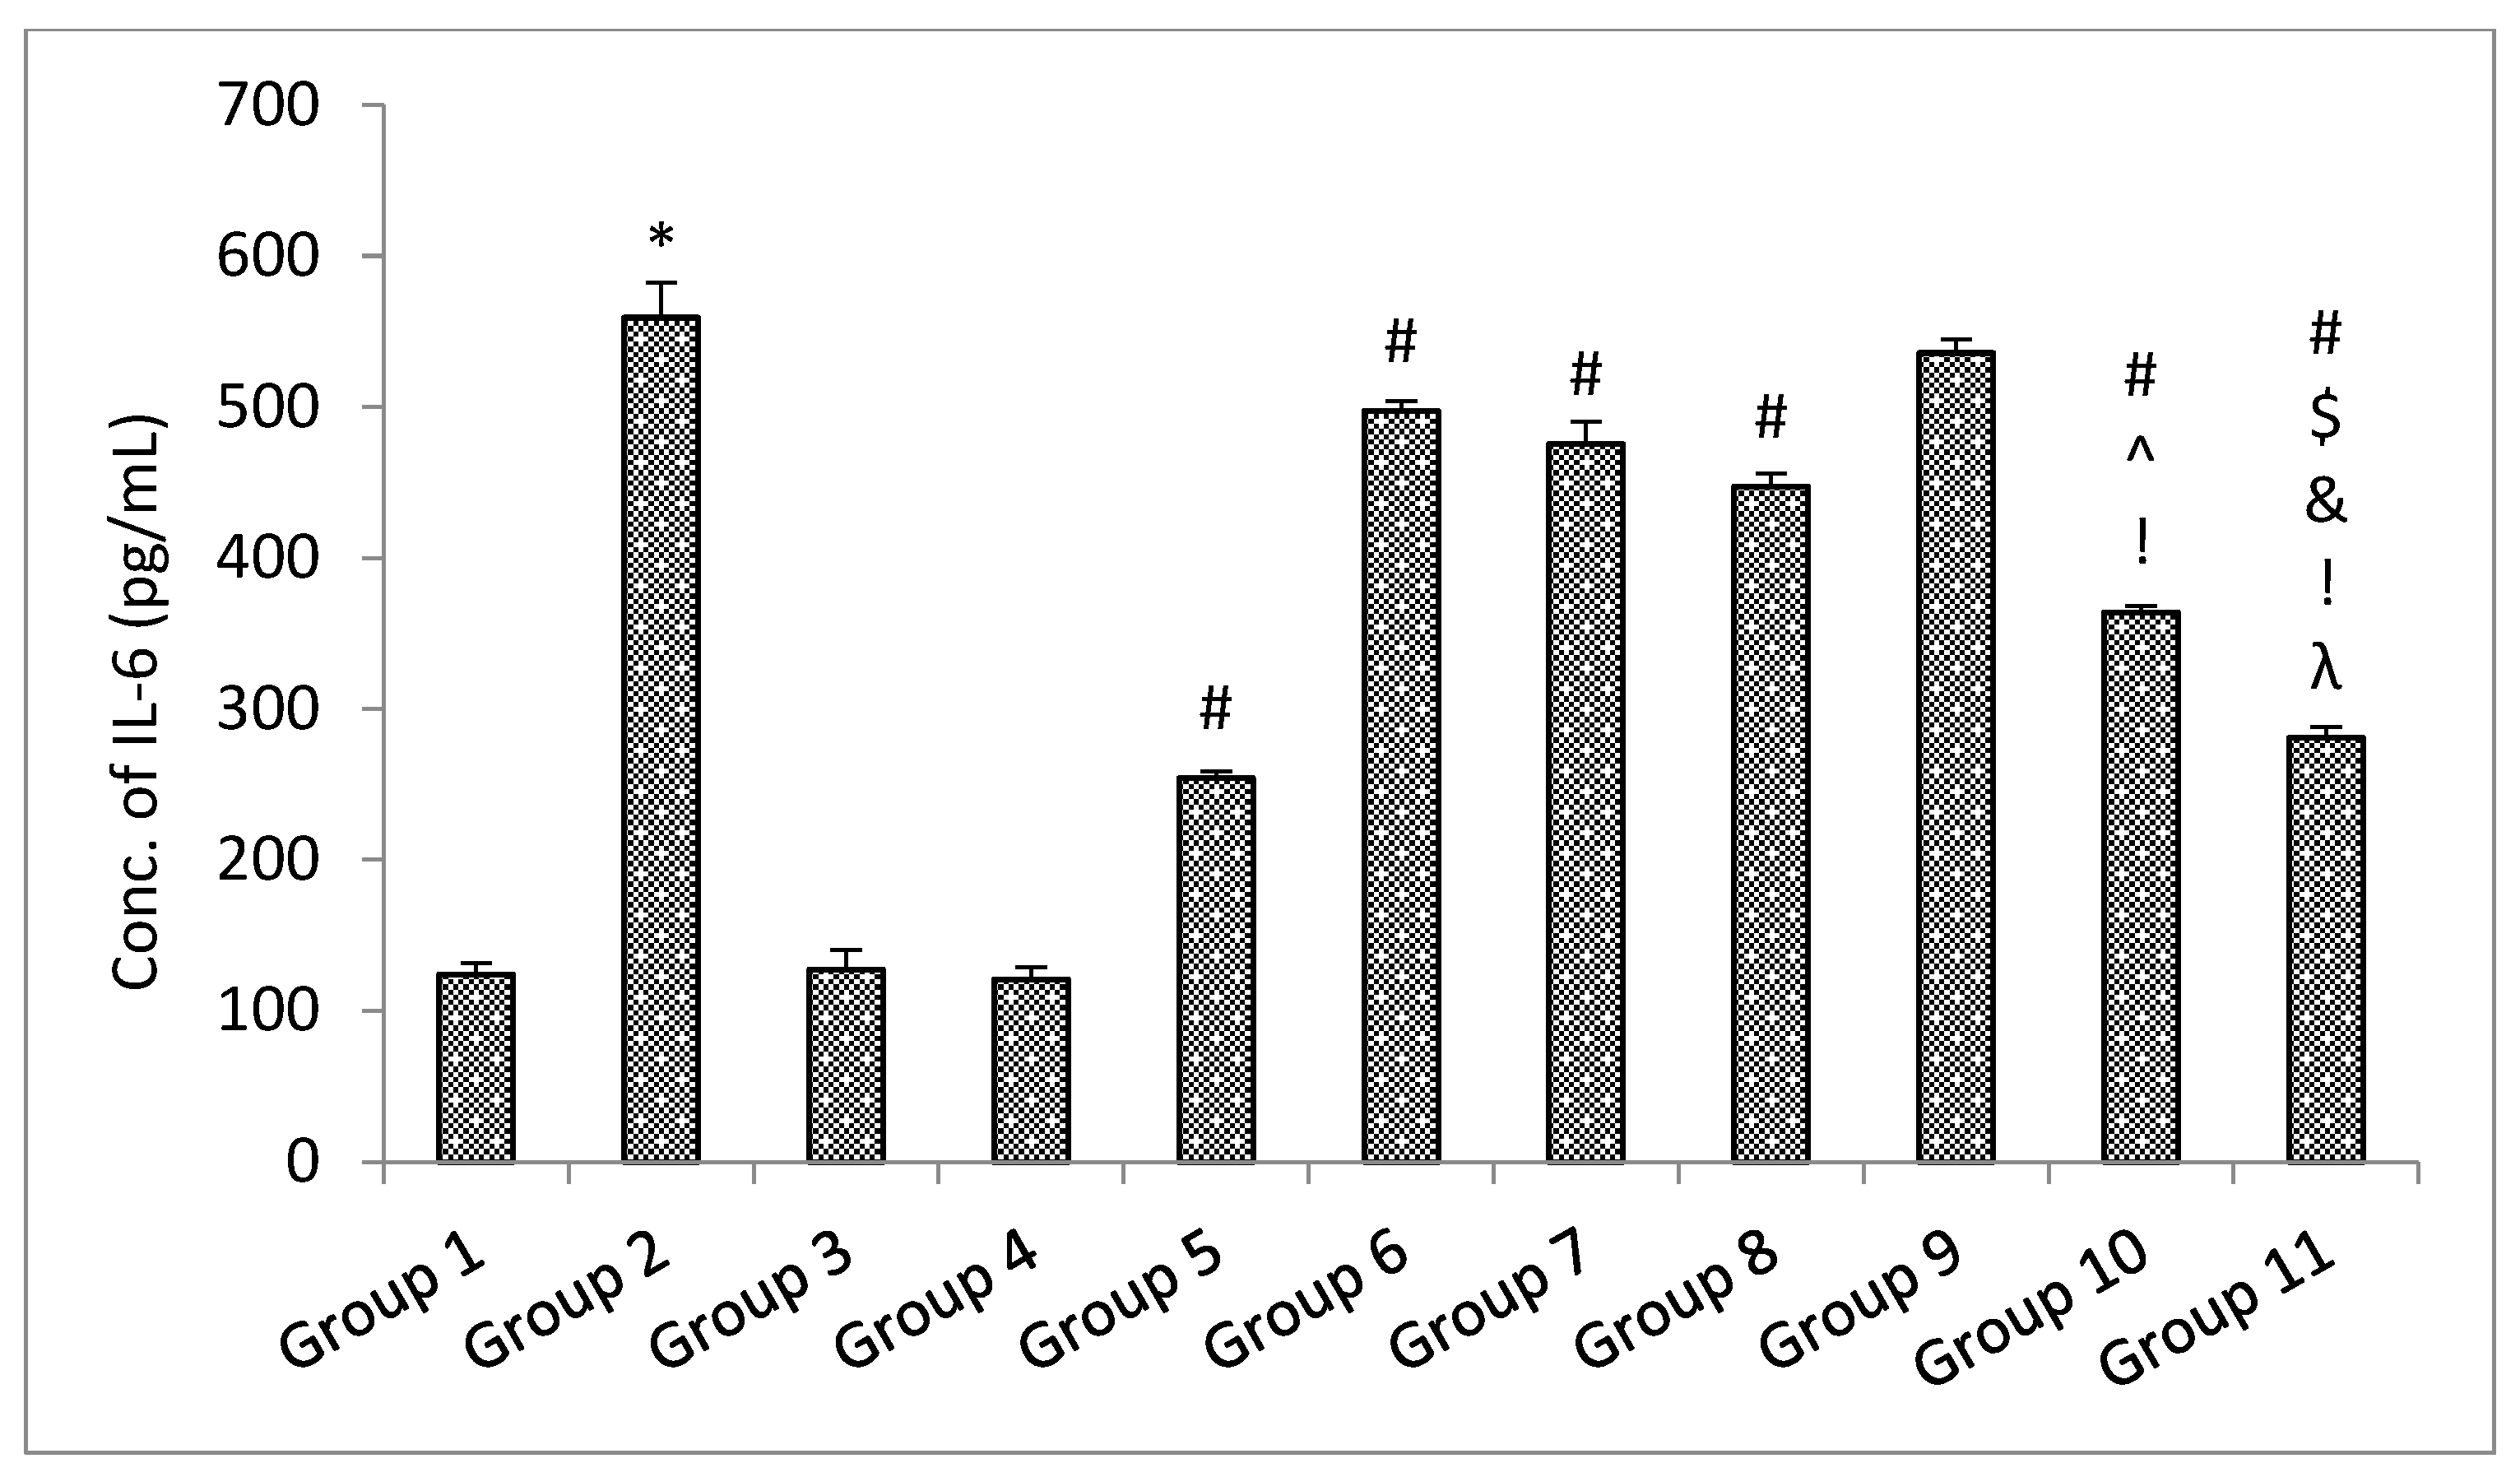
Figure 16.
The impact of different treatments on IL-6. Data represented as mean ± S.E.M. Note: Data represented as mean ± S.E.M. *, #, $, ^, &, ! and λ represent p < 0.05 vs. group 1, 2, 5, 6, 7, 8, 9 and 10 respectively.
Figure 16.
The impact of different treatments on IL-6. Data represented as mean ± S.E.M. Note: Data represented as mean ± S.E.M. *, #, $, ^, &, ! and λ represent p < 0.05 vs. group 1, 2, 5, 6, 7, 8, 9 and 10 respectively.
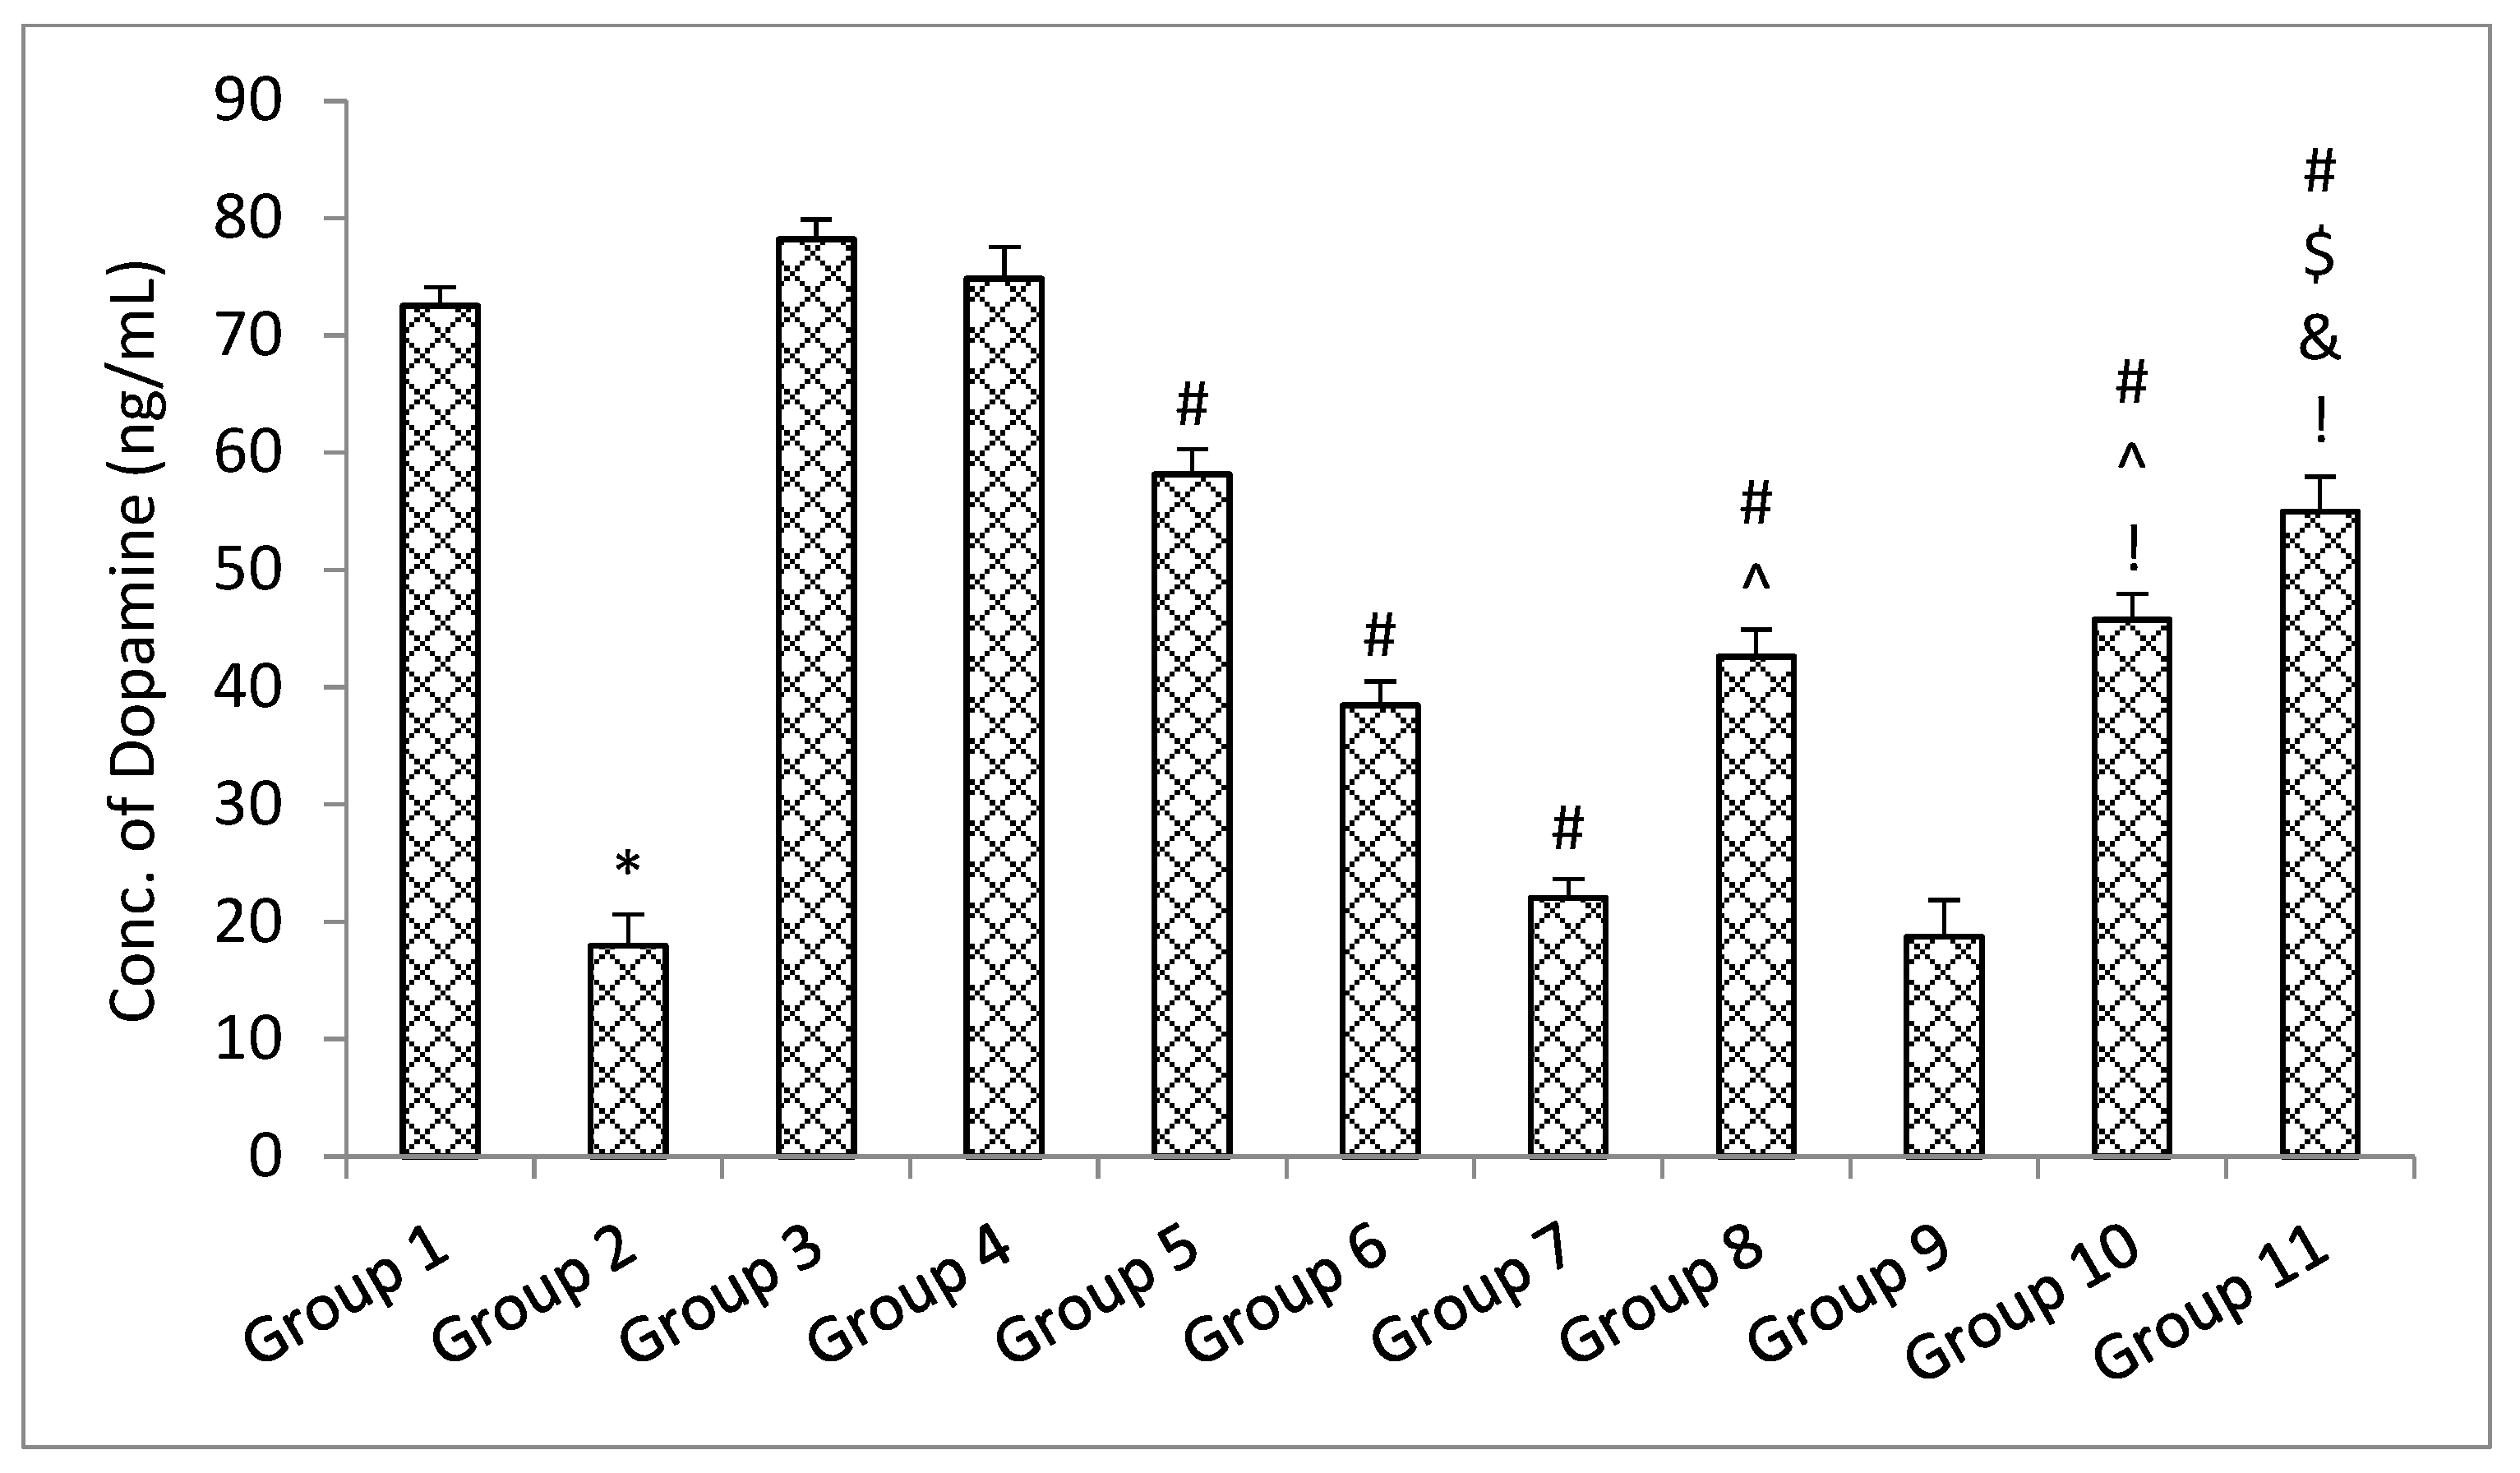
Figure 17.
The impact of different treatments on a dopamine. Data represented as mean ± S.E.M. Data represented as mean ± S.E.M. *, #, $, ^, & and ! represent p < 0.05 vs. group 1, 2, 5, 6, 7, 8, 9 and 10 respectively.
Figure 17.
The impact of different treatments on a dopamine. Data represented as mean ± S.E.M. Data represented as mean ± S.E.M. *, #, $, ^, & and ! represent p < 0.05 vs. group 1, 2, 5, 6, 7, 8, 9 and 10 respectively.
Table 1.
Details of formulation and process variables for optimizing microemulsion.
Table 1.
Details of formulation and process variables for optimizing microemulsion.
| Independent Factors | | |
|---|
| Uncoded (%v/v,) | Coded | Uncoded |
| LMCS (Oil phase) | A | 10–30 |
| T80 (Surfactant) | B | 15–35 |
| TP (Co-surfactant) | C | 10–20 |
| Water (Dispersion medium) | D | 30–70 |
Table 2.
Protocol of pharmacodynamics’ study.
Table 2.
Protocol of pharmacodynamics’ study.
| Groups. | Intervention |
|---|
| Group 1 | Control group (mixture of sunflower oil and normal saline) |
| Group 2 | Rotenone alone (disease group) |
| Group 3 | Standard drugs (Levodopa and Carbidopa) |
| Group 4 | Silymarin high dose alone |
| Group 5 | Rotenone + Standard drugs |
| Group 6 | Rotenone + Silymarin HD |
| Group 7 | Rotenone + Silymarin microemulsion (SLMME) LD |
| Group 8 | Rotenone + Silymarin microemulsion (SLMME) HD |
| Group 9 | Rotenone + Placebo mucoadhesive microemulsion |
| Group 10 | Rotenone + Silymarin mucoadhesive microemulsion (SLMMME) LD |
| Group 11 | Rotenone + Silymarin mucoadhesive microemulsion (SLMMME) HD |
Table 3.
CCD-guided factors, and their levels, affecting responses for optimization of microemulsion.
Table 3.
CCD-guided factors, and their levels, affecting responses for optimization of microemulsion.
| Run | Factor 1: Labrafil M 1944CS (%v/v,) | Factor 2: Tween 80 (%v/v,) | Factor 3: Transcutol P (%v/v,) | Factor 4: Water (%v/v,) | Y1: Droplet Size (nm) | Y2: Zeta Potential (mV) | Y3: Drug Loading (%) |
|---|
| 1 | 10.00 | 15 | 20.00 | 30.00 | 99.24 | −29.7 | 97.99 |
| 2 | 30.00 | 15 | 20.00 | 70.00 | 74.53 | −41.8 | 99.01 |
| 3 | 20.00 | 25 | 6.59 | 50.00 | 69.09 | −18.4 | 84.01 |
| 4 | 20.00 | 25 | 15.00 | 50.00 | 73.70 | −15.91 | 65.02 |
| 5 | 30.00 | 15 | 10.00 | 70.00 | 92.98 | −27.9 | 90.18 |
| 6 | 20.00 | 25 | 15.00 | 50.00 | 95.51 | −22.8 | 87.02 |
| 7 | 20.00 | 41.81 | 15.00 | 50.00 | 96.77 | −23.7 | 57.35 |
| 8 | 30.00 | 35 | 20.00 | 30.00 | 126.57 | −44.67 | 73.36 |
| 9 | 20.00 | 8.18 | 15.00 | 50.00 | 110.6 | −12.43 | 87.1 |
| 10 | 20.00 | 25 | 15.00 | 16.36 | 152.71 | −24.87 | 71.31 |
| 11 | 20.00 | 25 | 15.00 | 50.00 | 87.93 | −23.67 | 81.58 |
| 12 | 20.00 | 25 | 15.00 | 83.63 | 88.10 | −41.34 | 94.65 |
| 13 | 36.81 | 25 | 15.00 | 50.00 | 116.73 | −47.7 | 86.34 |
| 14 | 20.00 | 25 | 15.00 | 50.00 | 71.81 | −21.67 | 99.12 |
| 15 | 10.00 | 35 | 20.00 | 70.00 | 46.78 | −21.43 | 82.9 |
| 16 | 20.00 | 25 | 23.40 | 50.00 | 114.33 | −35.9 | 86.9 |
| 17 | 10.00 | 35 | 10.00 | 70.00 | 56.68 | −31.87 | 83.99 |
| 18 | 20.00 | 25 | 15.00 | 50.00 | 85.85 | −19.65 | 67.03 |
| 19 | 3.18 | 25 | 15.00 | 50.00 | 58.86 | −19.3 | 94.99 |
| 20 | 10.00 | 15 | 10.00 | 30.00 | 122.34 | −32.1 | 85.36 |
| 21 | 30.00 | 35 | 10.00 | 30.00 | 119.49 | −17.4 | 65.97 |
Table 4.
ANOVA summary for responses pertaining to the variables of CCD.
Table 4.
ANOVA summary for responses pertaining to the variables of CCD.
| Response Variables | Parameters of Regression | p Value |
|---|
| | R2 | Fcal. | |
| Droplet size (Y1) | 0.6895 | 8.88 | 0.0006 |
| Zeta potential (Y2) | 0.9765 | 17.83 | 0.0010 |
| Drug loading | 0.5358 | 4.62 | 0.0114 |
Table 5.
Results of release kinetics models applied for ME.
Table 5.
Results of release kinetics models applied for ME.
| Model | SLMME | SLMMME |
|---|
| | R2 value | R2 value |
| Zero order | 0.9182 | 0.8256 |
| First order | 0.4183 | 0.3460 |
| Korsmeyer Peppas | 0.9502 | 0.9188 |
| Weibull | 0.9195 | 0.9089 |
| Hixon Crowell | 0.7262 | 0.6637 |
| Higuchi | 0.9996 | 0.9920 |
Table 6.
Data representing effect of varying treatments on oxidative stress parameters.
Table 6.
Data representing effect of varying treatments on oxidative stress parameters.
| Treatment | Oxidative Parameter |
|---|
| TBARS (nmol/mg of Protein) | Nitrite (nmol/mg of Protein) | GSH (nmol/mg of Protein) | CAT (Units/mg of Protein) | SOD (Units/mg of Protein) |
|---|
| Group 1 | 1.117 ± 0.028 | 0.807 ± 0.012 | 4.452 ± 0.122 | 0.975 ± 0.016 | 11.444 ± 0.311 |
| Group 2 | 3.530 ± 0.313 * | 1.777 ± 0.029 * | 0.955 ± 0.050 * | 0.057 ± 0.023 * | 3.210 ± 0.781 * |
| Group 3 | 1.180± 0.020 | 0.789 ± 0.006 | 4.465 ± 0.164 | 0.953 ± 0.034 | 11.649 ± 0.334 |
| Group 4 | 1.178 ± 0.042 | 0.806 ± 0.012 | 4.283 ± 0.119 | 0.926 ± 0.022 | 11.611 ± 0.405 |
| Group 5 | 2.901 ± 0.030 # | 1.498 ± 0.018 # | 2.145 ± 0.074 # | 0.420 ± 0.043 # | 5.292 ± 0.537 # |
| Group 6 | 2.708 ± 0.030 # | 1.410 ± 0.018 # | 2.445 ± 0.074 # | 0.461 ± 0.040 # | 5.872 ± 0.496 # |
| Group 7 | 2.592 ± 0.038 # | 1.472 ± 0.024 # | 2.985 ± 0.033 #,@ | 0.554 ± 0.045 # | 6.411 ± 0.449 # |
| Group 8 | 1.910 ± 0.032 #,@,$,^ | 1.333 ± 0.010 #,@,^ | 3.461 ± 0.030 #,@,$ | 0.629 ± 0.031 #,$ | 6.996 ± 0.749 # |
| Group 9 | 3.525 ± 0.313 | 1.677 ± 0.029 | 0.915 ± 0.050 | 0.052 ± 0.026 | 3.310 ± 0.740 |
| Group 10 | 1.761 ± 0.073 #,@,^,! | 1.339 ± 0.020 #,@,^,! | 2.740 ± 0.005 #,@,^,! | 0.889 ± 0.014 #,@,^,! | 9.508 ± 0.380 #,@,^,! |
| Group 11 | 1.228 ± 0.108 #,@,$,&,! | 1.149 ± 0.025 #,@,$,&,!,λ | 3.921 ± 0.231 #,@,$,&,!,λ | 0.910 ± 0.023 #,@,$,&,! | 10.416 ± 0.634 #,@,$,&,! |

 ,
, 


