
9-N-n-alkyl Berberine Derivatives: Hypoglycemic Activity Evaluation
 , , , , , ,
Abstract
:1. Introduction
2. Materials and Methods
2.1. Chemistry
2.2. General Procedure for the Synthesis of Compounds 2a-e
2.3. Biological Experiments
2.3.1. In Vitro Experiments
Cell Culture
The Design of the Experiment on HepG2 Cells
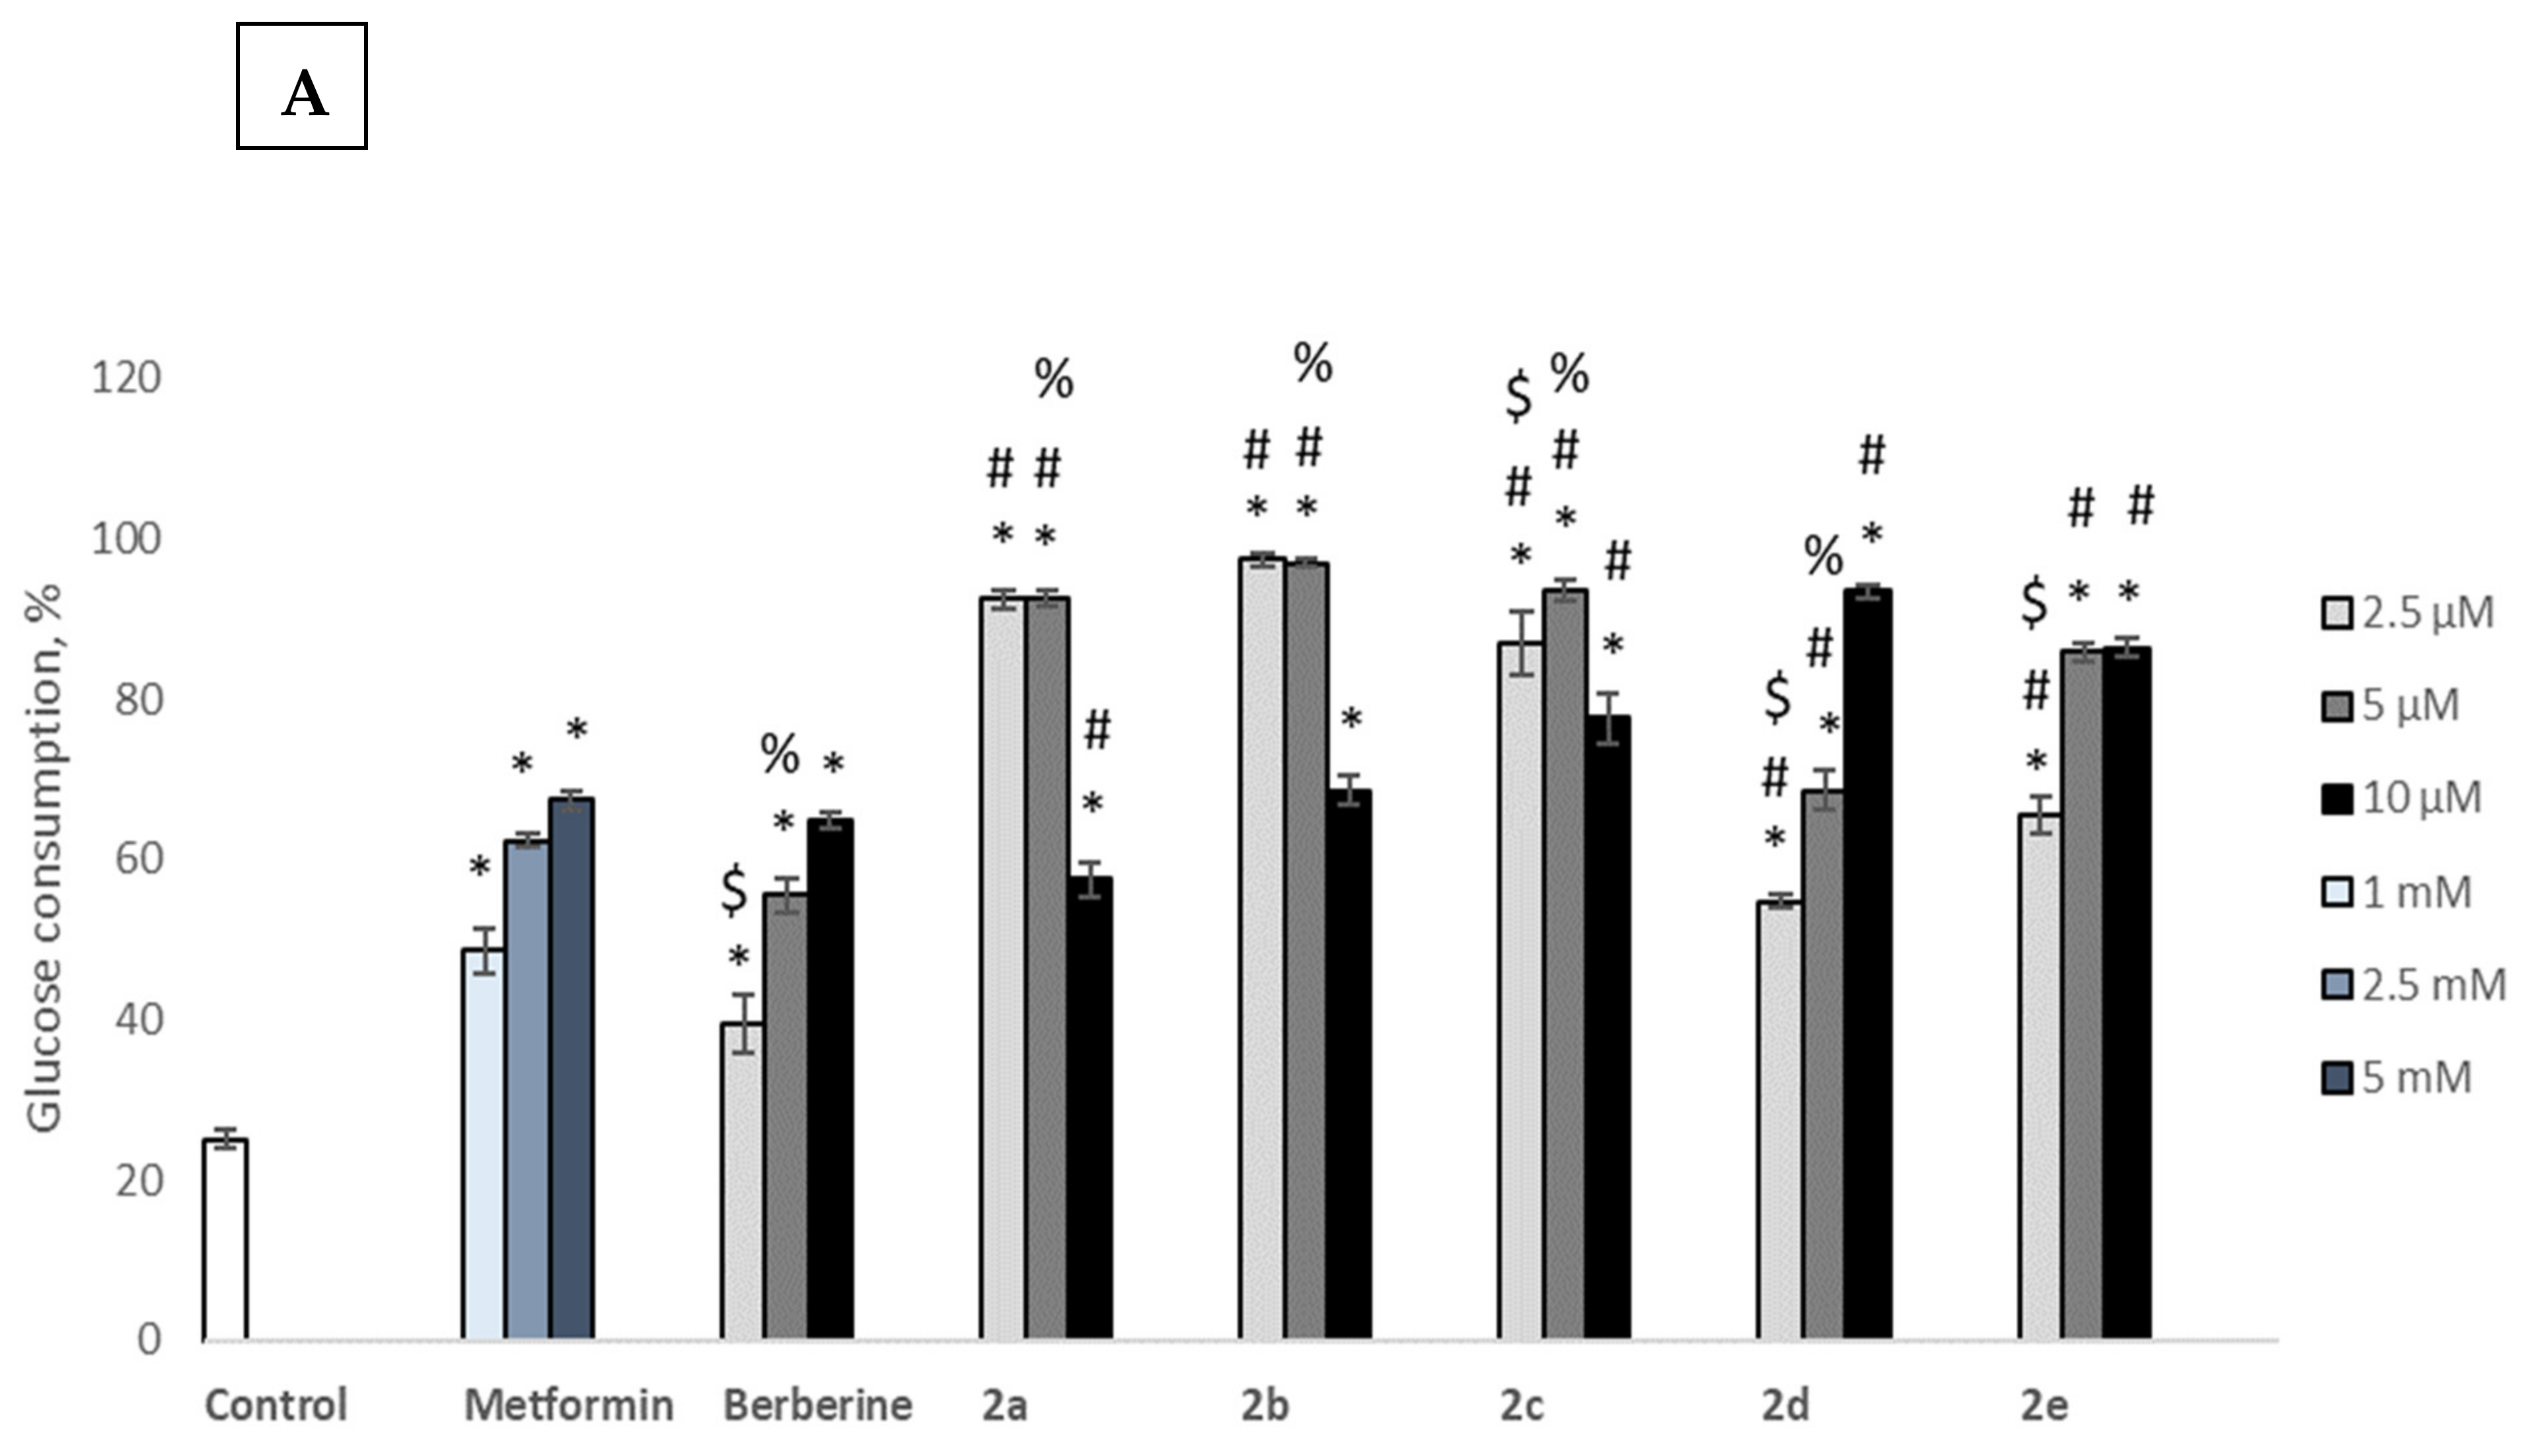
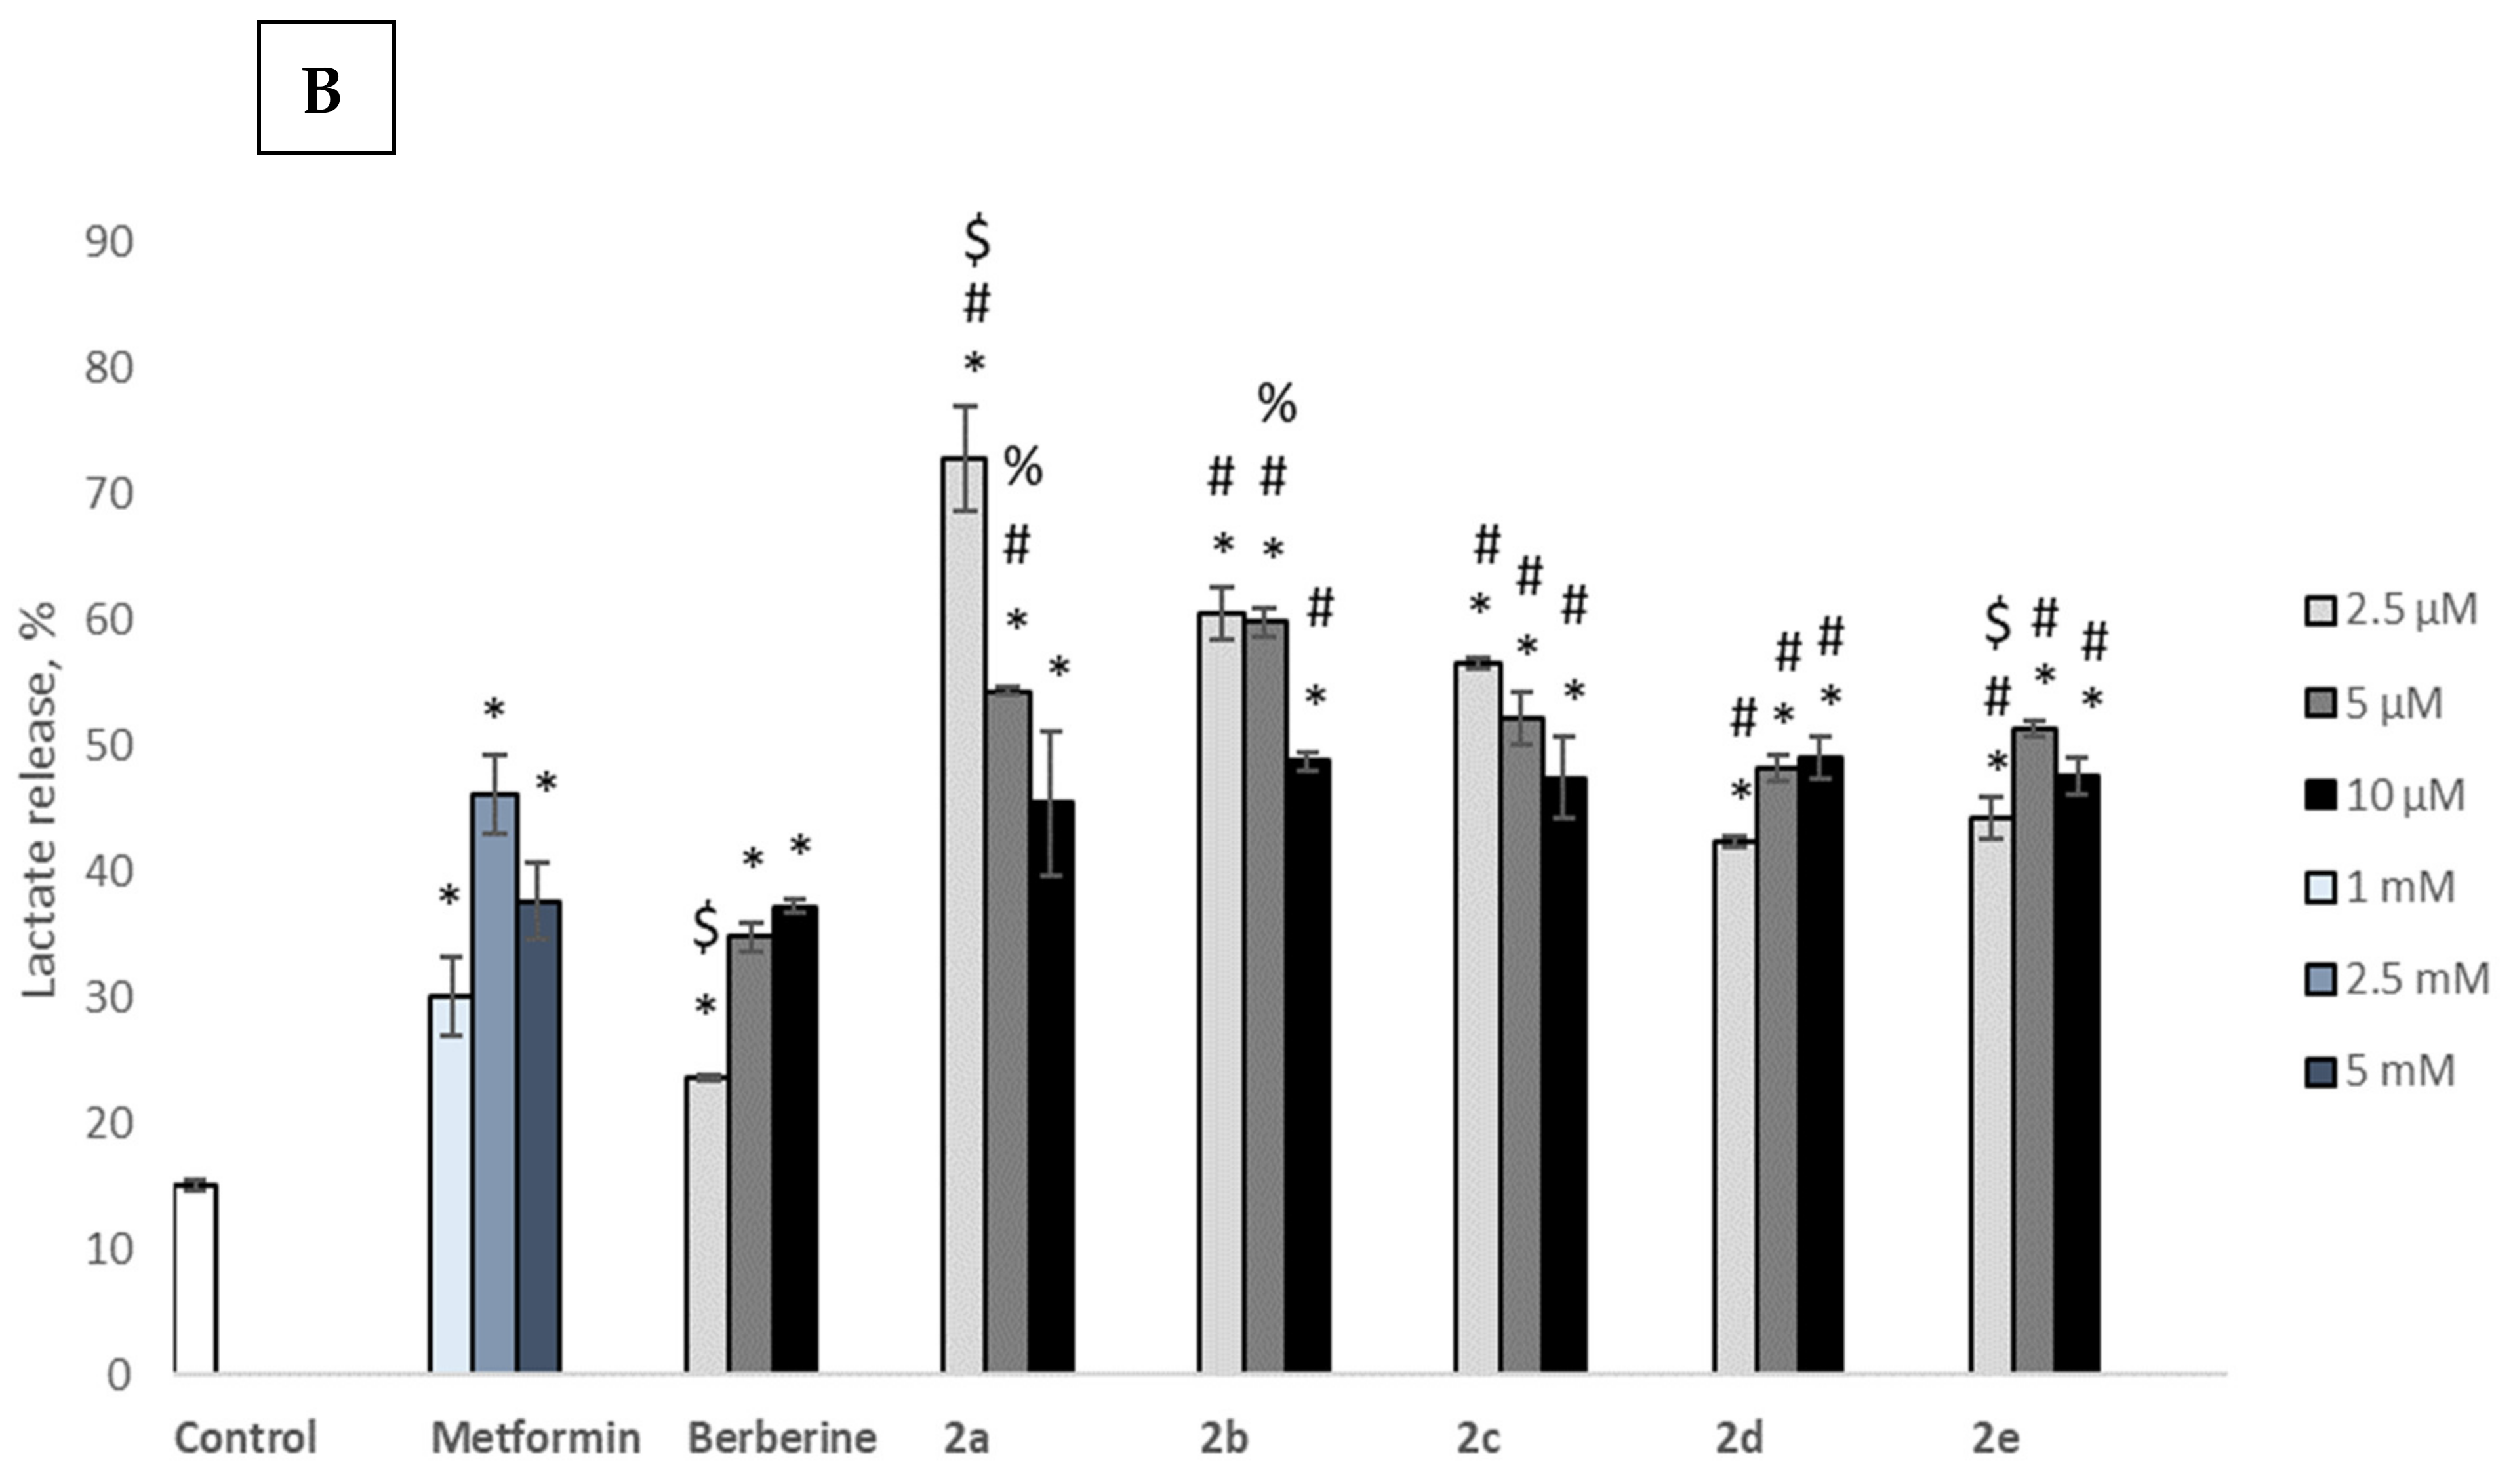
Glucose Consumption and Lactate Release Assay
MTT Assay for Cell Viability
2.3.2. In Vivo Experiments
Animals
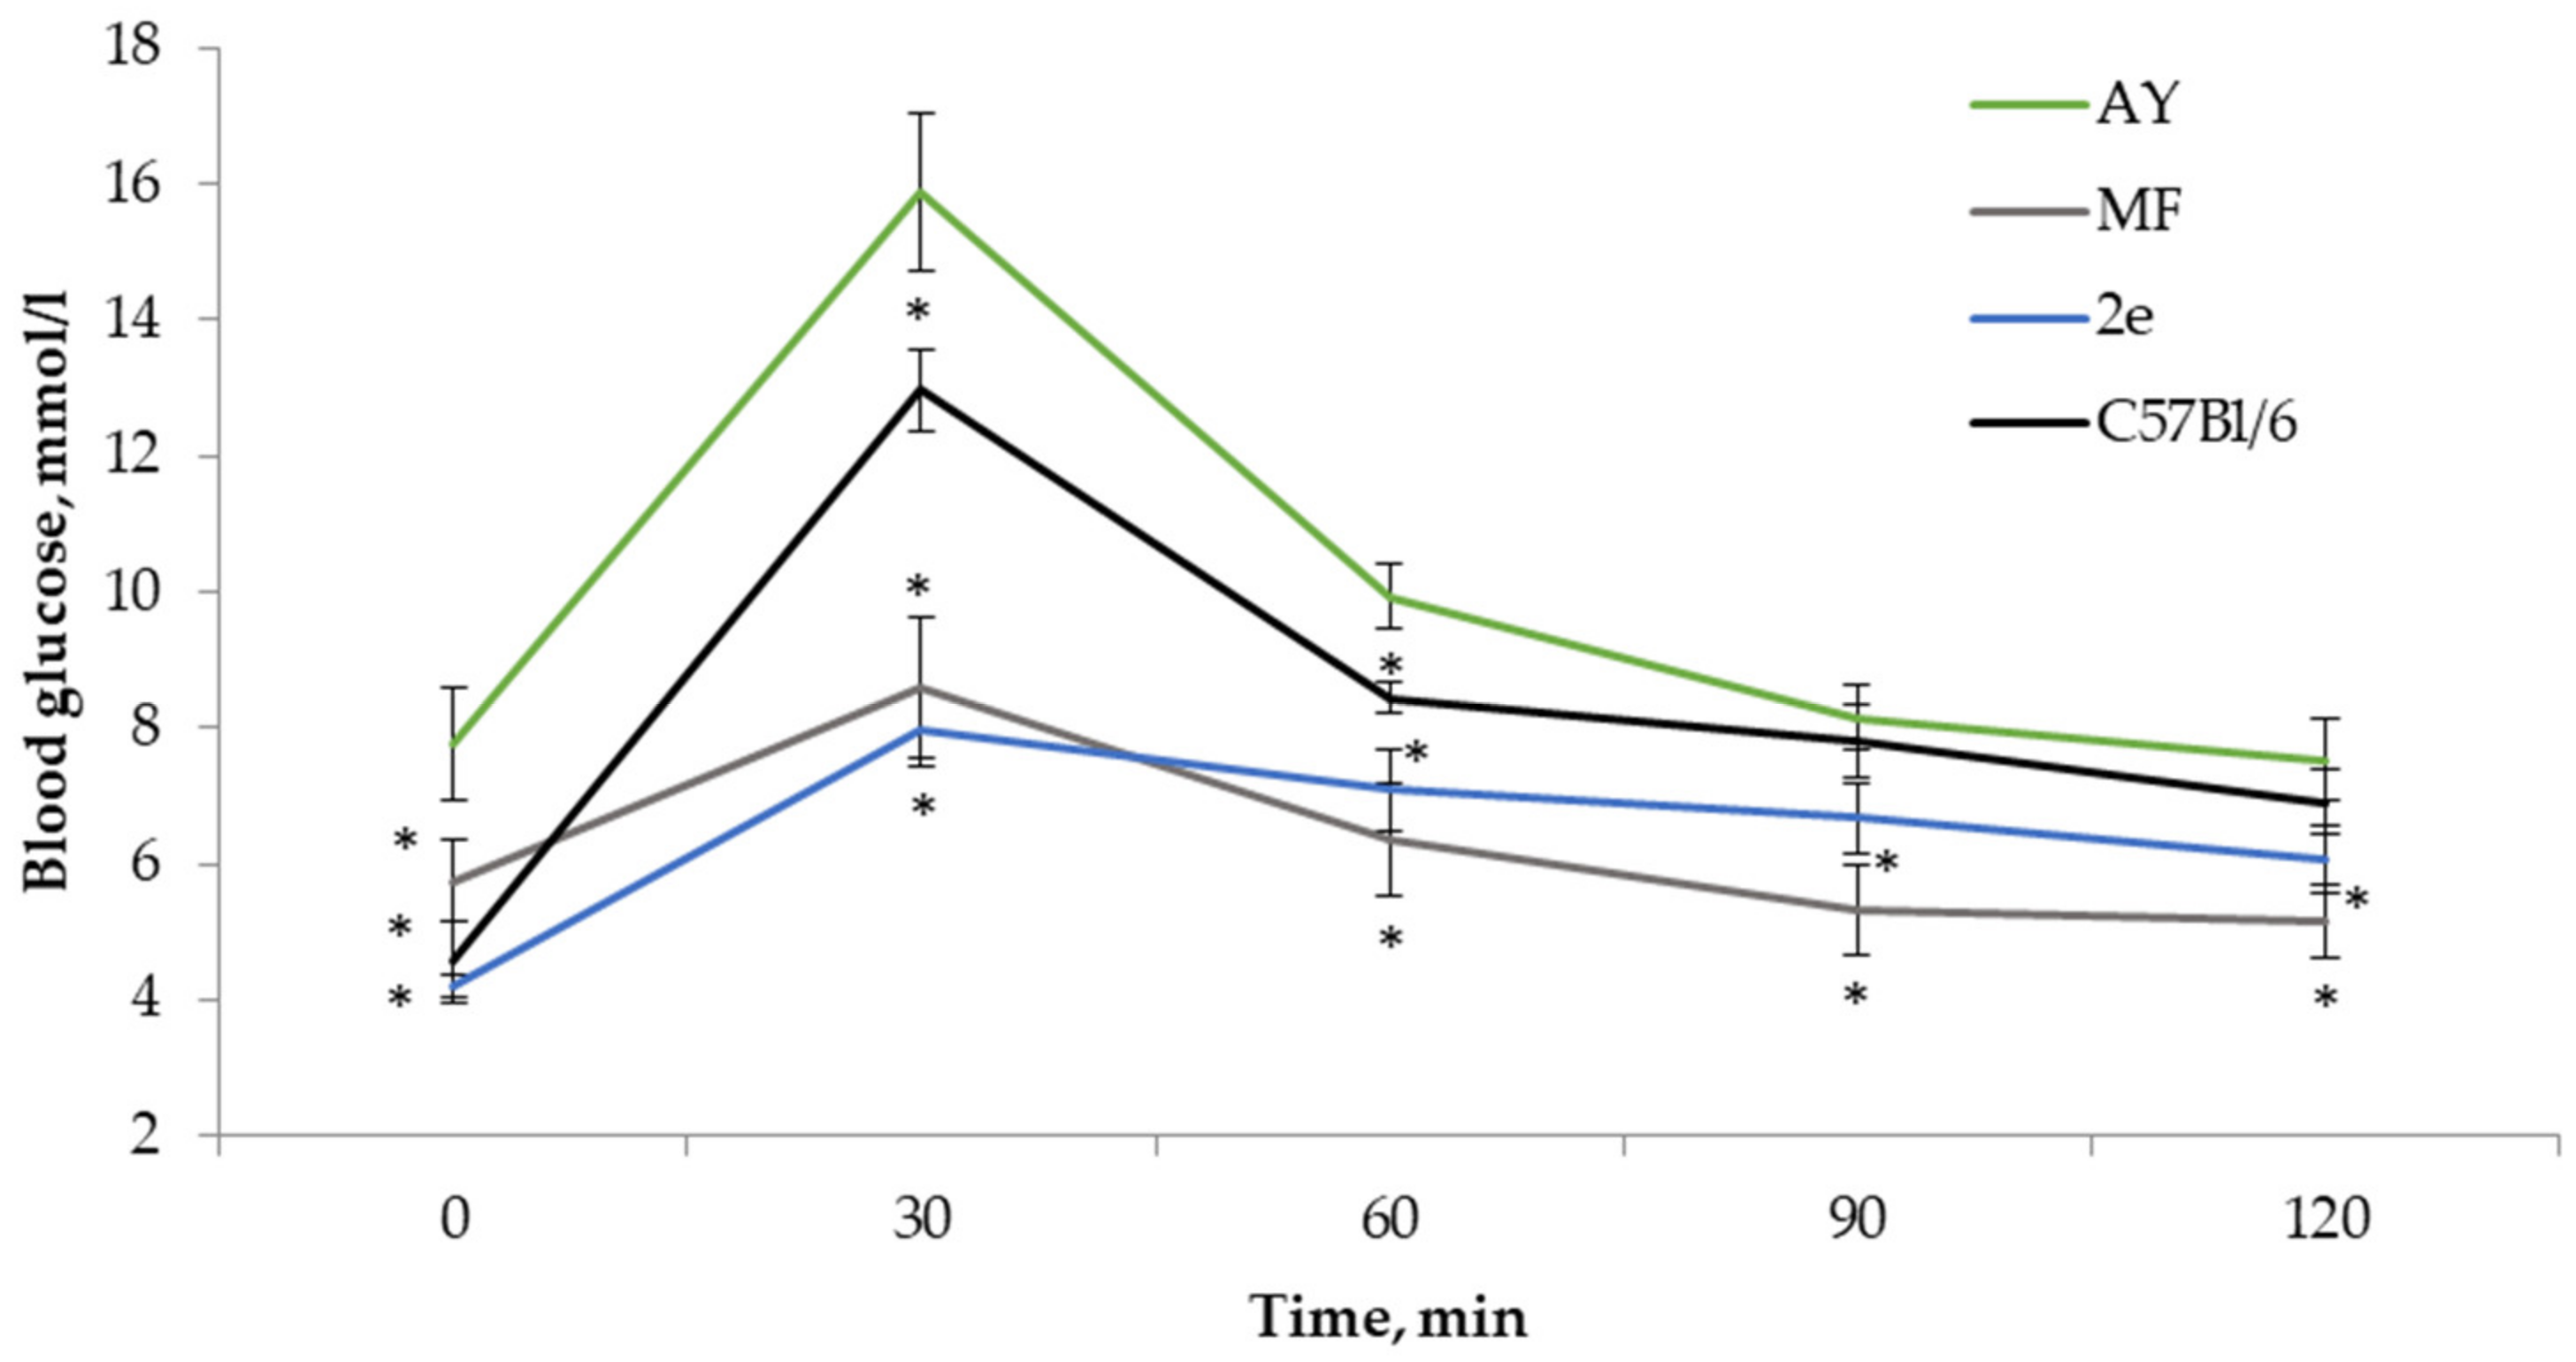
The OGTT
The AY Mice Experiment Design
Biochemical Assays
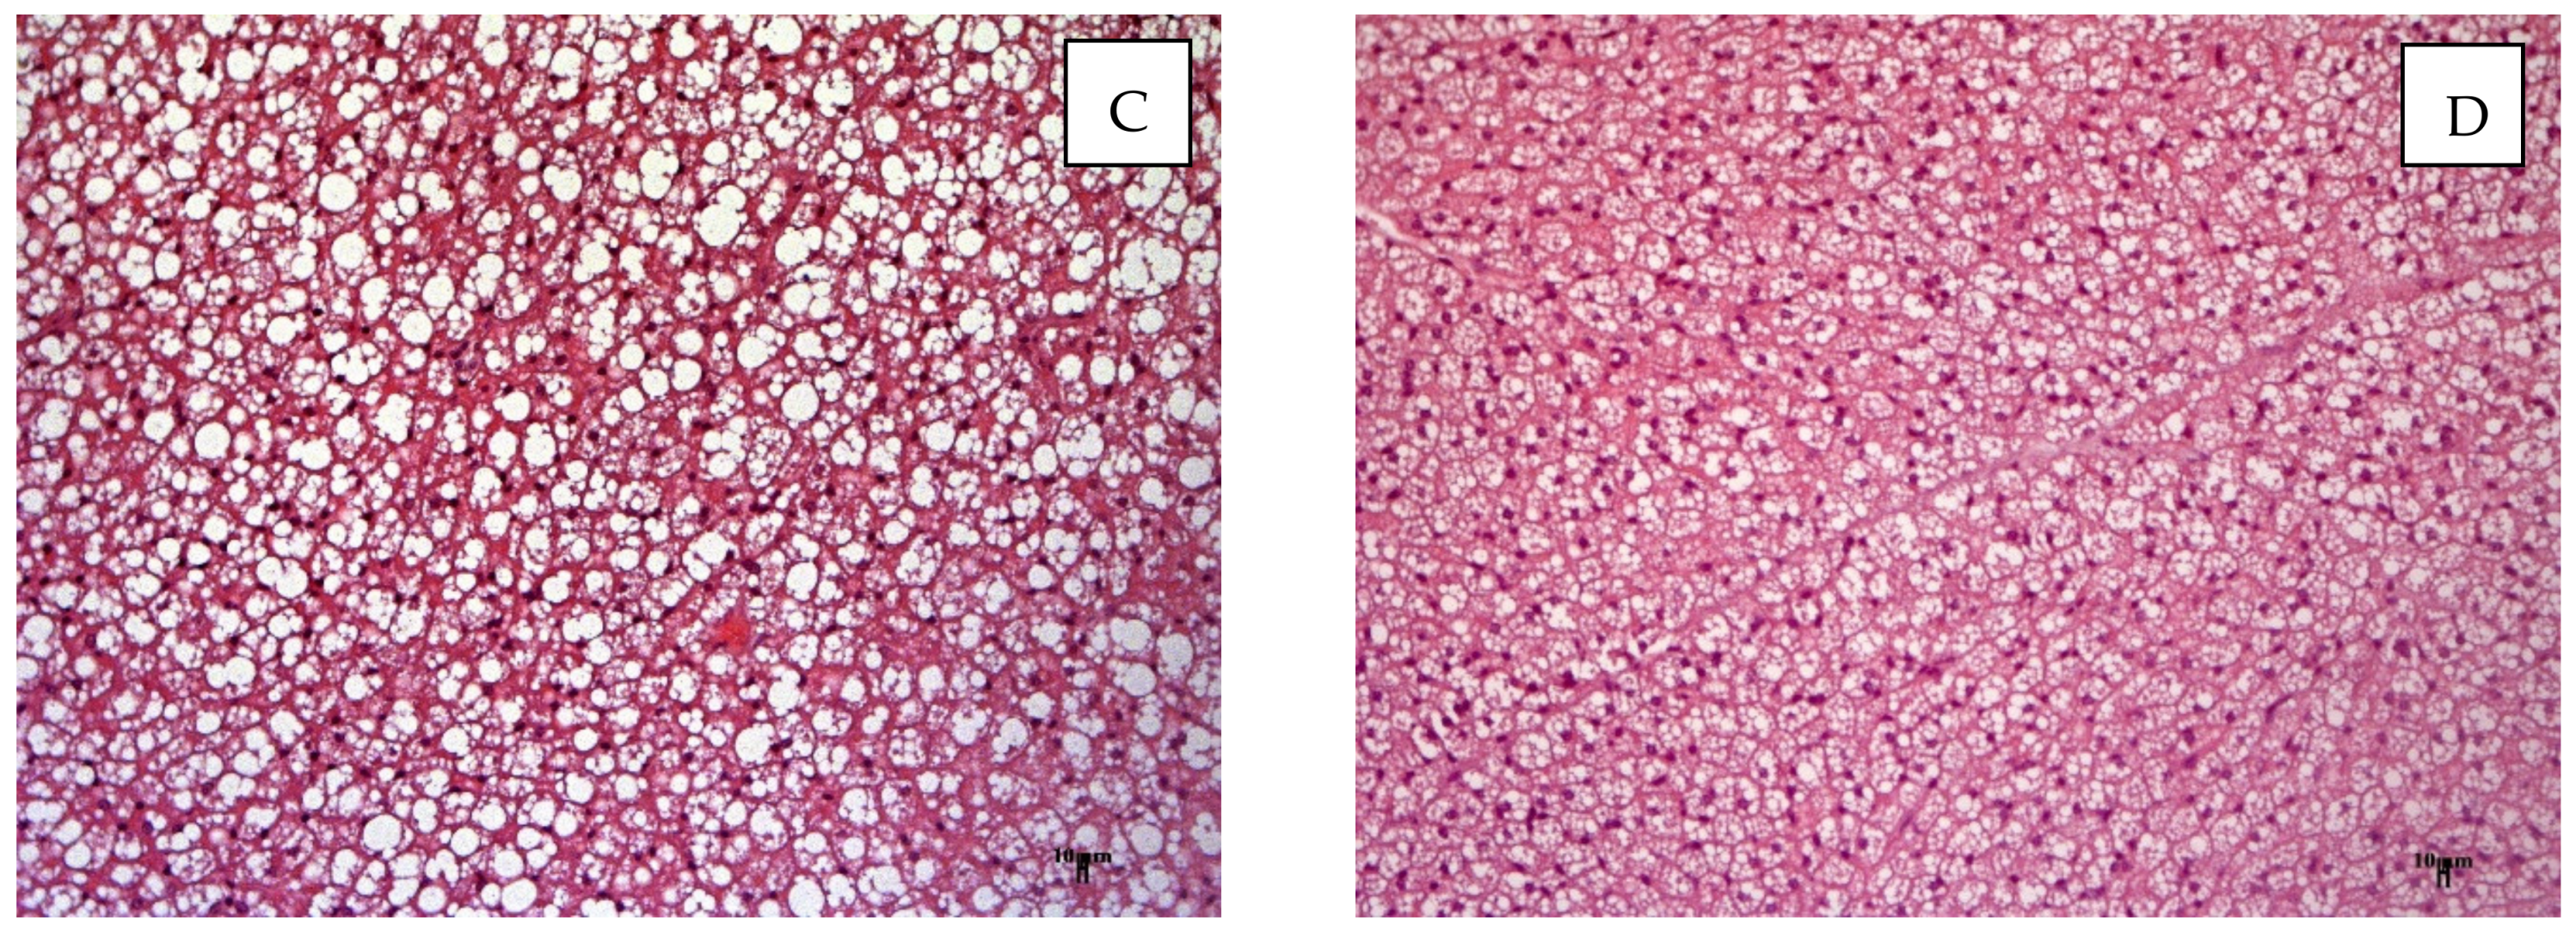
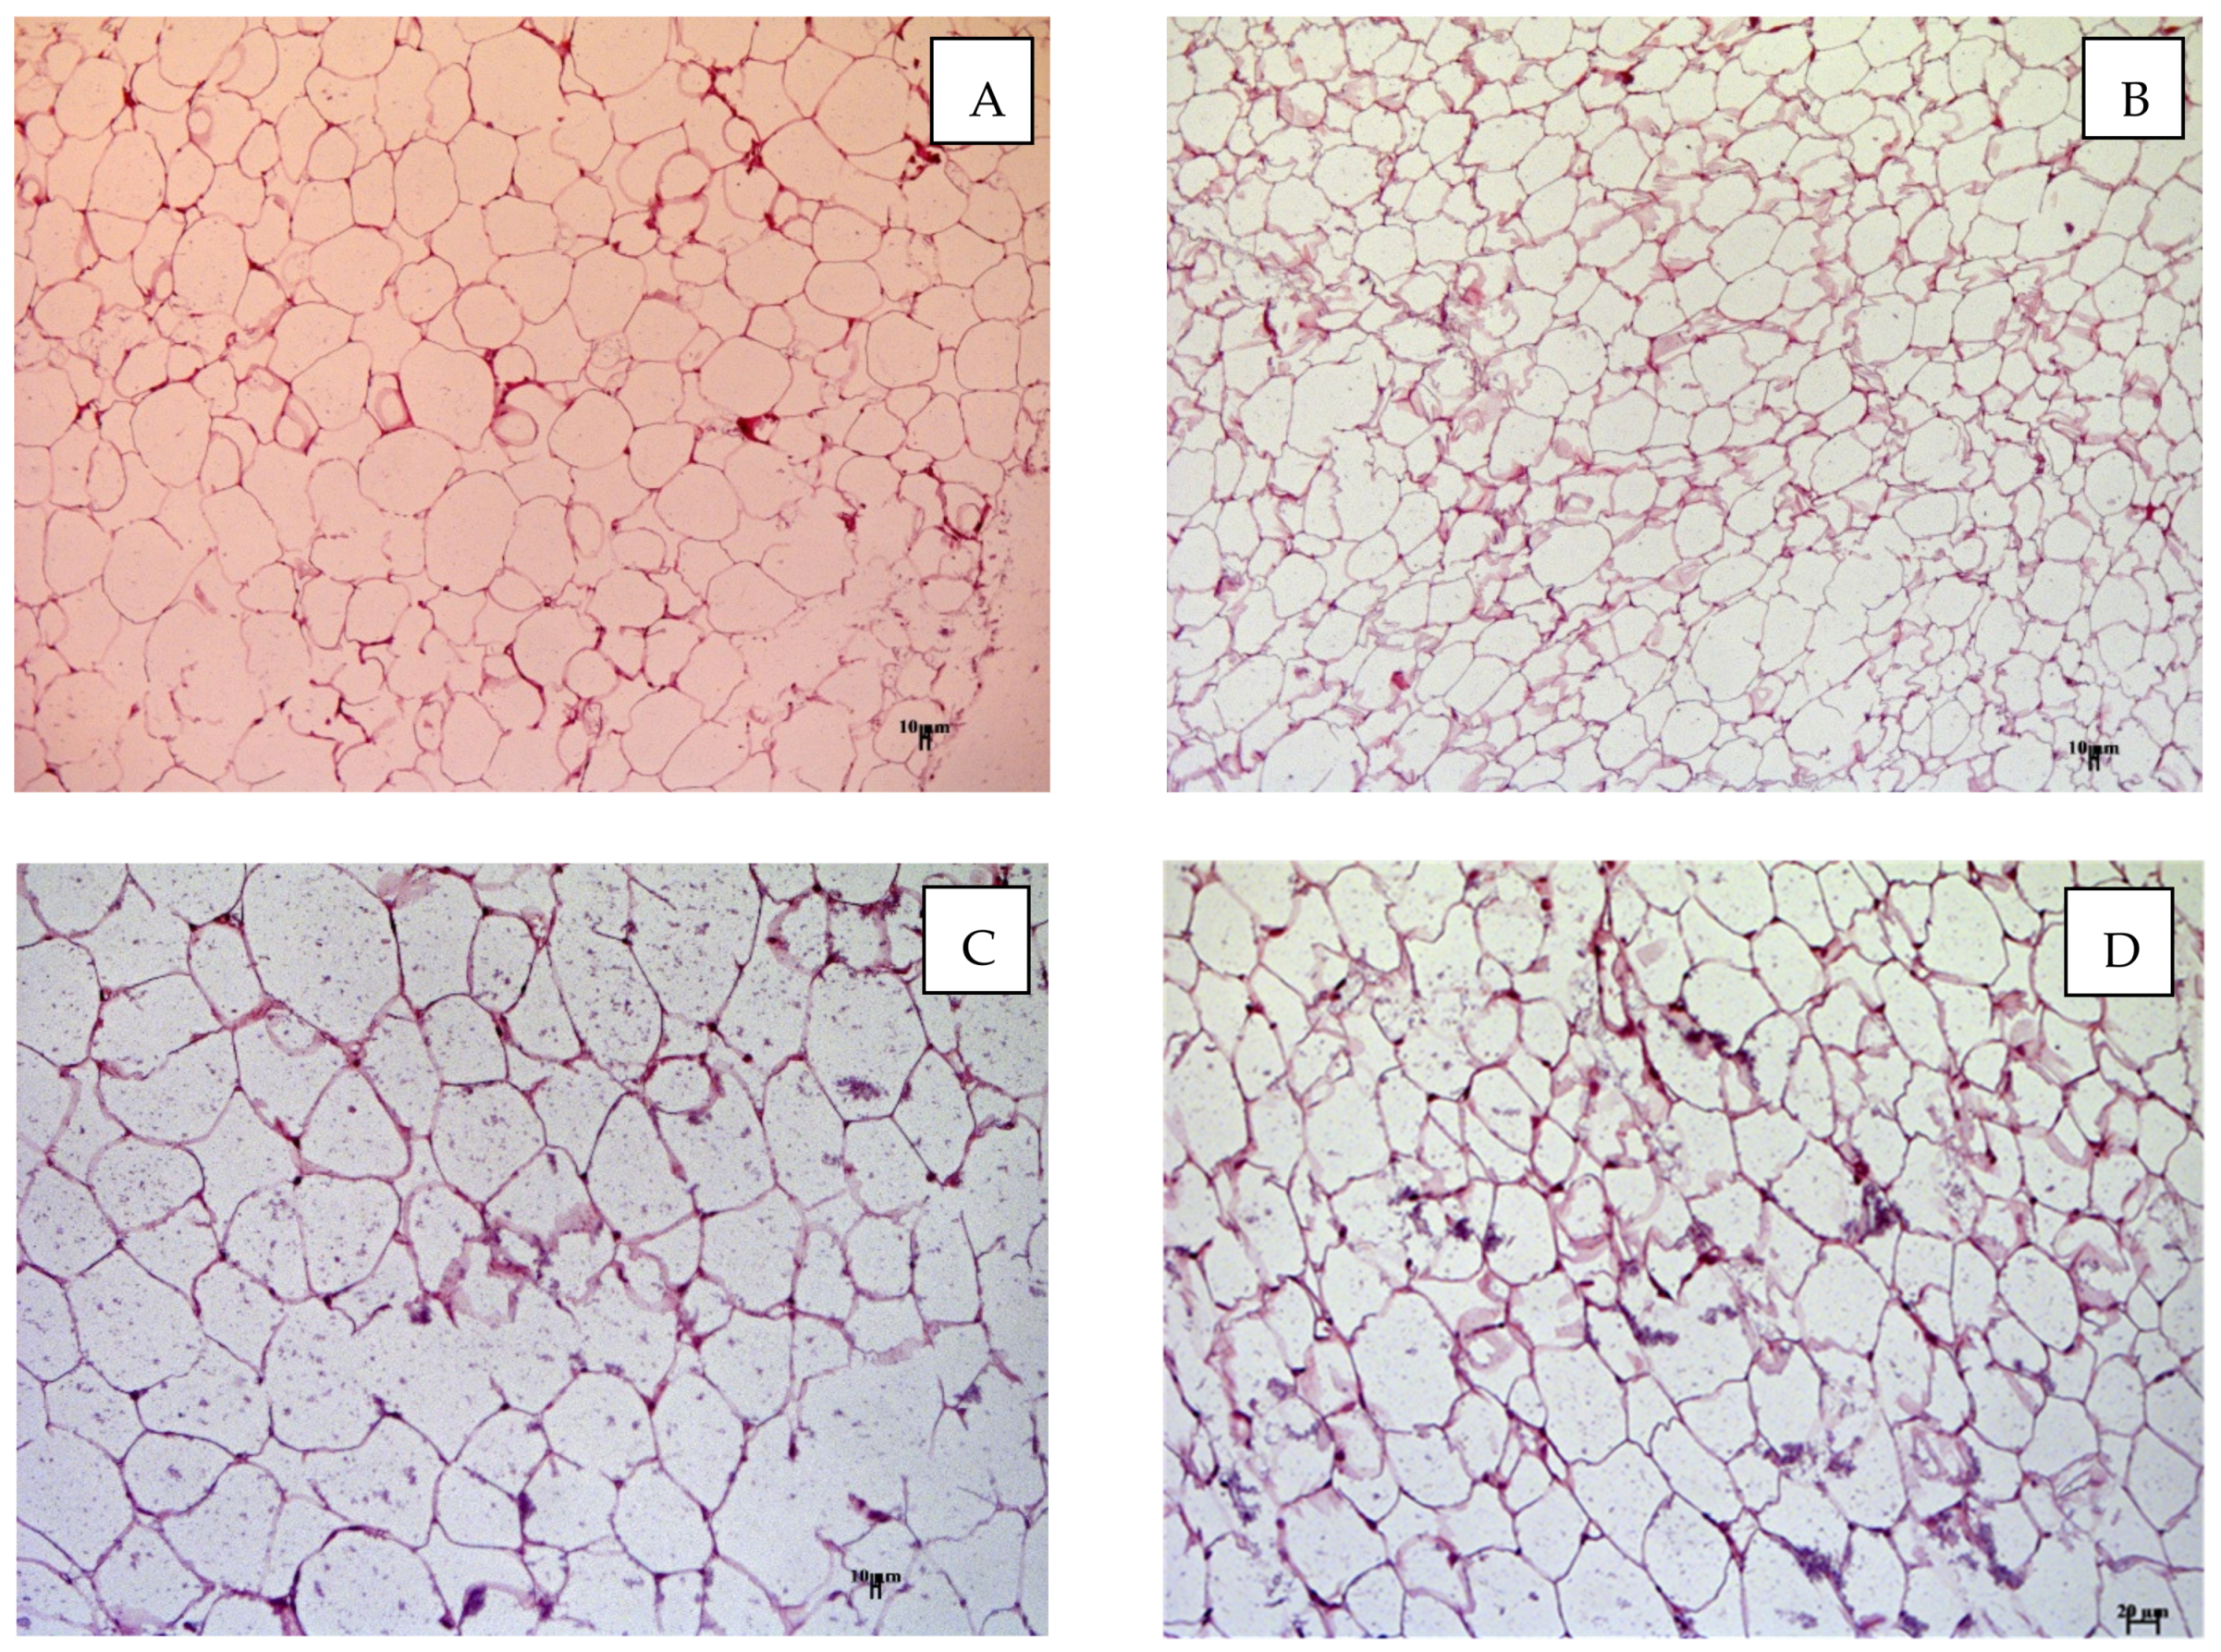
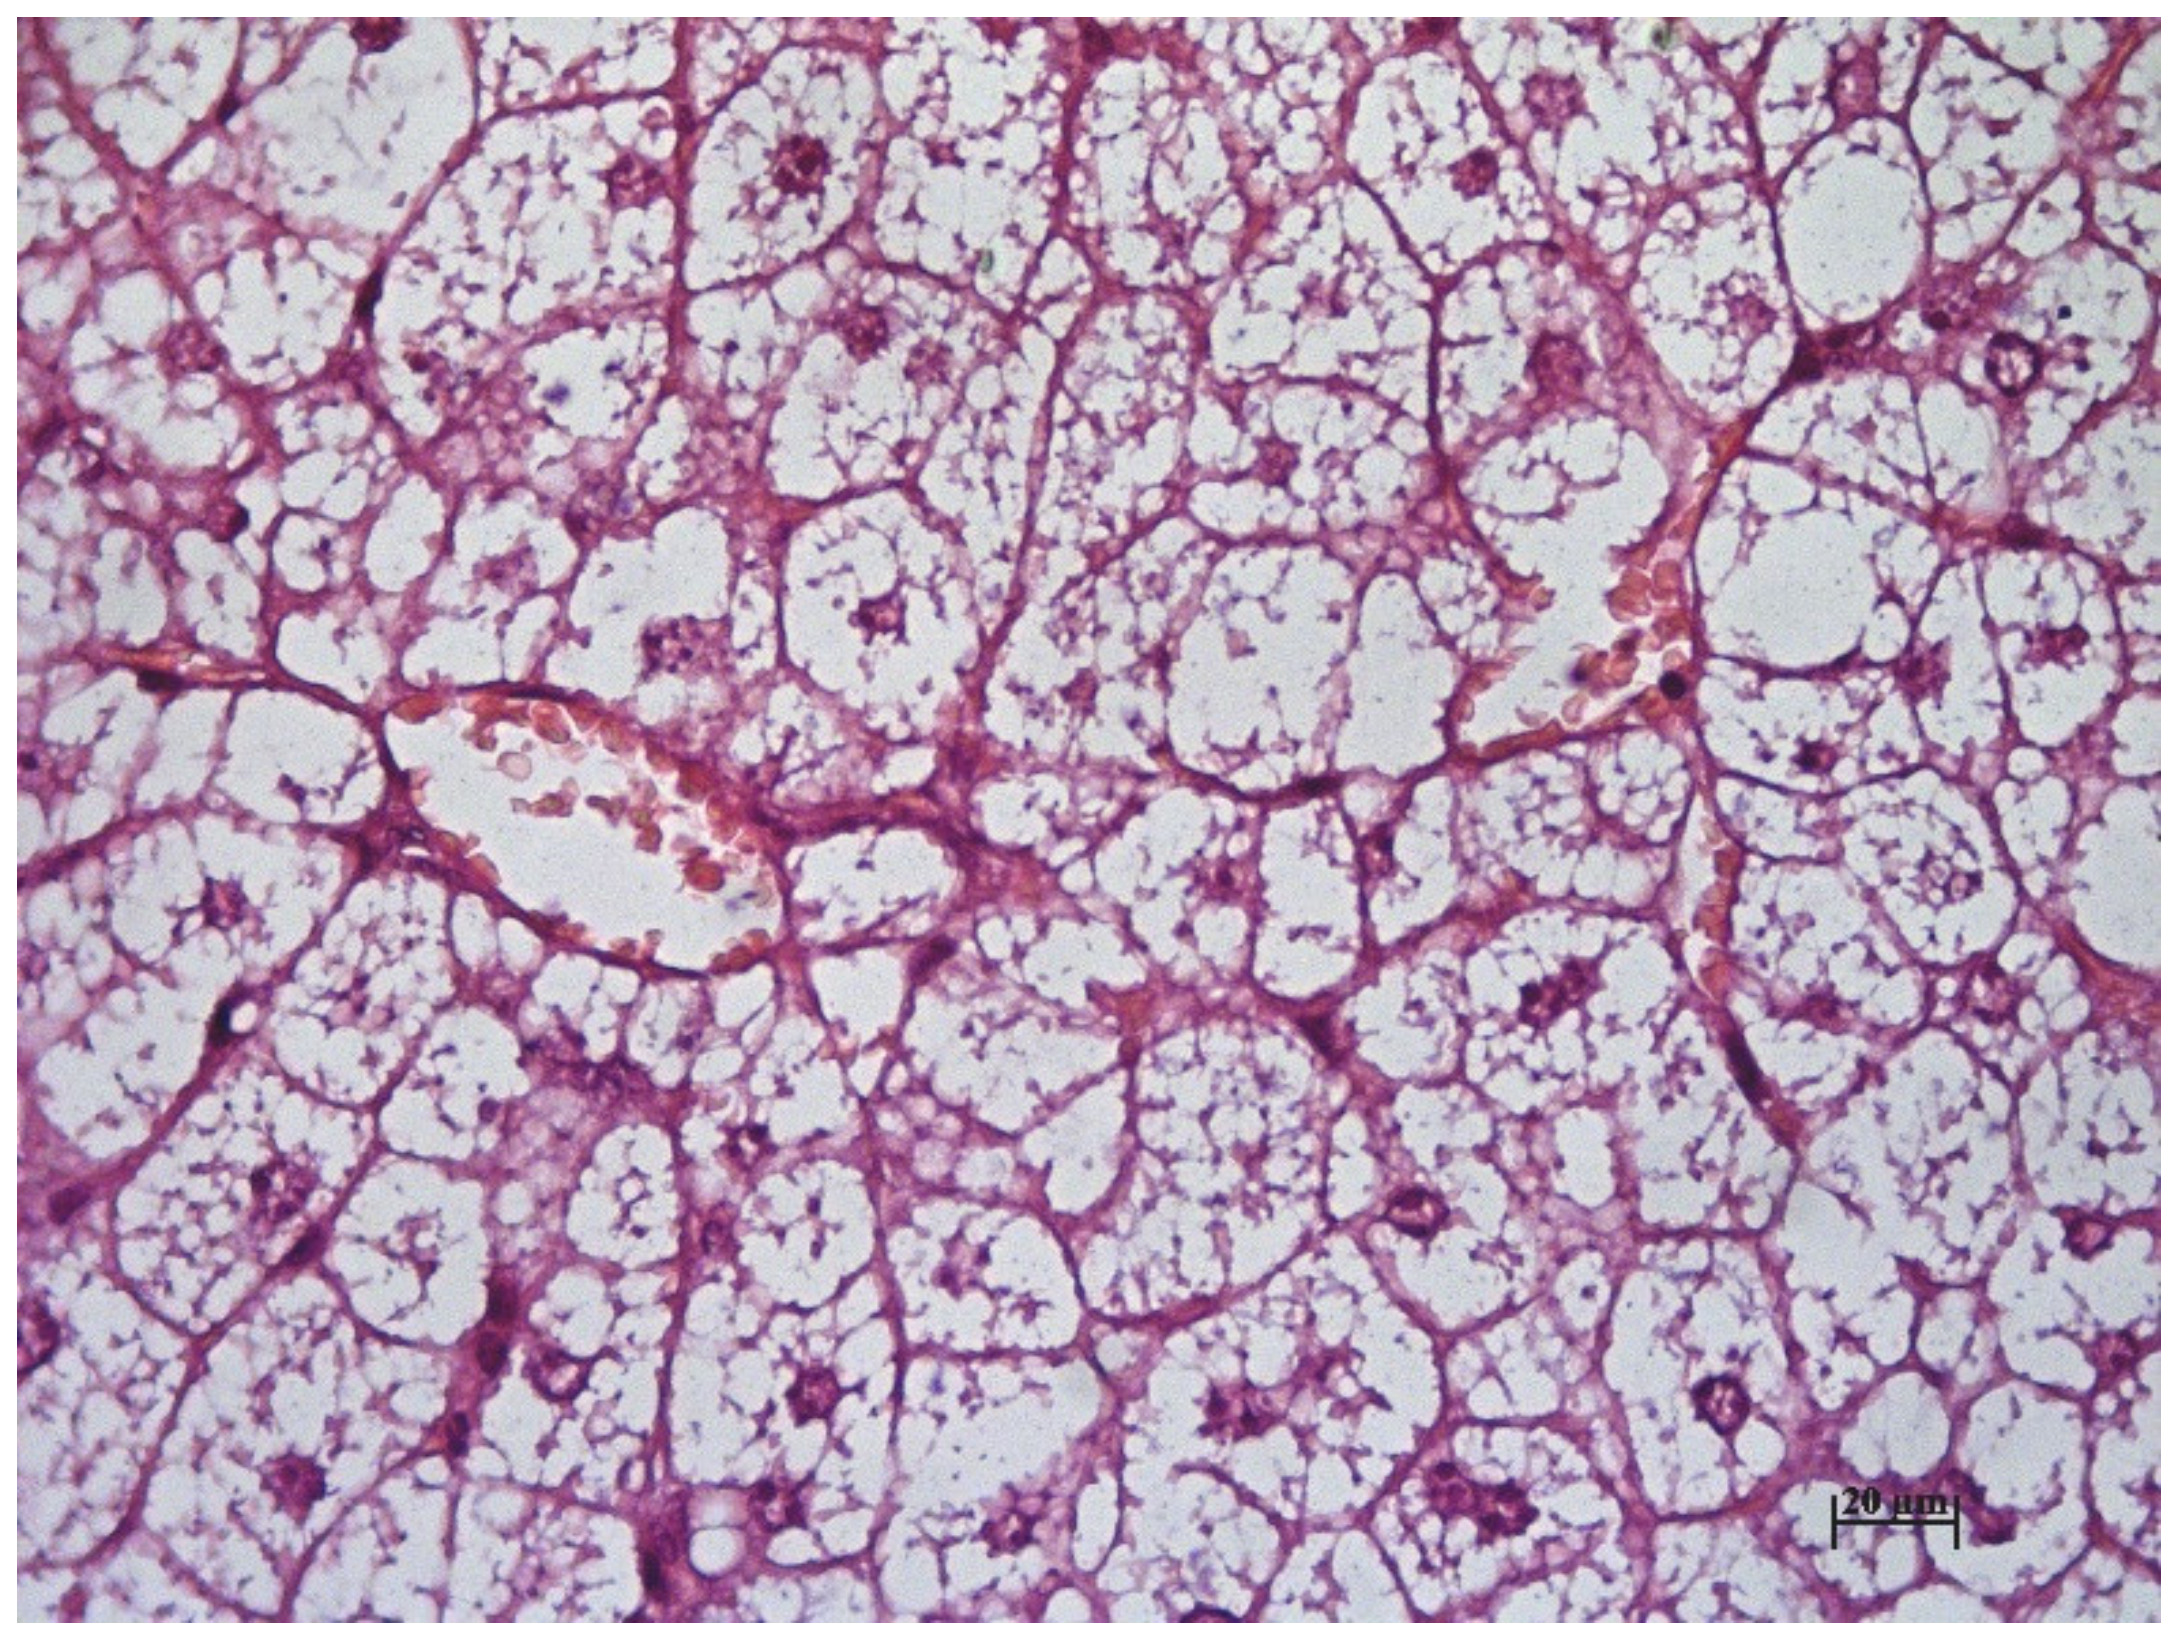
Histological Examination
Statistical Analysis
3. Results
3.1. Synthesis
3.2. In Vitro
3.3. OGTT Screening
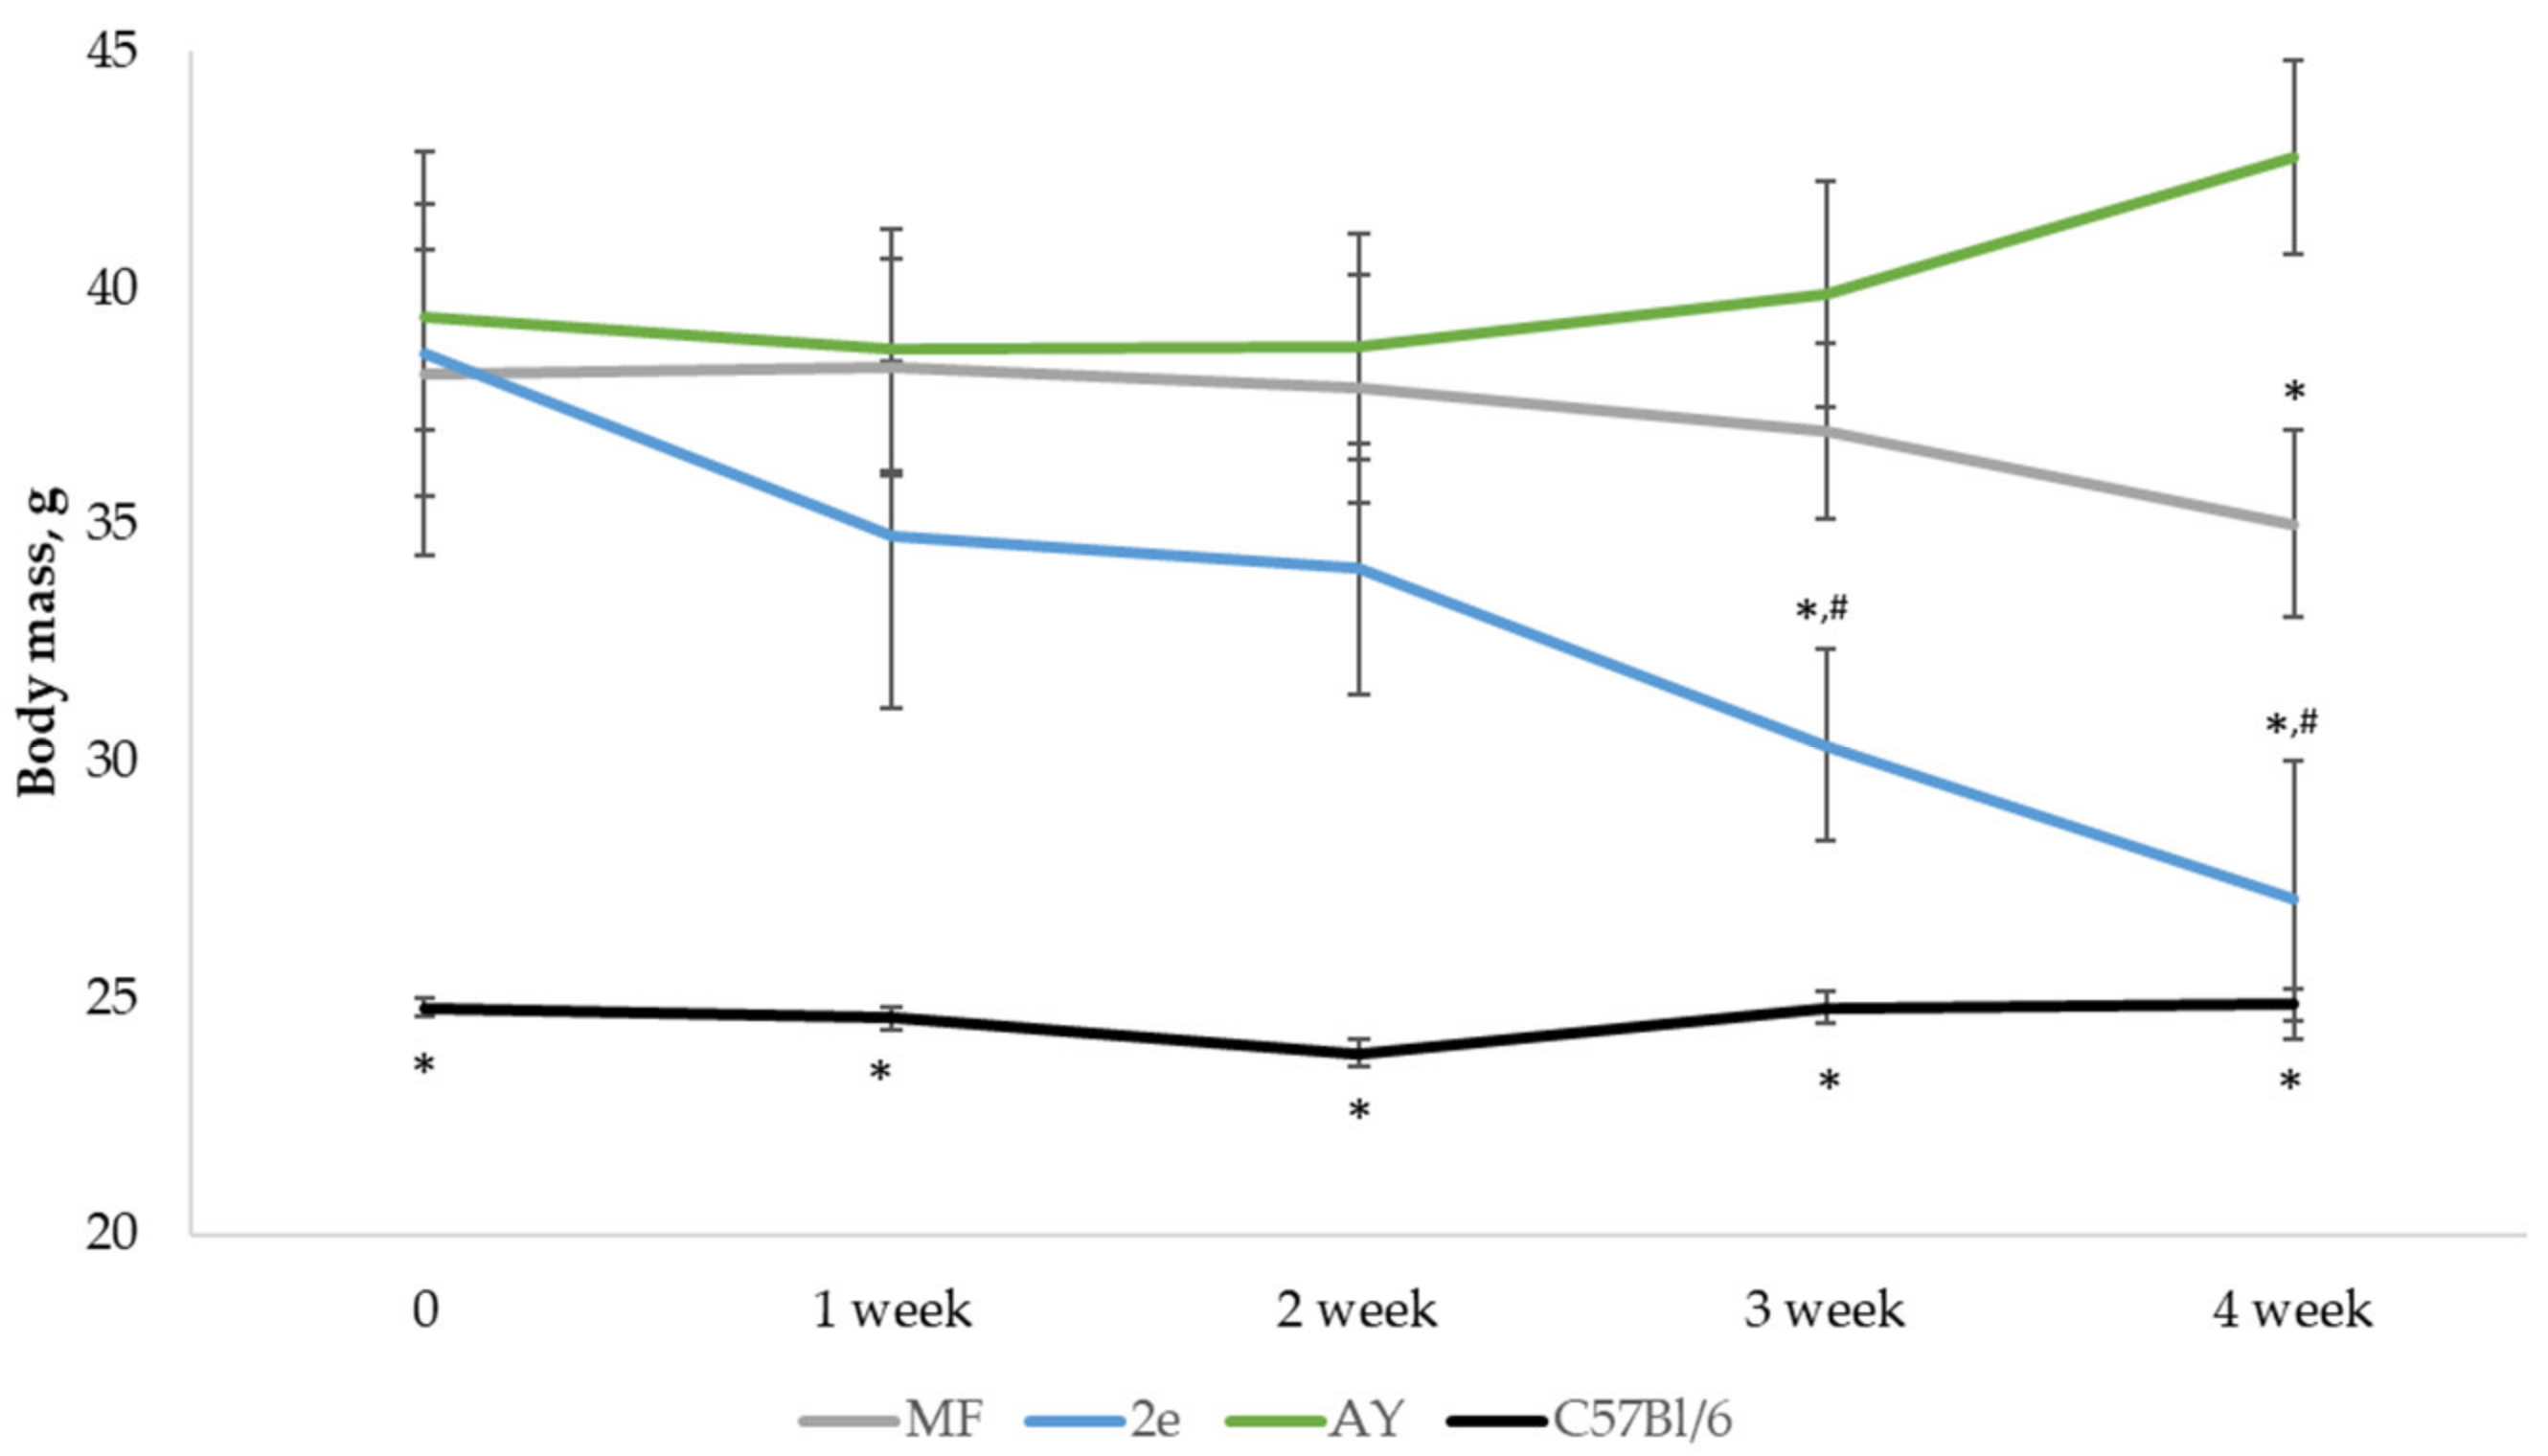
3.4. Body Weight and Food Consumption of AY Mice
3.5. OGTT after 14 Days of Experiment
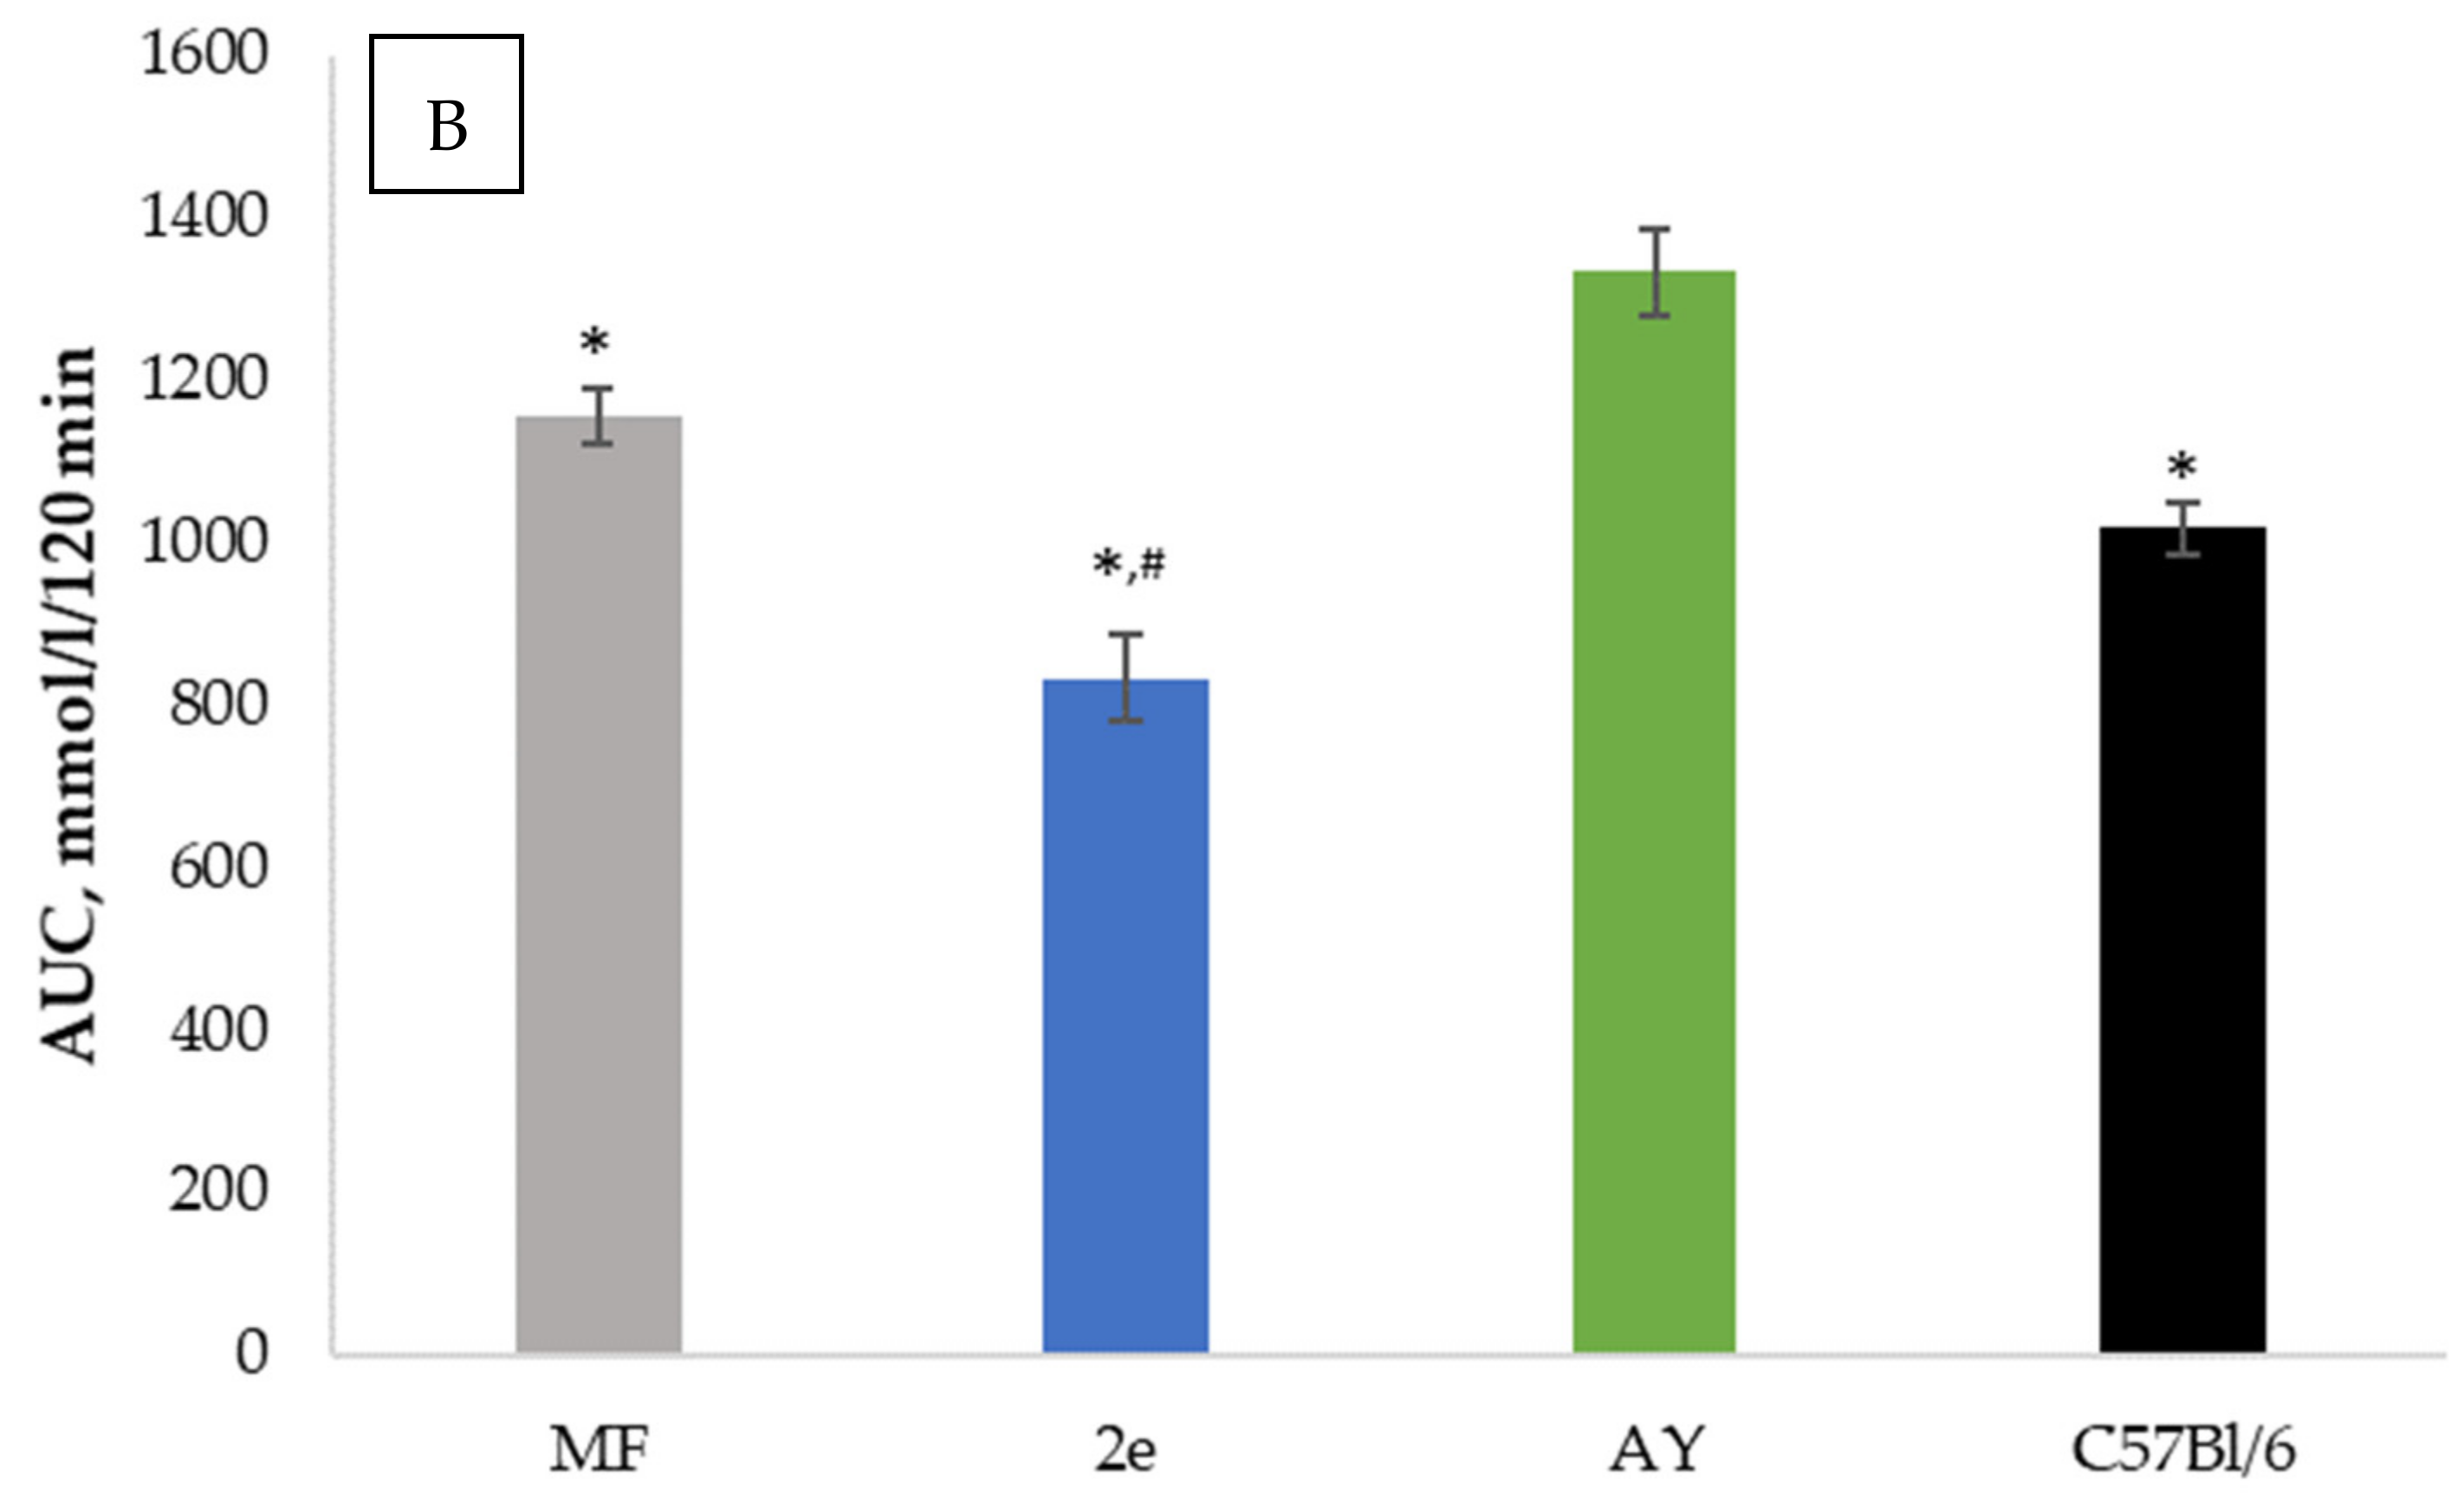
3.6. OGTT after 28 Days of Experiment
3.7. Biochemical Blood Test
3.8. Weight of Organs and Tissues of AY Mice
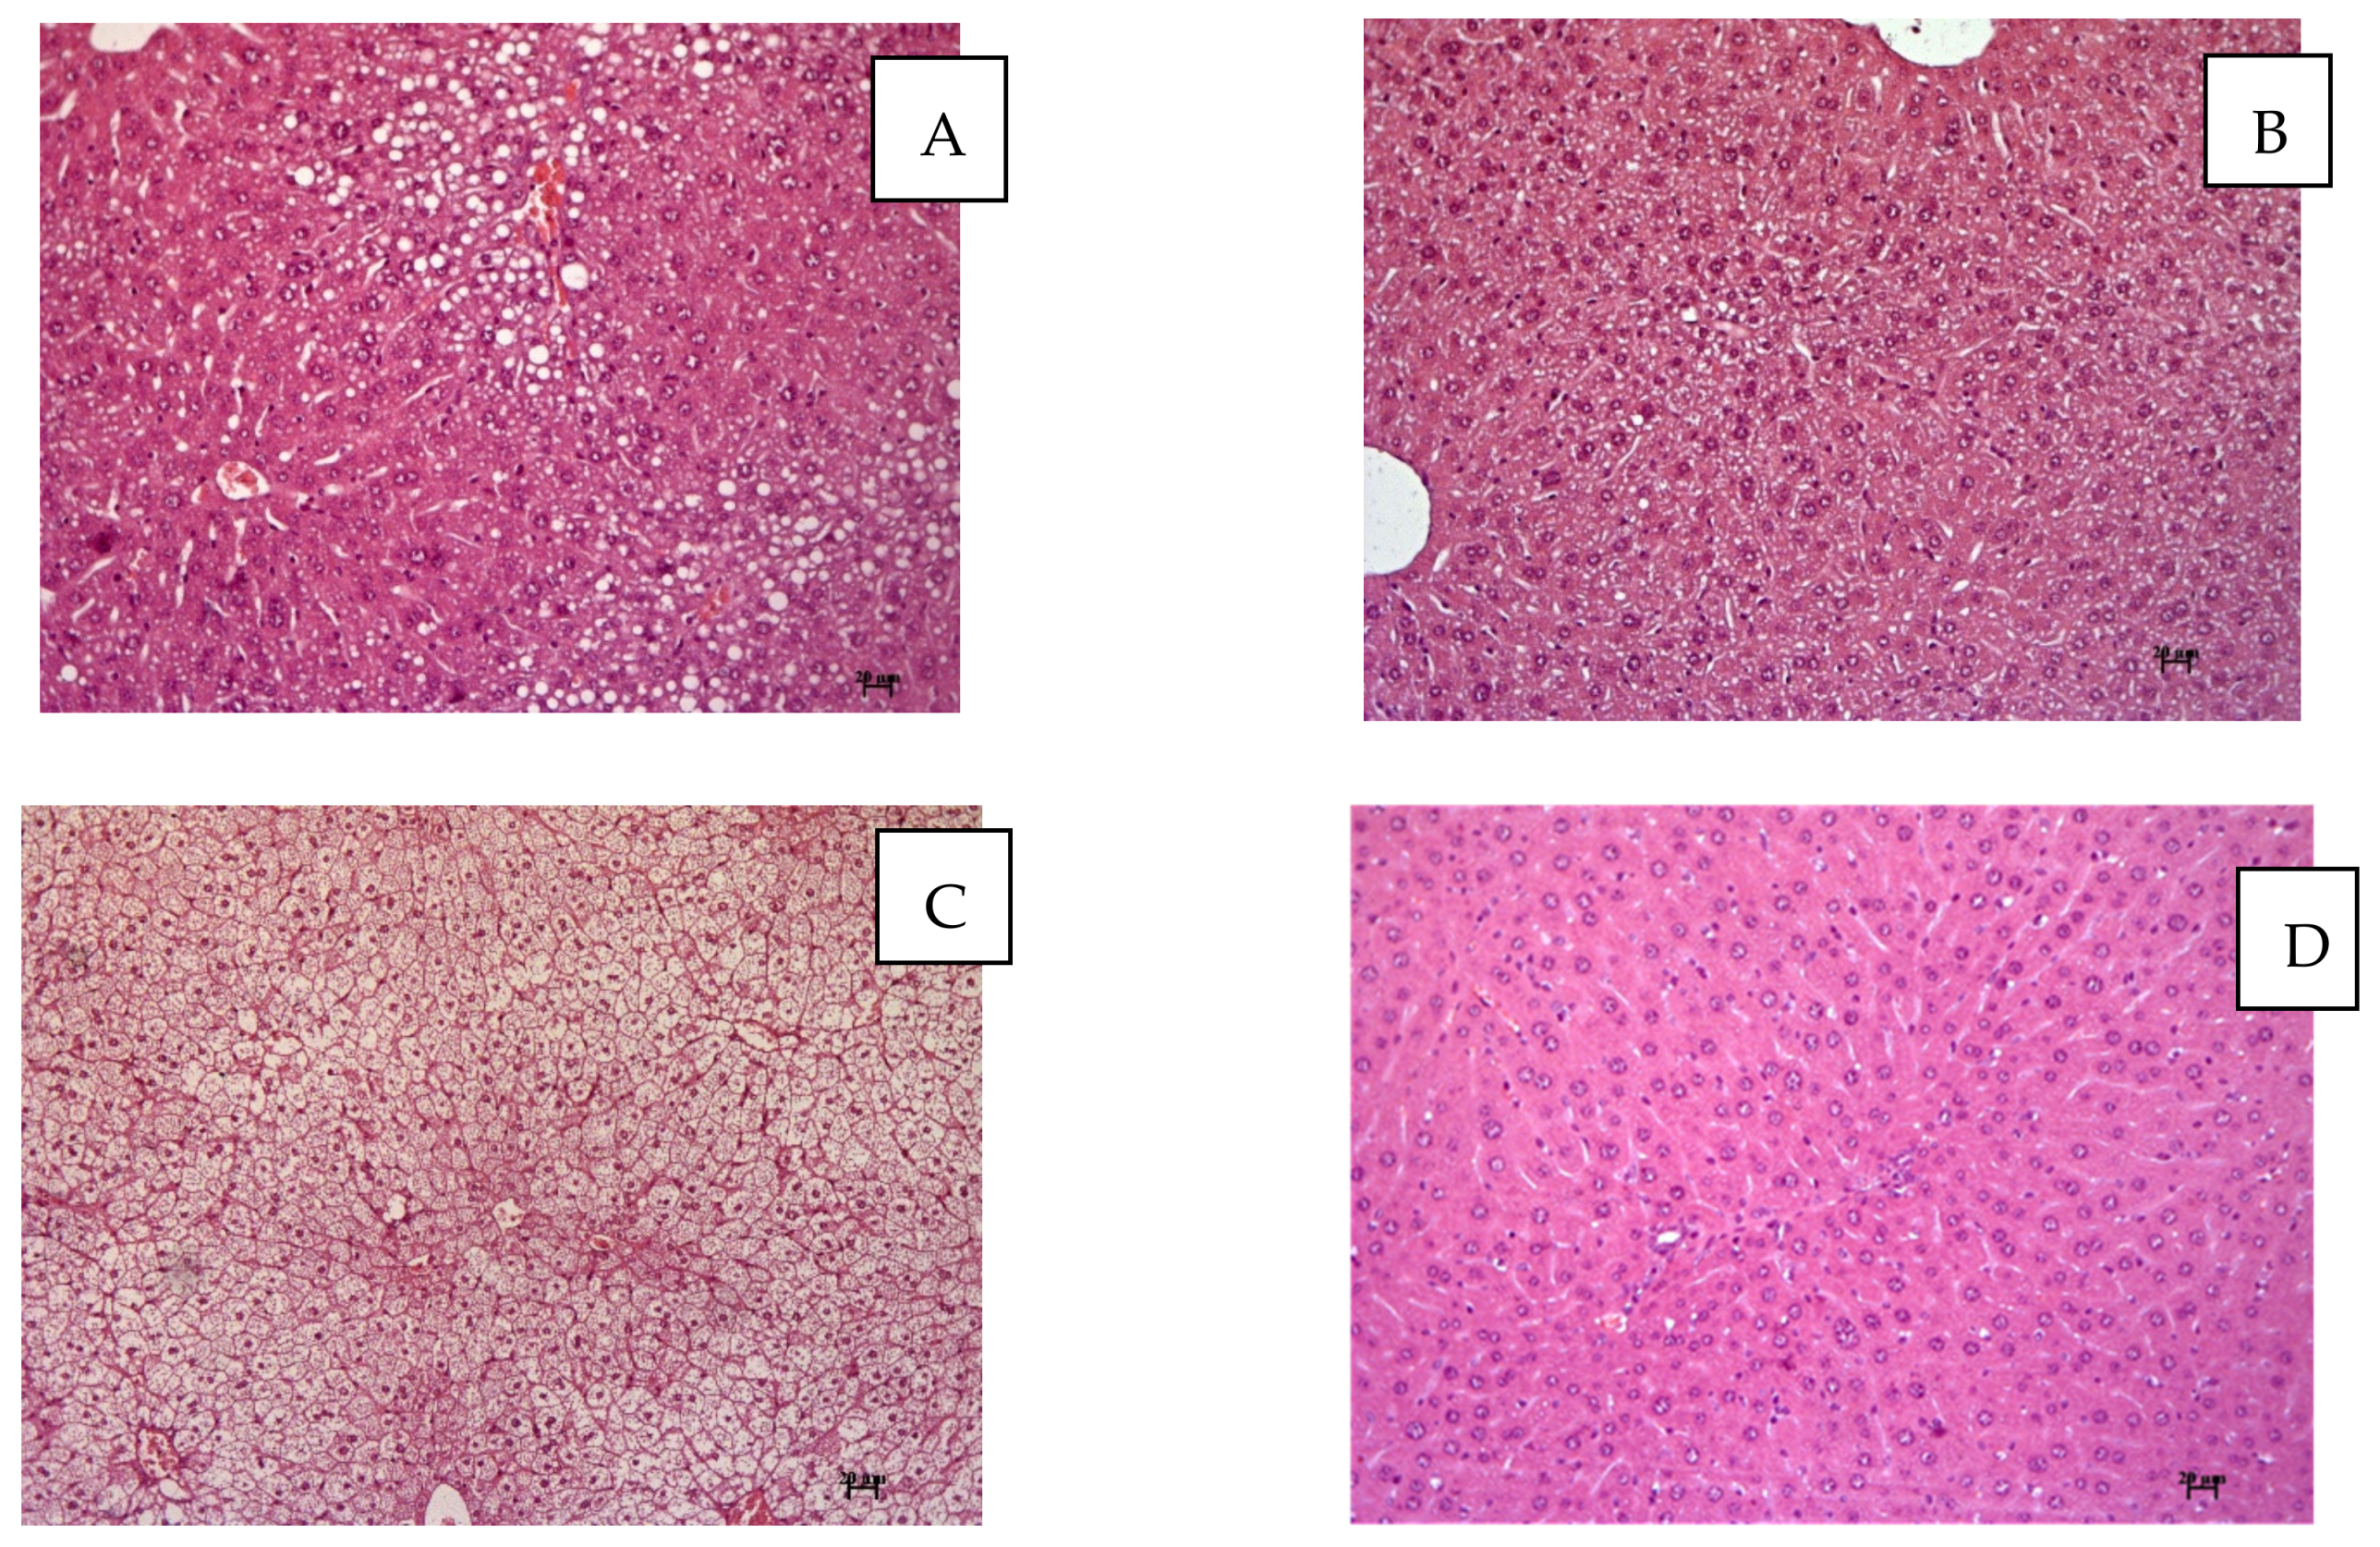
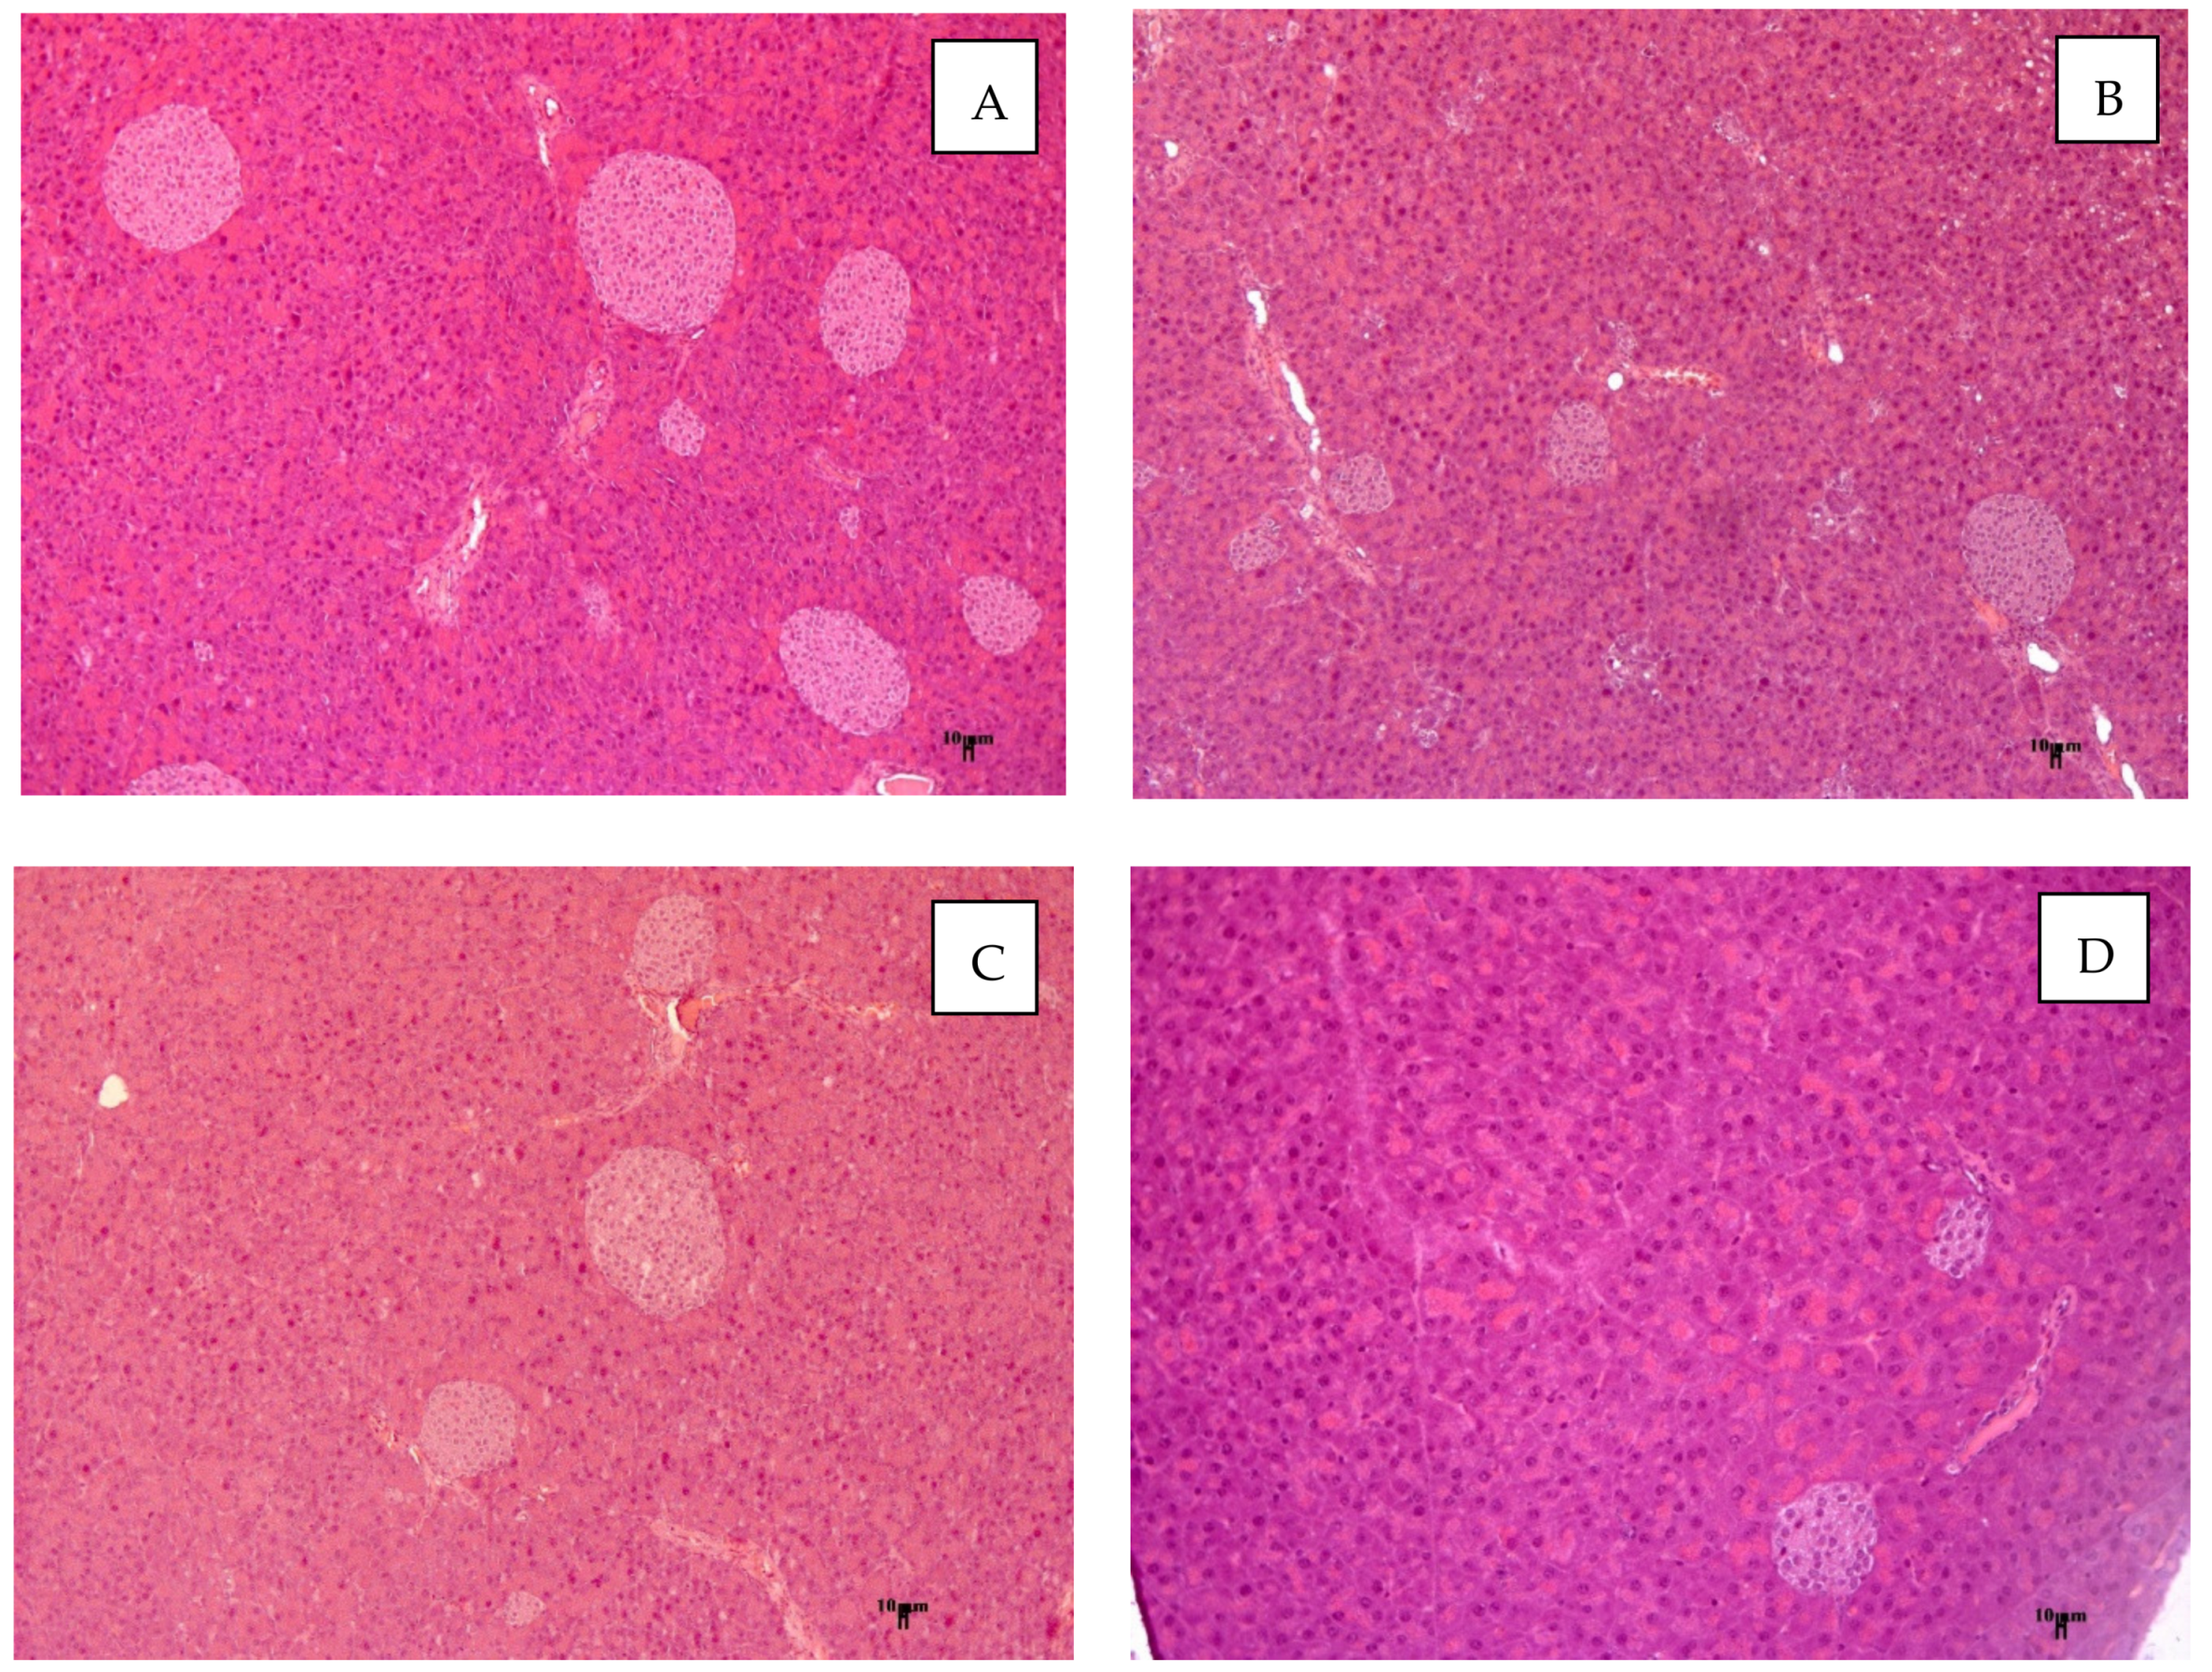
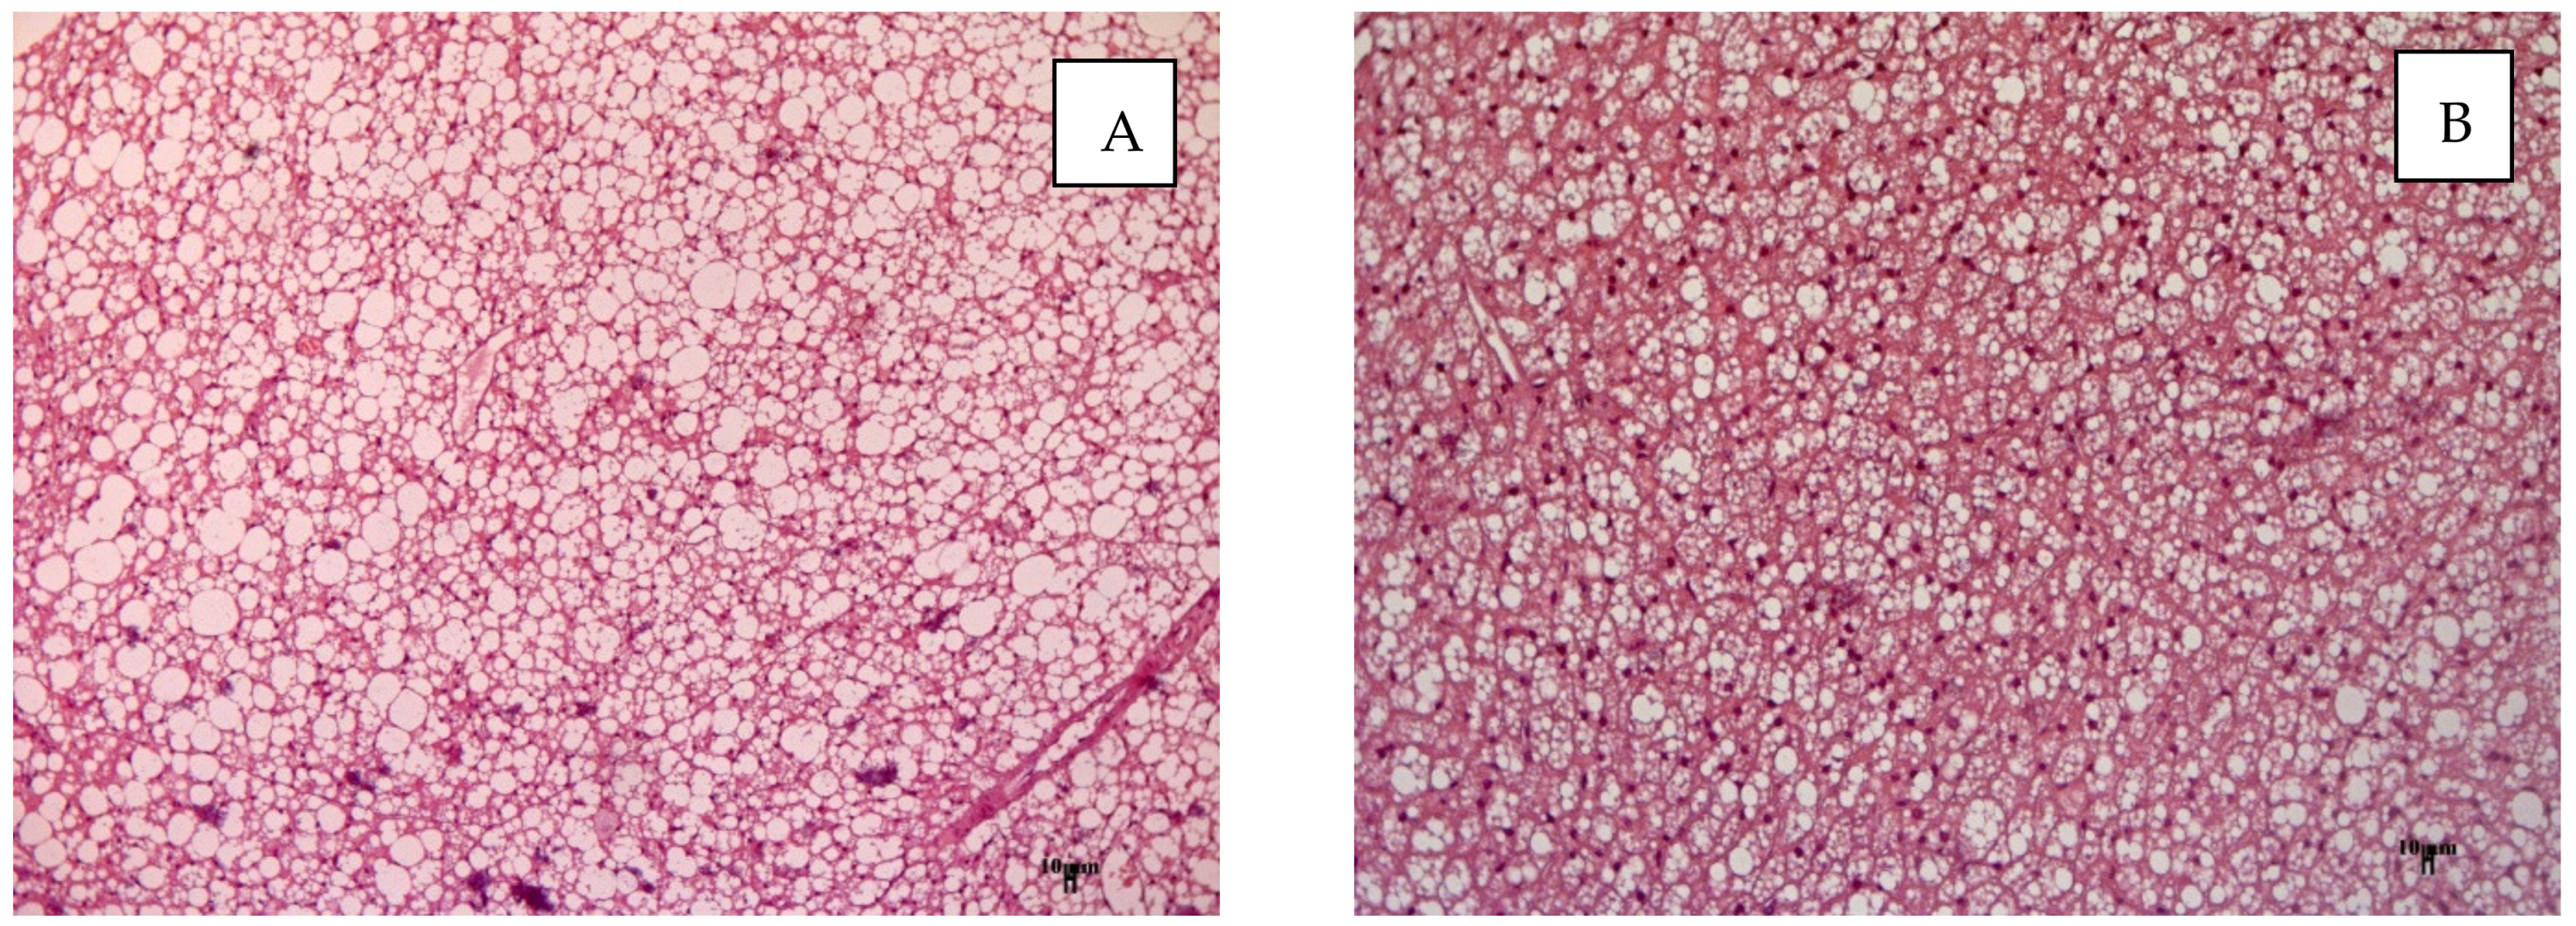
3.9. Histology
4. Discussion
5. Conclusions
Supplementary Materials
Author Contributions
Funding
Institutional Review Board Statement
Data Availability Statement
Acknowledgments
Conflicts of Interest
References
- Roglic, G. WHO Global report on diabetes: A summary. Int. J. Non-Commun. Dis. 2016, 1, 3–8. [Google Scholar] [CrossRef]
- Sonksen, P.; Sonksen, J. Insulin: Understanding its action in health and disease. Br. J. Anaesth. 2000, 85, 69–79. [Google Scholar] [CrossRef] [PubMed] [Green Version]
- American Diabetes Association. 9. Pharmacologic approaches to glycemic treatment: Standards of medical care in diabetes-2019. Diabetes Care 2019, 42, 90–102. [Google Scholar] [CrossRef] [PubMed] [Green Version]
- Vieira, R.; Souto, S.B.; Sánchez-López, E.; Machado, A.L.; Severino, P.; Jose, S.; Santini, A.; Fortuna, A.; García, M.L.; Silva, A.M.; et al. Sugar-lowering drugs for type 2 diabetes mellitus and metabolic syndrome-review of classical and new compounds: Part-I. Pharmaceuticals 2019, 12, 152. [Google Scholar] [CrossRef] [PubMed] [Green Version]
- Pappachan, J.M.; Fernandez, C.J.; Chacko, E.C. Diabesity and antidiabetic drugs. Mol. Asp. Med. 2019, 66, 3–12. [Google Scholar] [CrossRef] [PubMed]
- Khvostov, M.V.; Gladkova, E.D.; Borisov, S.A.; Zhukova, N.A.; Marenina, M.K.; Meshkova, Y.V.; Luzina, O.A.; Tolstikova, T.G.; Salakhutdinov, N.F. Discovery of the first in class 9-N-berberine derivative as hypoglycemic agent with extra-strong action. Pharmaceutics 2021, 13, 2138. [Google Scholar] [CrossRef] [PubMed]
- Tai, M.M. A Mathematical Model for the Determination of Total Area Under Glucose Tolerance and Other Metabolic Curves. Diabetes Care 1994, 17, 152–154. [Google Scholar] [CrossRef] [PubMed] [Green Version]
- Burov, O.N.; Kletskii, M.E.; Fedik, N.S.; Kurbatov, S.V.; Lisovin, A.V. Experimental and quantum-chemical study of nucleophilic substitution mechanism in berberine. Chem. Het. Comp. 2015, 51, 997–1007. [Google Scholar] [CrossRef]
- Ma, Z.; Jiang, L.; Li, B.; Liang, D.; Feng, Y.; Liu, L.; Jiang, C. Discovery of benzimidazole derivatives as potent and selective aldehyde dehydrogenase 1A1 (ALDH1A1) inhibitors with glucose consumption improving activity. Bioorg. Med. Chem. 2021, 46, 116352. [Google Scholar] [CrossRef] [PubMed]
- Wang, J.; Yang, T.; Chen, H.; Xu, Y.-N.; Yu, L.-F.; Liu, T.; Tang, J.; Yi, Z.; Yang, C.-G.; Xue, W.; et al. The synthesis and antistaphylococcal activity of 9, 13-disubstituted berberine derivatives. Eur. J. Med. Chem. 2017, 127, 424–433. [Google Scholar] [CrossRef] [PubMed]
- Seo, E.; Kang, H.; Choi, H.; Choi, W.; Jun, H.S. Reactive oxygen species-induced changes in glucose and lipid metabolism contribute to the accumulation of cholesterol in the liver during aging. Aging Cell. 2019, 18, e12895. [Google Scholar] [CrossRef] [PubMed] [Green Version]
- Ren, G.; Guo, J.H.; Qian, Y.Z.; Kong, W.J.; Jiang, J.D. Berberine improves glucose and lipid metabolism in HepG2 cells through AMPKα1 activation. Front. Pharmacol. 2020, 11, 647. [Google Scholar] [CrossRef] [PubMed]
- Chen, W.; Miao, Y.-Q.; Fan, D.-J.; Yang, S.-S.; Lin, X.; Meng, L.-K.; Tang, X. Bioavailability study of berberine and the enhancing effects of TPGS on intestinal absorption in rats. AAPS Pharmscitech. 2011, 12, 705–711. [Google Scholar] [CrossRef] [PubMed] [Green Version]
- Qi, Y.; Takahashi, N.; Hileman, S.M.; Patel, H.R.; Berg, A.H.; Pajvani, U.B.; Scherer, P.E.; Ahima, R.S. Adiponectin acts in the brain to decrease body weight. Nat. Med. 2004, 10, 524–529. [Google Scholar] [CrossRef] [PubMed]
- Guo, W.; Liu, J.; Cheng, L.; Liu, Z.; Zheng, X.; Liang, H.; Xu, F. Metformin alleviates steatohepatitis in diet induced obese mice in a SIRT1-dependent way. Front. Pharmacol. 2021, 12, 704112. [Google Scholar] [CrossRef] [PubMed]
- Obata, A.; Kubota, N.; Kubota, T.; Iwamoto, M.; Sato, H.; Sakurai, Y.; Takamoto, I.; Katsuyama, H.; Suzuki, Y.; Fukazawa, M.; et al. Tofogliflozin improves insulin resistance in skeletal muscle and accelerates lipolysis in adipose tissue in male mice. Endocrinology 2016, 157, 1029–1042. [Google Scholar] [CrossRef] [PubMed] [Green Version]
- Maier, M.T.; Vilhelmsson, A.; Louie, S.M.; Vagena, E.; Nomura, D.K.; Koliwad, S.K.; Xu, A.W. Regulation of hepatic lipid accumulation and distribution by Agouti-related protein in male mice. Endocrinology 2018, 159, 2408–2420. [Google Scholar] [CrossRef] [PubMed] [Green Version]
- Lovejoy, J.; Newby, F.; Gebhart, S.; DiGirolamo, M. Insulin resistance in obesity is associated with elevated basal lactate levels and diminished lactate appearance following intravenous glucose and insulin. Metabolism 1992, 41, 22–27. [Google Scholar] [CrossRef] [PubMed]
- Singh, N.; Sharma, B. Toxicological effects of berberine and sanguinarine. Front. Mol. Biosci. 2018, 5, 21. [Google Scholar] [CrossRef] [PubMed] [Green Version]
- Miranda, C.S.; Silva-Veiga, F.; Martins, F.F.; Rachid, T.L.; Mandarim-De-Lacerda, C.A.; Souza-Mello, V. PPAR-α activation counters brown adipose tissue whitening: A comparative study between high-fat- and high-fructose-fed mice. Nutrition 2020, 78, 110791. [Google Scholar] [CrossRef] [PubMed]


| Concentration | Berberine | 2a | 2b | 2c | 2d | 2e |
|---|---|---|---|---|---|---|
| 2.5 μM | 92.5 ± 2.8 | 44.4 ± 5.5 | 19.0 ± 0.5 | 69.4 ± 8.0 | 93.7 ± 4.0 | 87.0 ± 6.3 |
| 5 μM | 84.0 ± 8.8 | 61.2 ± 6.8 | 27.6 ± 1.6 | 42.1 ± 16.8 | 84.5 ± 4.5 | 86.6 ± 4.9 |
| 10 μM | 83.6 ± 5.8 | 83.9 ± 5.2 | 80.3 ± 3.1 | 70.8 ± 2.9 | 49.2 ± 5.7 | 74.9 ± 5.8 |
| Dose | 15 mg/kg | 30 mg/kg | ||
|---|---|---|---|---|
| Group | Effect | Mortality | Effect | Mortality |
| 2a | 27.8 | 16.6 | n.d. | n.d. |
| 2b [6] | 25.3 | 0 | n.d. | n.d. |
| 2c | 20.2 | 0 | n.d. | n.d. |
| 2d | 18.3 | 0 | 62.6 | 83.3 |
| 2e | 6.7 | 0 | 39.8 | 16.6 |
| Berberine | - | - | 0 | 0 |
| MF | 2e | AY | C57Bl/6 | |
|---|---|---|---|---|
| 1 week | 29.9 | 23.6 | 23.7 | 23.2 |
| 2 week | 29.8 | 22.0 | 26.2 | 23.6 |
| 3 week | 25.9 | 19.2 | 25.3 | 23.4 |
| 4 week | 26.2 | 17.0 | 23.8 | 23.8 |
| Group | TC, mmol/L | TG, mmol/L | Lactate, mmol/L | ALT, U/L | AST, U/L |
|---|---|---|---|---|---|
| C57Bl/6 | 4.11 ± 0.03 | 1.37 ± 0.02 * | 8.94 ± 0.29 | 13.39 ± 3.36 | 45.39 ± 2.96 |
| AY | 4.03 ± 0.05 | 1.54 ± 0.03 | 8.63 ± 0.11 | 20.25 ± 3.10 | 46.85 ± 2.53 |
| 2e | 4.05 ± 0.09 | 1.43 ± 0.03 * | 9.54 ± 0.39 *,# | 35.50 ± 5.55 *,# | 97.19 ± 22.4 *,# |
| MF | 4.48 ± 0.48 | 1.53 ± 0.09 | 7.93 ± 0.24 * | 15.71 ± 1.50 | 48.89 ± 3.37 |
| Body Mass, g | Liver Mass, g | Gonadal Fat Pad, g | Interscapular Fat Pad, g | Interscapular Brown Fat, g | |
|---|---|---|---|---|---|
| C57Bl/6 | 21.90 ± 0.30 * | 0.85 ± 0.013 * | 0.27 ± 0.02 * | - | 0.06 ± 0.003 * |
| AY | 36.97 ± 2.41 | 1.09 ± 0.05 | 1.99 ± 0.26 | 1.10 ± 0.16 | 0.20 ± 0.009 |
| 2e | 23.43 ± 2.52 * | 1.45 ± 0.36 | 0.95 ± 0.22 * | 0.41 ± 0.10 * | 0.07 ± 0.009 * |
| MF | 32.45 ± 2.01 | 1.07 ± 0.06 | 1.93 ± 0.26 | 0.73 ± 0.12 | 0.13 ± 0.02 * |
Disclaimer/Publisher’s Note: The statements, opinions and data contained in all publications are solely those of the individual author(s) and contributor(s) and not of MDPI and/or the editor(s). MDPI and/or the editor(s) disclaim responsibility for any injury to people or property resulting from any ideas, methods, instructions or products referred to in the content. |
© 2022 by the authors. Licensee MDPI, Basel, Switzerland. This article is an open access article distributed under the terms and conditions of the Creative Commons Attribution (CC BY) license (https://creativecommons.org/licenses/by/4.0/).
Share and Cite
Khvostov, M.V.; Gladkova, E.D.; Borisov, S.A.; Fedotova, M.S.; Zhukova, N.A.; Marenina, M.K.; Meshkova, Y.V.; Valutsa, N.; Luzina, O.A.; Tolstikova, T.G.; et al. 9-N-n-alkyl Berberine Derivatives: Hypoglycemic Activity Evaluation. Pharmaceutics 2023, 15, 44. https://doi.org/10.3390/pharmaceutics15010044
Khvostov MV, Gladkova ED, Borisov SA, Fedotova MS, Zhukova NA, Marenina MK, Meshkova YV, Valutsa N, Luzina OA, Tolstikova TG, et al. 9-N-n-alkyl Berberine Derivatives: Hypoglycemic Activity Evaluation. Pharmaceutics. 2023; 15(1):44. https://doi.org/10.3390/pharmaceutics15010044
Chicago/Turabian StyleKhvostov, Mikhail V., Elizaveta D. Gladkova, Sergey A. Borisov, Marina S. Fedotova, Nataliya A. Zhukova, Mariya K. Marenina, Yulia V. Meshkova, Nicolae Valutsa, Olga A. Luzina, Tatiana G. Tolstikova, and et al. 2023. "9-N-n-alkyl Berberine Derivatives: Hypoglycemic Activity Evaluation" Pharmaceutics 15, no. 1: 44. https://doi.org/10.3390/pharmaceutics15010044