
Physiologically Based Pharmacokinetic Modeling to Describe the CYP2D6 Activity Score-Dependent Metabolism of Paroxetine, Atomoxetine and Risperidone

 ,
, 
Abstract
:1. Introduction
2. Materials and Methods
2.1. Workflow
2.2. Software
2.3. Clinical Study Data
2.4. PBPK Base Model Building
2.5. PBPK Base Model Evaluation
2.6. Local Sensitivity Analysis
2.7. DGI Model Building
2.8. DGI Model Evaluation
3. Results
3.1. PBPK Base Model Building

| Study | Dose [mg] | n | Females [%] | Age [Years] | Weight [kg] | CYP2D6 Status | References | |
|---|---|---|---|---|---|---|---|---|
| Paroxetine | ||||||||
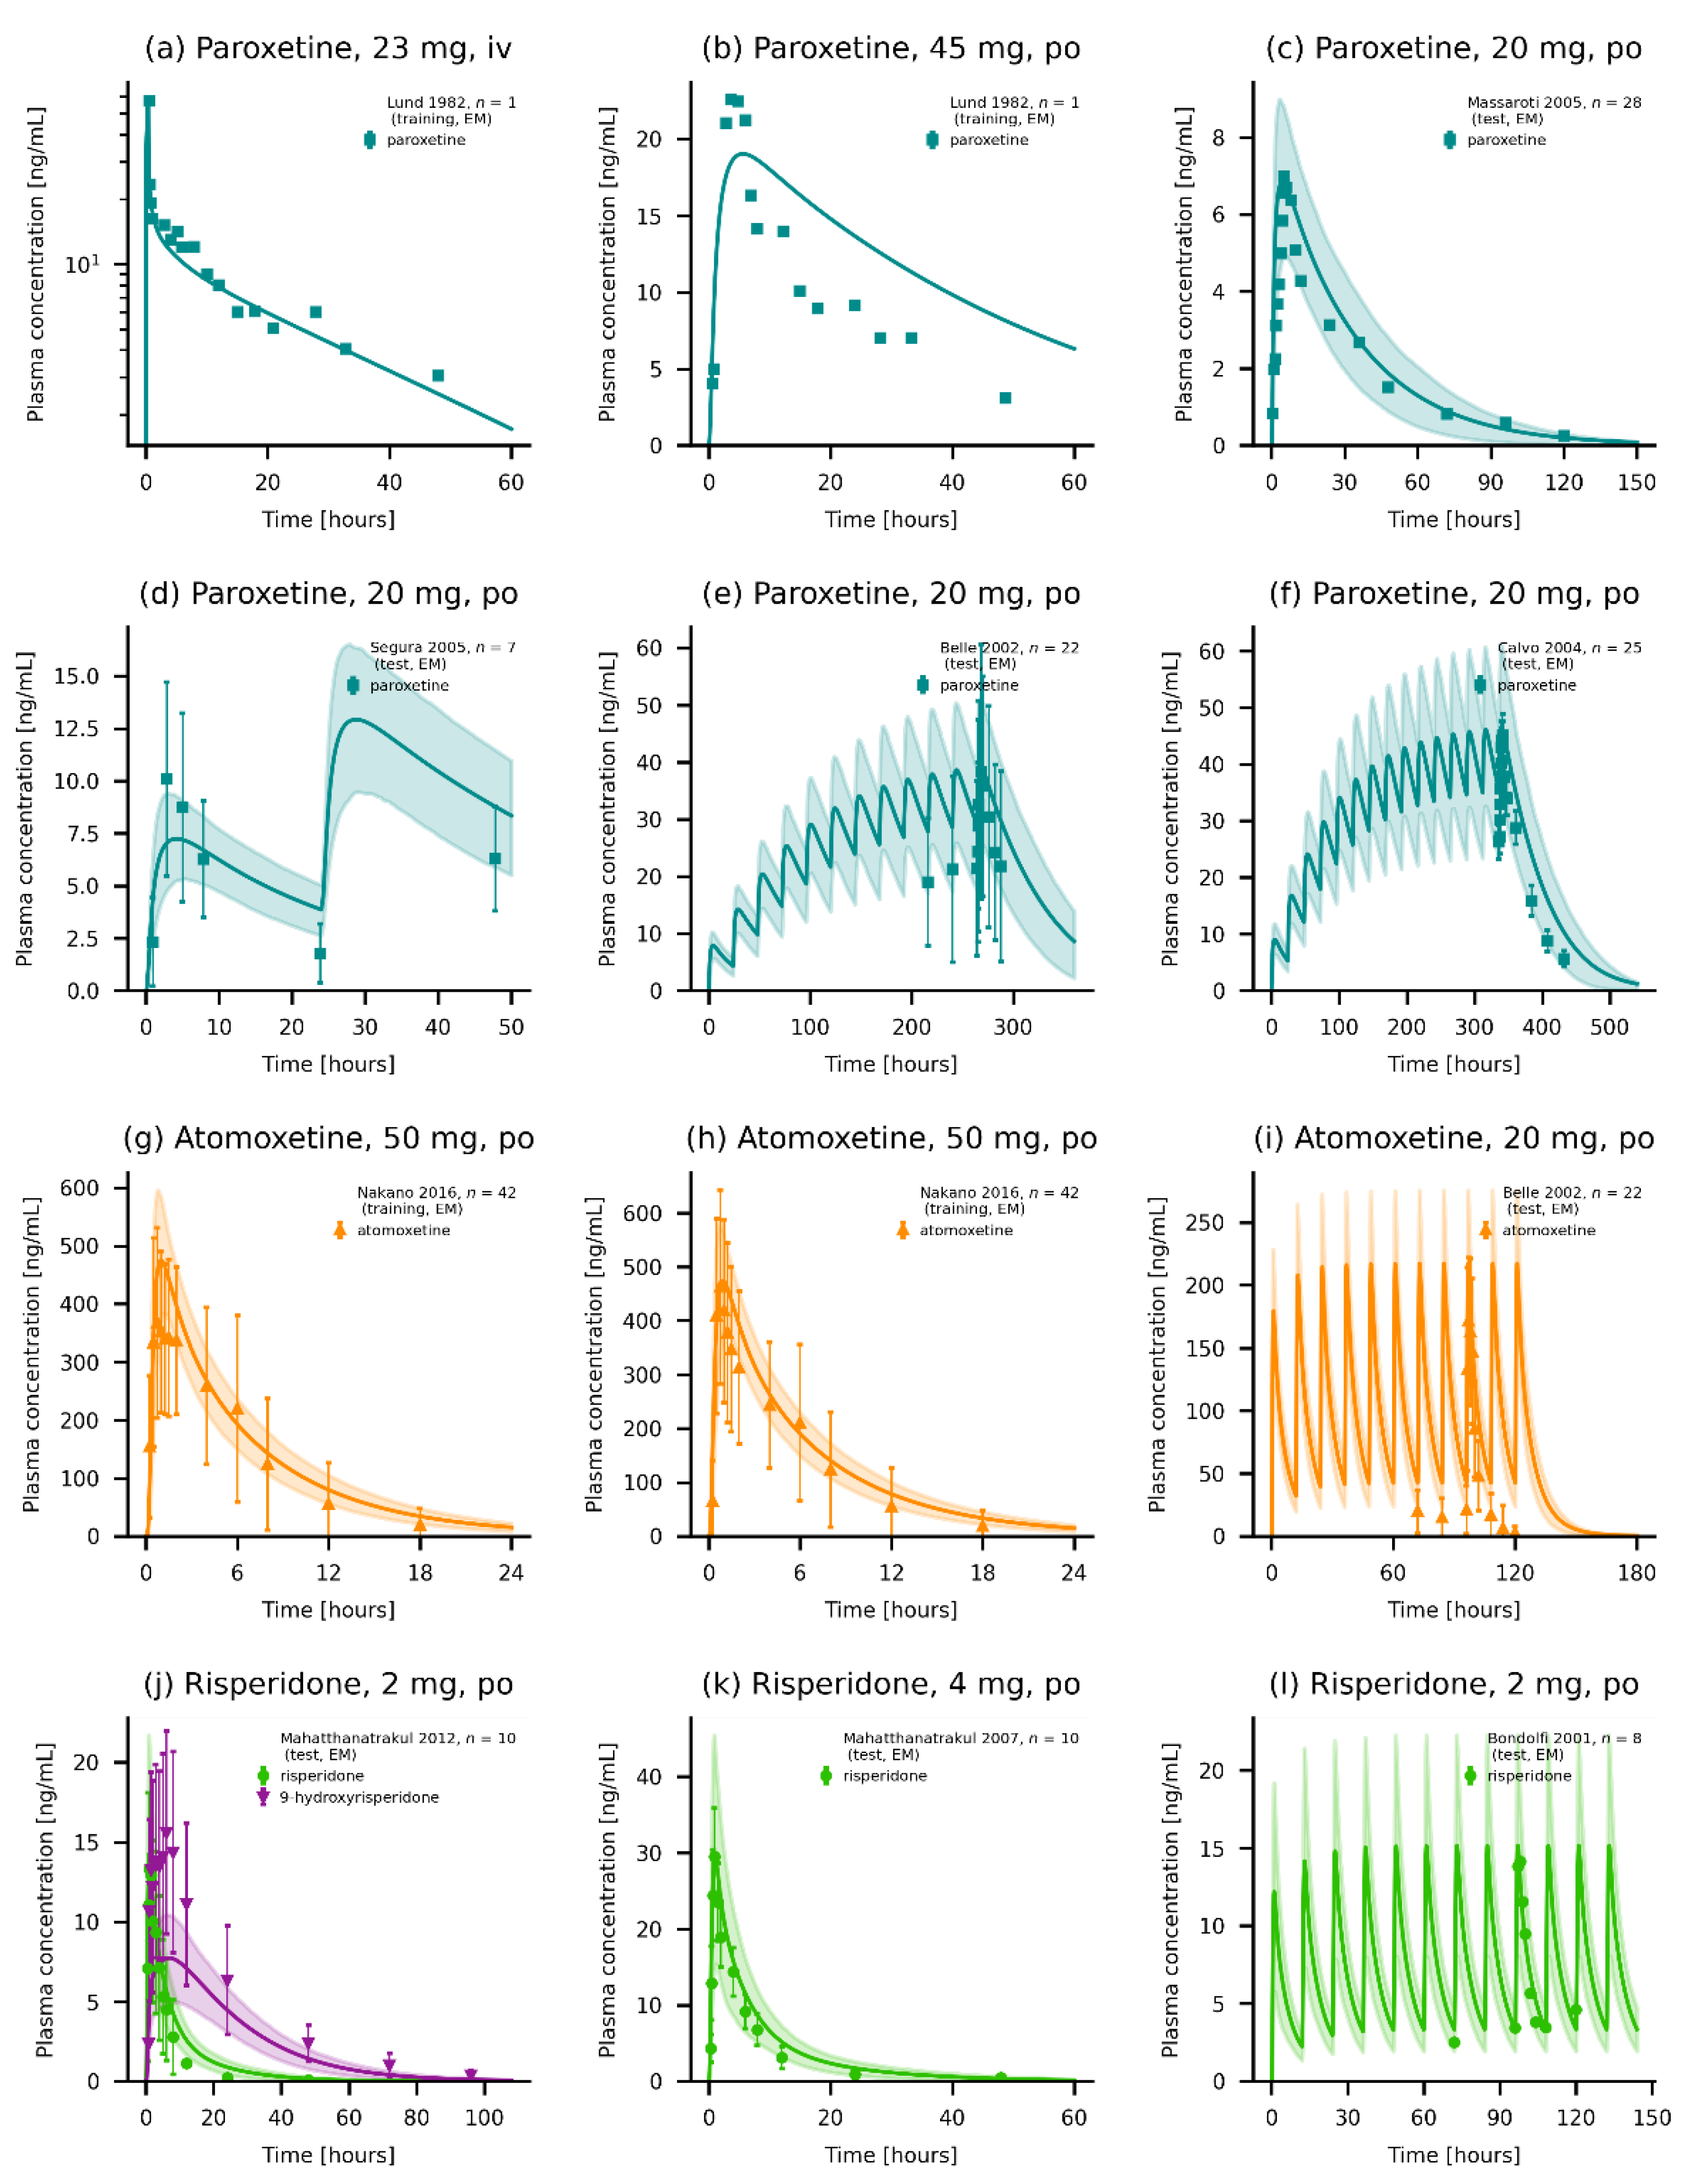
| Belle et al., 2002 | 20, p.o. (tab) | 22 | 23 | 38 (20–49) | - | EM | [25] | |
| Calvo et al., 2004 | 20, p.o. (tab) | 25 | 64 | 26 | 64 | - | [26] | |
| Chen et al., 2015 | 25, p.o. (cr) | 24 | 42 | 26 (18–45) | 61 | 0.5, 1.0, 1.5, 2 | [27] | |
| Lund et al., 1982 | 23–28, i.v. (inf.); 45, p.o. (sol) | 4 | 0 | (24–28) | (66–88) | - | [28] | |
| Massaroti et al., 2005 | 20, p.o. (tab) | 28 | 0 | 28 (18–42) | 72 (57–87) | - | [29] | |
| McClelland et al., 1984 | 70, p.o. (tab) | 28 | 0 | 31 (22–44) | - | - | [30] | |
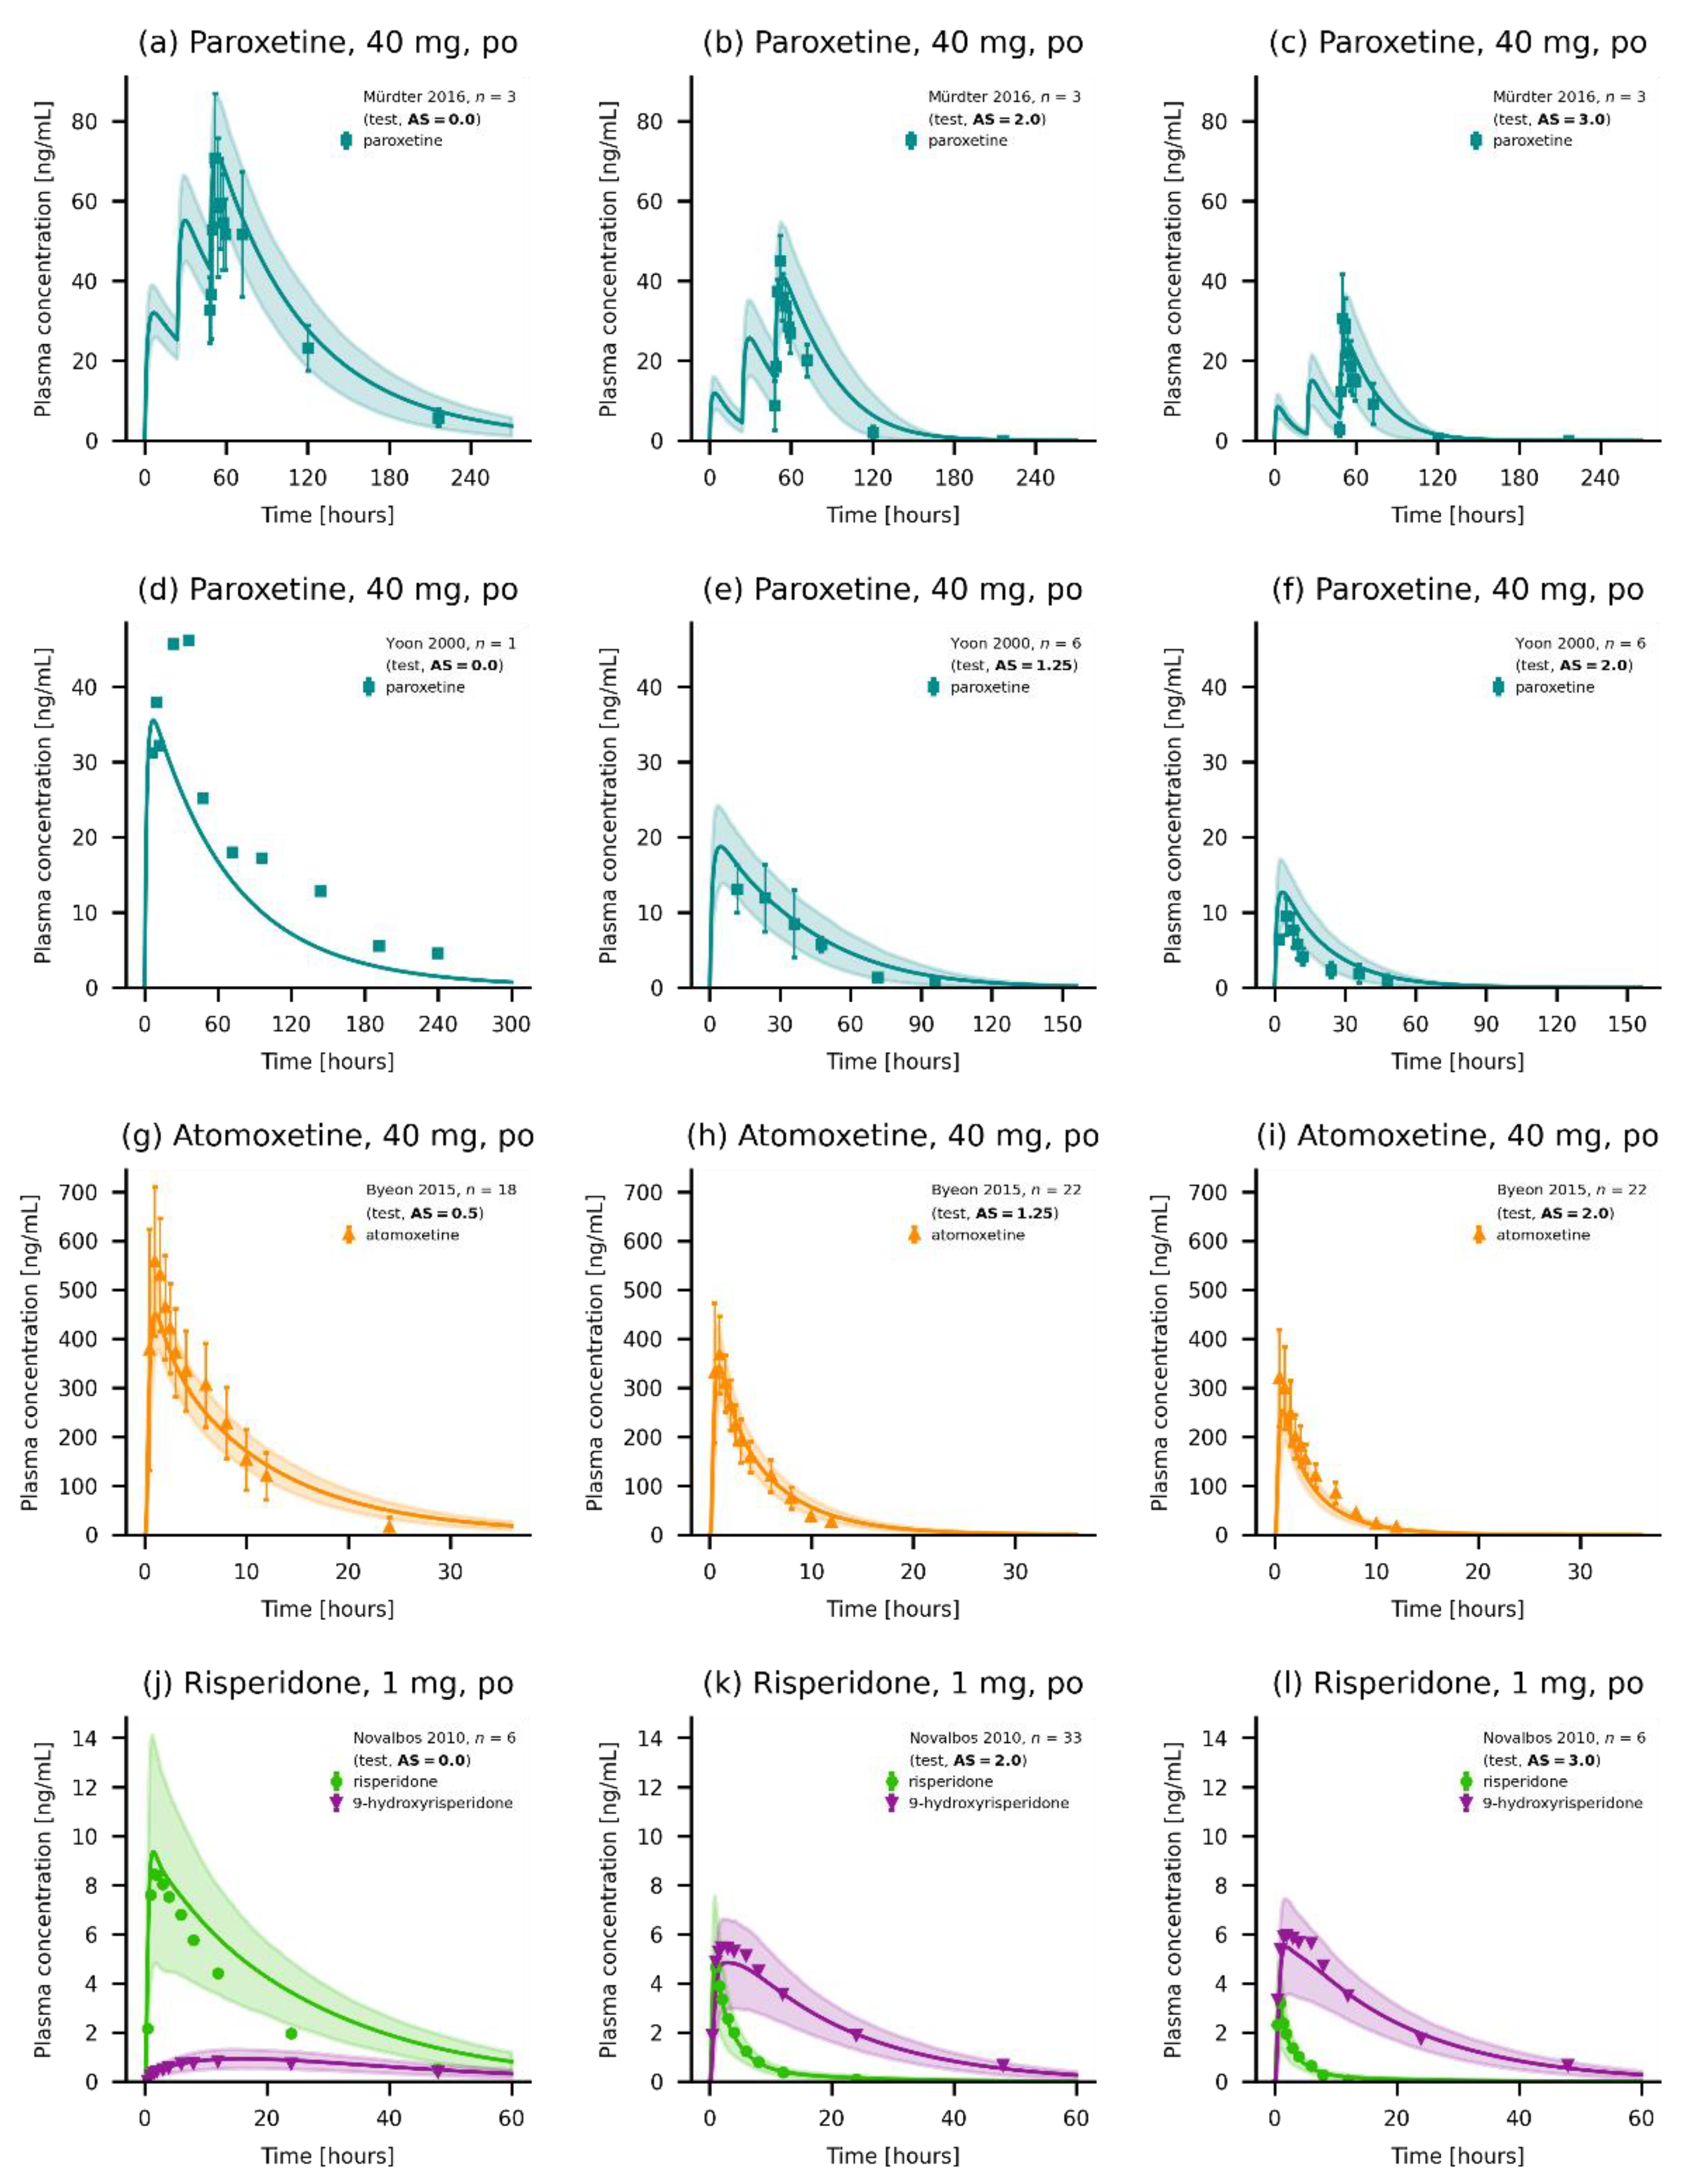
| Mürdter et al., 2016 | 40, p.o. (tab) | 16 | 100 | 26 (21–43) | 61 (48–74) | 0, 0.5, 0.75, 1, 2, 3 | [31,32,33] | |
| Schoedel et al., 2012 | 20, p.o. (tab) | 14 | 14 | 34 (19–55) | 75 | - | [34] | |
| Segura et al., 2005 | 20, p.o. (tab) | 7 | 0 | 23 | 65 | EM | [35] | |
| Sindrup et al., 1992 | 40, p.o. (tab) | 17 | 0 | 25 (20–39) | 77 (65–95) | EM, PM | [36] | |
| van der Lee et al., 2007 | 20, p.o. (tab) | 26 | 69 | 44 (18–64) | 69 (51–89) | EM | [37] | |
| Yasui-Furukori et al., 2006 | 20, p.o. (tab) | 12 | 25 | 25 (20–35) | 58 (46–75) | 1.25 | [38] | |
| Yasui-Furukori et al., 2007 | 20, p.o. (tab) | 13 | 23 | 24 (21–35) | 57 (45–67) | EM | [39] | |
| Yoon et al., 2000 | 40, p.o. (tab) | 16 | 13 | 22 | 64 | 0, 0.5, 1.25, 2 | [40] | |
| Atomoxetine | ||||||||
| Belle et al., 2002 | 20, p.o. (tab) | 22 | 23 | 38 (20–49) | - | EM | [25] | |
| Byeon et al., 2015 | 40, p.o. (tab) | 62 | 0 | 23 | 66 | 0, 1.25, 2 | [41] | |
| Cui et al., 2007 | 40-80, p.o. (tab) | 16 | 33 | (20–29) | (53–72) | 1 | [42] | |
| Kim et al., 2018 | 20, p.o. (tab) | 19 | 0 | (19–25) | (49–73) | 0.5, 2 | [43] | |
| Nakano et al., 2016 | 50, p.o. (tab, sol) | 42 | 0 | 23 (20–37) | 62 (52–76) | EM | [44] | |
| Sauer et al., 2003 | 20, p.o. (tab) | 7 | 0 | 41 (19–54) | - | EM, PM | [45] | |
| Todor et al., 2016 | 40, p.o. (tab) | 30 | 0 | (18–55) | - | EM, PM | [46] | |
| Risperidone | ||||||||
| Bondolfi et al., 2001 | 2, p.o. (tab) | 11 | 27 | 43 (18–63) | - | EM, PM | [47] | |
| Darwish et al., 2015 | 2, p.o. (tab) | 36 | 33 | 32 | 79 | - | [48] | |
| Kim et al., 2008 | 1, p.o. (tab) | 10 | 0 | (23–38) | (65–80) | 1.25 | [49] | |
| Markowitz et al., 2002 | 1, p.o. (tab) | 11 | 21 | 28 (22–42) | - | - | [50] | |
| Mahatthanatrakul 2007 | 4, p.o. (tab) | 10 | 0 | 31 | (55–76) | - | [51] | |
| Mahatthanatrakul 2012 | 2, p.o. (tab) | 10 | 0 | 33 (23–44) | 64 (55–76) | - | [52] | |
| Nakagami et al., 2005 | 1, p.o. (tab) | 12 | 0 | 24 (20–28) | 65 (53–86) | 1 | [53] | |
| Novalbos et al., 2010 | 1, p.o. (tab) | 71 | 51 | 23 (19–34) | 66 (43–106) | 0, 1, 2, 3 | [21,54] |

3.2. PBPK Base Model Evaluation
3.3. Local Sensitivity Analysis
3.4. DGI Model Building
3.5. DGI Model Evaluation
4. Discussion
5. Conclusions
Supplementary Materials
Author Contributions
Funding
Institutional Review Board Statement
Informed Consent Statement
Data Availability Statement
Conflicts of Interest
References
- Eichelbaum, M.; Spannbrucker, N.; Steincke, B.; Dengler, H.J. Defective N-oxidation of sparteine in man: A new pharmacogenetic defect. Eur. J. Clin. Pharmacol. 1979, 16, 183–187. [Google Scholar] [CrossRef] [PubMed]
- Mahgoub, A.; Idle, J.R.; Dring, L.G.; Lancaster, R.; Smith, R.L. Polymorphic hydroxylation of Debrisoquine in man. Lancet 1977, 2, 584–586. [Google Scholar] [CrossRef]
- Zanger, U.M.; Raimundo, S.; Eichelbaum, M. Cytochrome P450 2D6: Overview and update on pharmacology, genetics, biochemistry. Naunyn. Schmiedebergs. Arch. Pharmacol. 2004, 369, 23–37. [Google Scholar] [CrossRef]
- Gaedigk, A.; Sangkuhl, K.; Whirl-Carrillo, M.; Klein, T.; Leeder, J.S. Prediction of CYP2D6 phenotype from genotype across world populations. Genet. Med. 2017, 19, 69–76. [Google Scholar] [CrossRef] [PubMed]
- Caudle, K.E.; Sangkuhl, K.; Whirl-Carrillo, M.; Swen, J.J.; Haidar, C.E.; Klein, T.E.; Gammal, R.S.; Relling, M.V.; Scott, S.A.; Hertz, D.L.; et al. Standardizing CYP 2D6 Genotype to Phenotype Translation: Consensus Recommendations from the Clinical Pharmacogenetics Implementation Consortium and Dutch Pharmacogenetics Working Group. Clin. Transl. Sci. 2020, 13, 116–124. [Google Scholar] [CrossRef]
- Verbelen, M.; Weale, M.E.; Lewis, C.M. Cost-effectiveness of pharmacogenetic-guided treatment: Are we there yet? Pharm. J. 2017, 17, 395–402. [Google Scholar] [CrossRef] [PubMed]
- Haycox, A.; Pirmohamed, M.; McLeod, C.; Houten, R.; Richards, S. Through a Glass Darkly: Economics and Personalised Medicine. Pharmacoeconomics 2014, 32, 1055–1061. [Google Scholar] [CrossRef] [PubMed]
- Gaedigk, A.; Simon, S.; Pearce, R.; Bradford, L.; Kennedy, M.; Leeder, J. The CYP2D6 Activity Score: Translating Genotype Information into a Qualitative Measure of Phenotype. Clin. Pharmacol. Ther. 2008, 83, 234–242. [Google Scholar] [CrossRef]
- van der Lee, M.; Allard, W.G.; Vossen, R.H.A.M.; Baak-Pablo, R.F.; Menafra, R.; Deiman, B.A.L.M.; Deenen, M.J.; Neven, P.; Johansson, I.; Gastaldello, S.; et al. Toward predicting CYP2D6-mediated variable drug response from CYP2D6 gene sequencing data. Sci. Transl. Med. 2021, 13. [Google Scholar] [CrossRef]
- Pharmacogene Variation Consortium (PharmVar) CYP2D6 Gene. Available online: https://www.pharmvar.org/gene/CYP2D6 (accessed on 13 May 2022).
- Nofziger, C.; Turner, A.J.; Sangkuhl, K.; Whirl-Carrillo, M.; Agúndez, J.A.G.; Black, J.L.; Dunnenberger, H.M.; Ruano, G.; Kennedy, M.A.; Phillips, M.S.; et al. PharmVar GeneFocus: CYP2D6. Clin. Pharmacol. Ther. 2020, 107, 154–170. [Google Scholar] [CrossRef]
- Gaedigk, A.; Sangkuhl, K.; Whirl-Carrillo, M.; Twist, G.P.; Klein, T.E.; Miller, N.A. The Evolution of PharmVar. Clin. Pharmacol. Ther. 2019, 105, 29–32. [Google Scholar] [CrossRef] [PubMed]
- Gaedigk, A.; Ingelman-Sundberg, M.; Miller, N.A.; Leeder, J.S.; Whirl-Carrillo, M.; Klein, T.E. The Pharmacogene Variation (PharmVar) Consortium: Incorporation of the Human Cytochrome P450 (CYP) Allele Nomenclature Database. Clin. Pharmacol. Ther. 2018, 103, 399–401. [Google Scholar] [CrossRef] [PubMed]
- Heim, M.; Meyer, U. Genotyping of poor metabolisers of debrisoquine by allele-specific PCR amplification. Lancet 1990, 336, 529–532. [Google Scholar] [CrossRef]
- Rüdesheim, S.; Selzer, D.; Fuhr, U.; Schwab, M.; Lehr, T. Physiologically-based pharmacokinetic modeling of dextromethorphan to investigate interindividual variability within CYP2D6 activity score groups. CPT Pharmacomet. Syst. Pharmacol. 2022, 11, 494–511. [Google Scholar] [CrossRef] [PubMed]
- Lu, S.; Nand, R.A.; Yang, J.S.; Chen, G.; Gross, A.S. Pharmacokinetics of CYP2C9, CYP2C19, and CYP2D6 substrates in healthy Chinese and European subjects. Eur. J. Clin. Pharmacol. 2018, 74, 285–296. [Google Scholar] [CrossRef]
- Rüdesheim, S.; Wojtyniak, J.-G.; Selzer, D.; Hanke, N.; Mahfoud, F.; Schwab, M.; Lehr, T. Physiologically Based Pharmacokinetic Modeling of Metoprolol Enantiomers and α-Hydroxymetoprolol to Describe CYP2D6 Drug-Gene Interactions. Pharmaceutics 2020, 12, 1200. [Google Scholar] [CrossRef]
- Türk, D.; Fuhr, L.M.; Marok, F.Z.; Rüdesheim, S.; Kühn, A.; Selzer, D.; Schwab, M.; Lehr, T. Novel models for the prediction of drug–gene interactions. Expert Opin. Drug Metab. Toxicol. 2021, 17, 1293–1310. [Google Scholar] [CrossRef]
- Wojtyniak, J.G.; Britz, H.; Selzer, D.; Schwab, M.; Lehr, T. Data Digitizing: Accurate and Precise Data Extraction for Quantitative Systems Pharmacology and Physiologically-Based Pharmacokinetic Modeling. CPT Pharmacomet. Syst. Pharmacol. 2020, 9, 322–331. [Google Scholar] [CrossRef]
- Seabold, S.; Perktold, J. Statsmodels: Econometric and Statistical Modeling with Python. In Proceedings of the 9th Python in Science Conference, Austin, TX, USA, 28 June–3 July 2010; pp. 92–96. [Google Scholar] [CrossRef]
- Kneller, L.A.; Abad-Santos, F.; Hempel, G. Physiologically Based Pharmacokinetic Modelling to Describe the Pharmacokinetics of Risperidone and 9-Hydroxyrisperidone According to Cytochrome P450 2D6 Phenotypes. Clin. Pharmacokinet. 2020, 59, 51–65. [Google Scholar] [CrossRef]
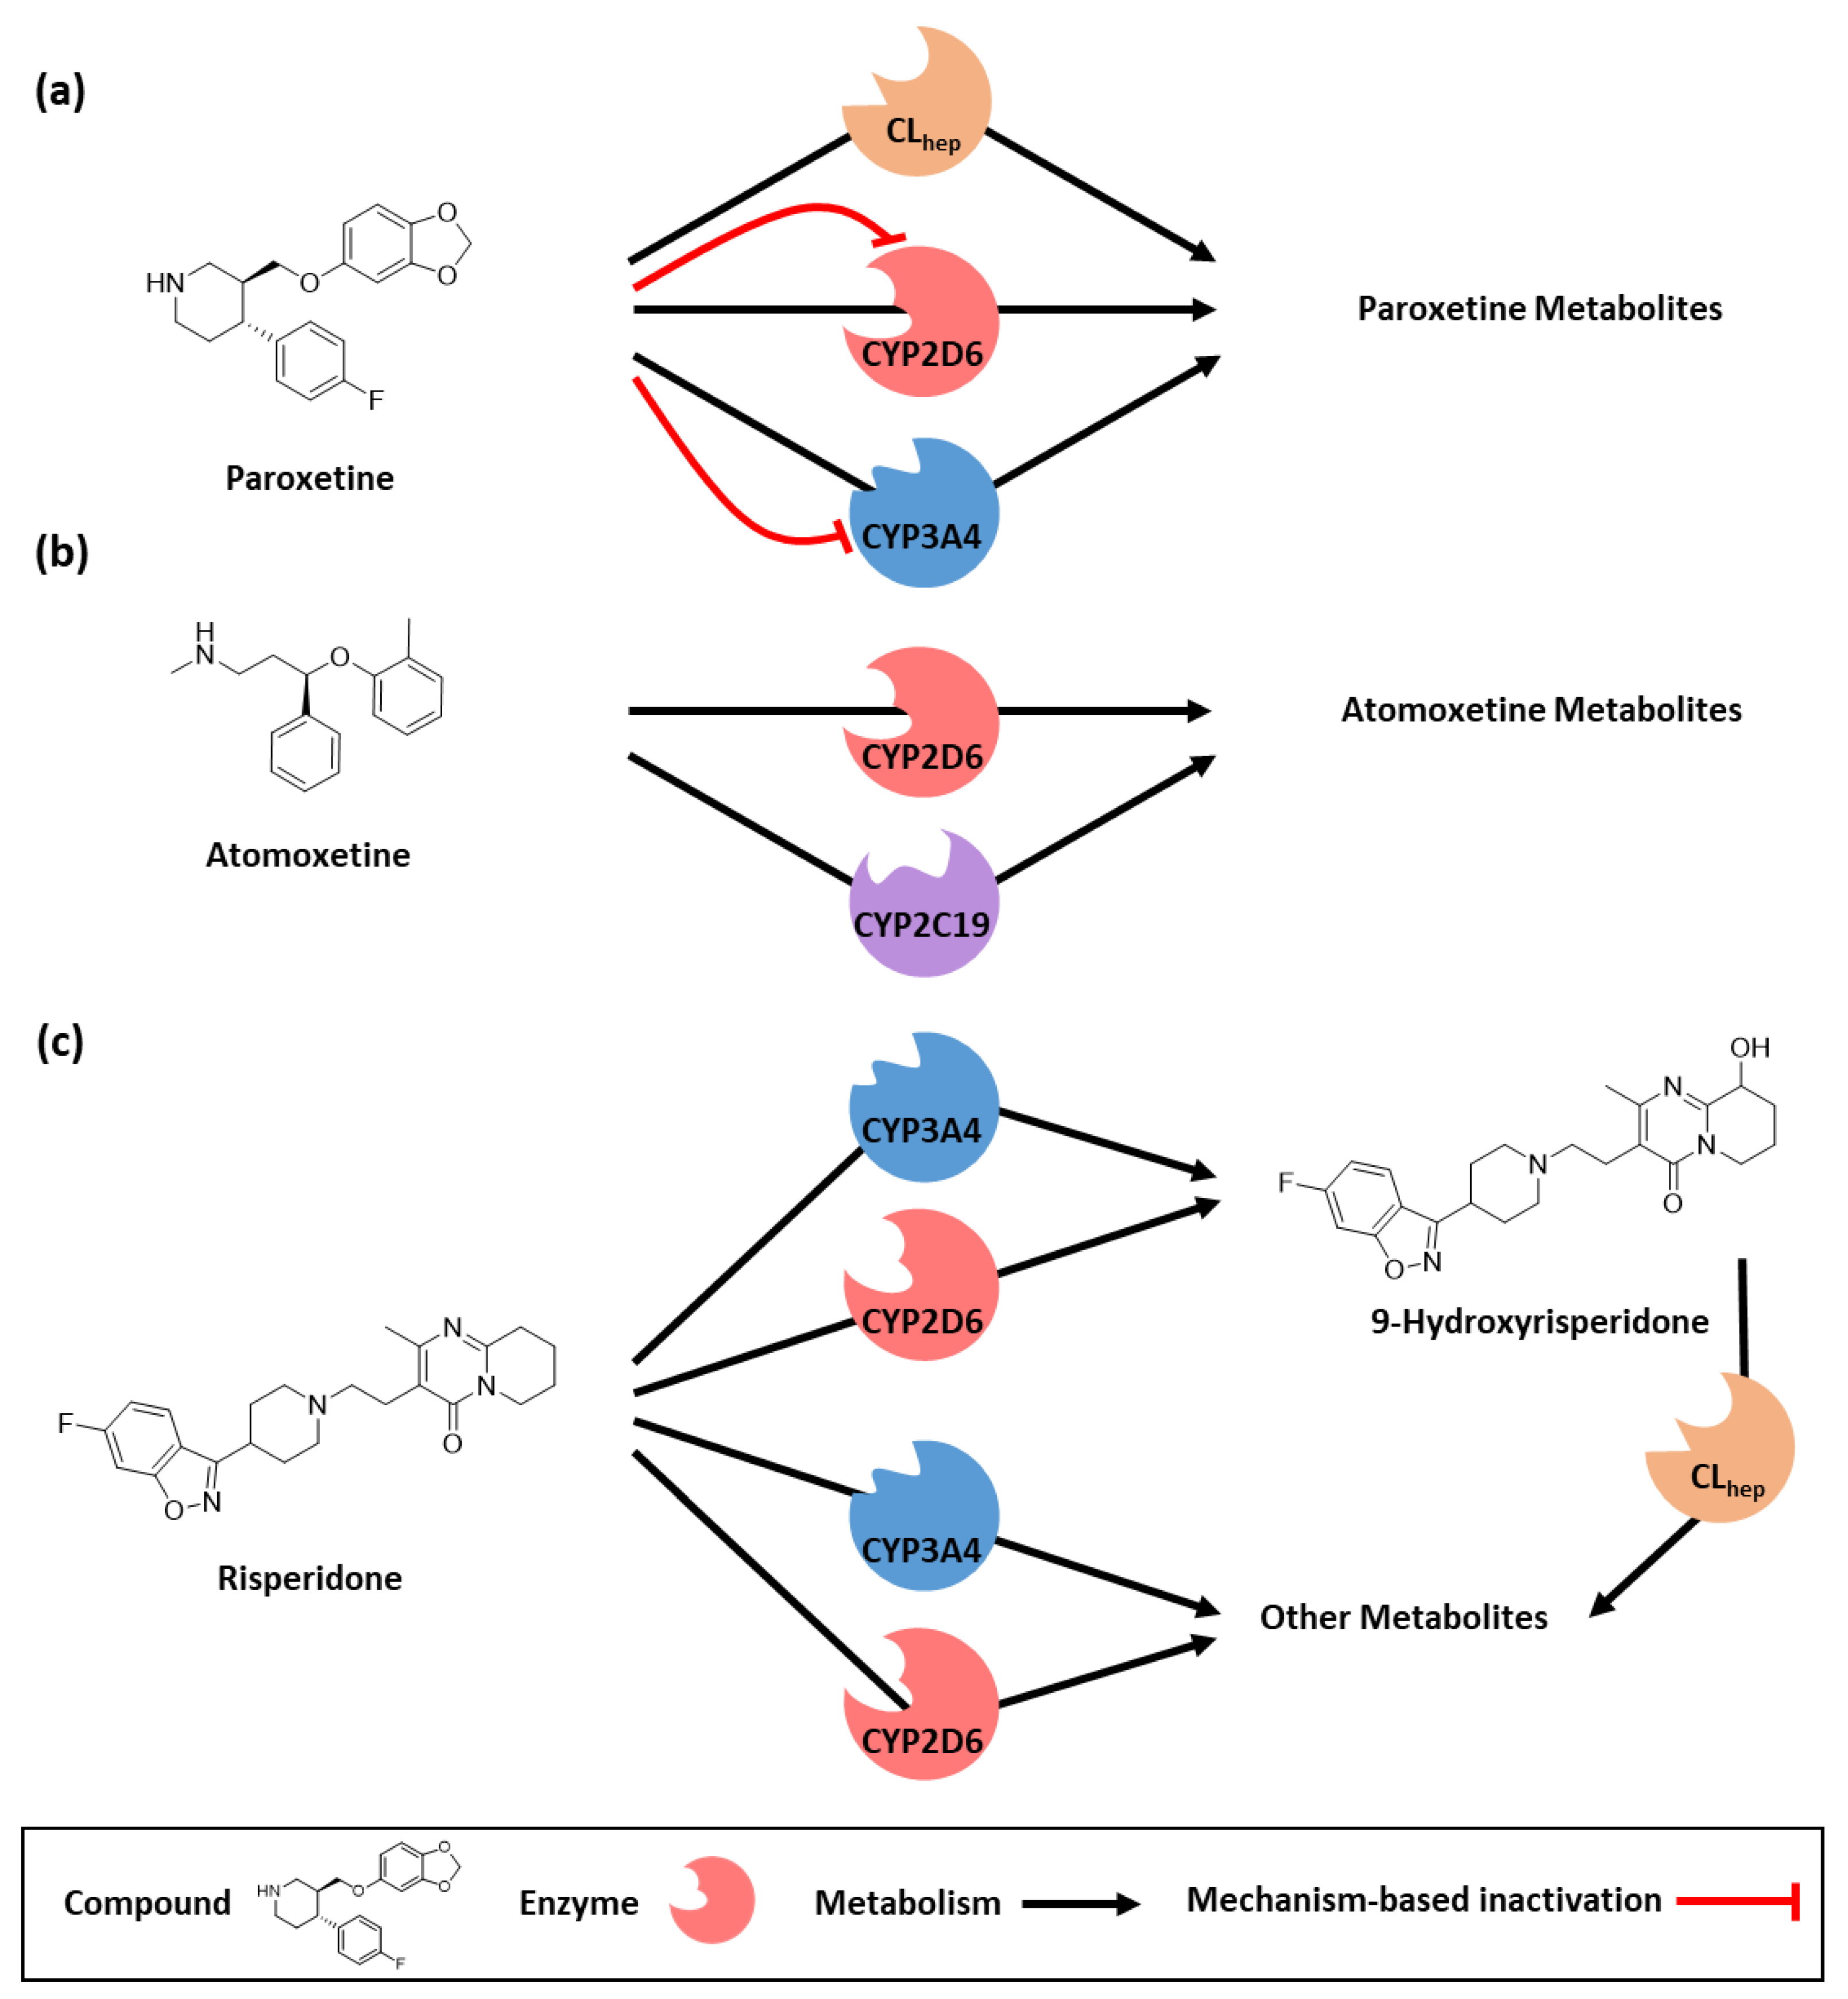
- Jornil, J.; Jensen, K.G.; Larsen, F.; Linnet, K. Identification of Cytochrome P450 Isoforms Involved in the Metabolism of Paroxetine and Estimation of Their Importance for Human Paroxetine Metabolism Using a Population-Based Simulator. Drug Metab. Dispos. 2010, 38, 376–385. [Google Scholar] [CrossRef]
- Obach, R.S.; Walsky, R.L.; Venkatakrishnan, K. Mechanism-Based Inactivation of Human Cytochrome P450 Enzymes and the Prediction of Drug-Drug Interactions. Drug Metab. Dispos. 2007, 35, 246–255. [Google Scholar] [CrossRef] [PubMed]
- Ring, B.J.; Gillespie, J.S.; Eckstein, J.A.; Wrighton, S.A. Identification of the Human Cytochromes P450 Responsible for Atomoxetine Metabolism. Drug Metab. Dispos. 2002, 30, 319–323. [Google Scholar] [CrossRef] [PubMed]
- Belle, D.J.; Ernest, C.S.; Sauer, J.-M.; Smith, B.P.; Thomasson, H.R.; Witcher, J.W. Effect of Potent CYP2D6 Inhibition by Paroxetine on Atomoxetine Pharmacokinetics. J. Clin. Pharmacol. 2002, 42, 1219–1227. [Google Scholar] [CrossRef] [PubMed]
- Calvo, G.; García-Gea, C.; Luque, A.; Morte, A.; Dal-Ré, R.; Barbanoj, M. Lack of pharmacologic interaction between paroxetine and alprazolam at steady state in healthy volunteers. J. Clin. Psychopharmacol. 2004, 24, 268–276. [Google Scholar] [CrossRef] [PubMed]
- Chen, R.; Wang, H.; Shi, J.; Shen, K.; Hu, P. Cytochrome P450 2D6 genotype affects the pharmacokinetics of controlled-release paroxetine in healthy Chinese subjects: Comparison of traditional phenotype and activity score systems. Eur. J. Clin. Pharmacol. 2015, 71, 835–841. [Google Scholar] [CrossRef]
- Lund, J.; Thayssen, P.; Mengel, H.; Pedersen, O.L.; Kristensen, C.B.; Gram, L.F. Paroxetine: Pharmacokinetics and Cardiovascular Effects after Oral and Intravenous Single Doses in Man. Acta Pharmacol. Toxicol. 2009, 51, 351–357. [Google Scholar] [CrossRef]
- Massaroti, P.; Cassiano, N.M.; Duarte, L.F.; Campos, D.R.; Marchioretto, M.A.M.; Bernasconi, G.; Calafatti, S.; Barros, F.A.P.; Meurer, E.C.; Pedrazzoli, J. Validation of a selective method for determination of paroxetine in human plasma by LC-MS/MS. J. Pharm. Pharm. Sci. 2005, 8, 340–347. [Google Scholar]
- McClelland, G.R.; Raptopoulos, P. EEG and blood level of the potential antidepressant paroxetine after a single oral dose to normal volunteers. Psychopharmacology 1984, 83, 327–329. [Google Scholar] [CrossRef]
- Mürdter, T.; Lehr, T.; Igel, S.; Kröner, P.; Ganchev, B.; Schaeffeler, E.; Böhmer, G.; Sonnenberg, M.; Brauch, H.; Kerb, R.; et al. Abstracts of the 82(nd) Annual Meeting of the German Society for Experimental and Clinical Pharmacology and Toxicology (DGPT) and the 18(th) Annual Meeting of the Network Clinical Pharmacology Germany (VKliPha) in cooperation with the Arbeitsgemeinschaft für Angewandte Humanpharmakologie e.V. (AGAH). Naunyn-Schmiedeberg’s Arch. Pharmacol. 2016, 389 (Suppl. S1), 1–104. [Google Scholar] [CrossRef]
- Influence of Pharmacogenetic Factors, Paroxetine and Clarithromycin on Pharmacokinetics of Clomiphene—EudraCT 2009-014531-20. Available online: https://clinicaltrials.gov/ct2/show/NCT01289756 (accessed on 14 June 2022).
- Ganchev, B. Charakterisierung der Metabolischen Bioaktivierung des Clomifens unter Besonderer Berücksichtigung Genetischer Polymorphismen; University of Tübingen: Tübingen, Germany, 2014. [Google Scholar]
- Schoedel, K.A.; Pope, L.E.; Sellers, E.M. Randomized Open-Label Drug-Drug Interaction Trial of Dextromethorphan/Quinidine and Paroxetine in Healthy Volunteers. Clin. Drug Investig. 2012, 32, 157–169. [Google Scholar] [CrossRef]
- Segura, M.; Farré, M.; Pichini, S.; Peiró, A.M.; Roset, P.N.; Ramírez, A.; Ortuño, J.; Pacifici, R.; Zuccaro, P.; Segura, J.; et al. Contribution of cytochrome P450 2D6 to 3,4-methylenedioxymethamphetamine disposition in humans: Use of paroxetine as a metabolic inhibitor probe. Clin. Pharmacokinet. 2005, 44, 649–660. [Google Scholar] [CrossRef] [PubMed]
- Sindrup, S.H.; Brøsen, K.; Gram, L.F.; Hallas, J.; Skjelbo, E.; Allen, A.; Allen, G.D.; Cooper, S.M.; Mellows, G.; Tasker, T.C.G.G.; et al. The relationship between paroxetine and the sparteine oxidation polymorphism. Clin. Pharmacol. Ther. 1992, 51, 278–287. [Google Scholar] [CrossRef] [PubMed]
- van der Lee, M.J.; Blenke, A.A.M.; Rongen, G.A.; Verwey-van Wissen, C.P.W.G.M.; Koopmans, P.P.; Pharo, C.; Burger, D.M. Interaction Study of the Combined Use of Paroxetine and Fosamprenavir-Ritonavir in Healthy Subjects. Antimicrob. Agents Chemother. 2007, 51, 4098–4104. [Google Scholar] [CrossRef] [PubMed]
- Yasui-Furukori, N.; Saito, M.; Inoue, Y.; Niioka, T.; Sato, Y.; Tsuchimine, S.; Kaneko, S. Terbinafine increases the plasma concentration of paroxetine after a single oral administration of paroxetine in healthy subjects. Eur. J. Clin. Pharmacol. 2006, 63, 51–56. [Google Scholar] [CrossRef] [PubMed]
- Yasui-Furukori, N.; Saito, M.; Niioka, T.; Inoue, Y.; Sato, Y.; Kaneko, S. Effect of Itraconazole on Pharmacokinetics of Paroxetine: The Role of Gut Transporters. Ther. Drug Monit. 2007, 29, 45–48. [Google Scholar] [CrossRef] [PubMed]
- Yoon, Y.R.; Cha, I.J.; Shon, J.H.; Kim, K.A.; Cha, Y.N.; Jang, I.J.; Park, C.W.; Shin, S.G.; Flockhart, D.A.; Shin, J.G. Relationship of paroxetine disposition to metoprolol metabolic ratio and CYP2D6*10 genotype of Korean subjects. Clin. Pharmacol. Ther. 2000, 67, 567–576. [Google Scholar] [CrossRef]
- Byeon, J.Y.; Kim, Y.H.; Na, H.S.; Jang, J.H.; Kim, S.H.; Lee, Y.J.; Bae, J.W.; Kim, I.S.; Jang, C.G.; Chung, M.W.; et al. Effects of the CYP2∗ allele on the pharmacokinetics of atomoxetine and its metabolites. Arch. Pharm. Res. 2015, 38, 2083–2091. [Google Scholar] [CrossRef]
- Cui, Y.M.; Teng, C.H.; Pan, A.X.; Yuen, E.; Yeo, K.P.; Zhou, Y.; Zhao, X.; Long, A.J.; Bangs, M.E.; Wise, S.D. Atomoxetine pharmacokinetics in healthy Chinese subjects and effect of the CYP2D6*10 allele. Br. J. Clin. Pharmacol. 2007, 64, 445–449. [Google Scholar] [CrossRef]
- Kim, S.H.; Byeon, J.Y.; Kim, Y.H.; Lee, C.M.; Lee, Y.J.; Jang, C.G.; Lee, S.Y. Physiologically based pharmacokinetic modelling of atomoxetine with regard to CYP2D6 genotypes. Sci. Rep. 2018, 8, 12405. [Google Scholar] [CrossRef]
- Nakano, M.; Witcher, J.; Satoi, Y.; Goto, T. Pharmacokinetic Profile and Palatability of Atomoxetine Oral Solution in Healthy Japanese Male Adults. Clin. Drug Investig. 2016, 36, 903–911. [Google Scholar] [CrossRef]
- Sauer, J.-M.; Ponsler, G.D.; Mattiuz, E.L.; Long, A.J.; Witcher, J.W.; Thomasson, H.R.; Desante, K.A. Disposition and Metabolic Fate of Atomoxetine Hydrochloride: The Role of CYP2D6 in Human Disposition and Metabolism. Drug Metab. Dispos. 2003, 31, 98–107. [Google Scholar] [CrossRef] [PubMed]
- Todor, I.; Popa, A.; Neag, M.; Muntean, D.; Bocsan, C.; Buzoianu, A.; Vlase, L.; Gheldiu, A.-M.; Briciu, C. Evaluation of the Potential Pharmacokinetic Interaction between Atomoxetine and Fluvoxamine in Healthy Volunteers. Pharmacology 2017, 99, 84–88. [Google Scholar] [CrossRef]
- Bondolfi, G.; Eap, C.; Bertschy, G.; Zullino, D.; Vermeulen, A.; Baumann, P. The Effect of Fluoxetine on the Pharmacokinetics and Safety of Risperidone in Psychotic Patients. Pharmacopsychiatry 2002, 35, 50–56. [Google Scholar] [CrossRef] [PubMed]
- Darwish, M.; Bond, M.; Yang, R.; Hellriegel, E.T.; Robertson, P. Evaluation of Potential Pharmacokinetic Drug-Drug Interaction Between Armodafinil and Risperidone in Healthy Adults. Clin. Drug Investig. 2015, 35, 725–733. [Google Scholar] [CrossRef] [PubMed]
- Kim, K.-A.; Park, P.-W.; Liu, K.-H.; Kim, K.-B.; Lee, H.-J.; Shin, J.-G.; Park, J.-Y. Effect of Rifampin, an Inducer of CYP3A and P-glycoprotein, on the Pharmacokinetics of Risperidone. J. Clin. Pharmacol. 2008, 48, 66–72. [Google Scholar] [CrossRef]
- Markowitz, J.S.; DeVane, C.L.; Liston, H.L.; Boulton, D.W.; Risch, S.C. The effects of probenecid on the disposition of risperidone and olanzapine in healthy volunteers. Clin. Pharmacol. Ther. 2002, 71, 30–38. [Google Scholar] [CrossRef] [PubMed]
- Mahatthanatrakul, W.; Nontaput, T.; Ridtitid, W.; Wongnawa, M.; Sunbhanich, M. Rifampin, a cytochrome P450 3A inducer, decreases plasma concentrations of antipsychotic risperidone in healthy volunteers. J. Clin. Pharm. Ther. 2007, 32, 161–167. [Google Scholar] [CrossRef]
- Mahatthanatrakul, W.; Sriwiriyajan, S.; Ridtitid, W.; Boonleang, J.; Wongnawa, M.; Rujimamahasan, N.; Pipatrattanaseree, W. Effect of cytochrome P450 3A4 inhibitor ketoconazole on risperidone pharmacokinetics in healthy volunteers. J. Clin. Pharm. Ther. 2012, 37, 221–225. [Google Scholar] [CrossRef]
- Nakagami, T.; Yasui-Furukori, N.; Saito, M.; Tateishi, T.; Kaneo, S. Effect of verapamil on pharmacokinetics and pharmacodynamics of risperidone: In vivo evidence of involvement of P-glycoprotein in risperidone disposition. Clin. Pharmacol. Ther. 2005, 78, 43–51. [Google Scholar] [CrossRef]
- Novalbos, J.; López-Rodríguez, R.; Román, M.; Gallego-Sandín, S.; Ochoa, D.; Abad-Santos, F. Effects of CYP2D6 Genotype on the Pharmacokinetics, Pharmacodynamics, and Safety of Risperidone in Healthy Volunteers. J. Clin. Psychopharmacol. 2010, 30, 504–511. [Google Scholar] [CrossRef]
- Bertelsen, K.M.; Venkatakrishnan, K.; von Moltke, L.L.; Obach, R.S.; Greenblatt, D.J. Apparent Mechanism-based Inhibition of Human CYP2D6 in Vitro by Paroxetine: Comparison with Fluoxetine and Quinidine. Drug Metab. Dispos. 2003, 31, 289–293. [Google Scholar] [CrossRef] [PubMed]
- Okubo, M.; Morita, S.; Murayama, N.; Akimoto, Y.; Goto, A.; Yamazaki, H. Individual differences in in vitro and in vivo metabolic clearances of antipsychotic risperidone from Japanese subjects genotyped for cytochrome P450 2D6 and 3A5. Hum. Psychopharmacol. Clin. Exp. 2016, 31, 93–102. [Google Scholar] [CrossRef] [PubMed]
- Todor, I.; Popa, A.; Neag, M.; Muntean, D.; Bocsan, C.; Buzoianu, A.; Vlase, L.; Gheldiu, A.-M.; Briciu, C. Evaluation of a Potential Metabolism-Mediated Drug-Drug Interaction Between Atomoxetine and Bupropion in Healthy Volunteers. J. Pharm. Pharm. Sci. 2016, 19, 198–207. [Google Scholar] [CrossRef] [PubMed]
- Guest, E.J.; Aarons, L.; Houston, J.B.; Rostami-Hodjegan, A.; Galetin, A. Critique of the Two-Fold Measure of Prediction Success for Ratios: Application for the Assessment of Drug-Drug Interactions. Drug Metab. Dispos. 2011, 39, 170–173. [Google Scholar] [CrossRef]
- Xu, M.; Zheng, L.; Zeng, J.; Xu, W.; Jiang, X.; Wang, L. Physiologically based pharmacokinetic modeling of tramadol to inform dose adjustment and drug-drug interactions according to CYP2D6 phenotypes. Pharmacotherapy 2021, 41, 277–290. [Google Scholar] [CrossRef]
- Ke, A.B.; Nallani, S.C.; Zhao, P.; Rostami-Hodjegan, A.; Isoherranen, N.; Unadkat, J.D. A physiologically based pharmacokinetic model to predict disposition of CYP2D6 and CYP1A2 metabolized drugs in pregnant women. Drug Metab. Dispos. 2013, 41, 801–813. [Google Scholar] [CrossRef]
- Gaedigk, A.; Dinh, J.; Jeong, H.; Prasad, B.; Leeder, J. Ten Years’ Experience with the CYP2D6 Activity Score: A Perspective on Future Investigations to Improve Clinical Predictions for Precision Therapeutics. J. Pers. Med. 2018, 8, 15. [Google Scholar] [CrossRef]
- Shen, H.; He, M.M.; Liu, H.; Wrighton, S.A.; Wang, L.; Guo, B.; Li, C. Comparative metabolic capabilities and inhibitory profiles of CYP2D6.1, CYP2D6.10, and CYP2D6.17. Drug Metab. Dispos. 2007, 35, 1292–1300. [Google Scholar] [CrossRef]
- Cai, W.-M.; Nikoloff, D.M.; Pan, R.-M.; de Leon, J.; Fanti, P.; Fairchild, M.; Koch, W.H.; Wedlund, P.J. CYP2D6 genetic variation in healthy adults and psychiatric African-American subjects: Implications for clinical practice and genetic testing. Pharm. J. 2006, 6, 343–350. [Google Scholar] [CrossRef]
- Uhr, M.; Grauer, M.T.; Holsboer, F. Differential enhancement of antidepressant penetration into the brain in mice with abcb1ab (mdr1ab) P-Glycoprotein gene disruption. Biol. Psychiatry 2003, 54, 840–846. [Google Scholar] [CrossRef]
- Feng, B.; Mills, J.B.; Davidson, R.E.; Mireles, R.J.; Janiszewski, J.S.; Troutman, M.D.; De Morais, S.M. In vitro P-glycoprotein assays to predict the in vivo interactions of P-glycoprotein with drugs in the central nervous system. Drug Metab. Dispos. 2008, 36, 268–275. [Google Scholar] [CrossRef] [PubMed]
- Gex-Fabry, M.; Eap, C.B.; Oneda, B.; Gervasoni, N.; Aubry, J.M.; Bondolfi, G.; Bertschy, G. CYP2D6 and ABCB1 Genetic variability: Influence on paroxetine plasma level and therapeutic response. Ther. Drug Monit. 2008, 30, 474–482. [Google Scholar] [CrossRef] [PubMed]
- Sauer, J.-M.; Long, A.J.; Ring, B.; Gillespie, J.S.; Sanburn, N.P.; DeSante, K.A.; Petullo, D.; VandenBranden, M.R.; Jensen, C.B.; Wrighton, S.A.; et al. Atomoxetine hydrochloride: Clinical drug-drug interaction prediction and outcome. J. Pharmacol. Exp. Ther. 2004, 308, 410–418. [Google Scholar] [CrossRef] [PubMed]
- Choi, C.I.; Bae, J.W.; Lee, Y.J.; Lee, H.I.; Jang, C.G.; Lee, S.Y. Effects of CYP2C19 genetic polymorphisms on atomoxetine pharmacokinetics. J. Clin. Psychopharmacol. 2014, 34, 139–142. [Google Scholar] [CrossRef]
- Ejsing, T.B.; Pedersen, A.D.; Linnet, K. P-glycoprotein interaction with risperidone and 9-OH-risperidone studied in vitro, in knock-out mice and in drug-drug interaction experiments. Hum. Psychopharmacol. Clin. Exp. 2005, 20, 493–500. [Google Scholar] [CrossRef]
- Nasrallah, H.A. Atypical antipsychotic-induced metabolic side effects: Insights from receptor-binding profiles. Mol. Psychiatry 2008, 13, 27–35. [Google Scholar] [CrossRef]
- Agrawal, N. Determination of Paroxetine in Pharmaceutical Preparations Using HPLC with Electrochemical Detection. Open Anal. Chem. J. 2013, 7, 1–5. [Google Scholar] [CrossRef]
- Austin, R.P.; Barton, P.; Cockroft, S.L.; Wenlock, M.C.; Riley, R.J. The influence of nonspecific microsomal binding on apparent intrinsic clearance, and its prediction from physicochemical properties. Drug Metab. Dispos. 2002, 30, 1497–1503. [Google Scholar] [CrossRef]
- Berezhkovskiy, L.M. Volume of distribution at steady state for a linear pharmacokinetic system with peripheral elimination. J. Pharm. Sci. 2004, 93, 1628–1640. [Google Scholar] [CrossRef]
- Hanke, N.; Frechen, S.; Moj, D.; Britz, H.; Eissing, T.; Wendl, T.; Lehr, T. PBPK Models for CYP3A4 and P-gp DDI Prediction: A Modeling Network of Rifampicin, Itraconazole, Clarithromycin, Midazolam, Alfentanil, and Digoxin. CPT Pharmacomet. Syst. Pharmacol. 2018, 7, 647–659. [Google Scholar] [CrossRef]
- Greenblatt, D.J.; von Moltke, L.L.; Harmatz, J.S.; Chen, G.; Weemhoff, J.L.; Jen, C.; Kelley, C.J.; LeDuc, B.W.; Zinny, M.A. Time course of recovery of cytochrome p450 3A function after single doses of grapefruit juice. Clin. Pharmacol. Ther. 2003, 74, 121–129. [Google Scholar] [CrossRef]
- Kawai, R.; Lemaire, M.; Steimer, J.L.; Bruelisauer, A.; Niederberger, W.; Rowland, M. Physiologically based pharmacokinetic study on a cyclosporin derivative, SDZ IMM 125. J. Pharmacokinet. Biopharm. 1994, 22, 327–365. [Google Scholar] [CrossRef] [PubMed]
- Kaye, C.M.; Haddock, R.E.; Langley, P.F.; Mellows, G.; Tasker, T.C.G.; Zussman, B.D.; Greb, W.H. A review of the metabolism and pharmacokinetics of paroxetine in man. Acta Psychiatr. Scand. 1989, 80, 60–75. [Google Scholar] [CrossRef]
- Khatavkar, U.N.; Jayaram Kumar, K.; Shimpi, S.L. Novel approaches for development of oral controlled release compositions of galantamine hydrobromide and paroxetine hydrochloride hemihydrate: A review. Int. J. Appl. Pharm. 2016, 8, 1–6. [Google Scholar]
- Khatavkar, U.N.; Shimpi, S.L.; Jayaram Kumar, K.; Deo, K.D. Development and comparative evaluation of in vitro, in vivo properties of novel controlled release compositions of paroxetine hydrochloride hemihydrate as against GeomatrixTM platform technology. Drug Dev. Ind. Pharm. 2013, 39, 1175–1186. [Google Scholar] [CrossRef]
- National Center for Health Statistics Hyattsville. 20782 Third National Health and Nutrition Examination Survey, NHANES III (1988–1994). Available online: https://wwwn.cdc.gov/nchs/nhanes/nhanes3/default.aspx (accessed on 26 November 2020).
- Zhong, H.; Mashinson, V.; Woolman, T.; Zha, M. Understanding the Molecular Properties and Metabolism of Top Prescribed Drugs. Curr. Top. Med. Chem. 2013, 13, 1290–1307. [Google Scholar] [CrossRef]
- Yu, G.; Li, G.-F.; Markowitz, J.S. Atomoxetine: A Review of Its Pharmacokinetics and Pharmacogenomics Relative to Drug Disposition. J. Child Adolesc. Psychopharmacol. 2016, 26, 314–326. [Google Scholar] [CrossRef]
- Venkatakrishnan, K.; Obach, R.S. In vitro-in vivo extrapolation of CYP2D6 inactivation by paroxetine: Prediction of nonstationary pharmacokinetics and drug interaction magnitude. Drug Metab. Dispos. 2005, 33, 845–852. [Google Scholar] [CrossRef]
- Valentin, J. Basic anatomical and physiological data for use in radiological protection: Reference values. A report of age- and gender-related differences in the anatomical and physiological characteristics of reference individuals. ICRP Publication 89. Ann. ICRP 2002, 32, 5–265. [Google Scholar]
- Swain, M. chemicalize.org. J. Chem. Inf. Model. 2012, 52, 613–615. [Google Scholar] [CrossRef]
- Tanaka, G.; Kawamura, H. Division of Radioecology; National Institute of Radiological Sciences: Hitachinaka, Japan, 1996; p. NIRS-M-115. [Google Scholar]
- Rowland Yeo, K.; Walsky, R.L.; Jamei, M.; Rostami-Hodjegan, A.; Tucker, G.T. Prediction of time-dependent CYP3A4 drug-drug interactions by physiologically based pharmacokinetic modelling: Impact of inactivation parameters and enzyme turnover. Eur. J. Pharm. Sci. 2011, 43, 160–173. [Google Scholar] [CrossRef] [PubMed]
- Rodrigues, A.D. Integrated cytochrome P450 reaction phenotyping. Attempting to bridge the gap between cDNA-expressed cytochromes P450 and native human liver microsomes. Biochem. Pharmacol. 1999, 57, 465–480. [Google Scholar] [CrossRef] [PubMed]
- Open Systems Pharmacology Suite Community PK-Sim® Ontogeny Database Documentation, Version 7.3. Available online: https://github.com/Open-Systems-Pharmacology/OSPSuite.Documentation/blob/master/PK-SimOntogenyDatabaseVersion7.3.pdf (accessed on 4 April 2022).
- Nishimura, M.; Naito, S. Tissue-specific mRNA Expression Profiles of Human ATP-binding Cassette and Solute Carrier Transporter Superfamilies. Drug Metab. Pharmacokinet. 2005, 20, 452–477. [Google Scholar] [CrossRef] [PubMed]
- Rodgers, T.; Rowland, M. Mechanistic approaches to volume of distribution predictions: Understanding the processes. Pharm. Res. 2007, 24, 918–933. [Google Scholar]
- Prasad, B.; Evers, R.; Gupta, A.; Hop, C.E.C.A.; Salphati, L.; Shukla, S.; Ambudkar, S.V.; Unadkat, J.D. Interindividual variability in hepatic organic anion—Transporting polypeptides and P-glycoprotein (ABCB1) protein expression: Quantification by liquid chromatography tandem mass spectroscopy and influence of genotype, age, and sex. Drug Metab. Dispos. Biol. Fate Chem. 2014, 42, 78–88. [Google Scholar]
- Muerdter, T.; Lehr, T.; Igel, S.; Kroener, P.; Ganchev, B.; Schaeffeler, E.; Boehmer, G.; Sonnenberg, M.; Brauch, H.; Kerb, R.; et al. Impact of CYP2D6 genotype and co-medication with paroxetine and clarithromycin on clomiphene metabolism in vivo. In Abstracts of the 82nd Annual Meeting of the German Society for Experimental and Clinical Pharmacology and Toxicology (DGPT) in Naunyn-Schmiedeberg’s Archives of Pharmacology; Springer: New York, NY, USA, 2016; Volume 389, p. 8. [Google Scholar]


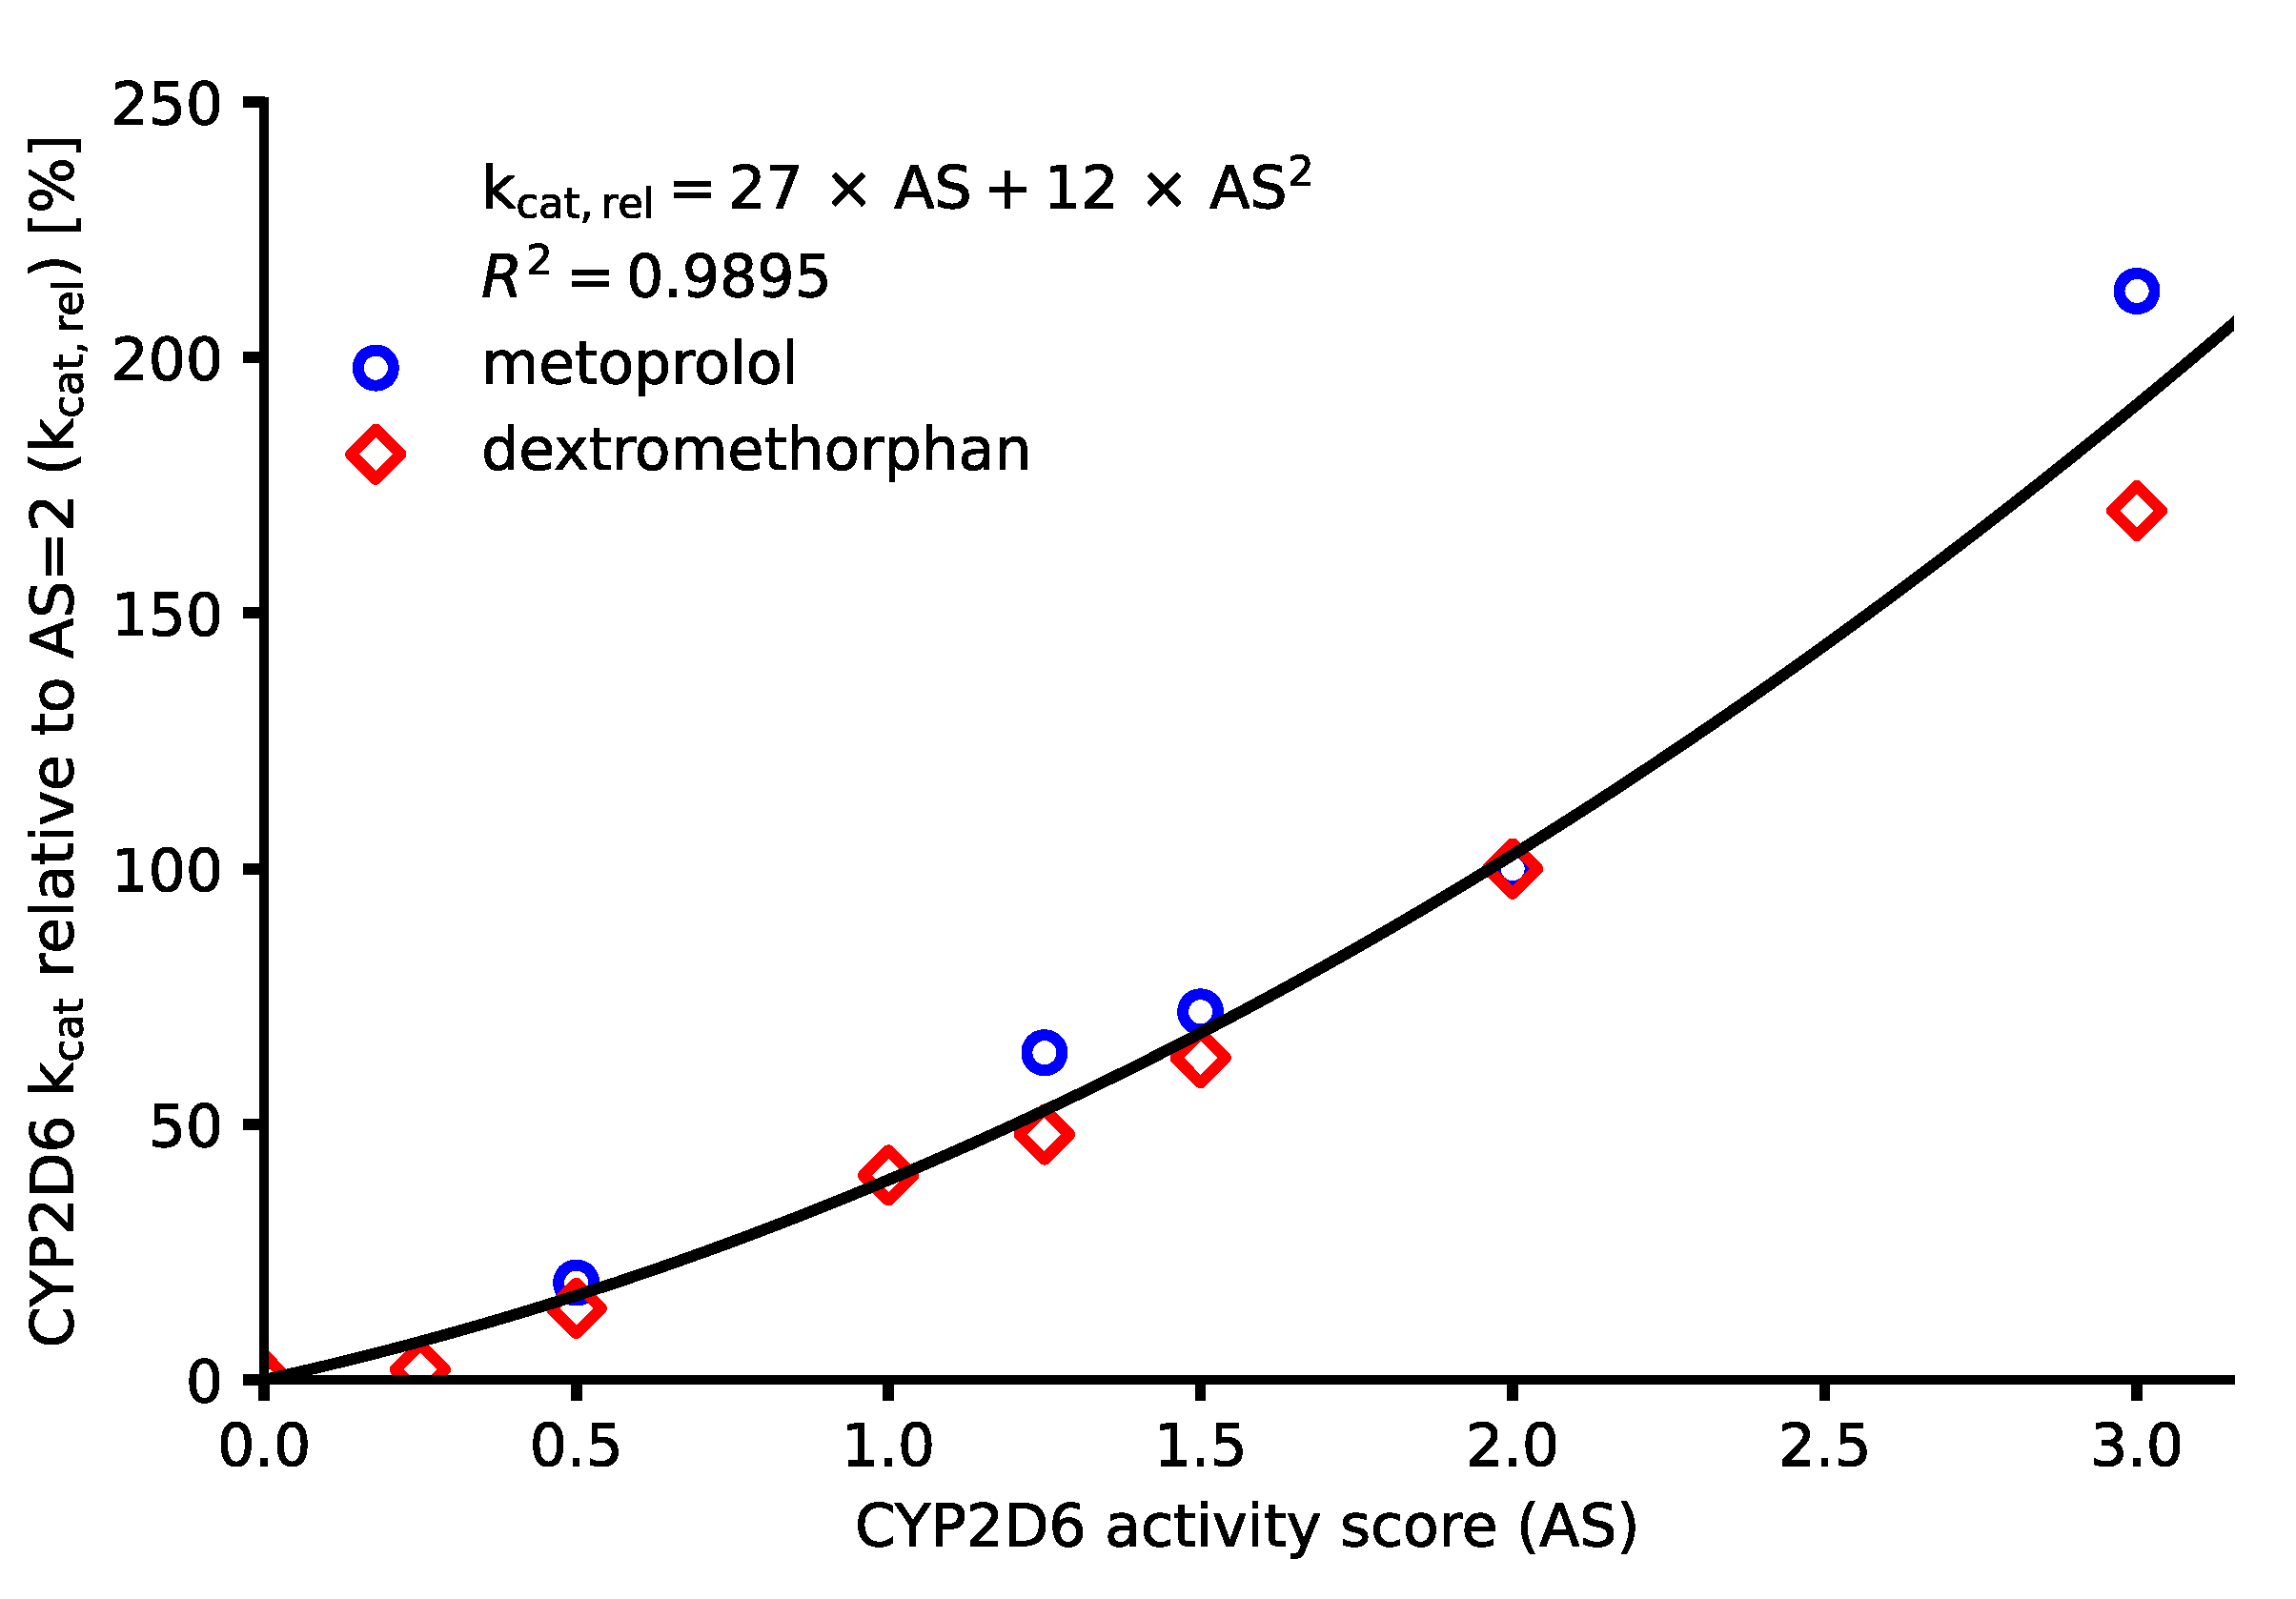
| CYP2D6 Activity Score | CYP2D6 kcat, rel [%] | CYP2D6 kcat [1/min] a | |||||
|---|---|---|---|---|---|---|---|
| MET | DEX | INTRPL | PAR | ATO | RIS9HR | RISother | |
| 0 | 0 | 0 | 0 | 0.00 | 0.00 | 0 | 0.00 |
| 0.25 | - | 2 | 8 | 0.30 | 7.63 | 0.23 | 0.14 |
| 0.5 | 19 | 14 | 17 | 0.66 | 16.79 | 0.52 | 0.31 |
| 0.75 | - | - | 27 | 1.08 | 27.48 | 0.84 | 0.51 |
| 1 | - | 40 | 39 | 1.56 | 39.70 | 1.22 | 0.74 |
| 1.25 | 64 | 48 | 53 | 2.11 | 53.44 | 1.64 | 1.00 |
| 1.5 | 72 | 63 | 68 | 2.71 | 68.70 | 2.11 | 1.29 |
| 2 | 100 | 100 | 102 | 4.09 b | 103.82 b | 3.19 b | 1.94 b |
| 3 | 213 | 170 | 189 | 7.58 | 192.37 | 5.91 | 3.60 |
Publisher’s Note: MDPI stays neutral with regard to jurisdictional claims in published maps and institutional affiliations. |
© 2022 by the authors. Licensee MDPI, Basel, Switzerland. This article is an open access article distributed under the terms and conditions of the Creative Commons Attribution (CC BY) license (https://creativecommons.org/licenses/by/4.0/).
Share and Cite
Rüdesheim, S.; Selzer, D.; Mürdter, T.; Igel, S.; Kerb, R.; Schwab, M.; Lehr, T. Physiologically Based Pharmacokinetic Modeling to Describe the CYP2D6 Activity Score-Dependent Metabolism of Paroxetine, Atomoxetine and Risperidone. Pharmaceutics 2022, 14, 1734. https://doi.org/10.3390/pharmaceutics14081734
Rüdesheim S, Selzer D, Mürdter T, Igel S, Kerb R, Schwab M, Lehr T. Physiologically Based Pharmacokinetic Modeling to Describe the CYP2D6 Activity Score-Dependent Metabolism of Paroxetine, Atomoxetine and Risperidone. Pharmaceutics. 2022; 14(8):1734. https://doi.org/10.3390/pharmaceutics14081734
Chicago/Turabian StyleRüdesheim, Simeon, Dominik Selzer, Thomas Mürdter, Svitlana Igel, Reinhold Kerb, Matthias Schwab, and Thorsten Lehr. 2022. "Physiologically Based Pharmacokinetic Modeling to Describe the CYP2D6 Activity Score-Dependent Metabolism of Paroxetine, Atomoxetine and Risperidone" Pharmaceutics 14, no. 8: 1734. https://doi.org/10.3390/pharmaceutics14081734