
High Molecular Weight Hyaluronic Acid Reduces the Expression of Virulence Genes fimA, mfa1, hagA, rgpA, and kgp in the Oral Pathogen Porphyromonas gingivalis


Abstract
:1. Introduction
2. Materials and Methods
2.1. Culture Methods
2.2. Minimum Inhibitory Concentration
2.3. Quantitative Reverse Transcription Polymerase Chain Reaction (RT-qPCR)
2.4. Statistical Analysis
3. Results
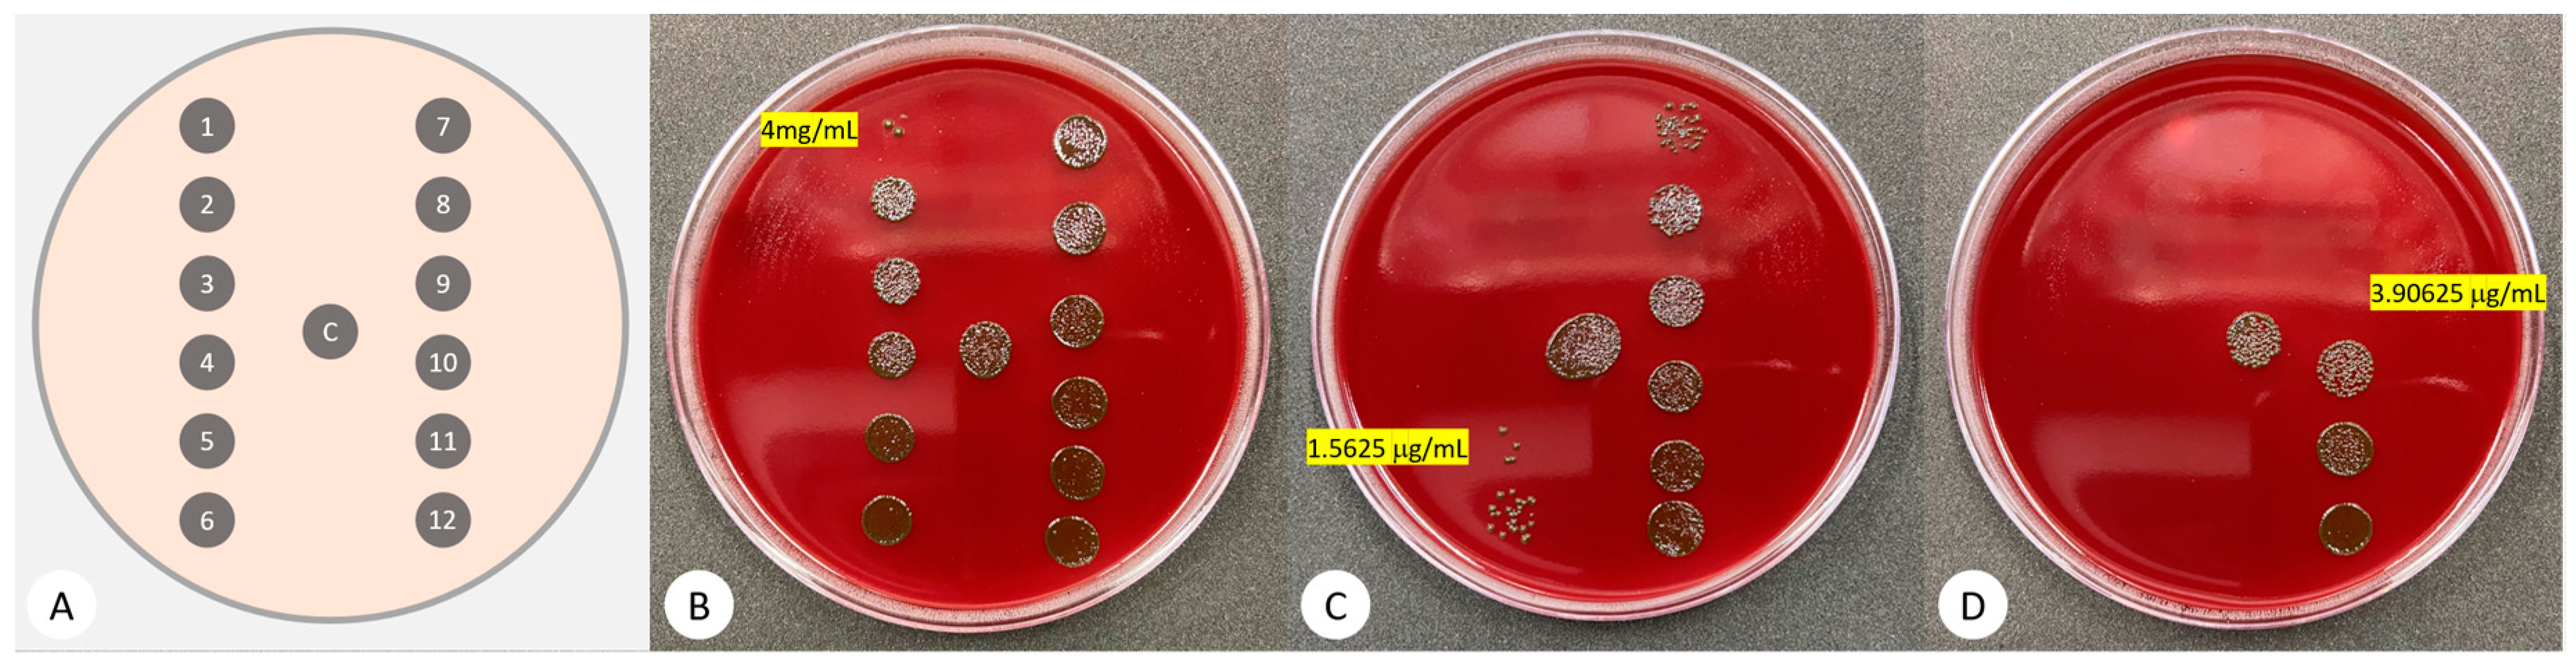
3.1. Minimum Inhibitory Concentration (MIC)
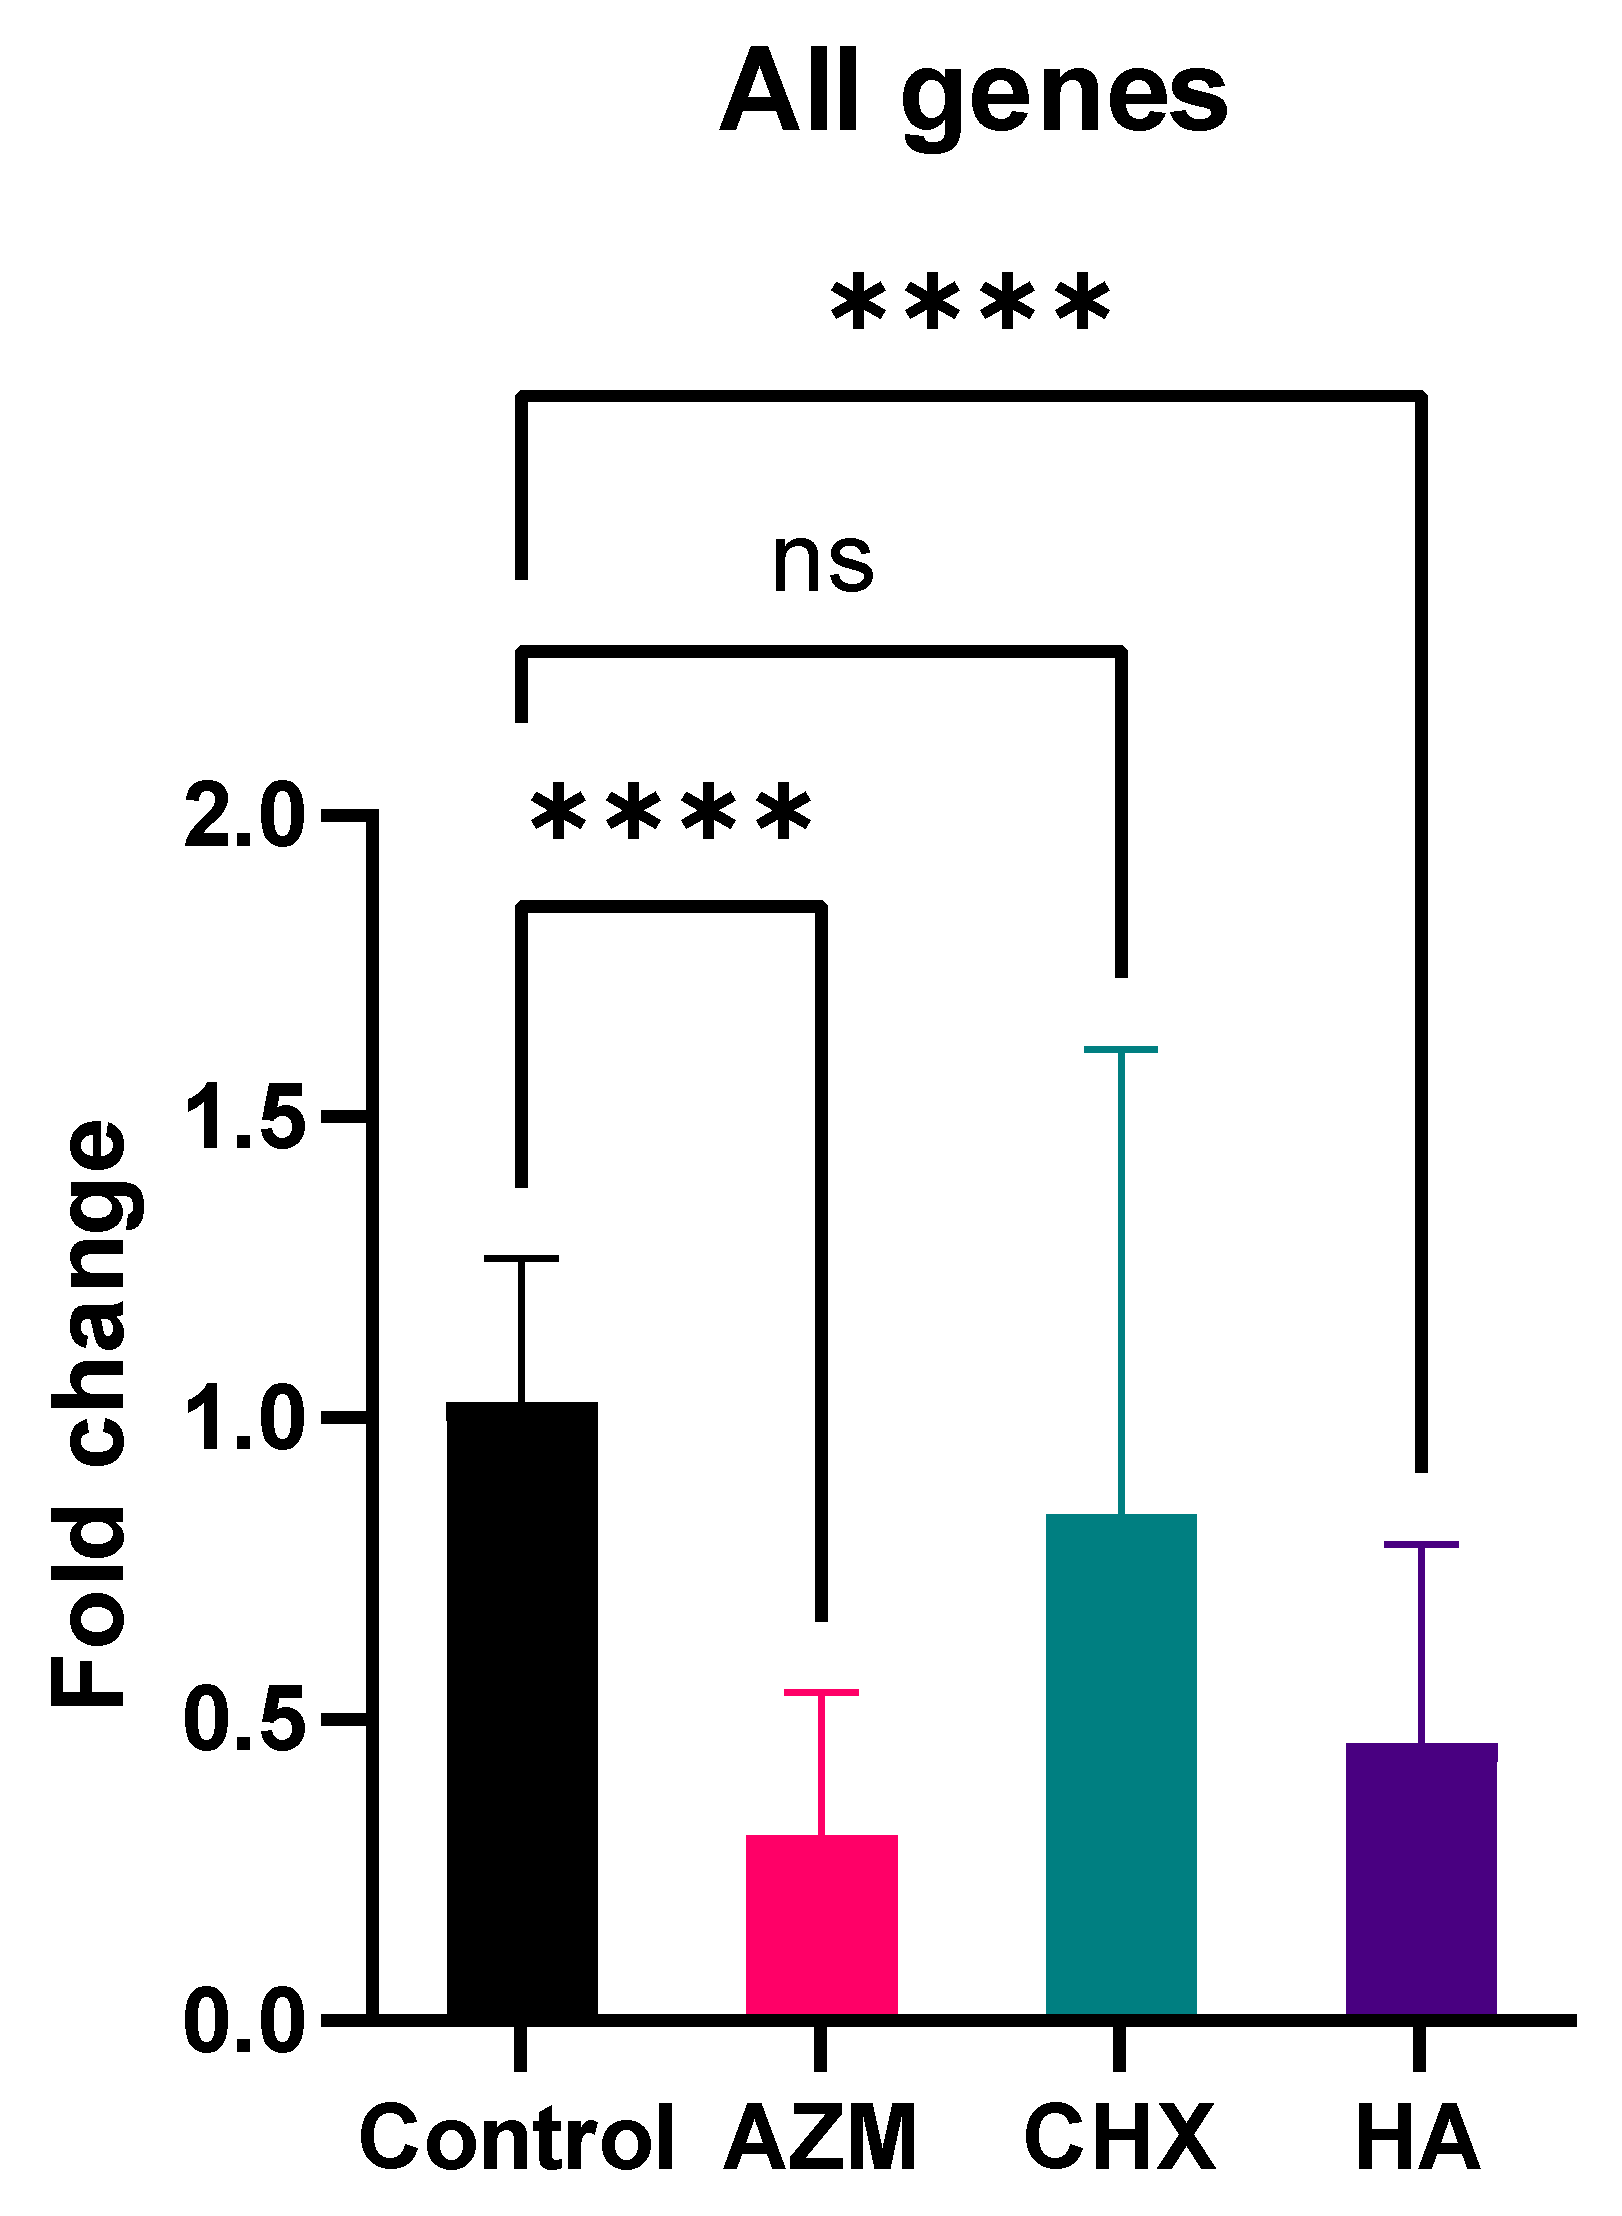
3.2. Gene Expression
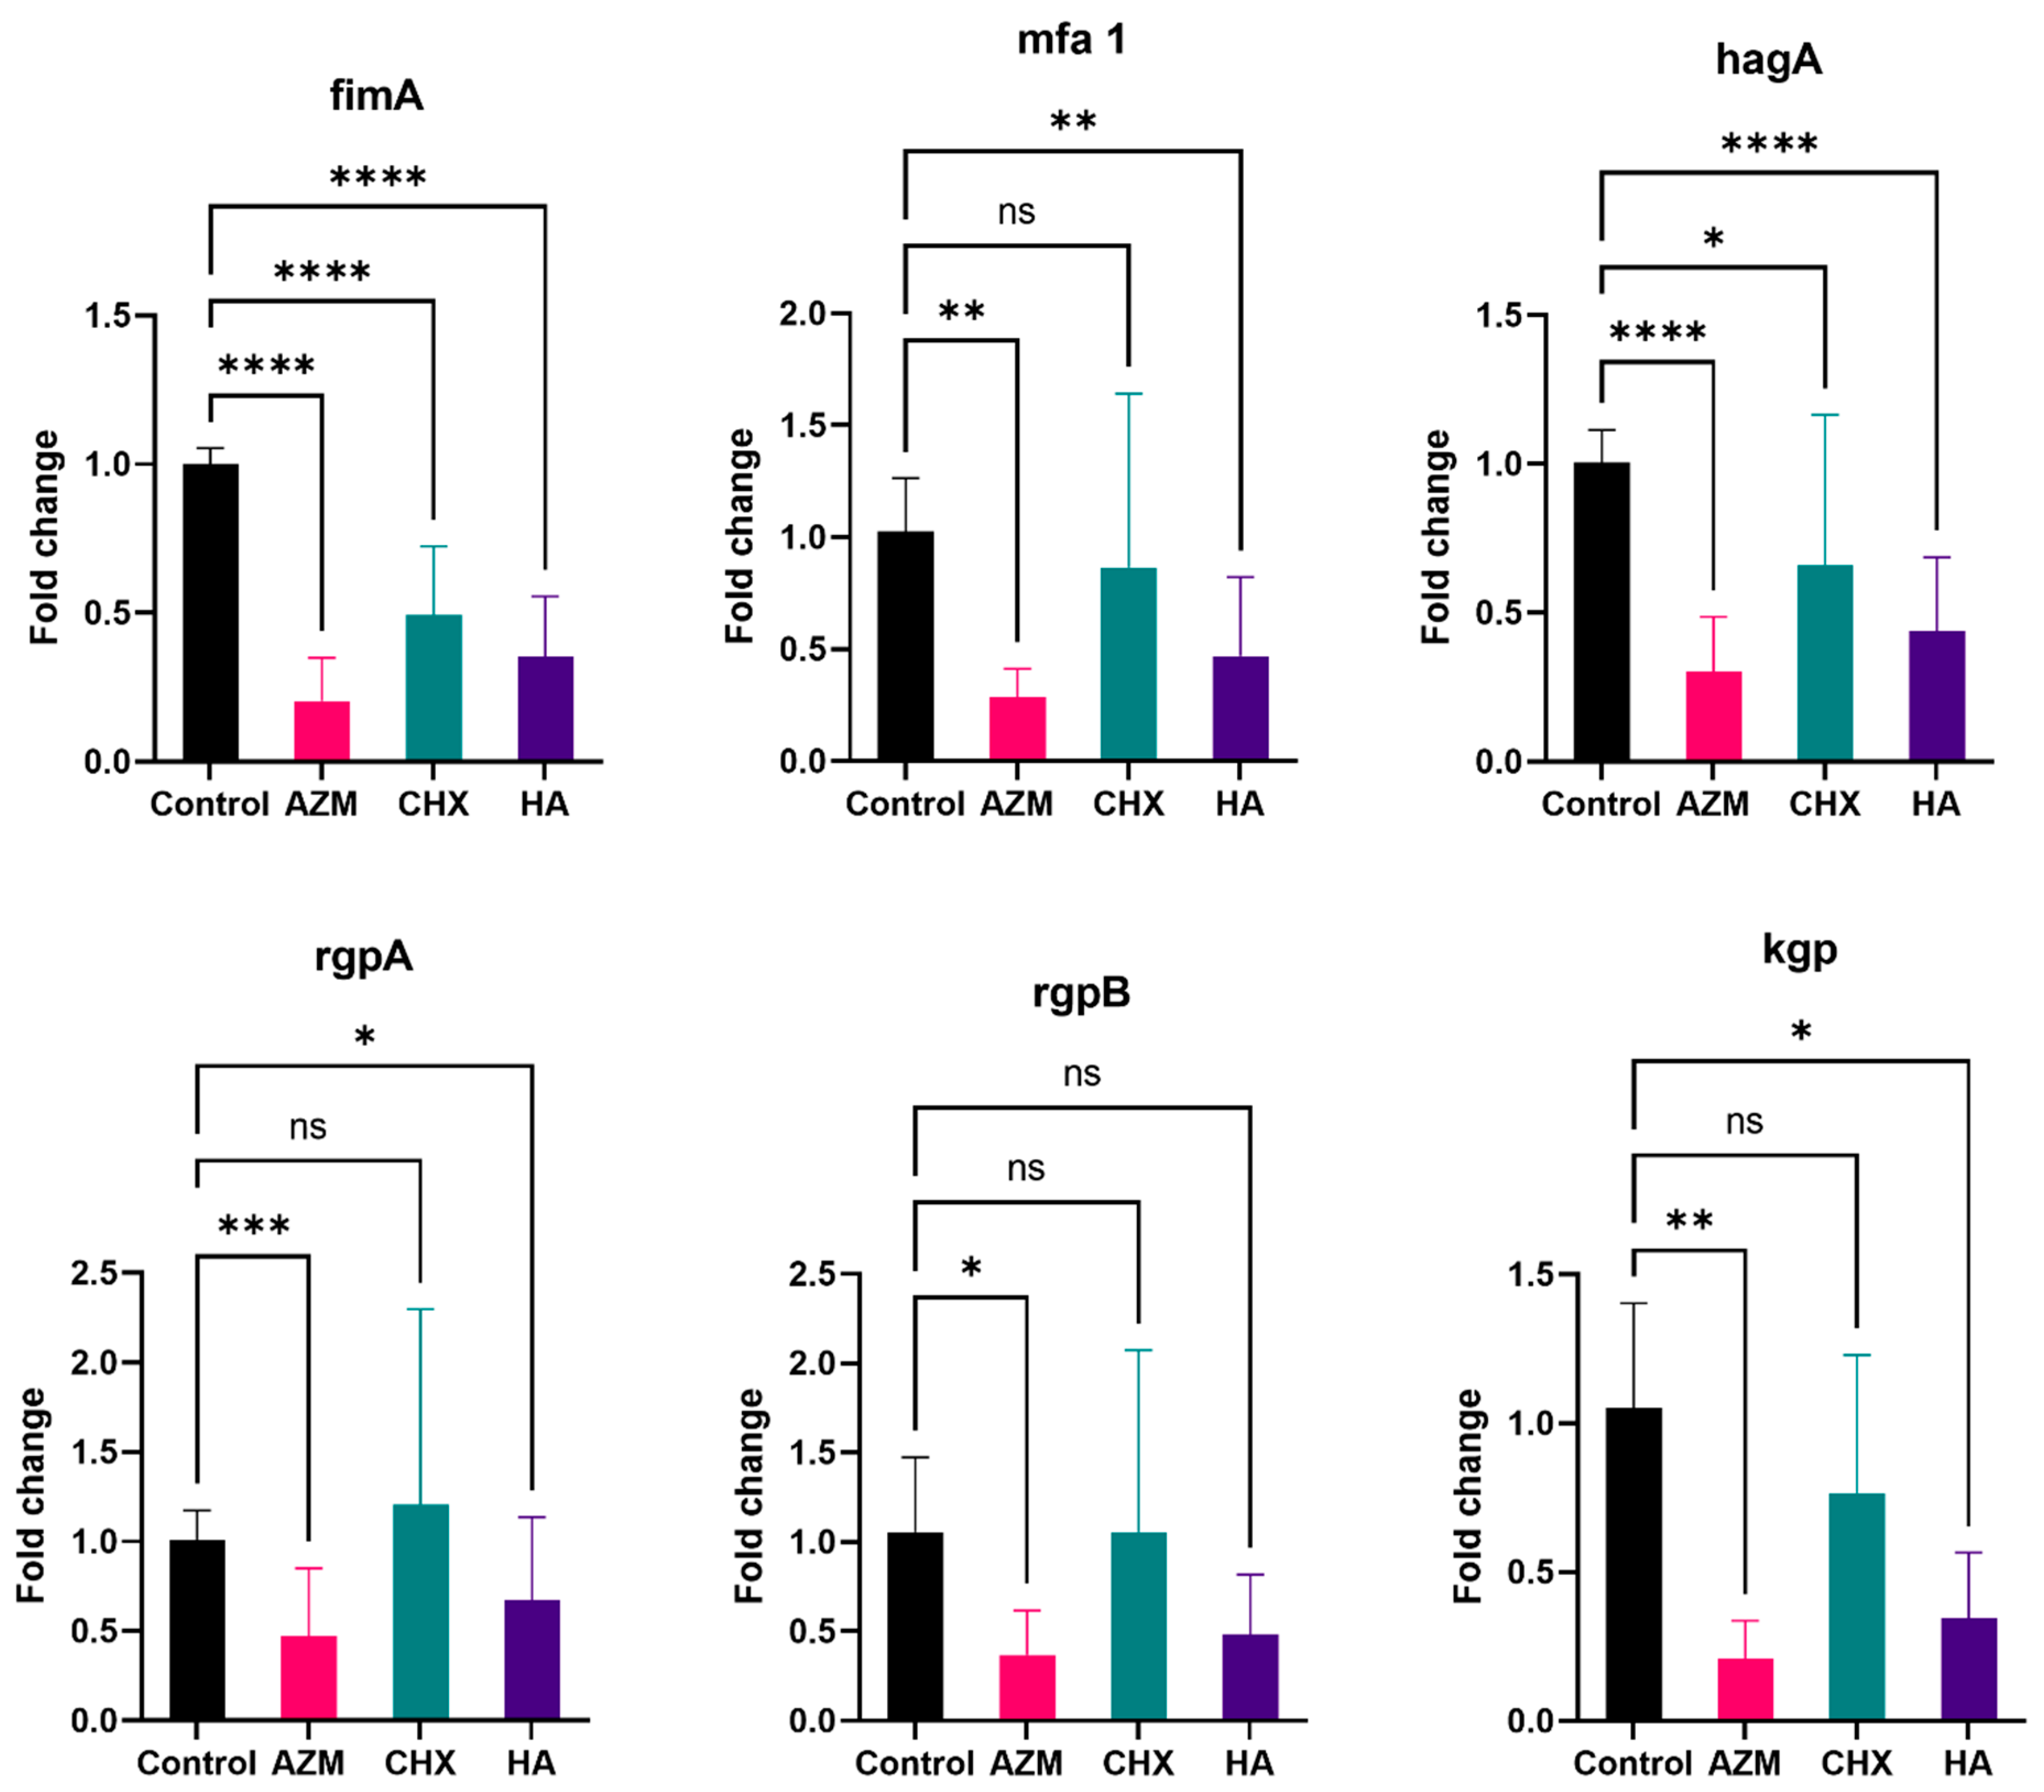
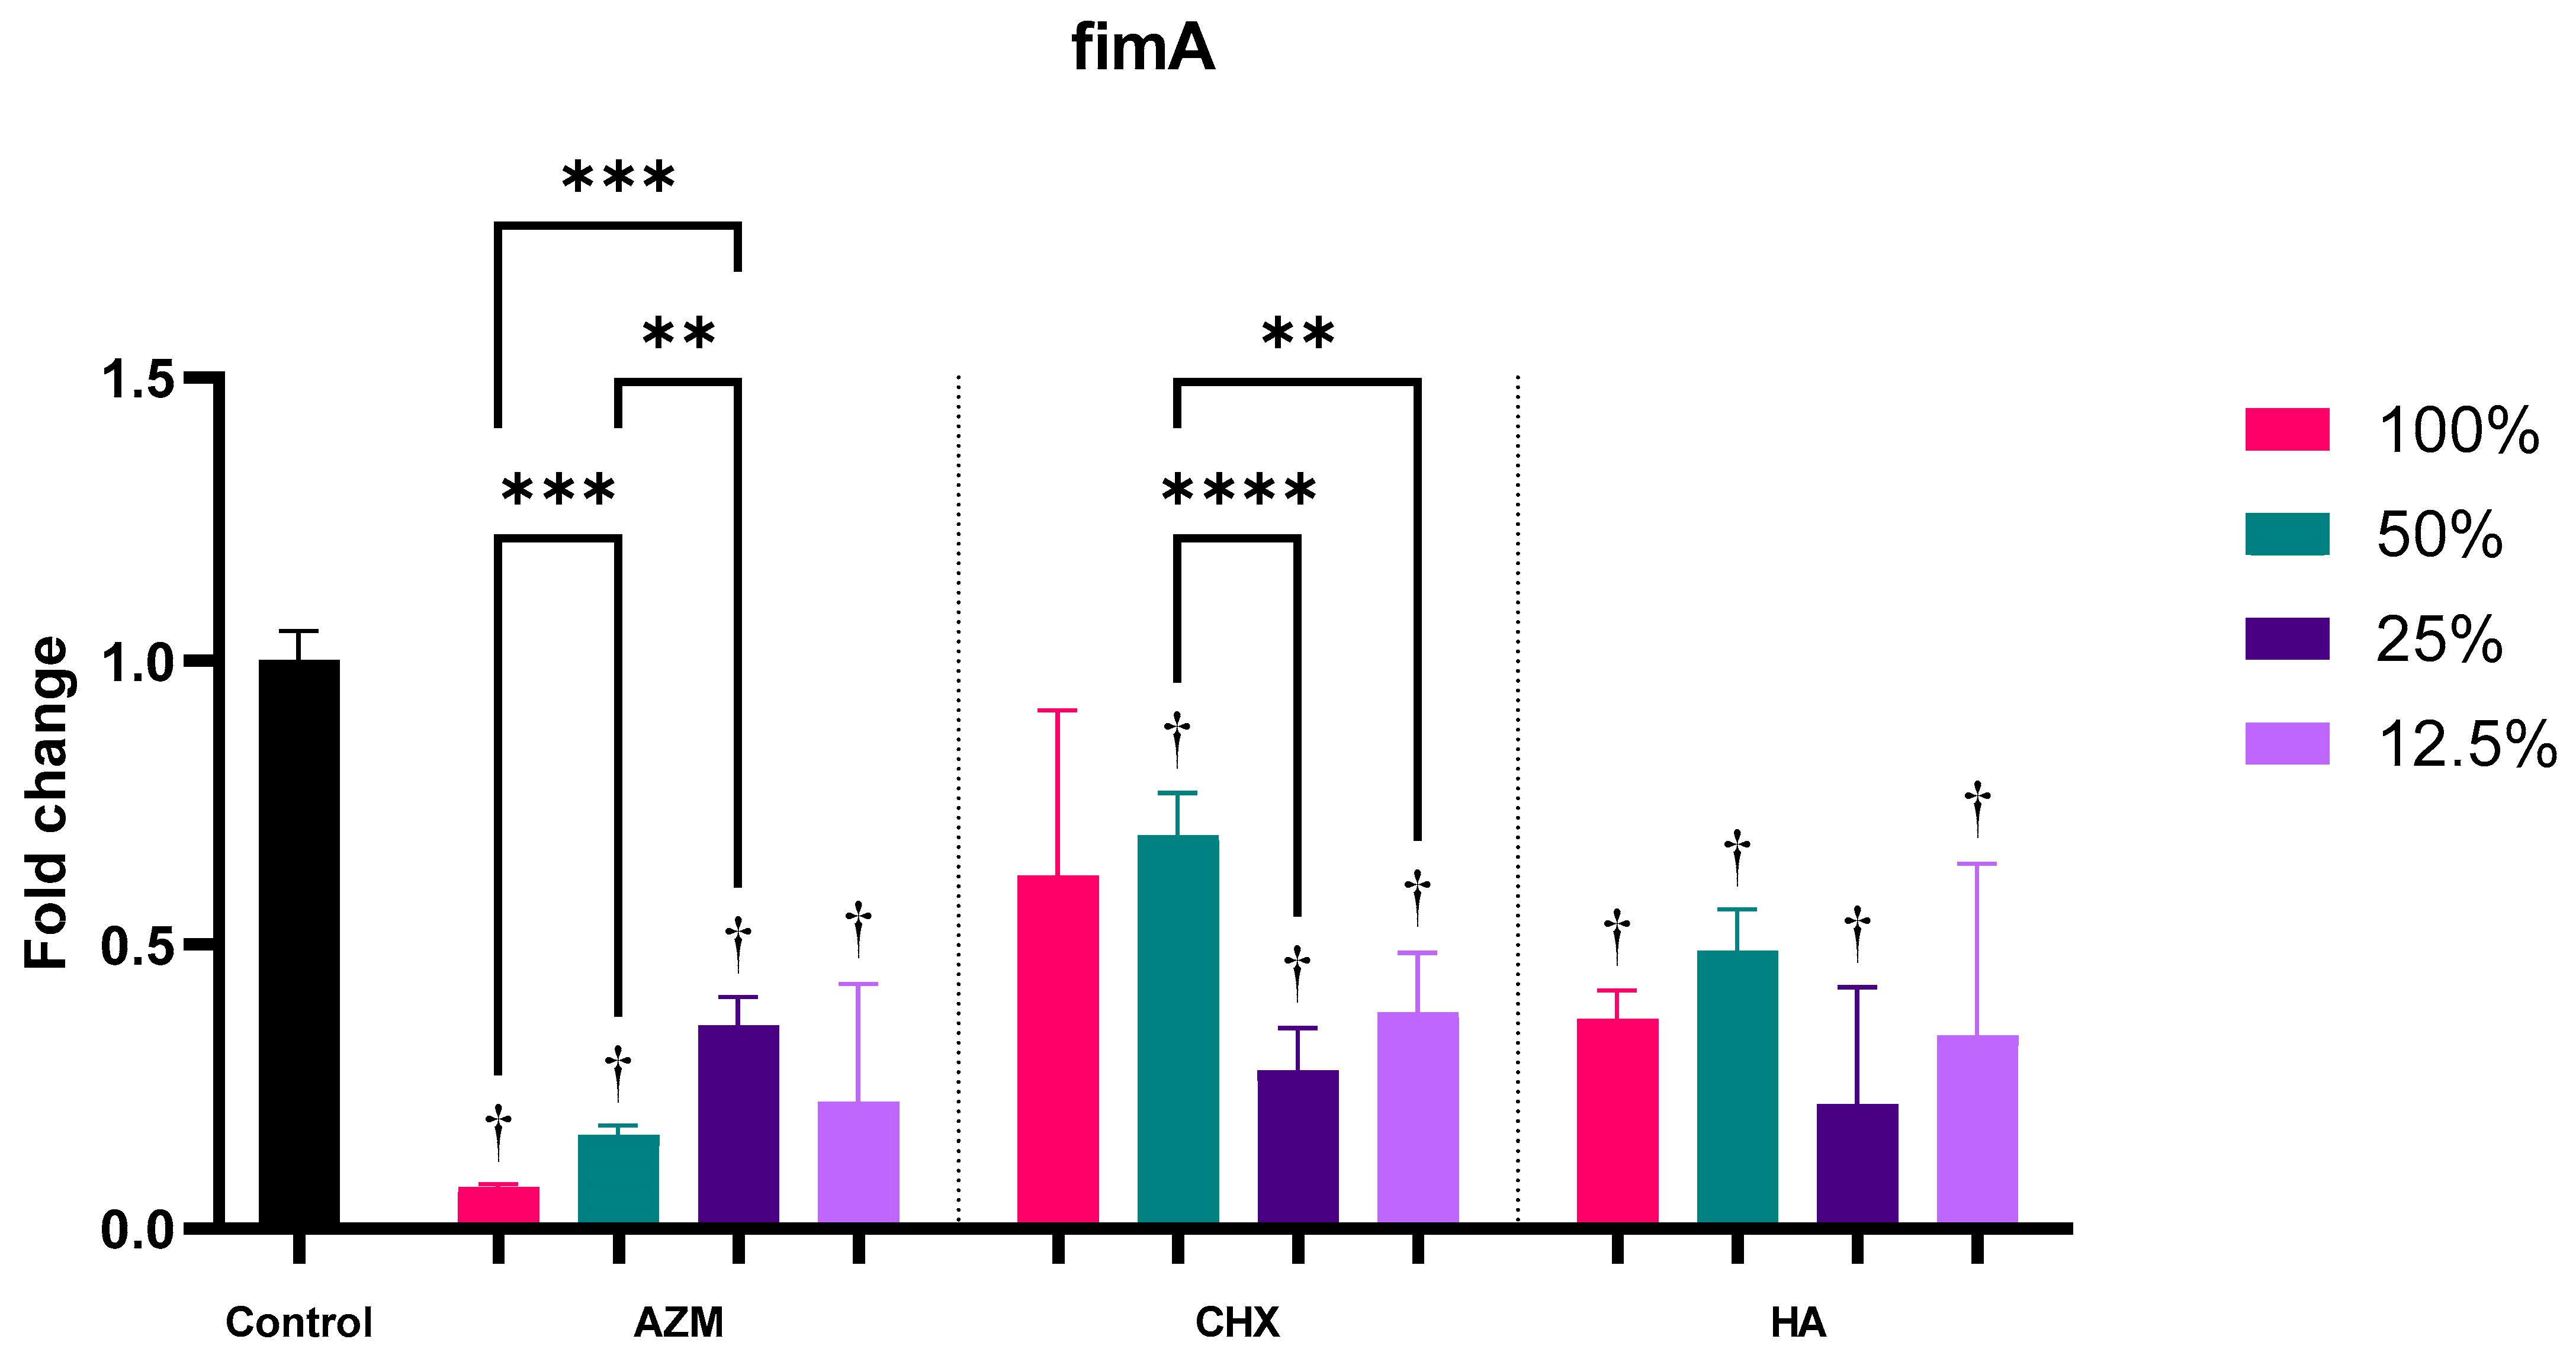
3.2.1. fimA
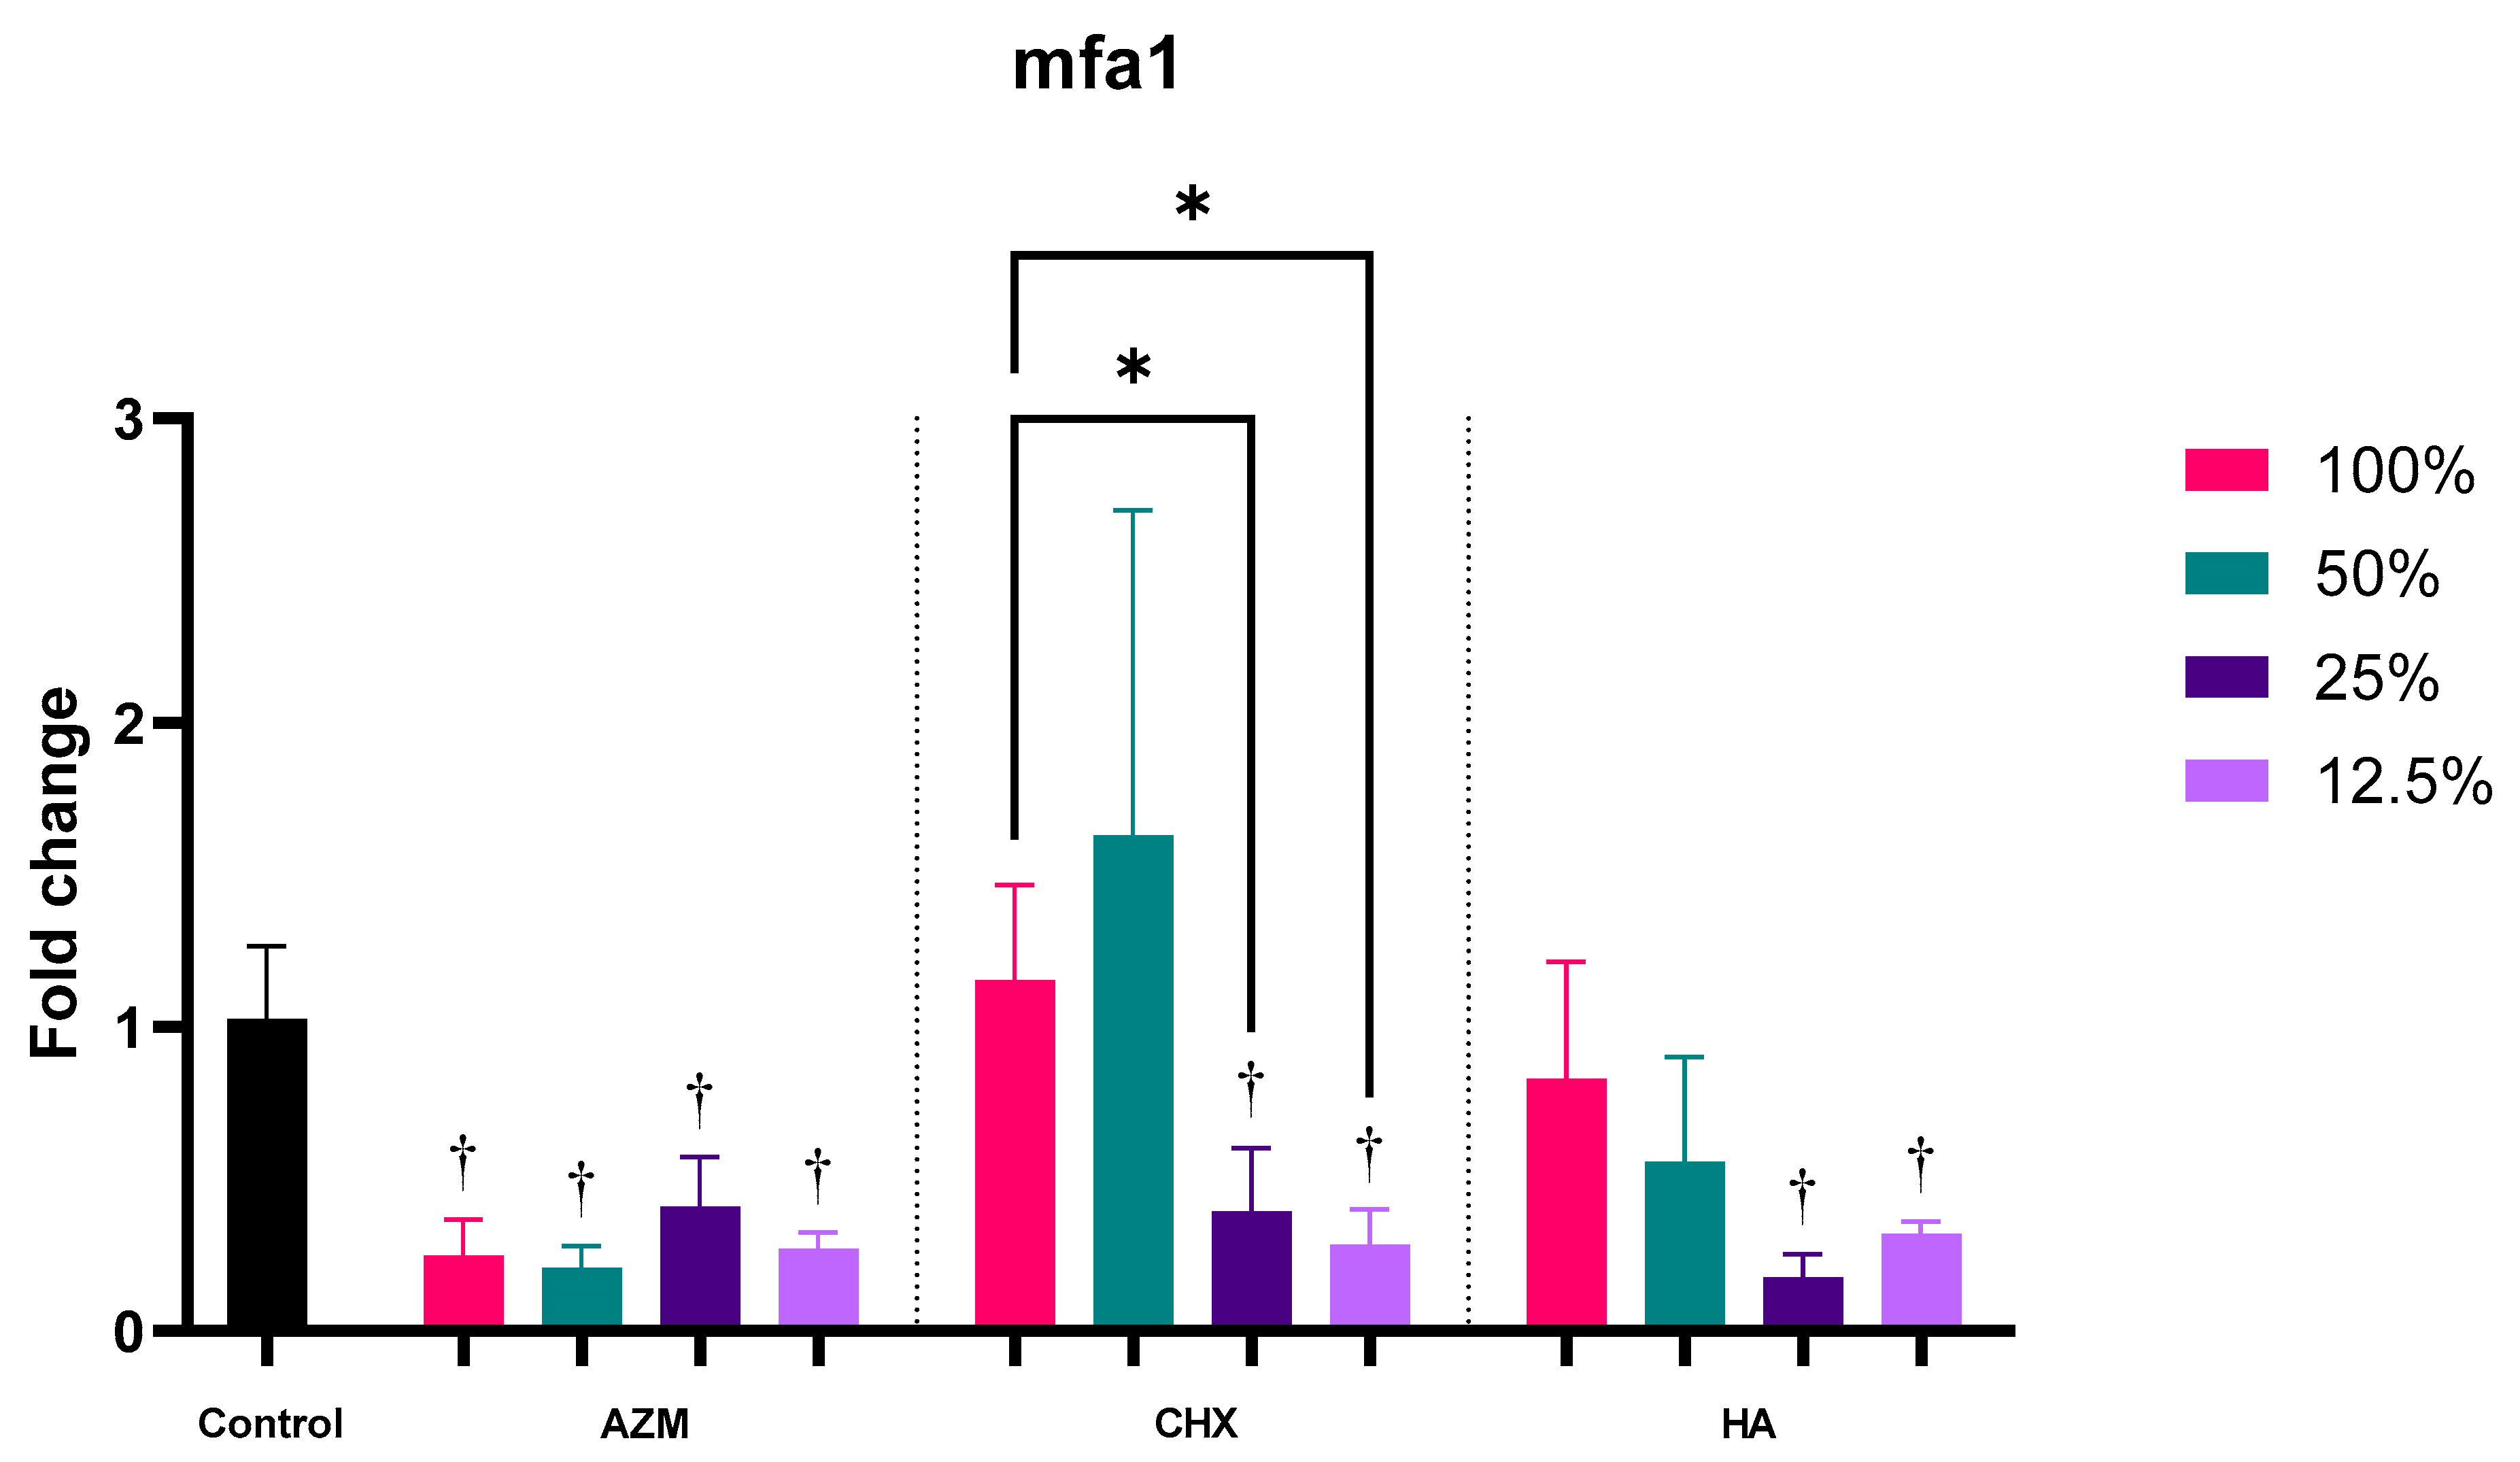
3.2.2. mfa1
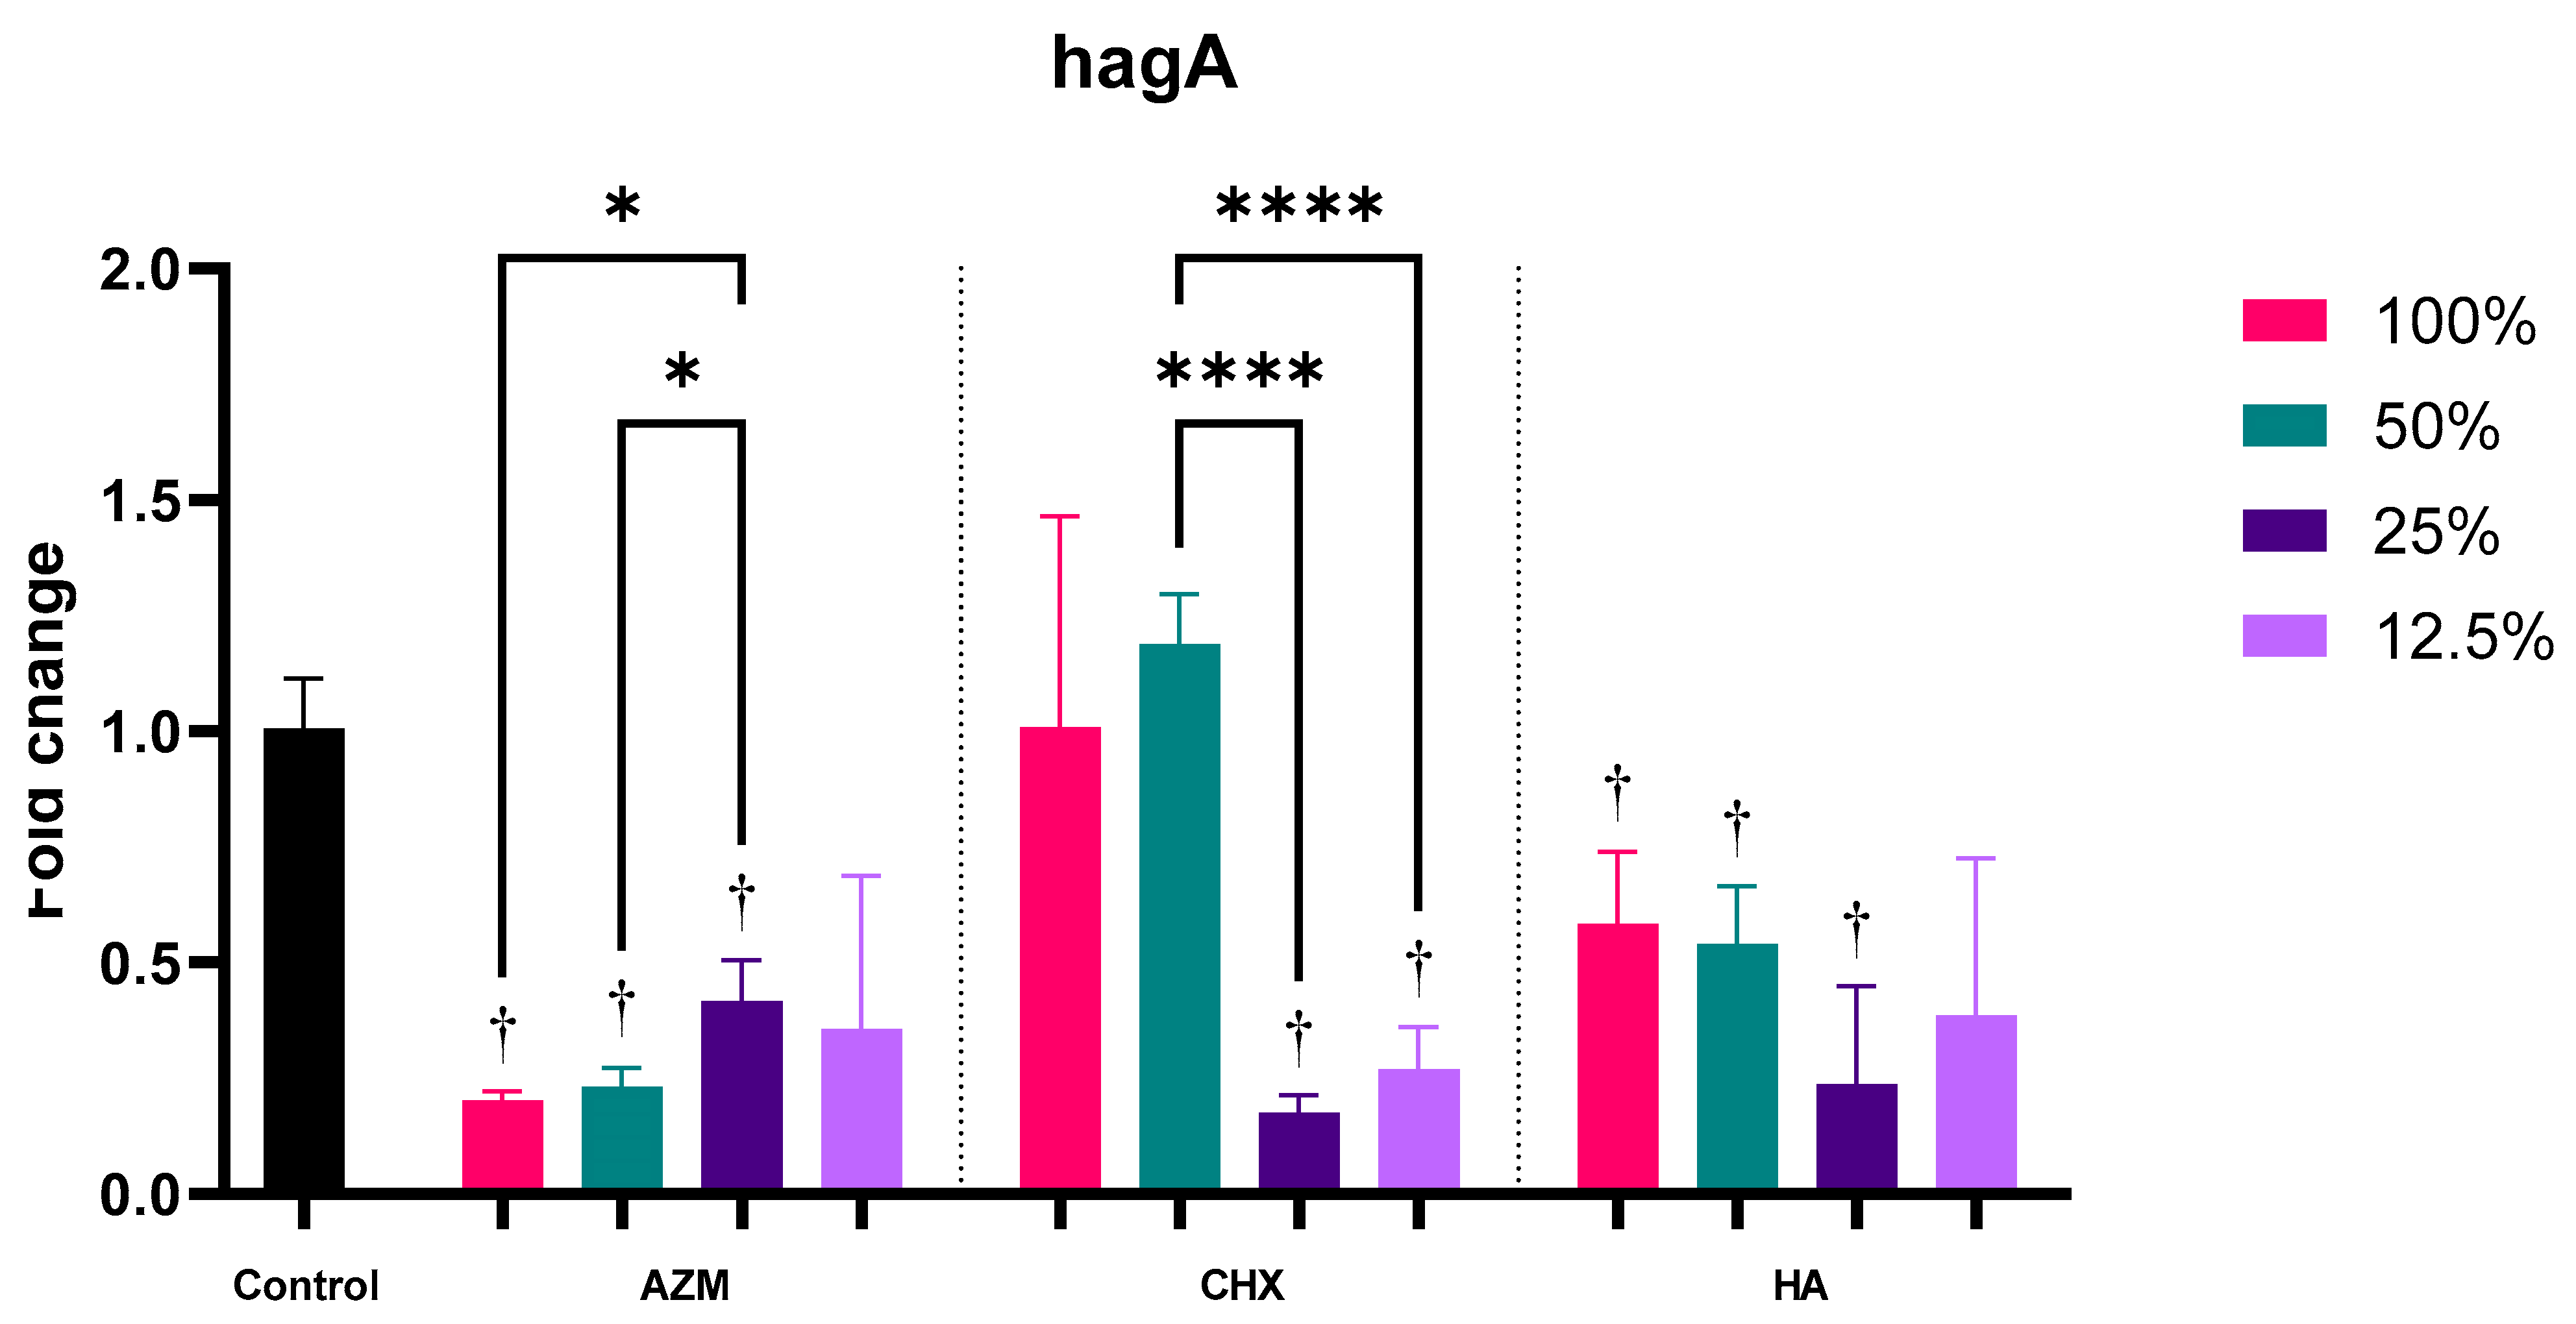
3.2.3. hagA
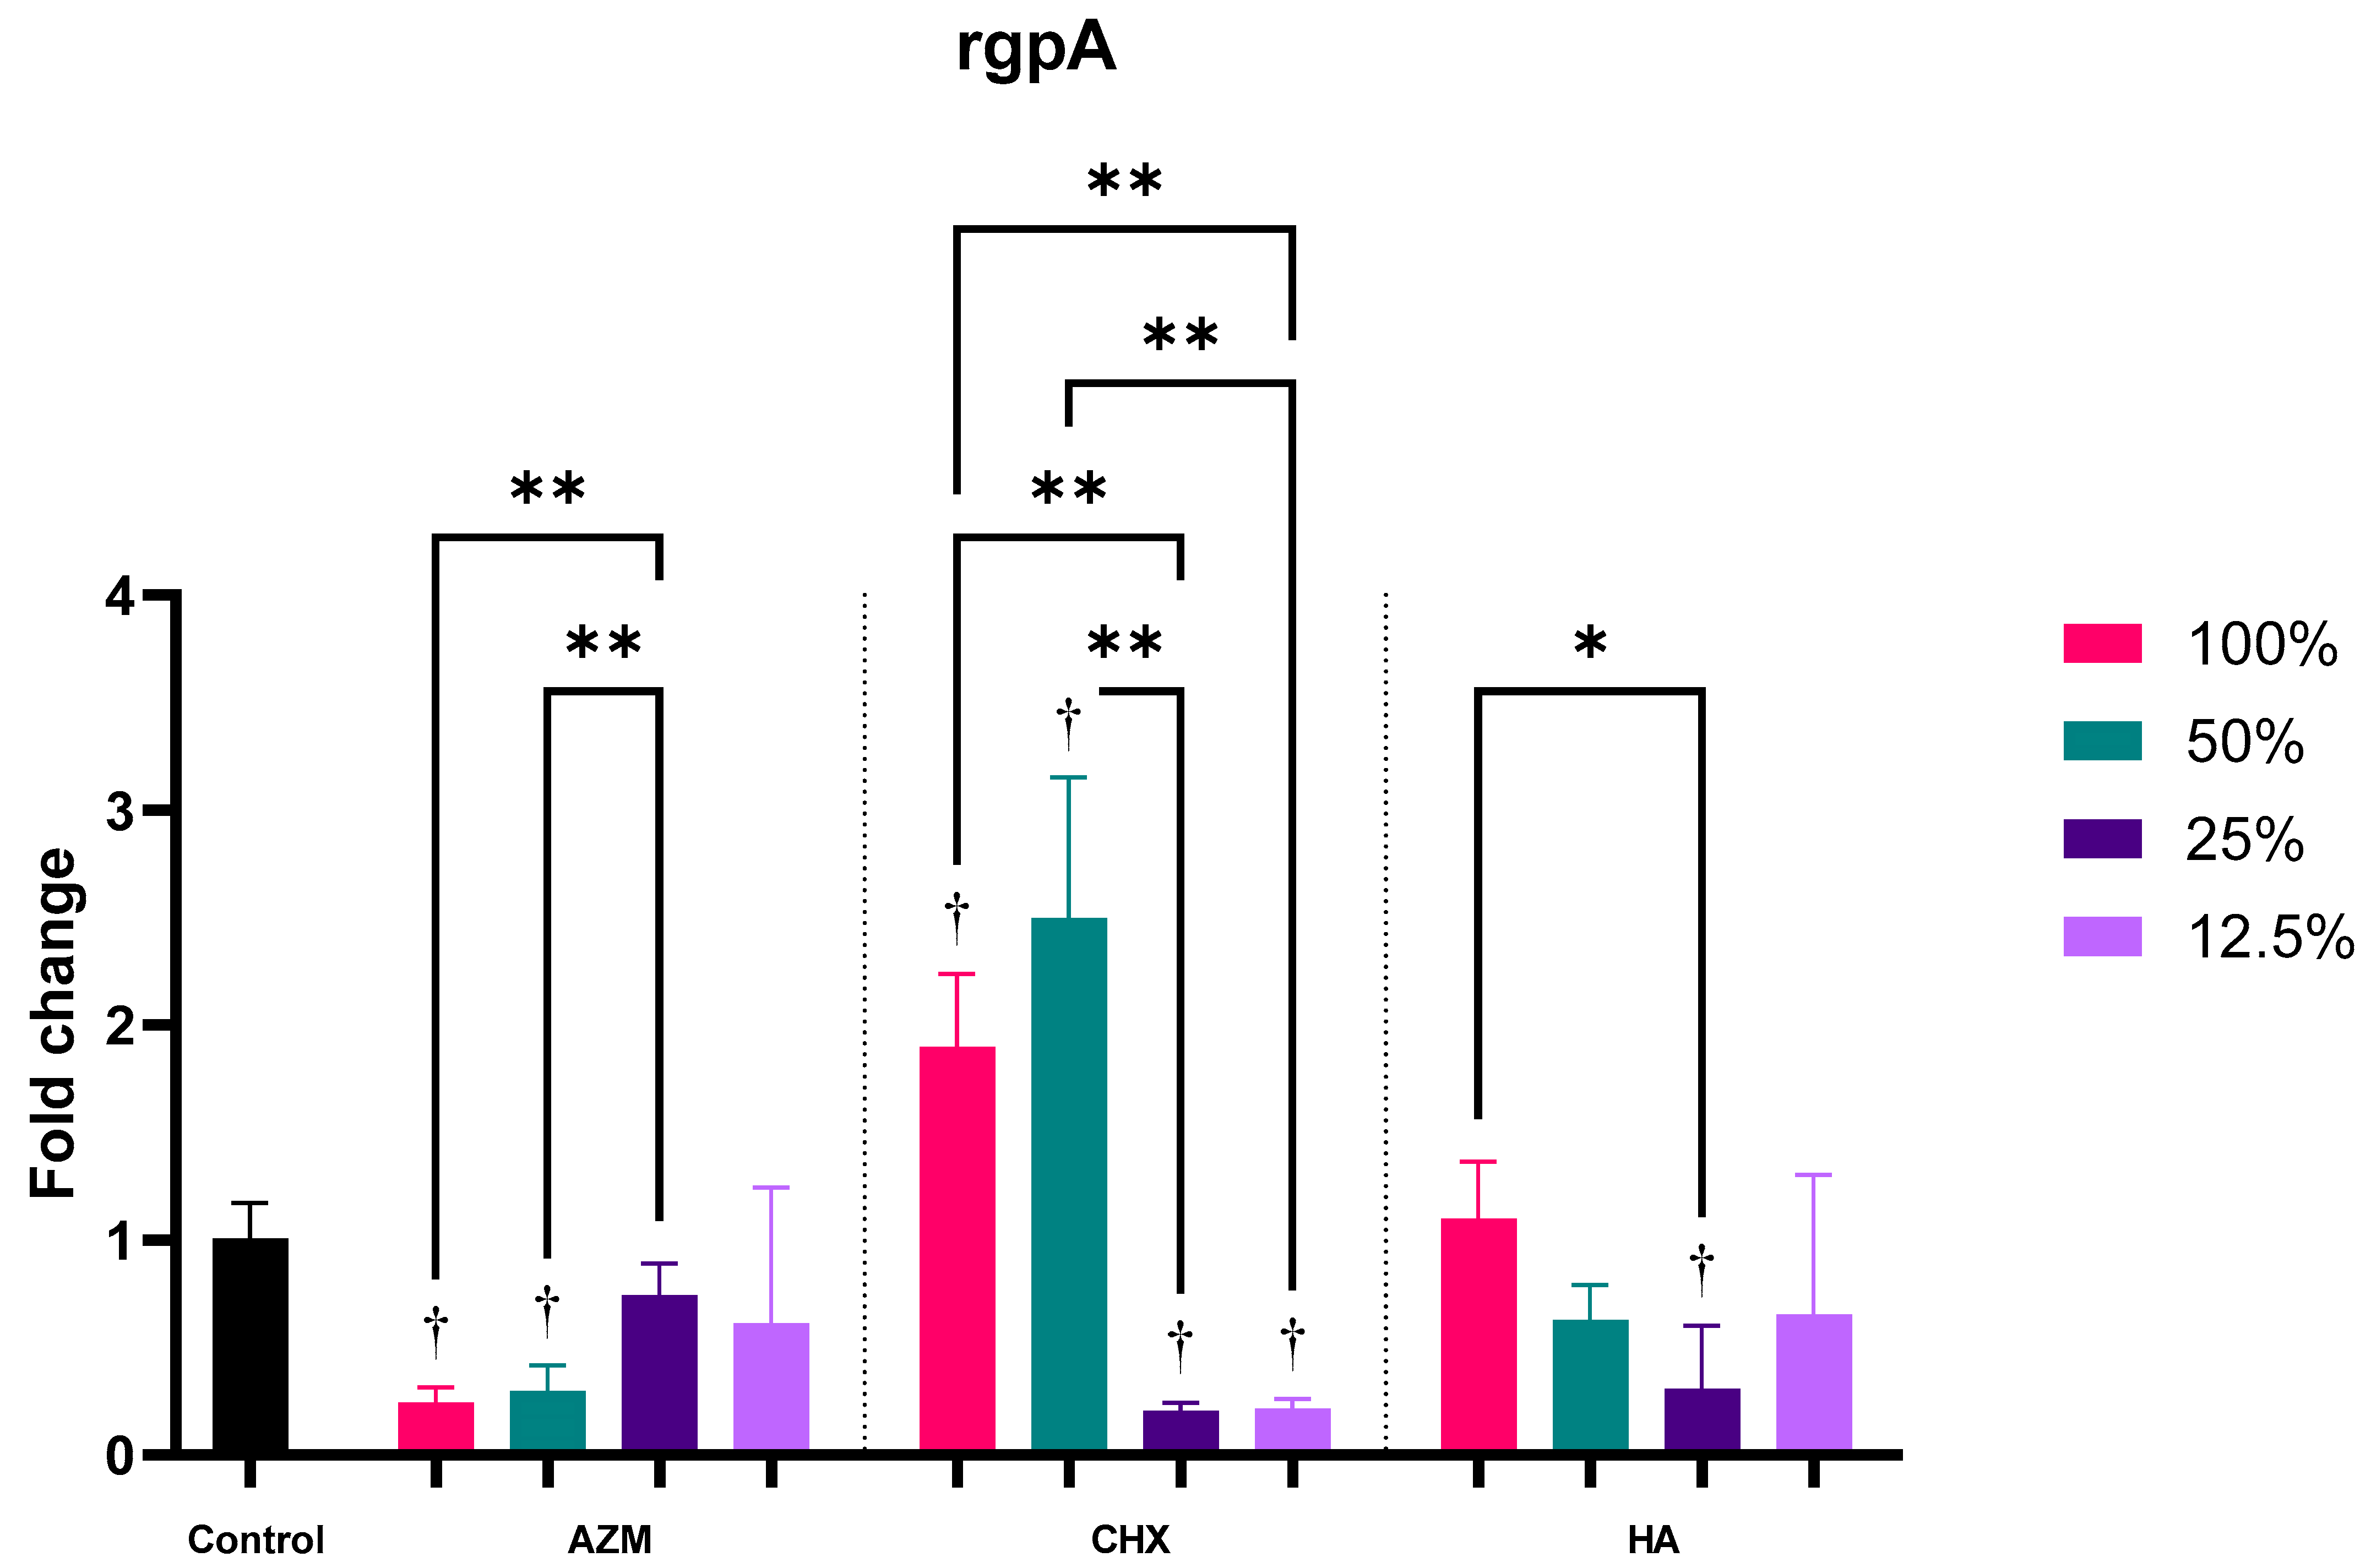
3.2.4. rgpA
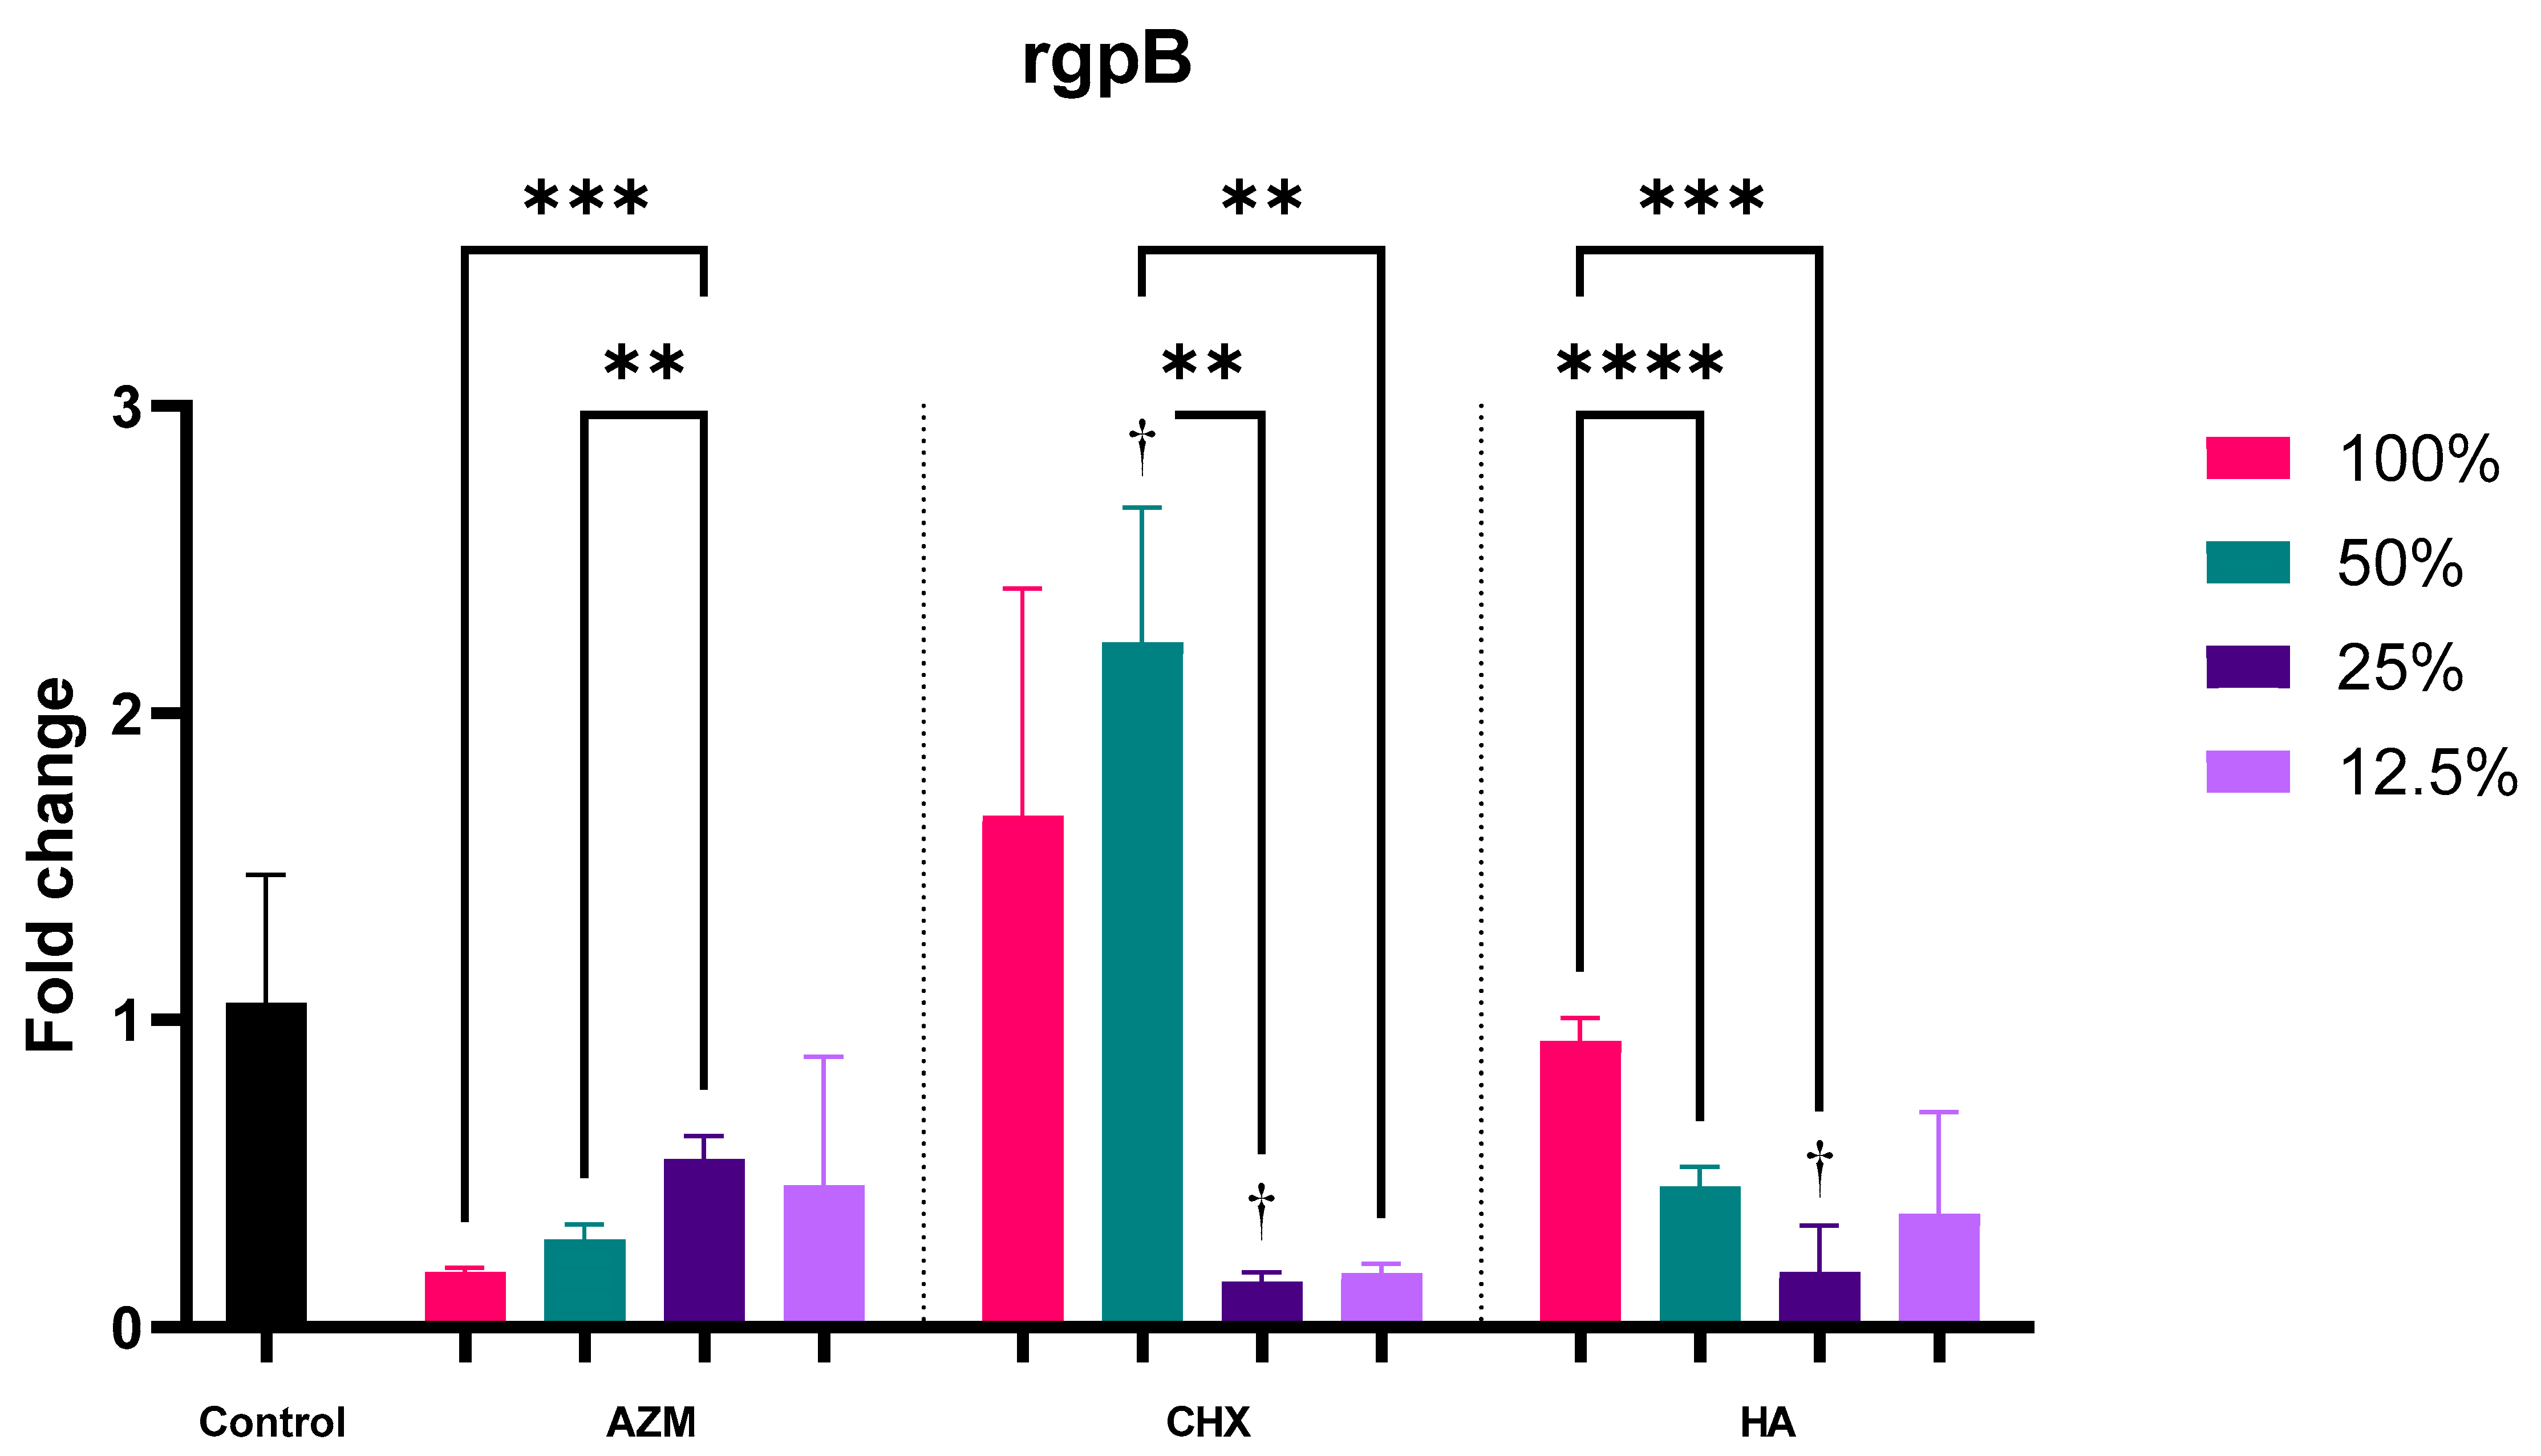
3.2.5. rgpB
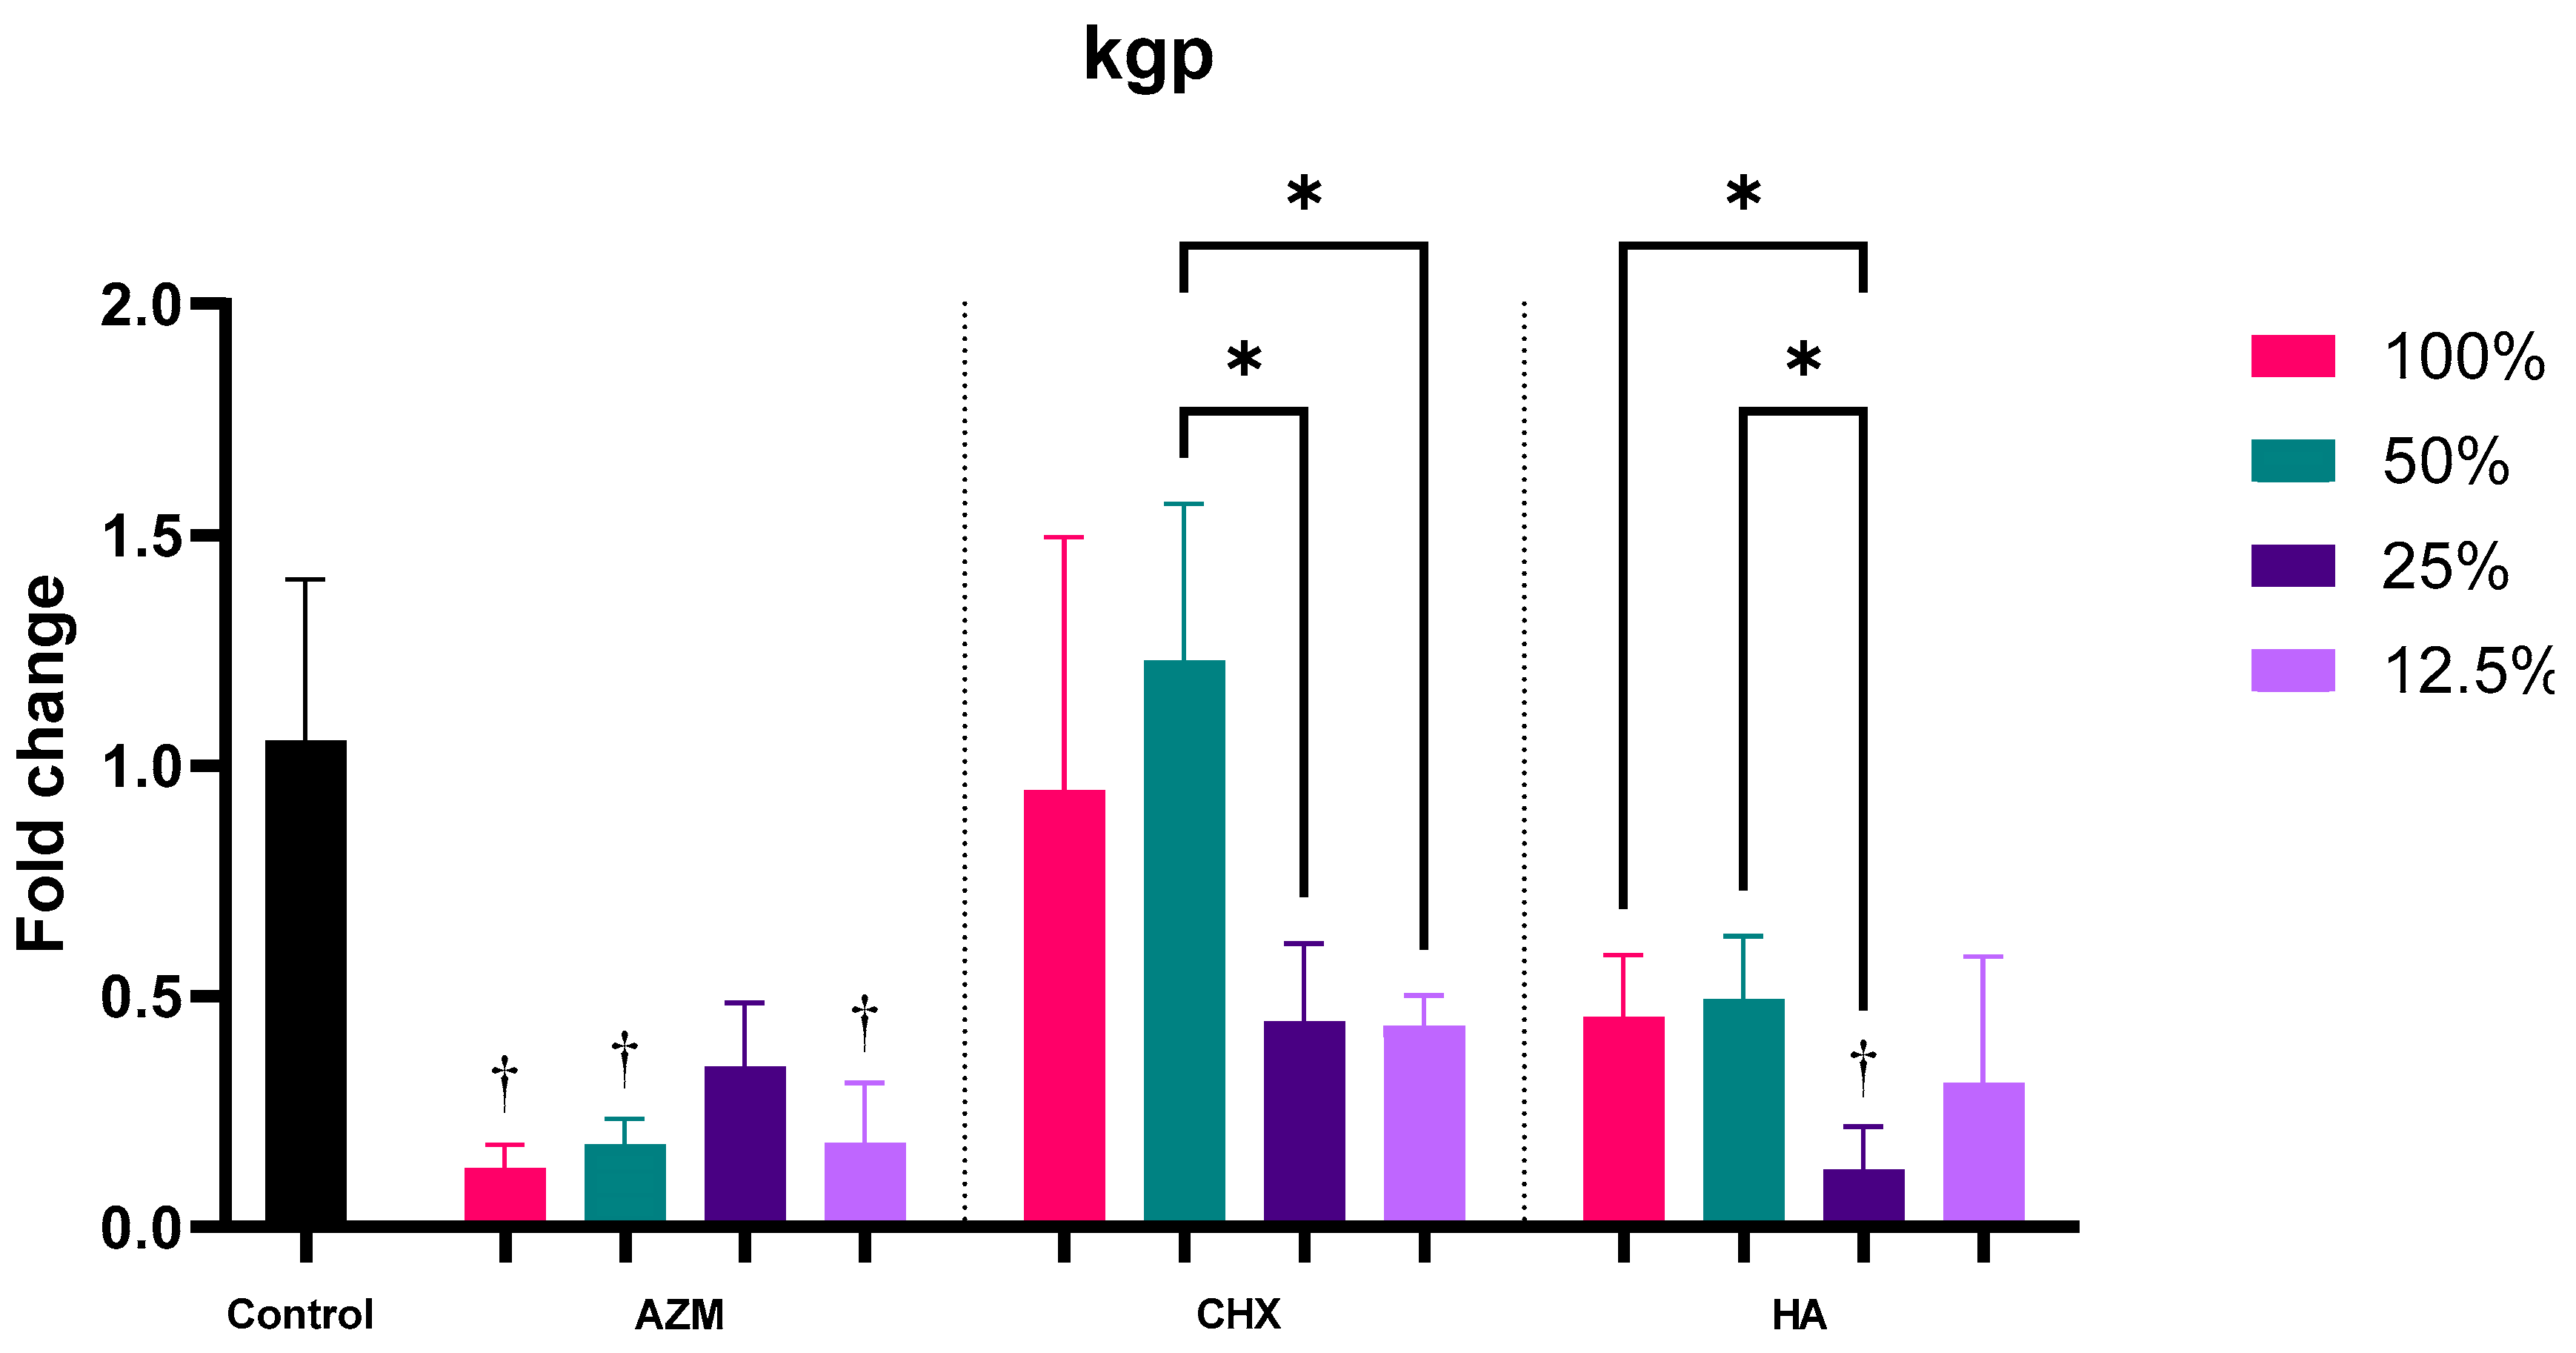
3.2.6. kgp
4. Discussion
5. Conclusions
Supplementary Materials
Author Contributions
Funding
Data Availability Statement
Acknowledgments
Conflicts of Interest
References
- Curtis, M.A.; Diaz, P.I.; Van Dyke, T.E. The role of the microbiota in periodontal disease. Periodontol. 2000 2020, 83, 14–25. [Google Scholar] [CrossRef] [PubMed]
- Daubert, D.M.; Weinstein, B.F. Biofilm as a risk factor in implant treatment. Periodontol. 2000 2019, 81, 29–40. [Google Scholar] [CrossRef]
- Rosier, B.T.; De Jager, M.; Zaura, E.; Krom, B.P. Historical and contemporary hypotheses on the development of oral diseases: Are we there yet? Front. Cell. Infect. Microbiol. 2014, 4, 92. [Google Scholar] [CrossRef] [PubMed] [Green Version]
- Kornman, K.S. Mapping the pathogenesis of periodontitis: A new look. J. Periodontol. 2008, 79, 1560–1568. [Google Scholar] [CrossRef] [PubMed]
- Socransky, S.S.; Haffajee, A.D.; Cugini, M.A.; Smith, C.; Kent, R.L., Jr. Microbial complexes in subgingival plaque. J. Clin. Periodontol. 1998, 25, 134–144. [Google Scholar] [CrossRef] [PubMed]
- Hajishengallis, G.; Darveau, R.P.; Curtis, M.A. The keystone-pathogen hypothesis. Nat. Rev. Microbiol. 2012, 10, 717–725. [Google Scholar] [CrossRef] [PubMed]
- Hajishengallis, G.; Liang, S.; Payne, M.A.; Hashim, A.; Jotwani, R.; Eskan, M.A.; McIntosh, M.L.; Alsam, A.; Kirkwood, K.L.; Lambris, J.D.; et al. Low-abundance biofilm species orchestrates inflammatory periodontal disease through the commensal microbiota and complement. Cell Host Microbe 2011, 10, 497–506. [Google Scholar] [CrossRef] [Green Version]
- Frias-Lopez, J.; Duran-Pinedo, A. Effect of periodontal pathogens on the metatranscriptome of a healthy multispecies biofilm model. J. Bacteriol. 2012, 194, 2082–2095. [Google Scholar] [CrossRef] [Green Version]
- How, K.Y.; Song, K.P.; Chan, K.G. Porphyromonas gingivalis: An Overview of Periodontopathic Pathogen below the Gum Line. Front. Microbiol. 2016, 7, 53. [Google Scholar] [CrossRef] [PubMed]
- Laine, M.L.; Appelmelk, B.J.; van Winkelhoff, A.J. Prevalence and distribution of six capsular serotypes of Porphyromonas gingivalis in periodontitis patients. J. Dent. Res. 1997, 76, 1840–1844. [Google Scholar] [CrossRef]
- Yoshimura, F.; Murakami, Y.; Nishikawa, K.; Hasegawa, Y.; Kawaminami, S. Surface components of Porphyromonas gingivalis. J. Periodontal Res. 2009, 44, 1–12. [Google Scholar] [CrossRef] [PubMed]
- Lunar Silva, I.; Cascales, E. Molecular Strategies Underlying Porphyromonas gingivalis Virulence. J. Mol. Biol. 2021, 433, 166836. [Google Scholar] [CrossRef] [PubMed]
- Kamaguchi, A.; Ohyama, T.; Sakai, E.; Nakamura, R.; Watanabe, T.; Baba, H.; Nakayama, K. Adhesins encoded by the gingipain genes of Porphyromonas gingivalis are responsible for co-aggregation with Prevotella intermedia. Microbiology 2003, 149, 1257–1264. [Google Scholar] [CrossRef] [PubMed]
- Herrera, D.; Matesanz, P.; Bascones-Martinez, A.; Sanz, M. Local and systemic antimicrobial therapy in periodontics. J. Evid. -Based Dent. Pract. 2012, 12, 50–60. [Google Scholar] [CrossRef]
- Sanz, M.; Herrera, D.; Kebschull, M.; Chapple, I.; Jepsen, S.; Beglundh, T.; Sculean, A.; Tonetti, M.S.; Participants, E.F.P.W.; Methodological, C. Treatment of stage I-III periodontitis-The EFP S3 level clinical practice guideline. J. Clin. Periodontol. 2020, 47, 4–60. [Google Scholar] [CrossRef] [PubMed]
- Esposito, M.; Grusovin, M.G.; Worthington, H.V. Interventions for replacing missing teeth: Antibiotics at dental implant placement to prevent complications. Cochrane Database Syst. Rev. 2013, 2013, CD004152. [Google Scholar] [CrossRef] [PubMed]
- Renvert, S.; Roos-Jansaker, A.M.; Claffey, N. Non-surgical treatment of peri-implant mucositis and peri-implantitis: A literature review. J. Clin. Periodontol. 2008, 35, 305–315. [Google Scholar] [CrossRef]
- Ronay, V.; Merlini, A.; Attin, T.; Schmidlin, P.R.; Sahrmann, P. In vitro cleaning potential of three implant debridement methods. Simulation of the non-surgical approach. Clin. Oral Implant. Res. 2017, 28, 151–155. [Google Scholar] [CrossRef] [Green Version]
- Ardizzoni, A.; Neglia, R.G.; Baschieri, M.C.; Cermelli, C.; Caratozzolo, M.; Righi, E.; Palmieri, B.; Blasi, E. Influence of hyaluronic acid on bacterial and fungal species, including clinically relevant opportunistic pathogens. J. Mater. Sci. Mater. Med. 2011, 22, 2329–2338. [Google Scholar] [CrossRef] [Green Version]
- Balazs, E.A.; Laurent, T.C.; Jeanloz, R.W. Nomenclature of hyaluronic acid. Biochem. J. 1986, 235, 903. [Google Scholar] [CrossRef]
- Romano, C.L.; De Vecchi, E.; Bortolin, M.; Morelli, I.; Drago, L. Hyaluronic Acid and Its Composites as a Local Antimicrobial/Antiadhesive Barrier. J. Bone Jt. Infect. 2017, 2, 63–72. [Google Scholar] [CrossRef] [Green Version]
- Gupta, R.C.; Lall, R.; Srivastava, A.; Sinha, A. Hyaluronic Acid: Molecular Mechanisms and Therapeutic Trajectory. Front. Vet. Sci. 2019, 6, 192. [Google Scholar] [CrossRef] [PubMed] [Green Version]
- Chen, M.; Li, L.; Wang, Z.; Li, P.; Feng, F.; Zheng, X. High molecular weight hyaluronic acid regulates P. gingivalis-induced inflammation and migration in human gingival fibroblasts via MAPK and NF-kappaB signaling pathway. Arch. Oral Biol. 2019, 98, 75–80. [Google Scholar] [CrossRef]
- Takahashi, K.; Goomer, R.S.; Harwood, F.; Kubo, T.; Hirasawa, Y.; Amiel, D. The effects of hyaluronan on matrix metalloproteinase-3 (MMP-3), interleukin-1beta(IL-1beta), and tissue inhibitor of metalloproteinase-1 (TIMP-1) gene expression during the development of osteoarthritis. Osteoarthr. Cartil. 1999, 7, 182–190. [Google Scholar] [CrossRef] [PubMed] [Green Version]
- Wang, C.-T.; Lin, Y.-T.; Chiang, B.-L.; Lin, Y.-H.; Hou, S.-M. High molecular weight hyaluronic acid down-regulates the gene expression of osteoarthritis-associated cytokines and enzymes in fibroblast-like synoviocytes from patients with early osteoarthritis. Osteoarthr. Cartil. 2006, 14, 1237–1247. [Google Scholar] [CrossRef] [PubMed] [Green Version]
- Gotoh, S.; Onaya, J.; Abe, M.; Miyazaki, K.; Hamai, A.; Horie, K.; Tokuyasu, K. Effects of the molecular weight of hyaluronic acid and its action mechanisms on experimental joint pain in rats. Ann. Rheum. Dis. 1993, 52, 817–822. [Google Scholar] [CrossRef] [PubMed]
- Hashizume, M.; Koike, N.; Yoshida, H.; Suzuki, M.; Mihara, M. High molecular weight hyaluronic acid relieved joint pain and prevented the progression of cartilage degeneration in a rabbit osteoarthritis model after onset of arthritis. Mod. Rheumatol. 2010, 20, 432–438. [Google Scholar] [CrossRef]
- Sasaki, T.; Watanabe, C. Stimulation of osteoinduction in bone wound healing by high-molecular hyaluronic acid. Bone 1995, 16, 9–15. [Google Scholar] [CrossRef]
- Cankaya, Z.T.; Gurbuz, S.; Bakirarar, B.; Kurtis, B. Evaluation of the Effect of Hyaluronic Acid Application on the Vascularization of Free Gingival Graft for Both Donor and Recipient Sites with Laser Doppler Flowmetry: A Randomized, Examiner-Blinded, Controlled Clinical Trial. Int. J. Periodontics Restor. Dent. 2020, 40, 233–243. [Google Scholar] [CrossRef] [PubMed]
- Mamajiwala, A.S.; Sethi, K.S.; Raut, C.P.; Karde, P.A.; Mamajiwala, B.S. Clinical and radiographic evaluation of 0.8% hyaluronic acid as an adjunct to open flap debridement in the treatment of periodontal intrabony defects: Randomized controlled clinical trial. Clin. Oral Investig. 2021, 25, 5257–5271. [Google Scholar] [CrossRef]
- Matheus, H.R.; Ervolino, E.; Gusman, D.J.R.; Alves, B.E.S.; Fiorin, L.G.; Pereira, P.A.; de Almeida, J.M. Association of hyaluronic acid with a deproteinized bovine graft improves bone repair and increases bone formation in critical-size bone defects. J. Periodontol. 2020, 92, 1646–1658. [Google Scholar] [CrossRef] [PubMed]
- Shirakata, Y.; Imafuji, T.; Nakamura, T.; Kawakami, Y.; Shinohara, Y.; Noguchi, K.; Pilloni, A.; Sculean, A. Periodontal wound healing/regeneration of two-wall intrabony defects following reconstructive surgery with cross-linked hyaluronic acid-gel with or without a collagen matrix: A preclinical study in dogs. Quintessence Int. 2021, 52, 308–316. [Google Scholar] [CrossRef]
- Shirakata, Y.; Nakamura, T.; Kawakami, Y.; Imafuji, T.; Shinohara, Y.; Noguchi, K.; Sculean, A. Healing of buccal gingival recessions following treatment with coronally advanced flap alone or combined with a cross-linked hyaluronic acid gel. An experimental study in dogs. J. Clin. Periodontol. 2021, 48, 570–580. [Google Scholar] [CrossRef]
- Pirnazar, P.; Wolinsky, L.; Nachnani, S.; Haake, S.; Pilloni, A.; Bernard, G.W. Bacteriostatic effects of hyaluronic acid. J. Periodontol. 1999, 70, 370–374. [Google Scholar] [CrossRef] [PubMed]
- Binshabaib, M.; Aabed, K.; Alotaibi, F.; Alwaqid, M.; Alfraidy, A.; Alharthi, S. Antimicrobial efficacy of 0.8% Hyaluronic Acid and 0.2% Chlorhexidine against Porphyromonas gingivalis strains: An in-vitro study. Pak. J. Med. Sci. 2020, 36, 111–114. [Google Scholar] [CrossRef] [PubMed] [Green Version]
- Naito, M.; Hirakawa, H.; Yamashita, A.; Ohara, N.; Shoji, M.; Yukitake, H.; Nakayama, K.; Toh, H.; Yoshimura, F.; Kuhara, S.; et al. Determination of the genome sequence of Porphyromonas gingivalis strain ATCC 33277 and genomic comparison with strain W83 revealed extensive genome rearrangements in P. gingivalis. DNA Res. 2008, 15, 215–225. [Google Scholar] [CrossRef] [PubMed] [Green Version]
- Rodrigues, S.V.; Acharya, A.B.; Bhadbhade, S.; Thakur, S.L. Hyaluronan-containing mouthwash as an adjunctive plaque-control agent. Oral Health Prev. Dent. 2010, 8, 389–394. [Google Scholar] [PubMed]
- Ahmedbeyli, D.R. Clinical and microbiological evaluation of hyaluronic acid and chlorhexidine mouthwash in the treatment of peri-implant mucositis. Stomatologiia 2021, 100, 24–28. [Google Scholar] [CrossRef]
- Gizligoz, B.; Ince Kuka, G.; Tunar, O.L.; Ozkan Karaca, E.; Gursoy, H.; Kuru, B. Plaque Inhibitory Effect of Hyaluronan-Containing Mouthwash in a 4-Day Non-Brushing Model. Oral Health Prev. Dent. 2020, 18, 61–70. [Google Scholar] [CrossRef] [PubMed]
- Kan, P.; Sasaki, H.; Inaba, K.; Watanabe, K.; Hamada, N.; Minabe, M. Inhibitory effects of azithromycin on the adherence ability of Porphyromonas gingivalis. J. Periodontol. 2019, 90, 903–910. [Google Scholar] [CrossRef]
- Kirkwood, Z.I.; Millar, B.C.; Downey, D.G.; Moore, J.E. Antimicrobial effect of dimethyl sulfoxide and N, N-Dimethylformamide on Mycobacterium abscessus: Implications for antimicrobial susceptibility testing. Int. J. Mycobacteriol. 2018, 7, 134–136. [Google Scholar] [CrossRef] [PubMed]
- Potempa, J.; Banbula, A.; Travis, J. Role of bacterial proteinases in matrix destruction and modulation of host responses. Periodontol 2000 2000, 24, 153–192. [Google Scholar] [CrossRef] [PubMed]


| Gene | Sequence | |
|---|---|---|
| 16S rRNA | F | AGTCGCGTGAAGGAAGACTG |
| R | TACCGAACAACCTACGCACC | |
| fimA | F | TGTTGGGACTTGCTGCTCTT |
| R | TTCGTCATCGCCAACTCCAA | |
| mfa1 | F | GATCCTGCAACCCACAATGC |
| R | AGCCTGAGCCTGAGTAGACA | |
| hagA | F | CCGCGAGATTCTGGGCAATA |
| R | CCTGCTCCGATGAACTTGGT | |
| rgpA | F | GTTCCATCACCGCTACCCAT |
| R | GGACAAGGACCGACGAAAGA | |
| rgpB | F | CGTCTTGCCTTCAGTAGCGA |
| R | TGTAGAAAGTCCTGCTGCCG | |
| kgp | F | GACCCTGCGTTGTAGCAGT |
| R | GGTGTTGCTAATGCCAGCG | |
| Mean | Std. Deviation | ANOVA (p-Value) | 95% Confidence Interval for Mean | Games-Howell Post-Hoc Test (p-Value) | ||||
|---|---|---|---|---|---|---|---|---|
| Lower Bound | Upper Bound | CHX | HA | Control | ||||
| AZM | 0.31 | 0.24 | 0.000 | 0.2686 | 0.3462 | 0.000 | 0.000 | 0.000 |
| CHX | 0.84 | 0.77 | 0.7134 | 0.9679 | 0.000 | 0.074 | ||
| HA | 0.46 | 0.33 | 0.4066 | 0.5151 | 0.000 | |||
| Control | 1.03 | 0.24 | 0.9445 | 1.106 | ||||
Publisher’s Note: MDPI stays neutral with regard to jurisdictional claims in published maps and institutional affiliations. |
© 2022 by the authors. Licensee MDPI, Basel, Switzerland. This article is an open access article distributed under the terms and conditions of the Creative Commons Attribution (CC BY) license (https://creativecommons.org/licenses/by/4.0/).
Share and Cite
Alharbi, M.S.; Alshehri, F.A. High Molecular Weight Hyaluronic Acid Reduces the Expression of Virulence Genes fimA, mfa1, hagA, rgpA, and kgp in the Oral Pathogen Porphyromonas gingivalis. Pharmaceutics 2022, 14, 1628. https://doi.org/10.3390/pharmaceutics14081628
Alharbi MS, Alshehri FA. High Molecular Weight Hyaluronic Acid Reduces the Expression of Virulence Genes fimA, mfa1, hagA, rgpA, and kgp in the Oral Pathogen Porphyromonas gingivalis. Pharmaceutics. 2022; 14(8):1628. https://doi.org/10.3390/pharmaceutics14081628
Chicago/Turabian StyleAlharbi, Meshal S., and Fahad A. Alshehri. 2022. "High Molecular Weight Hyaluronic Acid Reduces the Expression of Virulence Genes fimA, mfa1, hagA, rgpA, and kgp in the Oral Pathogen Porphyromonas gingivalis" Pharmaceutics 14, no. 8: 1628. https://doi.org/10.3390/pharmaceutics14081628