
Molecular Biocompatibility of a Silver Nanoparticle Complex with Graphene Oxide to Human Skin in a 3D Epidermis In Vitro Model

 , , , , , and
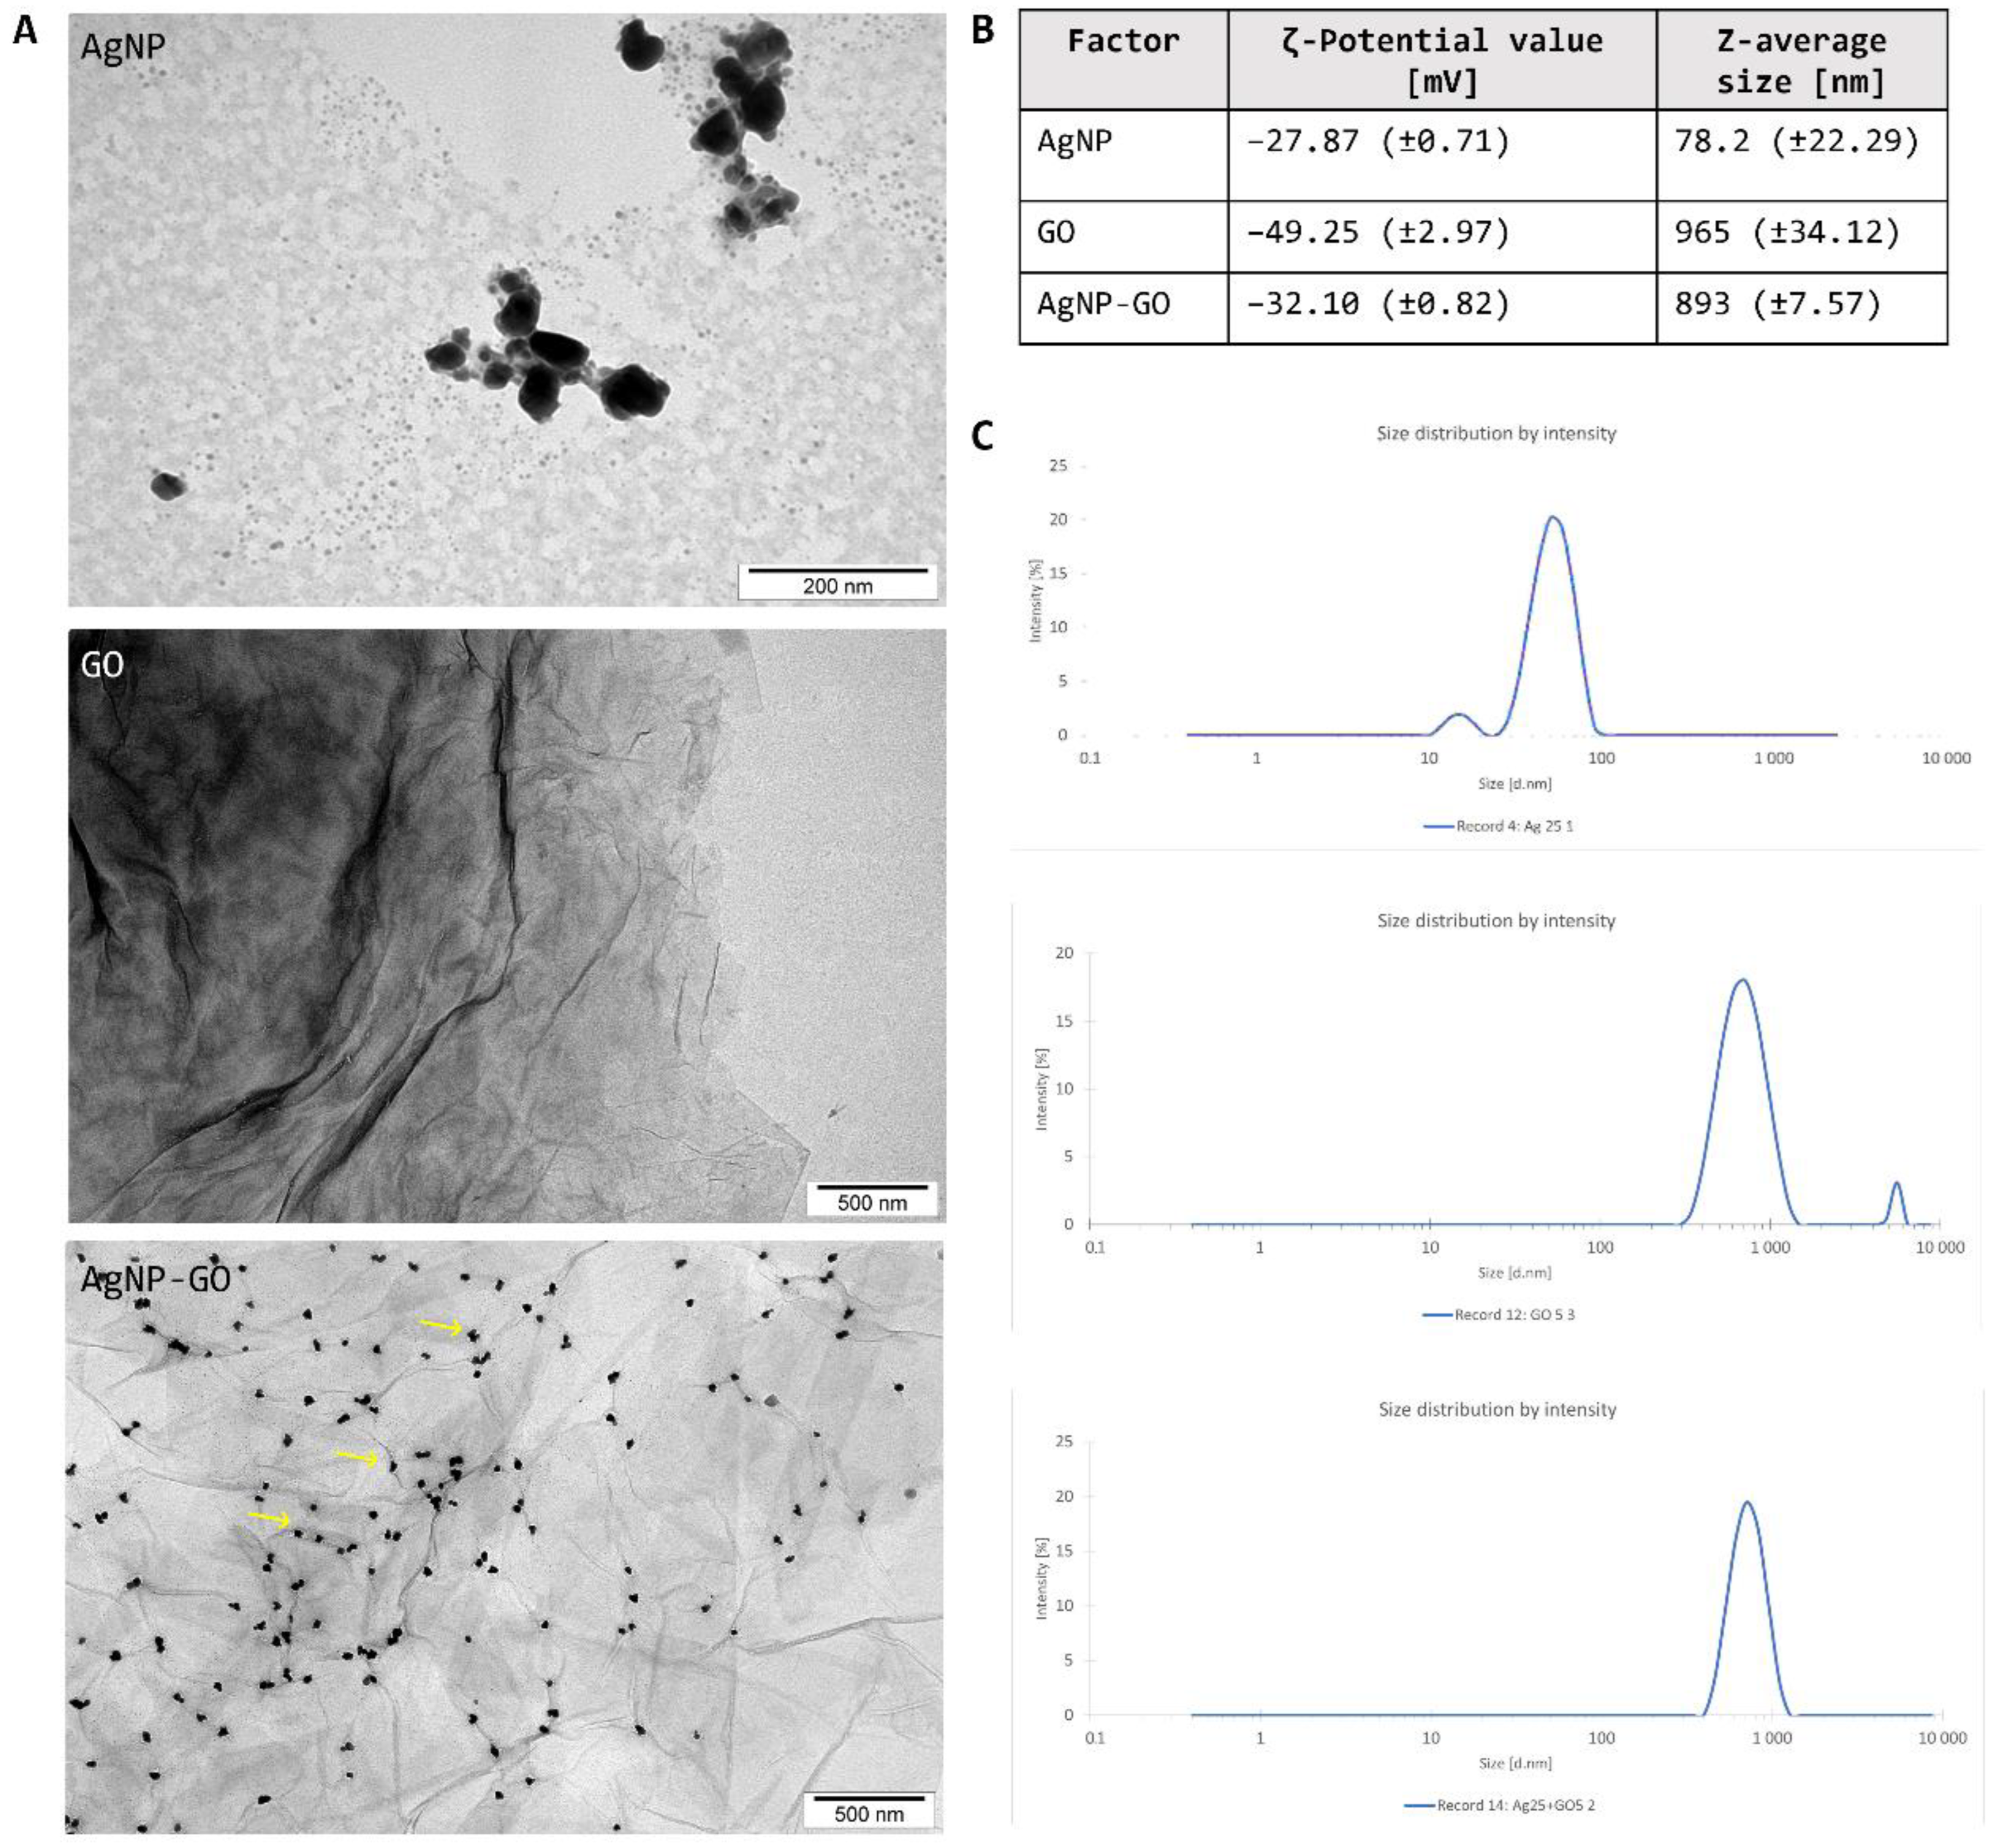
Abstract
:1. Introduction
2. Materials and Methods
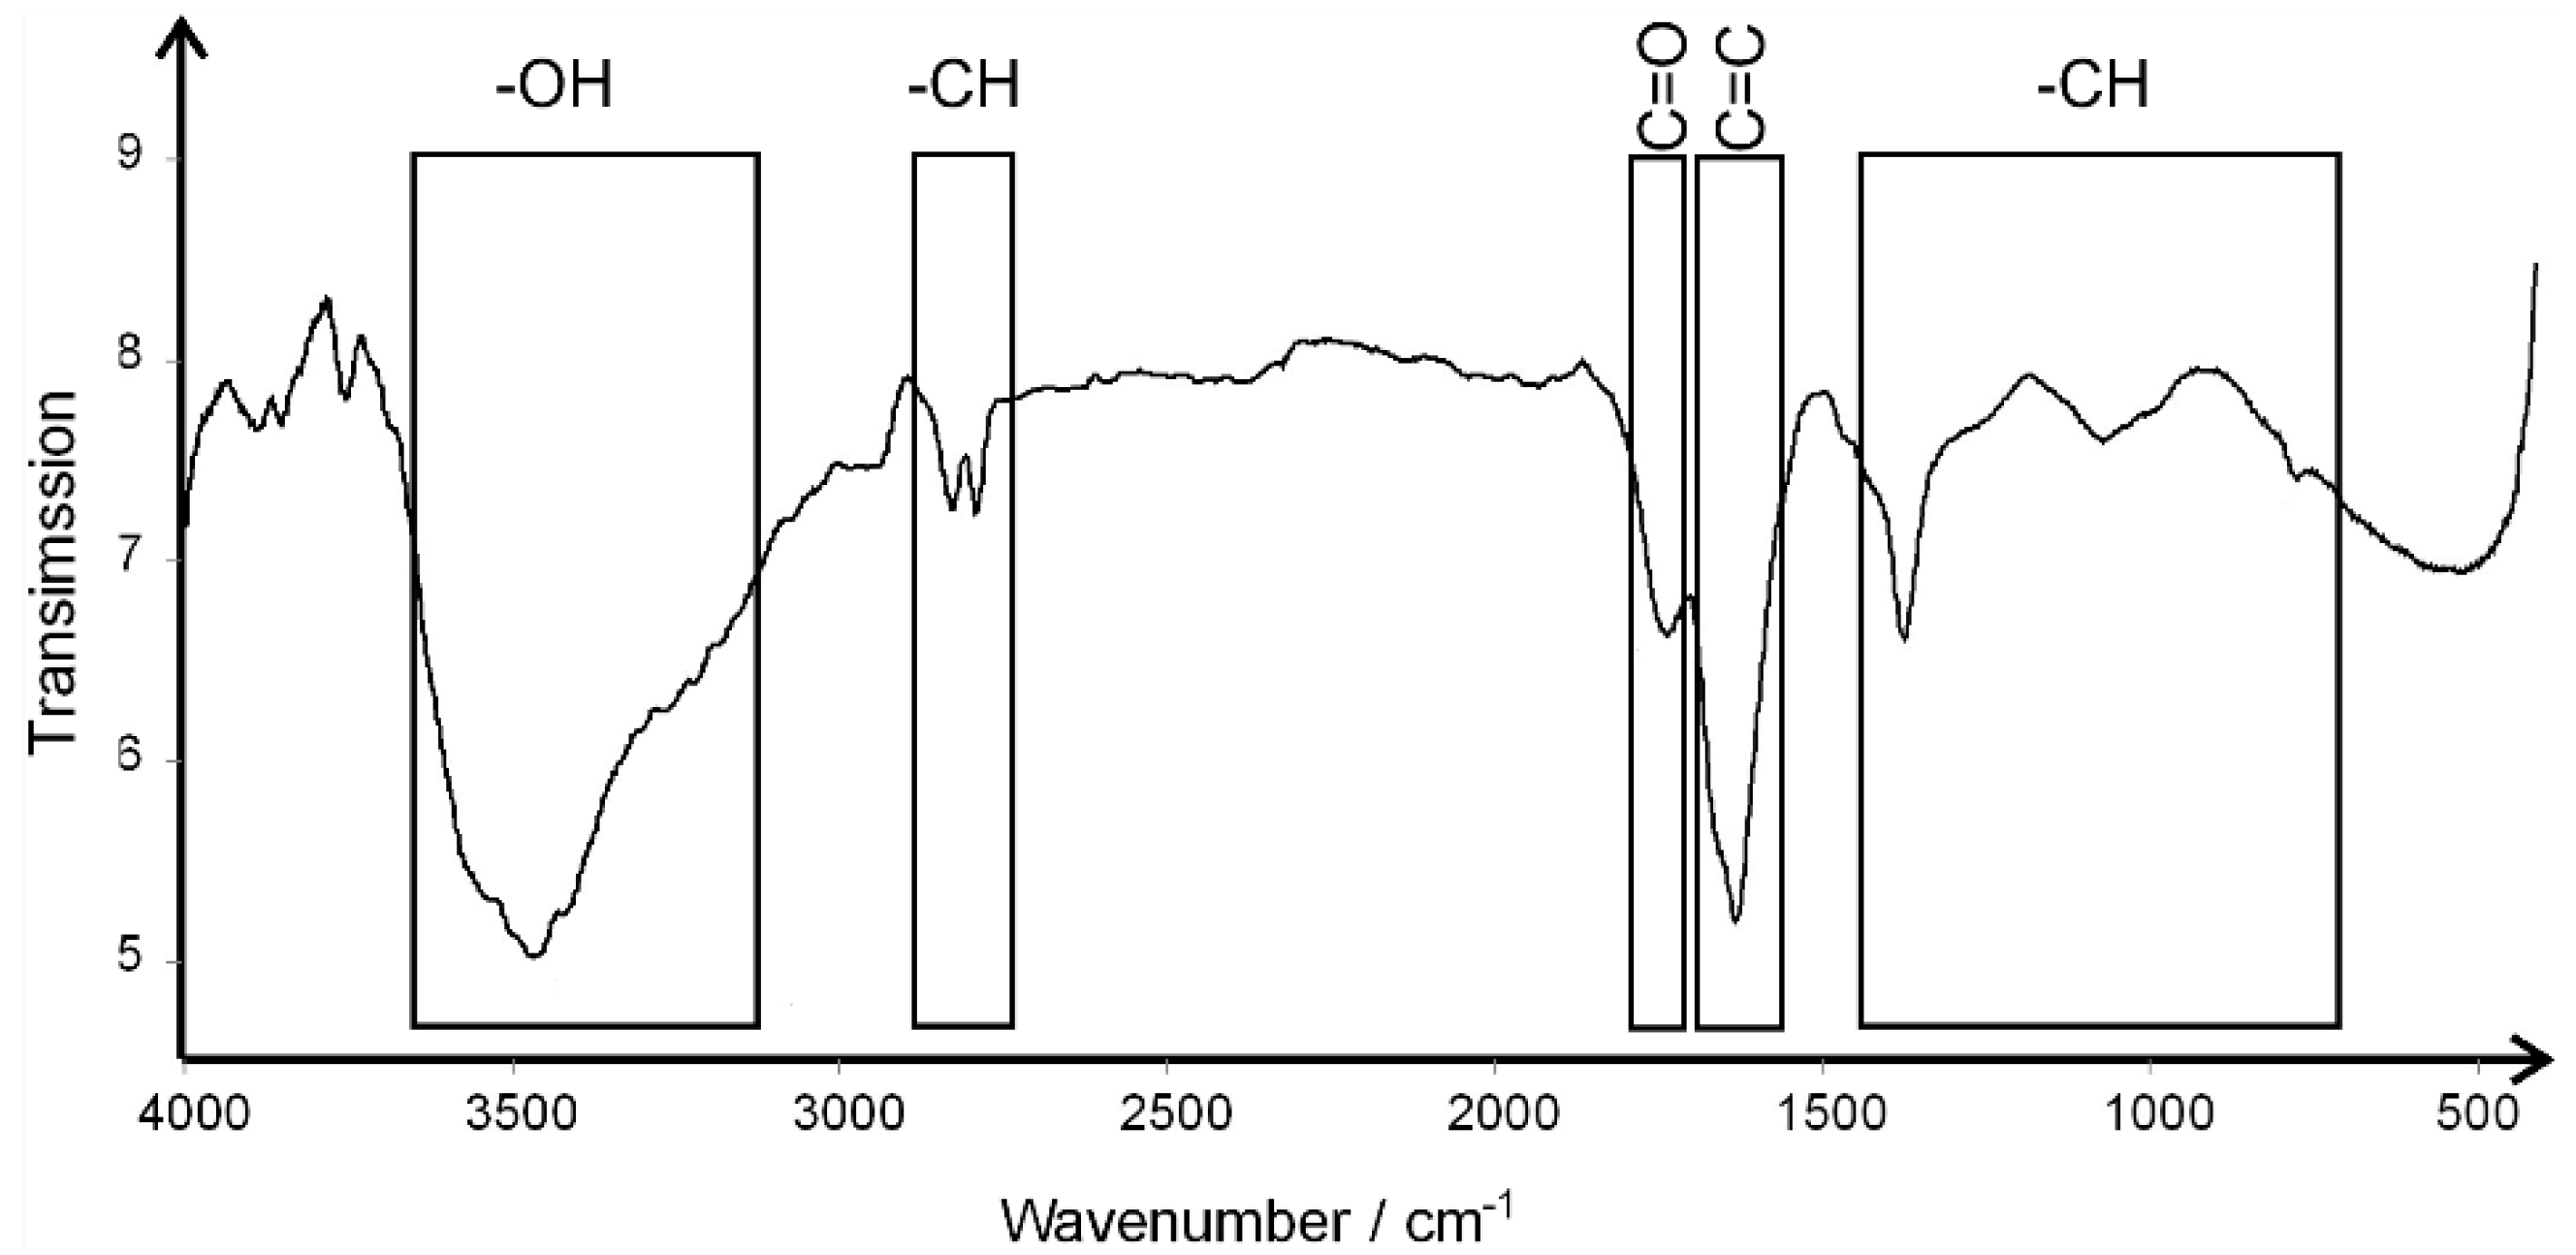
2.1. Characterization of Experimental Factors
2.2. Model Description and Experimental Design
2.3. MTT Viability Test
2.4. Determination of IL-1α Concentration in Medium
2.5. Activity State of the Inflammatory Cytokines
2.6. DNA Damage Evaluation by Detecting 8-Hydroxy-2-Deoxyguanosine Concentration (ELISA Kit)
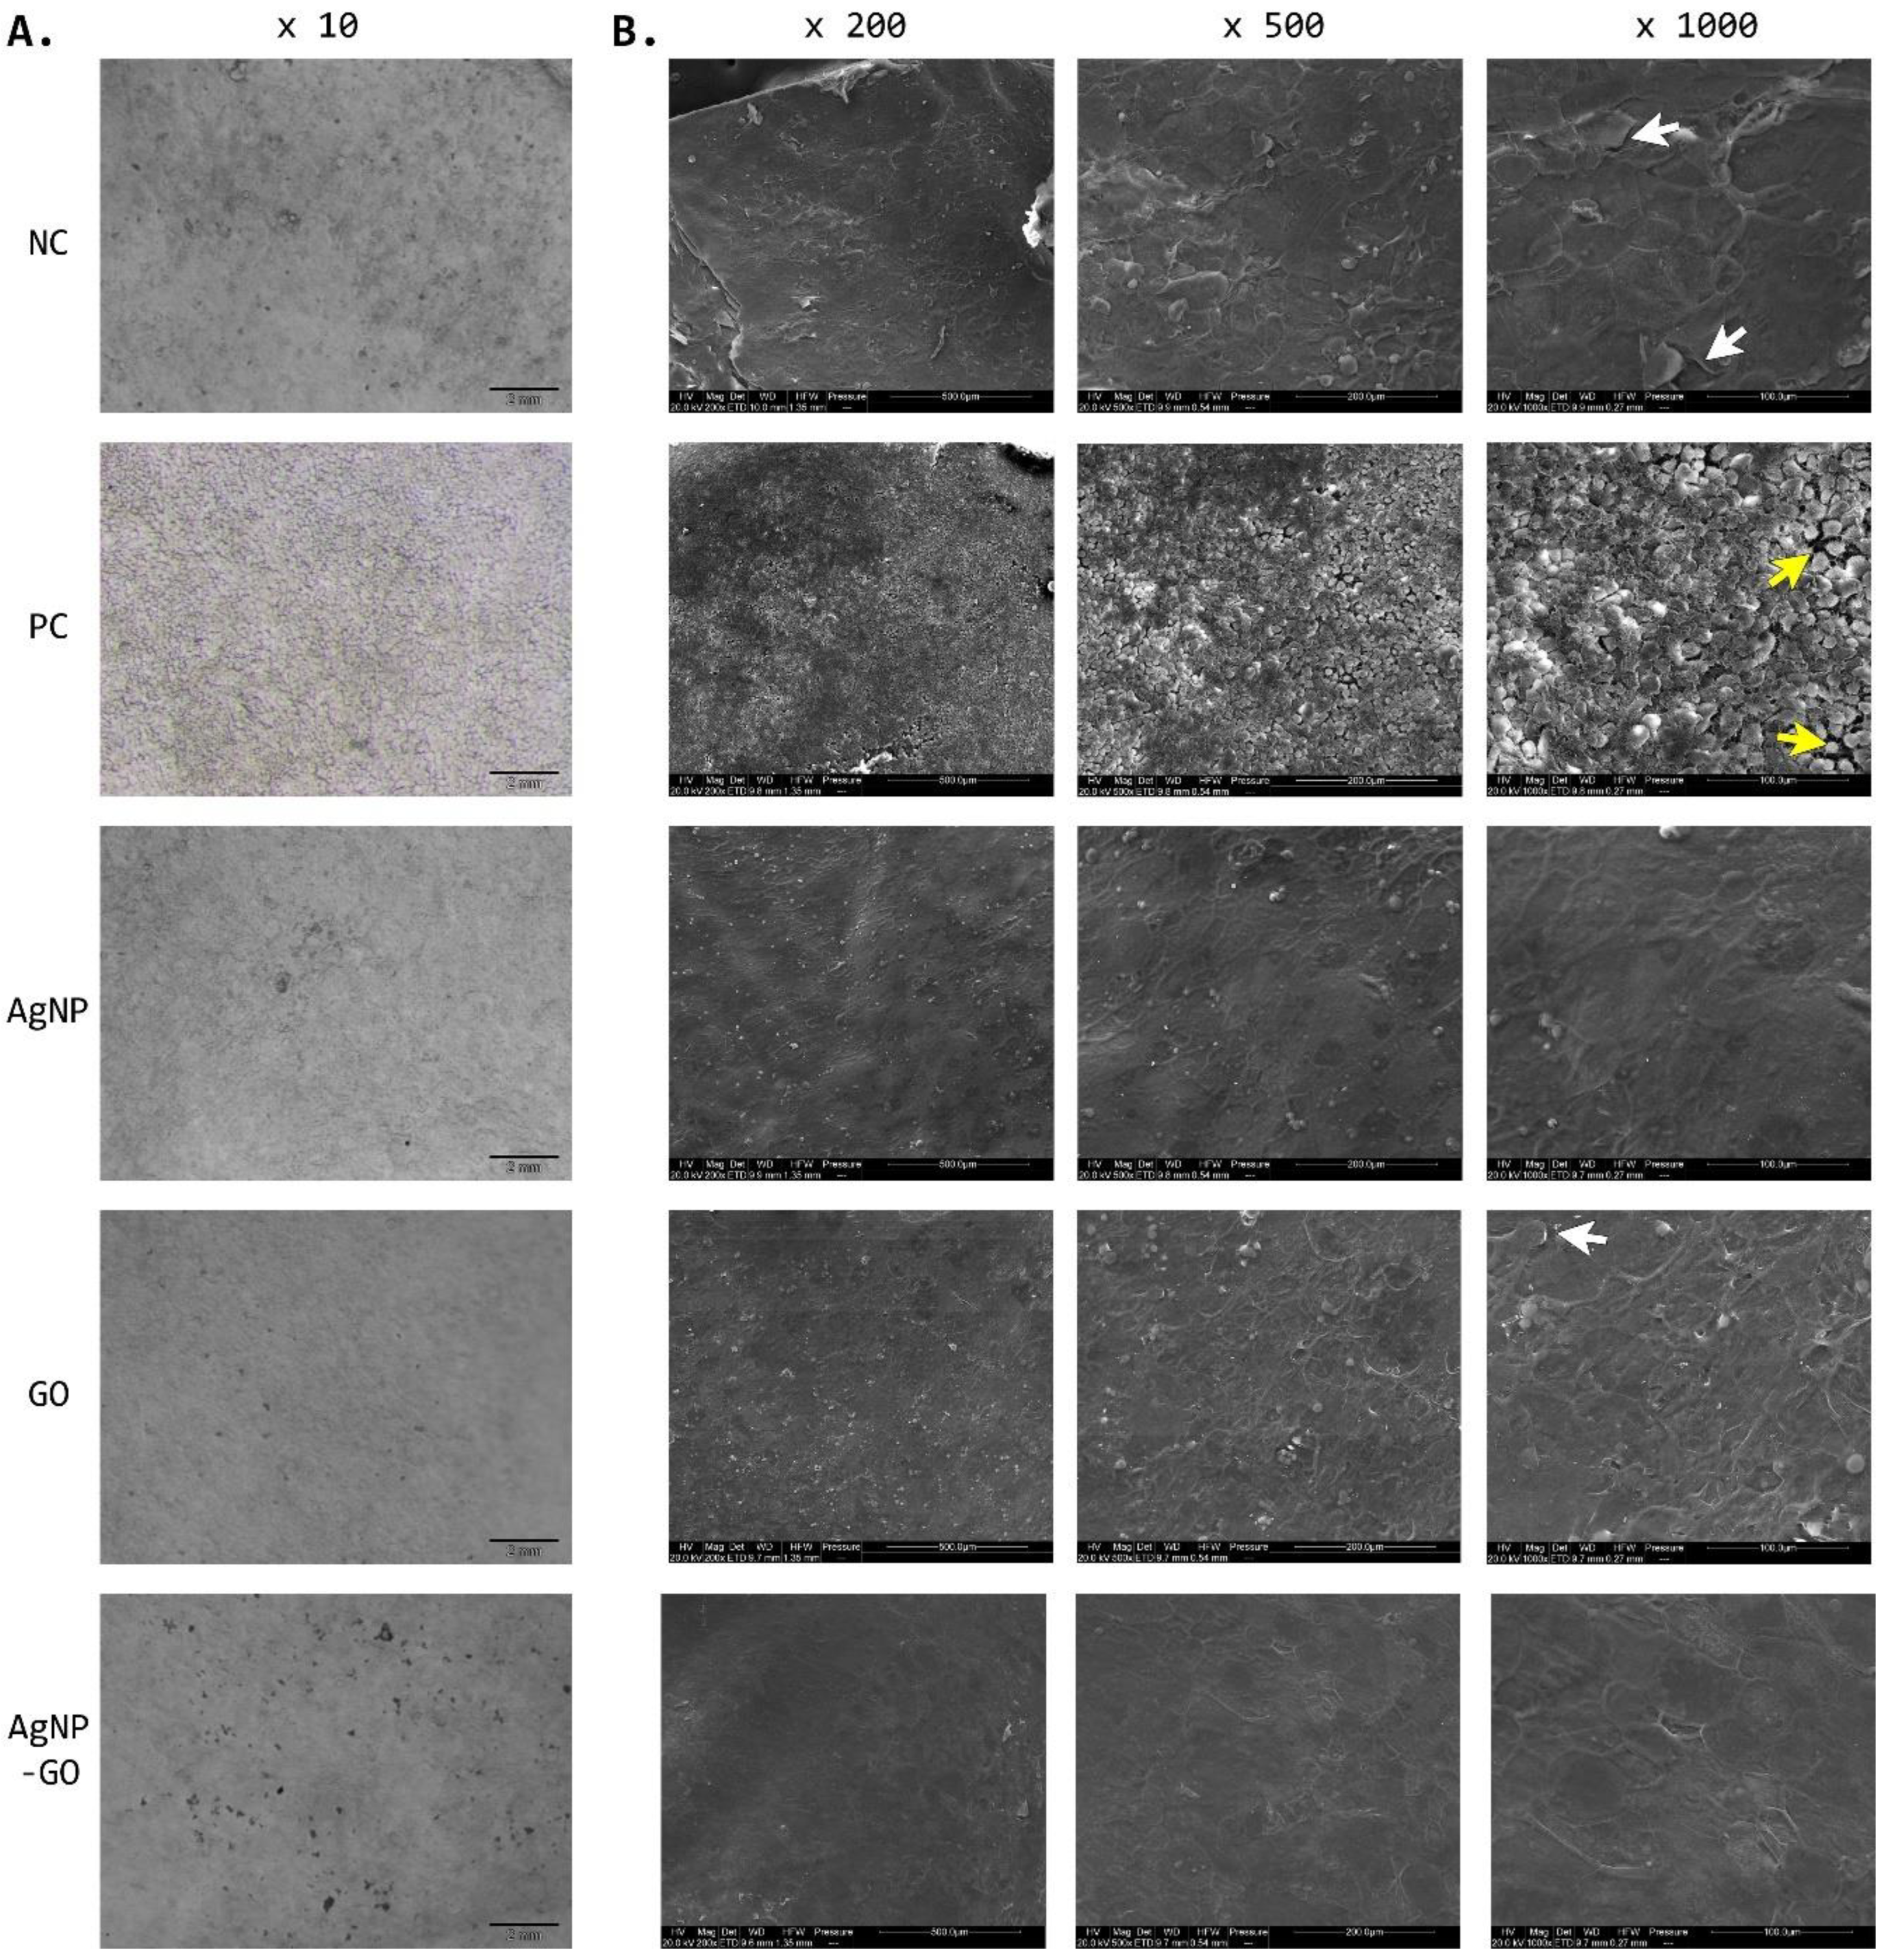
2.7. Visualization of the EpiDerm™
2.8. Statistical Analysis
3. Results
3.1. The Characterization of the Experimental Factors
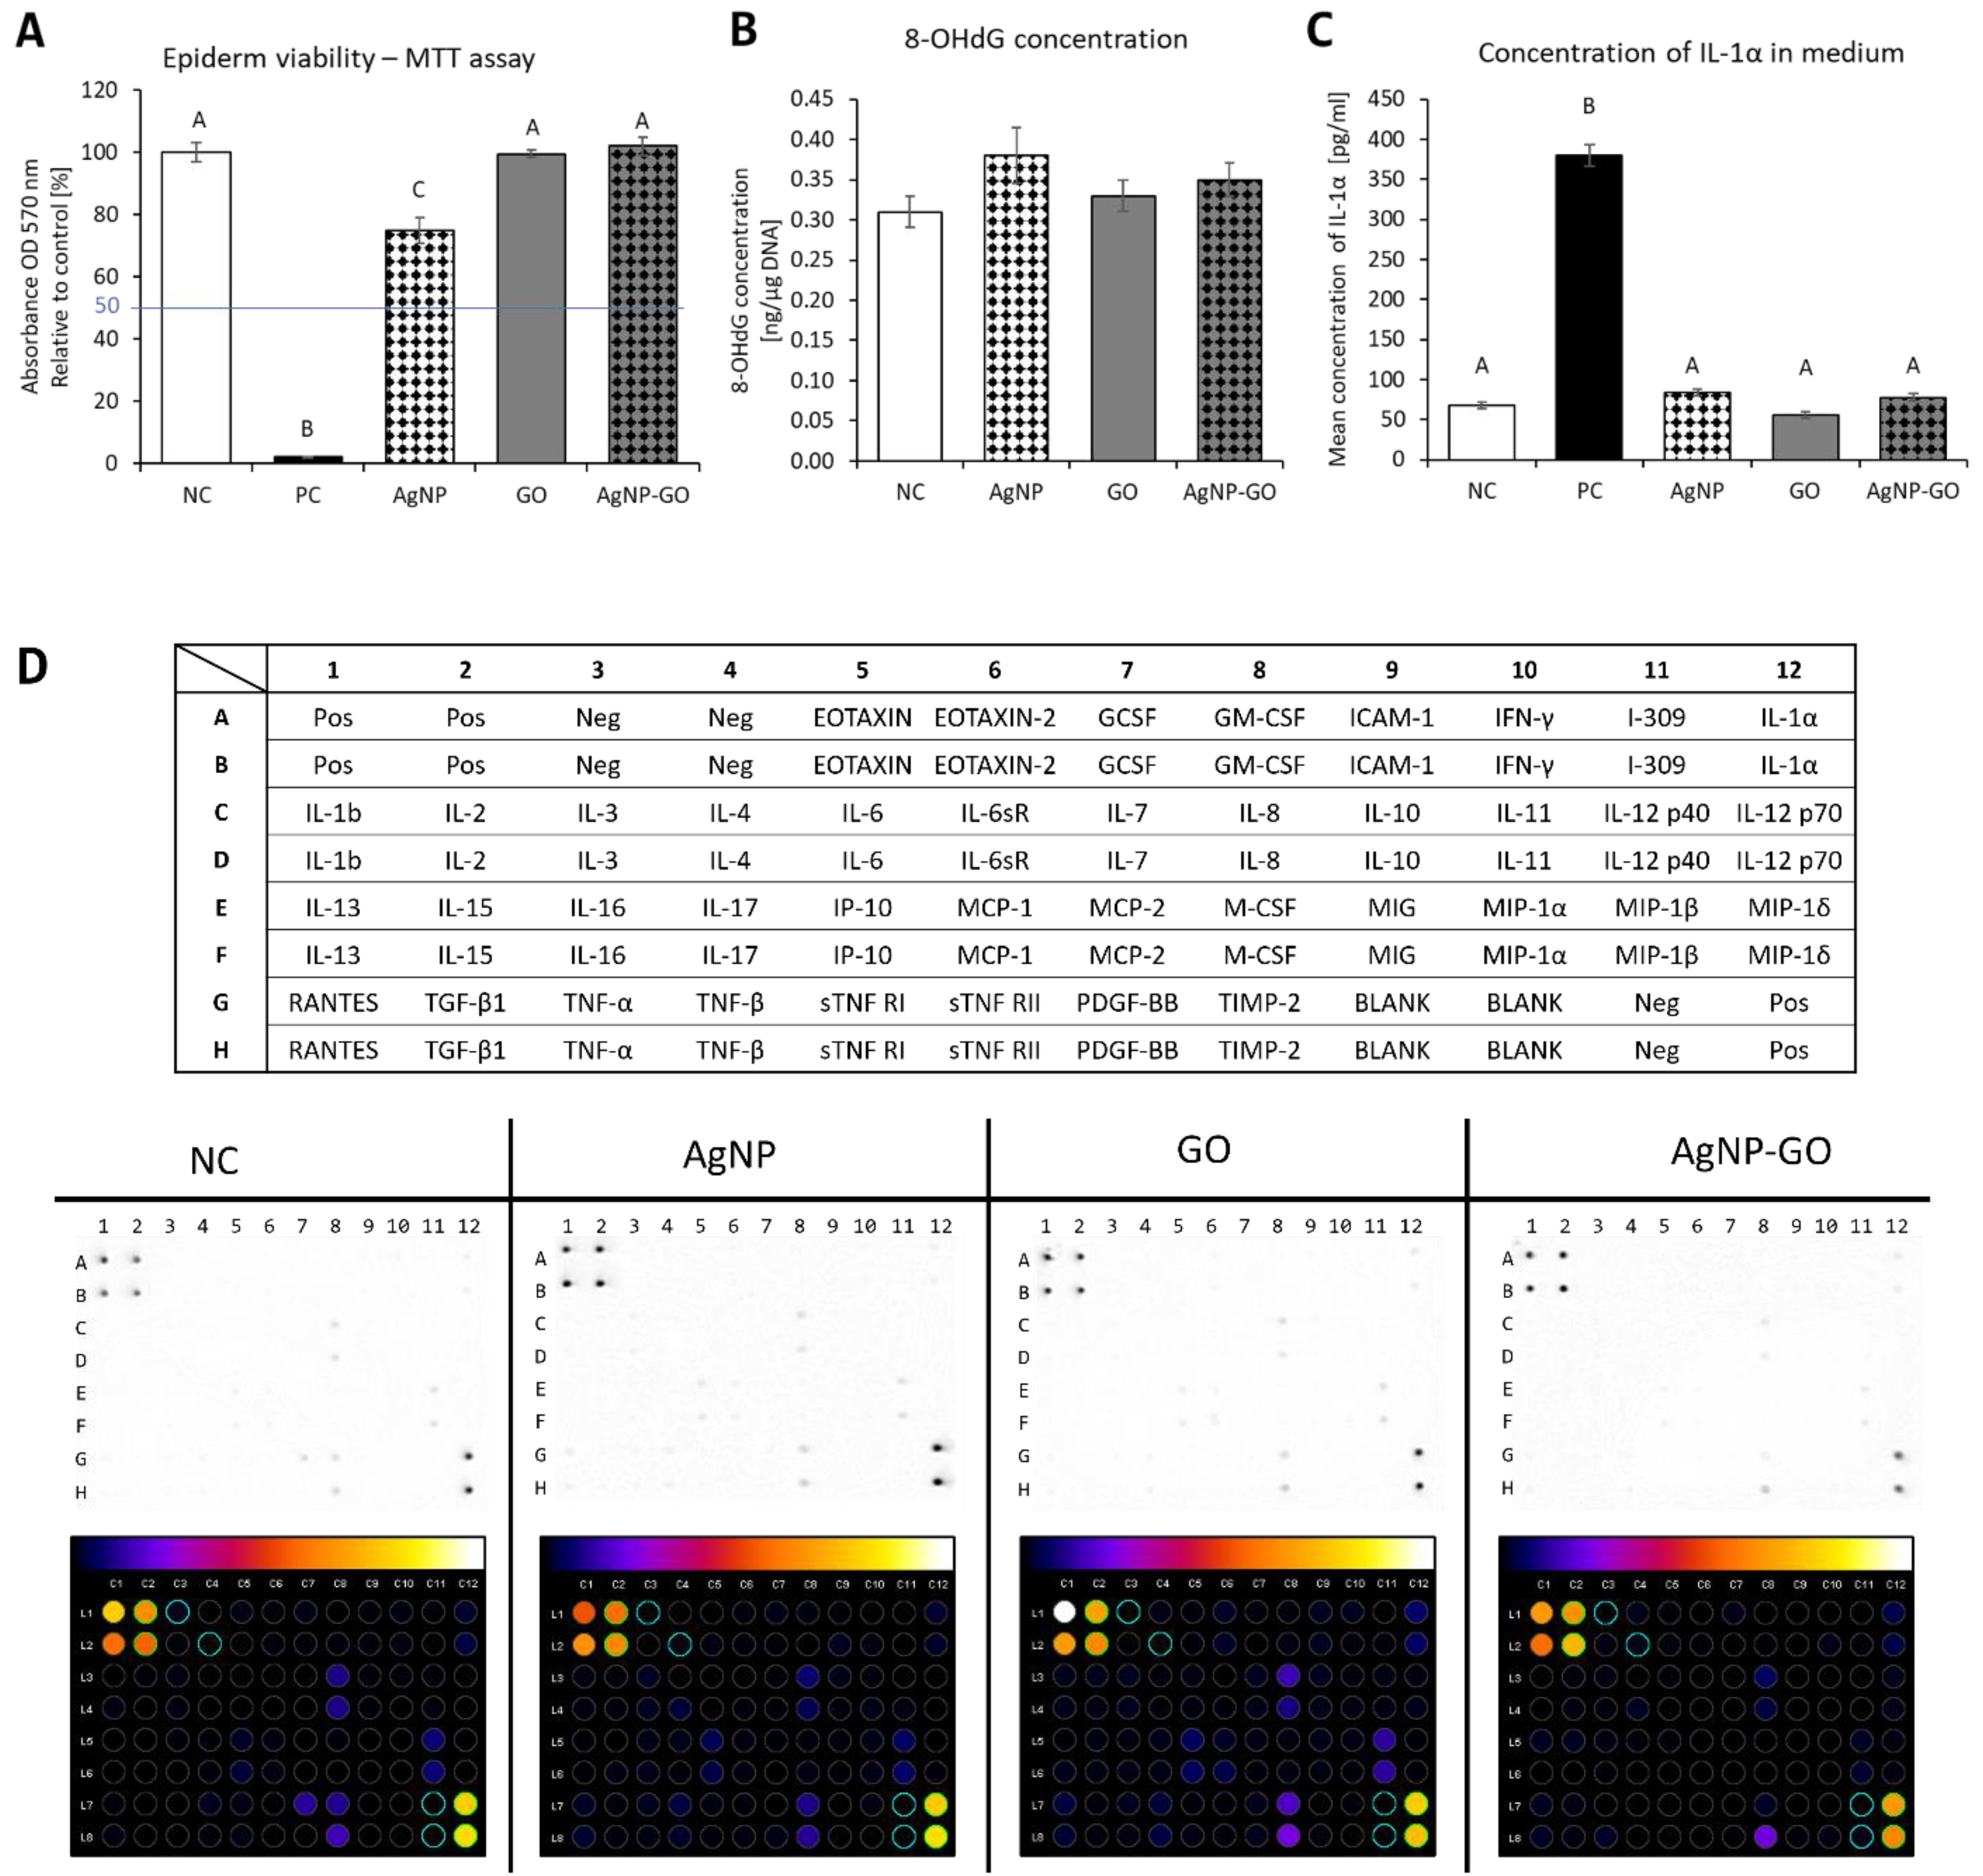
3.2. Assessment of Cytotoxicity of the Experimental Factors
3.3. Genotoxicity Potential of Nanomaterials
3.4. Effect of Nanomaterials on Proinflammatory State
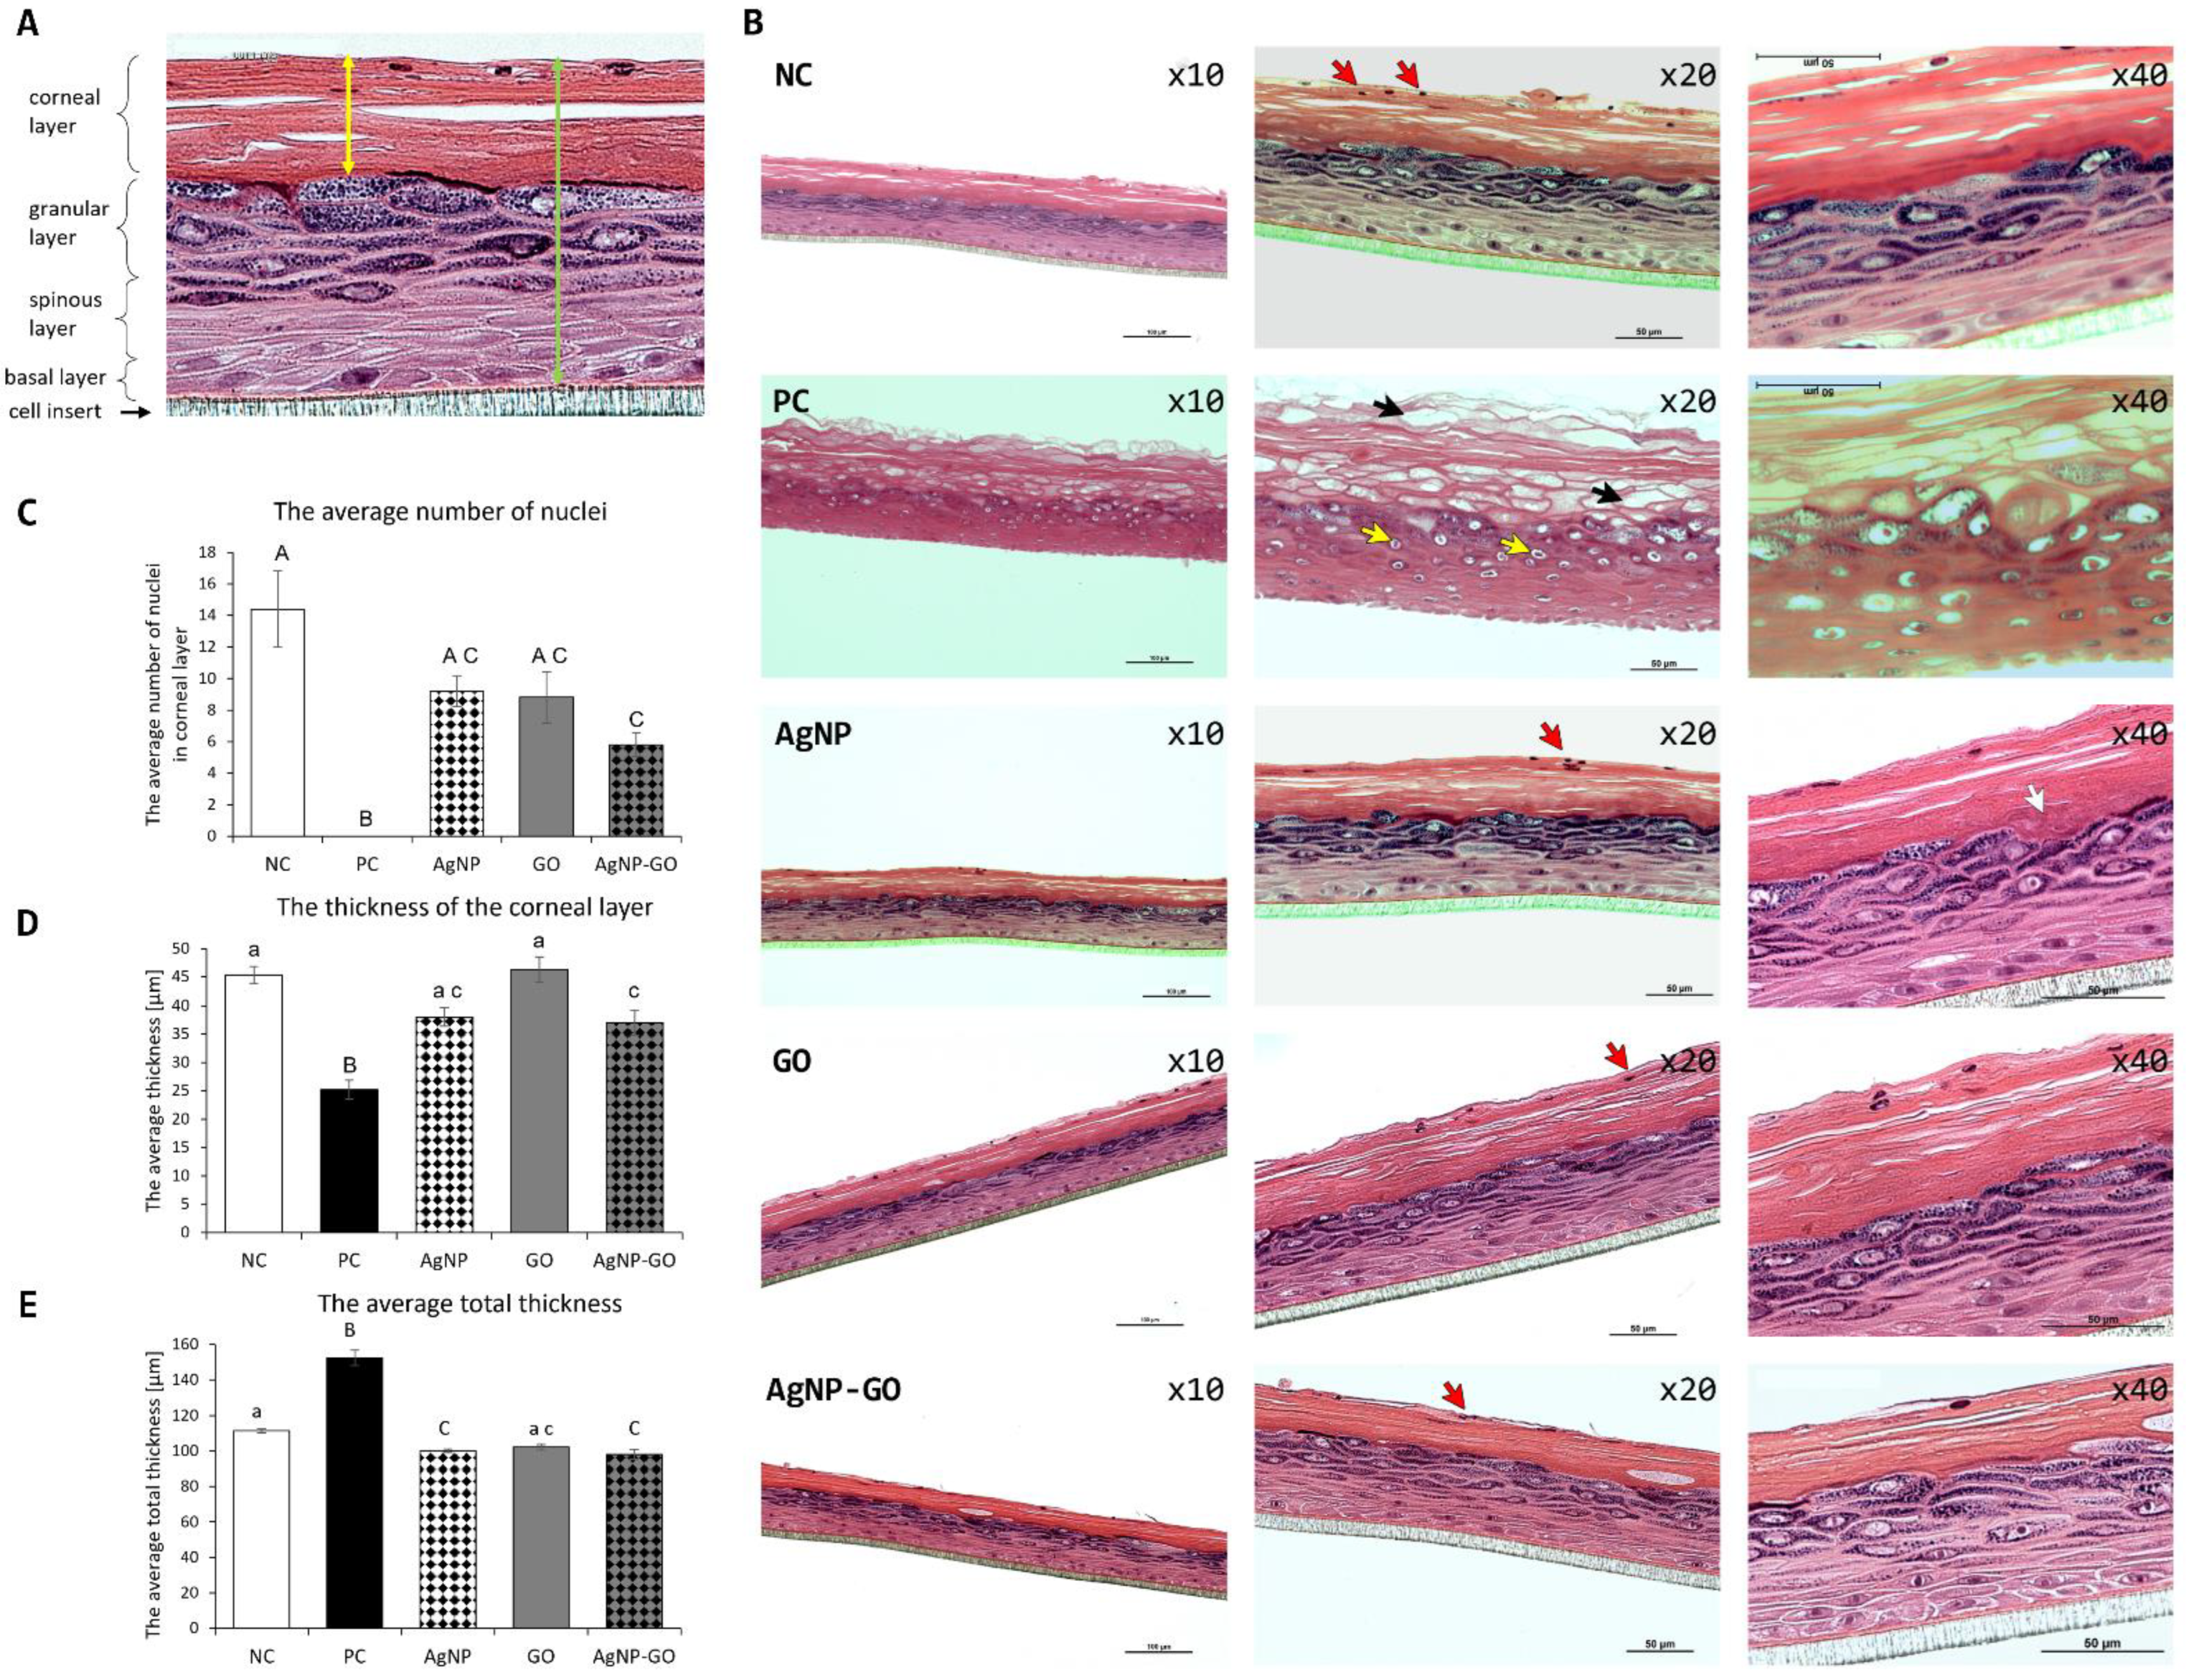
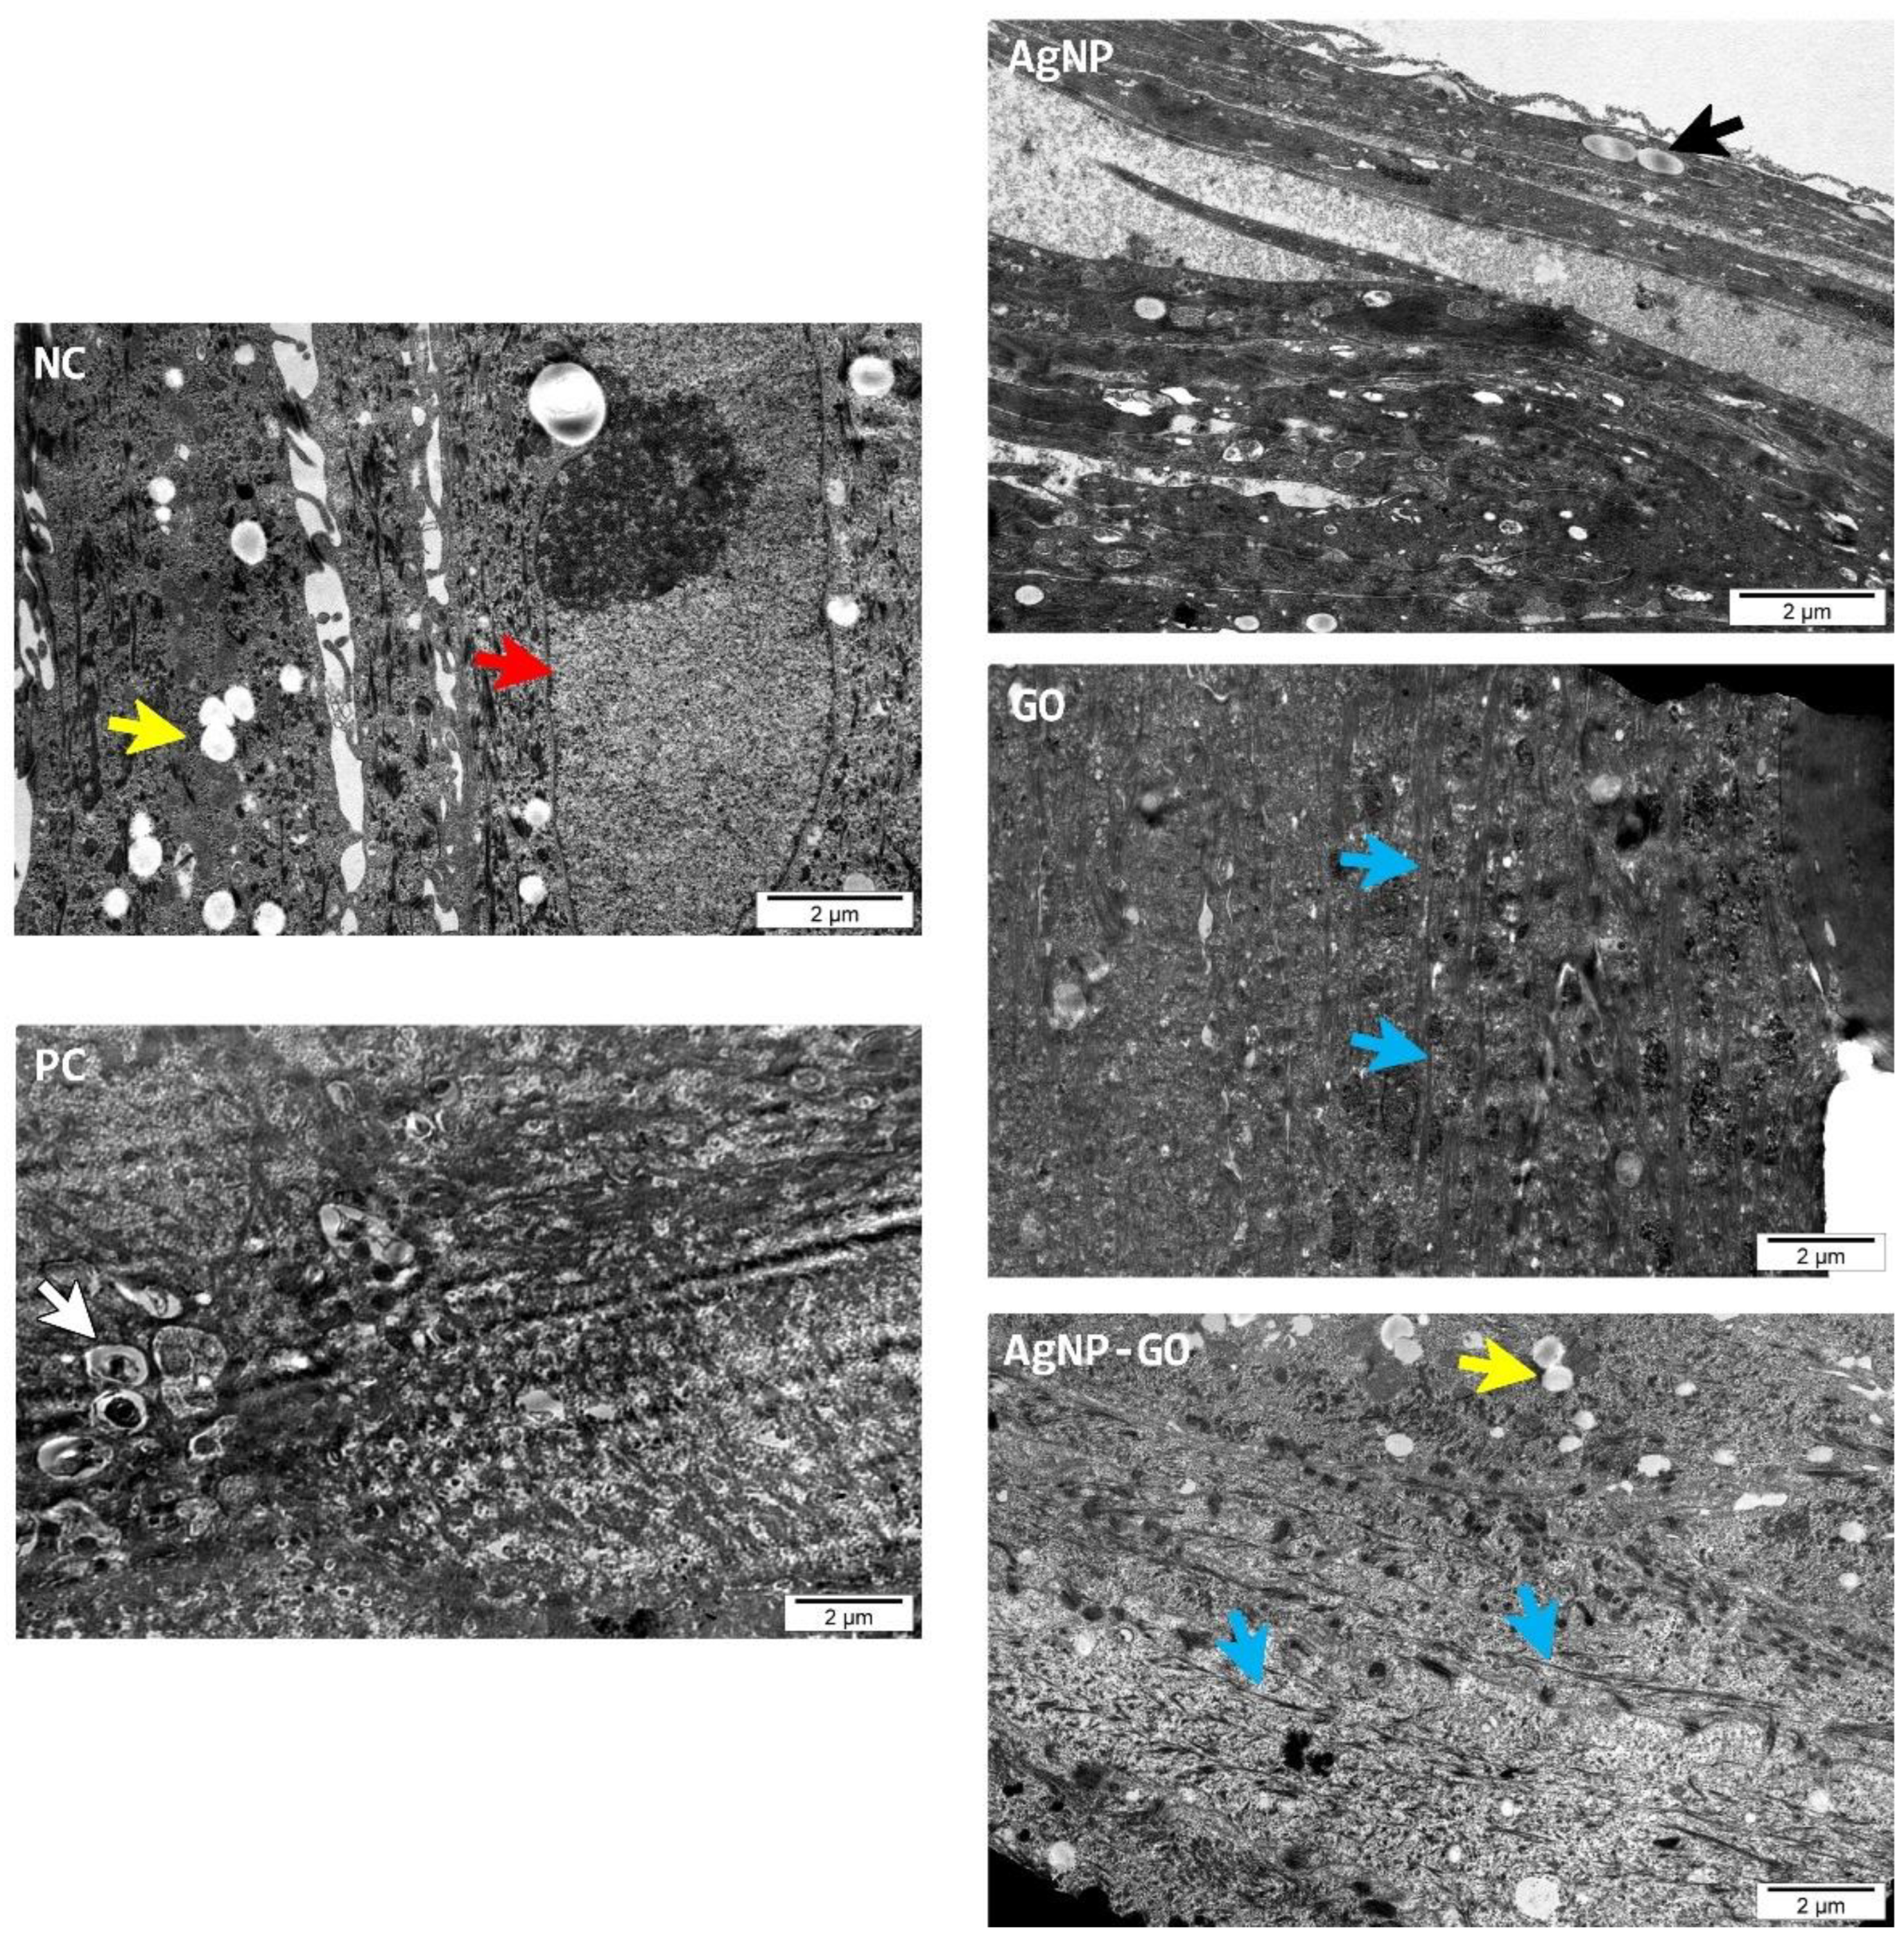
3.5. Visualization of EpiDerm™
4. Discussion
5. Conclusions
Author Contributions
Funding
Institutional Review Board Statement
Informed Consent Statement
Data Availability Statement
Acknowledgments
Conflicts of Interest
References
- ECDC. Disinfection of Environments in Healthcare and Nonhealthcare Settings Potentially Contaminated with SARS-CoV-2; ECDC: Solna, Sweden, 2020.
- Siddharta, A.; Pfaender, S.; Vielle, N.J.; Dijkman, R.; Friesland, M.; Becker, B.; Yang, J.; Engelmann, M.; Todt, D.; Windisch, M.P.; et al. Virucidal Activity of World Health Organization-Recommended Formulations against Enveloped Viruses, Including Zika, Ebola, and Emerging Coronaviruses. J. Infect. Dis. 2017, 215, 902–906. [Google Scholar] [CrossRef] [Green Version]
- Kampf, G.; Todt, D.; Pfaender, S.; Steinmann, E. Persistence of Coronaviruses on Inanimate Surfaces and Their Inactivation with Biocidal Agents. J. Hosp. Infect. 2020, 104, 246–251. [Google Scholar] [CrossRef] [PubMed] [Green Version]
- Lachenmeier, D.W. Safety Evaluation of Topical Applications of Ethanol on the Skin and inside the Oral Cavity. J. Occup. Med. Toxicol. 2008, 3, 26. [Google Scholar] [CrossRef] [PubMed] [Green Version]
- Strickland, F.M.; Pathak, S.; Multani, A.S.; Pelley, R.P.; Donawho, C.K. Molecular Characterization of New Melanoma Cell Lines from C3H Mice Induced by Ethanol plus Ultraviolet Radiation. Cancer Res. 2003, 63, 3503–3510. [Google Scholar] [PubMed]
- Siddiqi, K.S.; Husen, A.; Rao, R.A.K. A Review on Biosynthesis of Silver Nanoparticles and Their Biocidal Properties. J. Nanobiotechnol. 2018, 16, 14. [Google Scholar] [CrossRef]
- Radzig, M.A.; Nadtochenko, V.A.; Koksharova, O.A.; Kiwi, J.; Lipasova, V.A.; Khmel, I.A. Antibacterial Effects of Silver Nanoparticles on Gram-Negative Bacteria: Influence on the Growth and Biofilms Formation, Mechanisms of Action. Colloids Surf. B Biointerfaces 2013, 102, 300–306. [Google Scholar] [CrossRef]
- Kokila, T.; Ramesh, P.S.; Geetha, D. Biosynthesis of AgNPs Using Carica Papaya Peel Extract and Evaluation of Its Antioxidant and Antimicrobial Activities. Ecotoxicol. Environ. Saf. 2016, 134, 467–473. [Google Scholar] [CrossRef]
- Jeremiah, S.S.; Miyakawa, K.; Morita, T.; Yamaoka, Y.; Ryo, A. Potent Antiviral Effect of Silver Nanoparticles on SARS-CoV-2. Biochem. Biophys. Res. Commun. 2020, 533, 195–200. [Google Scholar] [CrossRef]
- Prasher, P.; Singh, M.; Mudila, H. Green Synthesis of Silver Nanoparticles and Their Antifungal Properties. Bionanoscience 2018, 8, 254–263. [Google Scholar] [CrossRef]
- Tseng, K.H.; Chung, M.Y.; Chiu, J.L.; Tseng, C.H.; Liu, C.Y. A Study of Nanosilver Colloid Prepared by Electrical Spark Discharge Method and Its Antifungal Control Benefits. Micromachines 2021, 12, 503. [Google Scholar] [CrossRef]
- Chwalibog, A.; Sawosz, E.; Hotowy, A.; Szeliga, J.; Mitura, S.; Mitura, K.; Grodzik, M.; Orlowski, P.; Sokolowska, A. Visualization of Interaction between Inorganic Nanoparticles and Bacteria or Fungi. Int. J. Nanomed. 2010, 5, 1085–1094. [Google Scholar] [CrossRef] [PubMed] [Green Version]
- Bélteky, P.; Rónavári, A.; Igaz, N.; Szerencsés, B.; Tóth, I.Y.; Pfeiffer, I.; Kiricsi, M.; Kónya, Z. Silver Nanoparticles: Aggregation Behavior in Biorelevant Conditions and Its Impact on Biological Activity. Int. J. Nanomed. 2019, 14, 667–687. [Google Scholar] [CrossRef] [PubMed] [Green Version]
- Estevan, C.; Vilanova, E.; Sogorb, M.A. Case Study: Risk Associated to Wearing Silver or Graphene Nanoparticle-Coated Facemasks for Protection against COVID-19. Arch. Toxicol. 2022, 96, 105–119. [Google Scholar] [CrossRef] [PubMed]
- Larese Filon, F.; Crosera, M.; Timeus, E.; Adami, G.; Bovenzi, M.; Ponti, J.; Maina, G. Human Skin Penetration of Cobalt Nanoparticles through Intact and Damaged Skin. Toxicol. Vitr. 2013, 27, 121–127. [Google Scholar] [CrossRef] [PubMed]
- Samberg, M.E.; Oldenburg, S.J.; Monteiro-Riviere, N.A. Evaluation of Silver Nanoparticle Toxicity in Skin in Vivo and Keratinocytes in Vitro. Environ. Health Perspect. 2010, 118, 407–413. [Google Scholar] [CrossRef] [PubMed] [Green Version]
- Kim, Y.S.; Song, M.Y.; Park, J.D.; Song, K.S.; Ryu, H.R.; Chung, Y.H.; Chang, H.K.; Lee, J.H.; Oh, K.H.; Kelman, B.J.; et al. Subchronic Oral Toxicity of Silver Nanoparticles. Part. Fibre Toxicol. 2010, 7, 20. [Google Scholar] [CrossRef] [Green Version]
- Van Der Zande, M.; Vandebriel, R.J.; Van Doren, E.; Kramer, E.; Herrera Rivera, Z.; Serrano-Rojero, C.S.; Gremmer, E.R.; Mast, J.; Peters, R.J.B.; Hollman, P.C.H.; et al. Distribution, Elimination, and Toxicity of Silver Nanoparticles and Silver Ions in Rats after 28-Day Oral Exposure. ACS Nano 2012, 6, 7427–7442. [Google Scholar] [CrossRef]
- Pelin, M.; Fusco, L.; León, V.; Martín, C.; Criado, A.; Sosa, S.; Vázquez, E.; Tubaro, A.; Prato, M. Differential Cytotoxic Effects of Graphene and Graphene Oxide on Skin Keratinocytes. Sci. Rep. 2017, 7, 40572. [Google Scholar] [CrossRef] [Green Version]
- Fusco, L.; Garrido, M.; Martín, C.; Sosa, S.; Ponti, C.; Centeno, A.; Alonso, B.; Zurutuza, A.; Vázquez, E.; Tubaro, A.; et al. Skin Irritation Potential of Graphene-Based Materials Using a Non-Animal Test. Nanoscale 2020, 12, 610–622. [Google Scholar] [CrossRef] [Green Version]
- Pelin, M.; Sosa, S.; Prato, M.; Tubaro, A. Occupational Exposure to Graphene Based Nanomaterials: Risk Assessment. Nanoscale 2018, 10, 15894–15903. [Google Scholar] [CrossRef] [Green Version]
- Jaworski, S.; Wierzbicki, M.; Sawosz, E.; Jung, A.; Gielerak, G.; Biernat, J.; Jaremek, H.; Łojkowski, W.; Woźniak, B.; Wojnarowicz, J.; et al. Graphene Oxide-Based Nanocomposites Decorated with Silver Nanoparticles as an Antibacterial Agent. Nanoscale Res. Lett. 2018, 13, 116. [Google Scholar] [CrossRef] [PubMed] [Green Version]
- Wierzbicki, M.; Jaworski, S.; Sawosz, E.; Jung, A.; Gielerak, G.; Jaremek, H.; Łojkowski, W.; Woźniak, B.; Stobiński, L.; Małolepszy, A.; et al. Graphene Oxide in a Composite with Silver Nanoparticles Reduces the Fibroblast and Endothelial Cell Cytotoxicity of an Antibacterial Nanoplatform. Nanoscale Res. Lett. 2019, 14, 320. [Google Scholar] [CrossRef] [PubMed] [Green Version]
- de Medeiros, A.M.Z.; Khan, L.U.; da Silva, G.H.; Ospina, C.A.; Alves, O.L.; de Castro, V.L.; Martinez, D.S.T. Graphene Oxide-Silver Nanoparticle Hybrid Material: An Integrated Nanosafety Study in Zebrafish Embryos. Ecotoxicol. Environ. Saf. 2021, 209, 111776. [Google Scholar] [CrossRef] [PubMed]
- Yuan, Y.-G.; Cai, H.-Q.; Wang, J.-L.; Mesalam, A.; Musa, A.; Reza, M.T.; Li, L.; Chen, L.; Qian, C. Graphene Oxide–Silver Nanoparticle Nanocomposites Induce Oxidative Stress and Aberrant Methylation in Caprine Fetal Fibroblast Cells. Cells 2021, 10, 682. [Google Scholar] [CrossRef]
- de Luna, L.A.V.; Moraes, A.C.M.; Consonni, S.R.; Pereira, C.D.; Cadore, S.; Giorgio, S.; Alves, O.L. Comparative in Vitro Toxicity of a Graphene Oxide-Silver Nanocomposite and the Pristine Counterparts toward Macrophages. J. Nanobiotechnol. 2016, 14, 12. [Google Scholar] [CrossRef] [Green Version]
- Sosnowska, M.; Kutwin, M.; Strojny, B.; Koczoń, P.; Szczepaniak, J.; Bałaban, J.; Daniluk, K.; Jaworski, S.; Chwalibog, A.; Bielawski, W.; et al. Graphene Oxide Nanofilm and Chicken Embryo Extract Decrease the Invasiveness of HepG2 Liver Cancer Cells. Cancer Nanotechnol. 2021, 12, 2. [Google Scholar] [CrossRef]
- Kandarova, H.; Liebsch, M. The EpidermTM Skin Irritation Test (EpidermTM SIT). In Alternatives for Dermal Toxicity Testing; Springer International Publishing: Berlin/Heidelberg, Germany, 2017; pp. 41–57. ISBN 9783319503530. [Google Scholar]
- Carpentier, G.; Henault, E. Protein Array Analyzer for ImageJ. In Proceedings of the 617 ImageJ User and Developer Conference, Mondorf-les-Bains, Luxembourg, 27–29 October 2010; Centre de Recherche Public Henri Tudor: Esch-sur-Alzette, Luxembourg, 2010; pp. 238–240. [Google Scholar]
- Zielińska-Górska, M.; Hotowy, A.; Wierzbicki, M.; Bałaban, J.; Sosnowska, M.; Jaworski, S.; Strojny, B.; Chwalibog, A.; Sawosz, E. Graphene Oxide Nanofilm and the Addition of L-Glutamine Can Promote Development of Embryonic Muscle Cells. J. Nanobiotechnol. 2020, 18, 76. [Google Scholar] [CrossRef]
- Bera, M.; Gupta, P.; Maji, P.K. Facile One-Pot Synthesis of Graphene Oxide by Sonication Assisted Mechanochemical Approach and Its Surface Chemistry. J. Nanosci. Nanotechnol. 2017, 18, 902–912. [Google Scholar] [CrossRef]
- Lange, A.; Sawosz, E.; Wierzbicki, M.; Kutwin, M.; Daniluk, K.; Strojny, B.; Ostrowska, A.; Wójcik, B.; Łojkowski, M.; Gołębiewski, M.; et al. Nanocomposites of Graphene Oxide—Silver Nanoparticles for Enhanced Antibacterial Activity: Mechanism of Action and Medical Textiles Coating. Materials 2022, 15, 3122. [Google Scholar] [CrossRef]
- Kandárová, H.; Hayden, P.; Klausner, M.; Kubilus, J.; Sheasgreen, J. An in Vitro Skin Irritation Test (SIT) Using the EpiDerm Reconstructed Human Epidermal (RHE) Model. J. Vis. Exp. 2009, 29, 1366. [Google Scholar] [CrossRef] [Green Version]
- Kandarova, H.; Willoughby, J.A.; De Jong, W.H.; Letasiova, S.; Milasova, T.; Bachelor, M.A.; Breyfogle, B.; Handa, Y.; De la Fonteyne, L.; Coleman, K.P. Pre-Validation of an in Vitro Skin Irritation Test for Medical Devices Using the Reconstructed Human Tissue Model EpiDermTM. Toxicol. Vitr. 2018, 50, 407–417. [Google Scholar] [CrossRef] [PubMed]
- Xiong, Z.; O’Donovan, M.; Sun, L.; Young Choi, J.; Ren, M.; Cao, K. Anti-Aging Potentials of Methylene Blue for Human Skin Longevity. Sci. Rep. 2017, 7, 2475. [Google Scholar] [CrossRef] [PubMed]
- Watanabe, T.; Hasegawa, T.; Takahashi, H.; Ishibashi, T.; Itagaki, H.; Sugibayashi, K. Utility of MTT Assay in Three-Dimensional Cultured Human Skin Model as an Alternative for Draize Skin Irritation Test: Approach Using Diffusion Law of Irritant in Skin and Toxicokinetics-Toxicodynamics Correlation. Pharm. Res. 2002, 19, 669–675. [Google Scholar] [CrossRef] [PubMed]
- Everds, N.E.; Snyder, P.W.; Bailey, K.L.; Bolon, B.; Creasy, D.M.; Foley, G.L.; Rosol, T.J.; Sellers, T. Interpreting Stress Responses during Routine Toxicity Studies:A Review of the Biology, Impact, and Assessment. Toxicol. Pathol. 2013, 41, 560–614. [Google Scholar] [CrossRef]
- Mee, J.B.; Antonopoulos, C.; Poole, S.; Kupper, T.S.; Groves, R.W. Counter-Regulation of Interleukin-1α (IL-1α) and IL-1 Receptor Antagonist in Murine Keratinocytes. J. Investig. Dermatol. 2005, 124, 1267–1274. [Google Scholar] [CrossRef] [Green Version]
- Kidd, D.A.; Johnson, M.; Clements, J. Development of an in Vitro Corrosion/Irritation Prediction Assay Using the EpiDermTM Skin Model. Toxicol. Vitr. 2007, 21, 1292–1297. [Google Scholar] [CrossRef]
- Lee, H.; Cheong, K.A.; Kim, J.Y.; Kim, N.H.; Noh, M.; Lee, A.Y. Il-1 Receptor Antagonist Reduced Chemical-Induced Keratinocyte Apoptosis through Antagonism to Il-1α/Il-1β. Biomol. Ther. 2018, 26, 417–423. [Google Scholar] [CrossRef]
- Bhol, K.C.; Schechter, P.J. Topical Nanocrystalline Silver Cream Suppresses Inflammatory Cytokines and Induces Apoptosis of Inflammatory Cells in a Murine Model of Allergic Contact Dermatitis. Br. J. Dermatol. 2005, 152, 1235–1242. [Google Scholar] [CrossRef]
- Jatana, S.; Palmer, B.C.; Phelan, S.J.; Delouise, L.A. Immunomodulatory Effects of Nanoparticles on Skin Allergy. Sci. Rep. 2017, 7, 3979. [Google Scholar] [CrossRef]
- Hoyle, C.; Rivers-Auty, J.; Lemarchand, E.; Vranic, S.; Wang, E.; Buggio, M.; Rothwell, N.J.; Allan, S.M.; Kostarelos, K.; Brough, D. Small, Thin Graphene Oxide Is Anti-Inflammatory Activating Nuclear Factor Erythroid 2-Related Factor 2 via Metabolic Reprogramming. ACS Publ. 2018, 12, 11949–11962. [Google Scholar] [CrossRef] [Green Version]
- Pollock, A.; Turck, J.; Lovett, D.H. The Prodomain of Interleukin 1α Interacts with Elements of the RNA Processing Apparatus and Induces Apoptosis in Malignant Cells. FASEB J. 2003, 17, 203–213. [Google Scholar] [CrossRef] [PubMed]
- Gragnani, A.; Müller, B.R.; da Silva, I.D.C.G.; de Noronha, S.M.R.; Ferreira, L.M. Keratinocyte Growth Factor, Tumor Necrosis Factor-Alpha and Interleukin-1 Beta Gene Expression in Cultured Fibroblasts and Keratinocytes from Burned Patients. Acta Cir. Bras. 2013, 28, 551–558. [Google Scholar] [CrossRef] [PubMed] [Green Version]
- Buhrmann, C.; Shayan, P.; Aggarwal, B.B.; Shakibaei, M. Evidence That TNF-β (Lymphotoxin α) Can Activate the Inflammatory Environment in Human Chondrocytes. Arthritis Res. Ther. 2013, 15, R202. [Google Scholar] [CrossRef] [PubMed] [Green Version]
- Han, Y.P.; Tuan, T.L.; Hughes, M.; Wu, H.; Garner, W.L. Transforming Growth Factor-β- and Tumor Necrosis Factor-α-Mediated Induction and Proteolytic Activation of MMP-9 in Human Skin. J. Biol. Chem. 2001, 276, 22341–22350. [Google Scholar] [CrossRef] [PubMed] [Green Version]
- Nedoszytko, B.; Sokołowska-Wojdyło, M.; Ruckemann-Dziurdzińska, K.; Roszkiewicz, J.; Nowicki, R.J. Chemokines and Cytokines Network in the Pathogenesis of the Inflammatory Skin Diseases: Atopic Dermatitis, Psoriasis and Skin Mastocytosis. Postep. Dermatol. Alergol. 2014, 31, 84–91. [Google Scholar] [CrossRef] [PubMed]
- Wakugawa, M.; Nakamura, K.; Akatsuka, M.; Nakagawa, H.; Tamaki, K. Interferon-Gamma-Induced RANTES Production by Human Keratinocytes Is Enhanced by IL-1β, TNF-α, IL-4 and IL-13 and Is Inhibited by Dexamethasone and Tacrolimus. Dermatology 2001, 202, 239–245. [Google Scholar] [CrossRef]
- Chang, T.T.; Chen, J.W. Emerging Role of Chemokine CC Motif Ligand 4 Related Mechanisms in Diabetes Mellitus and Cardiovascular Disease: Friends or Foes? Cardiovasc. Diabetol. 2016, 15, 117. [Google Scholar] [CrossRef] [Green Version]
- Miyoshi, H.; Kanekura, T.; Aoki, T.; Kanzaki, T. Beneficial Effects of Tissue Inhibitor of Metalloproteinases-2 (TIMP-2) on Chronic Dermatitis. J. Dermatol. 2005, 32, 346–353. [Google Scholar] [CrossRef]
- Dohi, T.; Miyake, K.; Aoki, M.; Ogawa, R.; Akaishi, S.; Shimada, T.; Okada, T.; Hyakusoku, H. Tissue Inhibitor of Metalloproteinase-2 Suppresses Collagen Synthesis in Cultured Keloid Fibroblasts. Plast. Reconstr. Surg.-Glob. Open 2015, 3, e520. [Google Scholar] [CrossRef]
- Li, M.; Chen, Y.; Li, H.; Yang, D.; Zhou, Y.; Chen, Z.; Zhang, Y. Serum CXCL10/IP-10 May Be a Potential Biomarker for Severe Mycoplasma Pneumoniae Pneumonia in Children. BMC Infect. Dis. 2021, 21, 909. [Google Scholar] [CrossRef]
- Rollman, O.; Jensen, U.B.; Östman, A.; Bolund, L.; Gústafsdóttir, S.M.; Jensen, T.G. Platelet Derived Growth Factor (PDGF) Responsive Epidermis Formed from Human Keratinocytes Transduced with the PDGFβ Receptor Gene. J. Investig. Dermatol. 2003, 120, 742–749. [Google Scholar] [CrossRef] [PubMed] [Green Version]
- Yonei, N.; Kanazawa, N.; Ohtani, T.; Furukawa, F.; Yamamoto, Y. Induction of PDGF-B in TCA-Treated Epidermal Keratinocytes. Arch. Dermatol. Res. 2007, 299, 433–440. [Google Scholar] [CrossRef] [PubMed]
- Mihaylova, Z.; Tsikandelova, R.; Sanimirov, P.; Gateva, N.; Mitev, V.; Ishkitiev, N. Role of PDGF-BB in Proliferation, Differentiation and Maintaining Stem Cell Properties of PDL Cells In Vitro. Arch. Oral Biol. 2018, 85, 1–9. [Google Scholar] [CrossRef] [PubMed]
- Tian, J.; Wong, K.K.Y.; Ho, C.M.; Lok, C.N.; Yu, W.Y.; Che, C.M.; Chiu, J.F.; Tam, P.K.H. Topical Delivery of Silver Nanoparticles Promotes Wound Healing. ChemMedChem 2007, 2, 129–136. [Google Scholar] [CrossRef] [PubMed]
- Hotowy, A.; Sawosz, E.; Pineda, L.; Sawosz, F.; Grodzik, M.; Chwalibog, A. Silver Nanoparticles Administered to Chicken Affect VEGFA and FGF2 Gene Expression in Breast Muscle and Heart. Nanoscale Res. Lett. 2012, 7, 418. [Google Scholar] [CrossRef] [Green Version]
- Beck, I.; Hotowy, A.; Sawosz, E.; Grodzik, M.; Wierzbicki, M.; Kutwin, M.; Jaworski, S.; Chwalibog, A. Effect of Silver Nanoparticles and Hydroxyproline, Administered in Ovo, on the Development of Blood Vessels and Cartilage Collagen Structure in Chicken Embryos. Arch. Anim. Nutr. 2015, 69, 57–68. [Google Scholar] [CrossRef]
- Chen, L.; Wu, M.; Jiang, S.; Zhang, Y.; Li, R.; Lu, Y.; Liu, L.; Wu, G.; Liu, Y.; Xie, L.; et al. Skin Toxicity Assessment of Silver Nanoparticles in a 3D Epidermal Model Compared to 2D Keratinocytes. Int. J. Nanomed. 2019, 14, 9707–9719. [Google Scholar] [CrossRef] [Green Version]
- Jeništová, A.; Dendisová, M.; Matějka, P. Study of Plasmonic Nanoparticles Interactions with Skin Layers by Vibrational Spectroscopy. Eur. J. Pharm. Biopharm. 2017, 116, 85–93. [Google Scholar] [CrossRef]
- Jeništová, A.; Loula, M.; Mestek, O.; Ulbrich, P.; Matějka, P. The Effect of Silver Nanoparticles on the Penetration Properties of the Skin and Quantification of Their Permeation through Skin Barrier. J. Nanoparticle Res. 2020, 22, 332. [Google Scholar] [CrossRef]
- Bianco, C.; Visser, M.J.; Pluut, O.A.; Svetličić, V.; Pletikapić, G.; Jakasa, I.; Riethmuller, C.; Adami, G.; Larese Filon, F.; Schwegler-Berry, D.; et al. Characterization of Silver Particles in the Stratum Corneum of Healthy Subjects and Atopic Dermatitis Patients Dermally Exposed to a Silver-Containing Garment. Nanotoxicology 2016, 10, 1480–1491. [Google Scholar] [CrossRef] [Green Version]


Publisher’s Note: MDPI stays neutral with regard to jurisdictional claims in published maps and institutional affiliations. |
© 2022 by the authors. Licensee MDPI, Basel, Switzerland. This article is an open access article distributed under the terms and conditions of the Creative Commons Attribution (CC BY) license (https://creativecommons.org/licenses/by/4.0/).
Share and Cite
Zielińska-Górska, M.; Sawosz, E.; Sosnowska, M.; Hotowy, A.; Grodzik, M.; Górski, K.; Strojny-Cieślak, B.; Wierzbicki, M.; Chwalibog, A. Molecular Biocompatibility of a Silver Nanoparticle Complex with Graphene Oxide to Human Skin in a 3D Epidermis In Vitro Model. Pharmaceutics 2022, 14, 1398. https://doi.org/10.3390/pharmaceutics14071398
Zielińska-Górska M, Sawosz E, Sosnowska M, Hotowy A, Grodzik M, Górski K, Strojny-Cieślak B, Wierzbicki M, Chwalibog A. Molecular Biocompatibility of a Silver Nanoparticle Complex with Graphene Oxide to Human Skin in a 3D Epidermis In Vitro Model. Pharmaceutics. 2022; 14(7):1398. https://doi.org/10.3390/pharmaceutics14071398
Chicago/Turabian StyleZielińska-Górska, Marlena, Ewa Sawosz, Malwina Sosnowska, Anna Hotowy, Marta Grodzik, Konrad Górski, Barbara Strojny-Cieślak, Mateusz Wierzbicki, and André Chwalibog. 2022. "Molecular Biocompatibility of a Silver Nanoparticle Complex with Graphene Oxide to Human Skin in a 3D Epidermis In Vitro Model" Pharmaceutics 14, no. 7: 1398. https://doi.org/10.3390/pharmaceutics14071398