
Pharmacokinetics of Curative Tranexamic Acid in Parturients Undergoing Cesarean Delivery

 , , ,
, , ,
Abstract
:1. Introduction
2. Materials and Methods
2.1. Ethics Approval and Consent to Participate
2.2. Patients and Data Collection
2.3. Measurements and Data Handling
2.4. Sample Analysis
2.5. PK Modeling
2.6. Noncompartmental Analysis
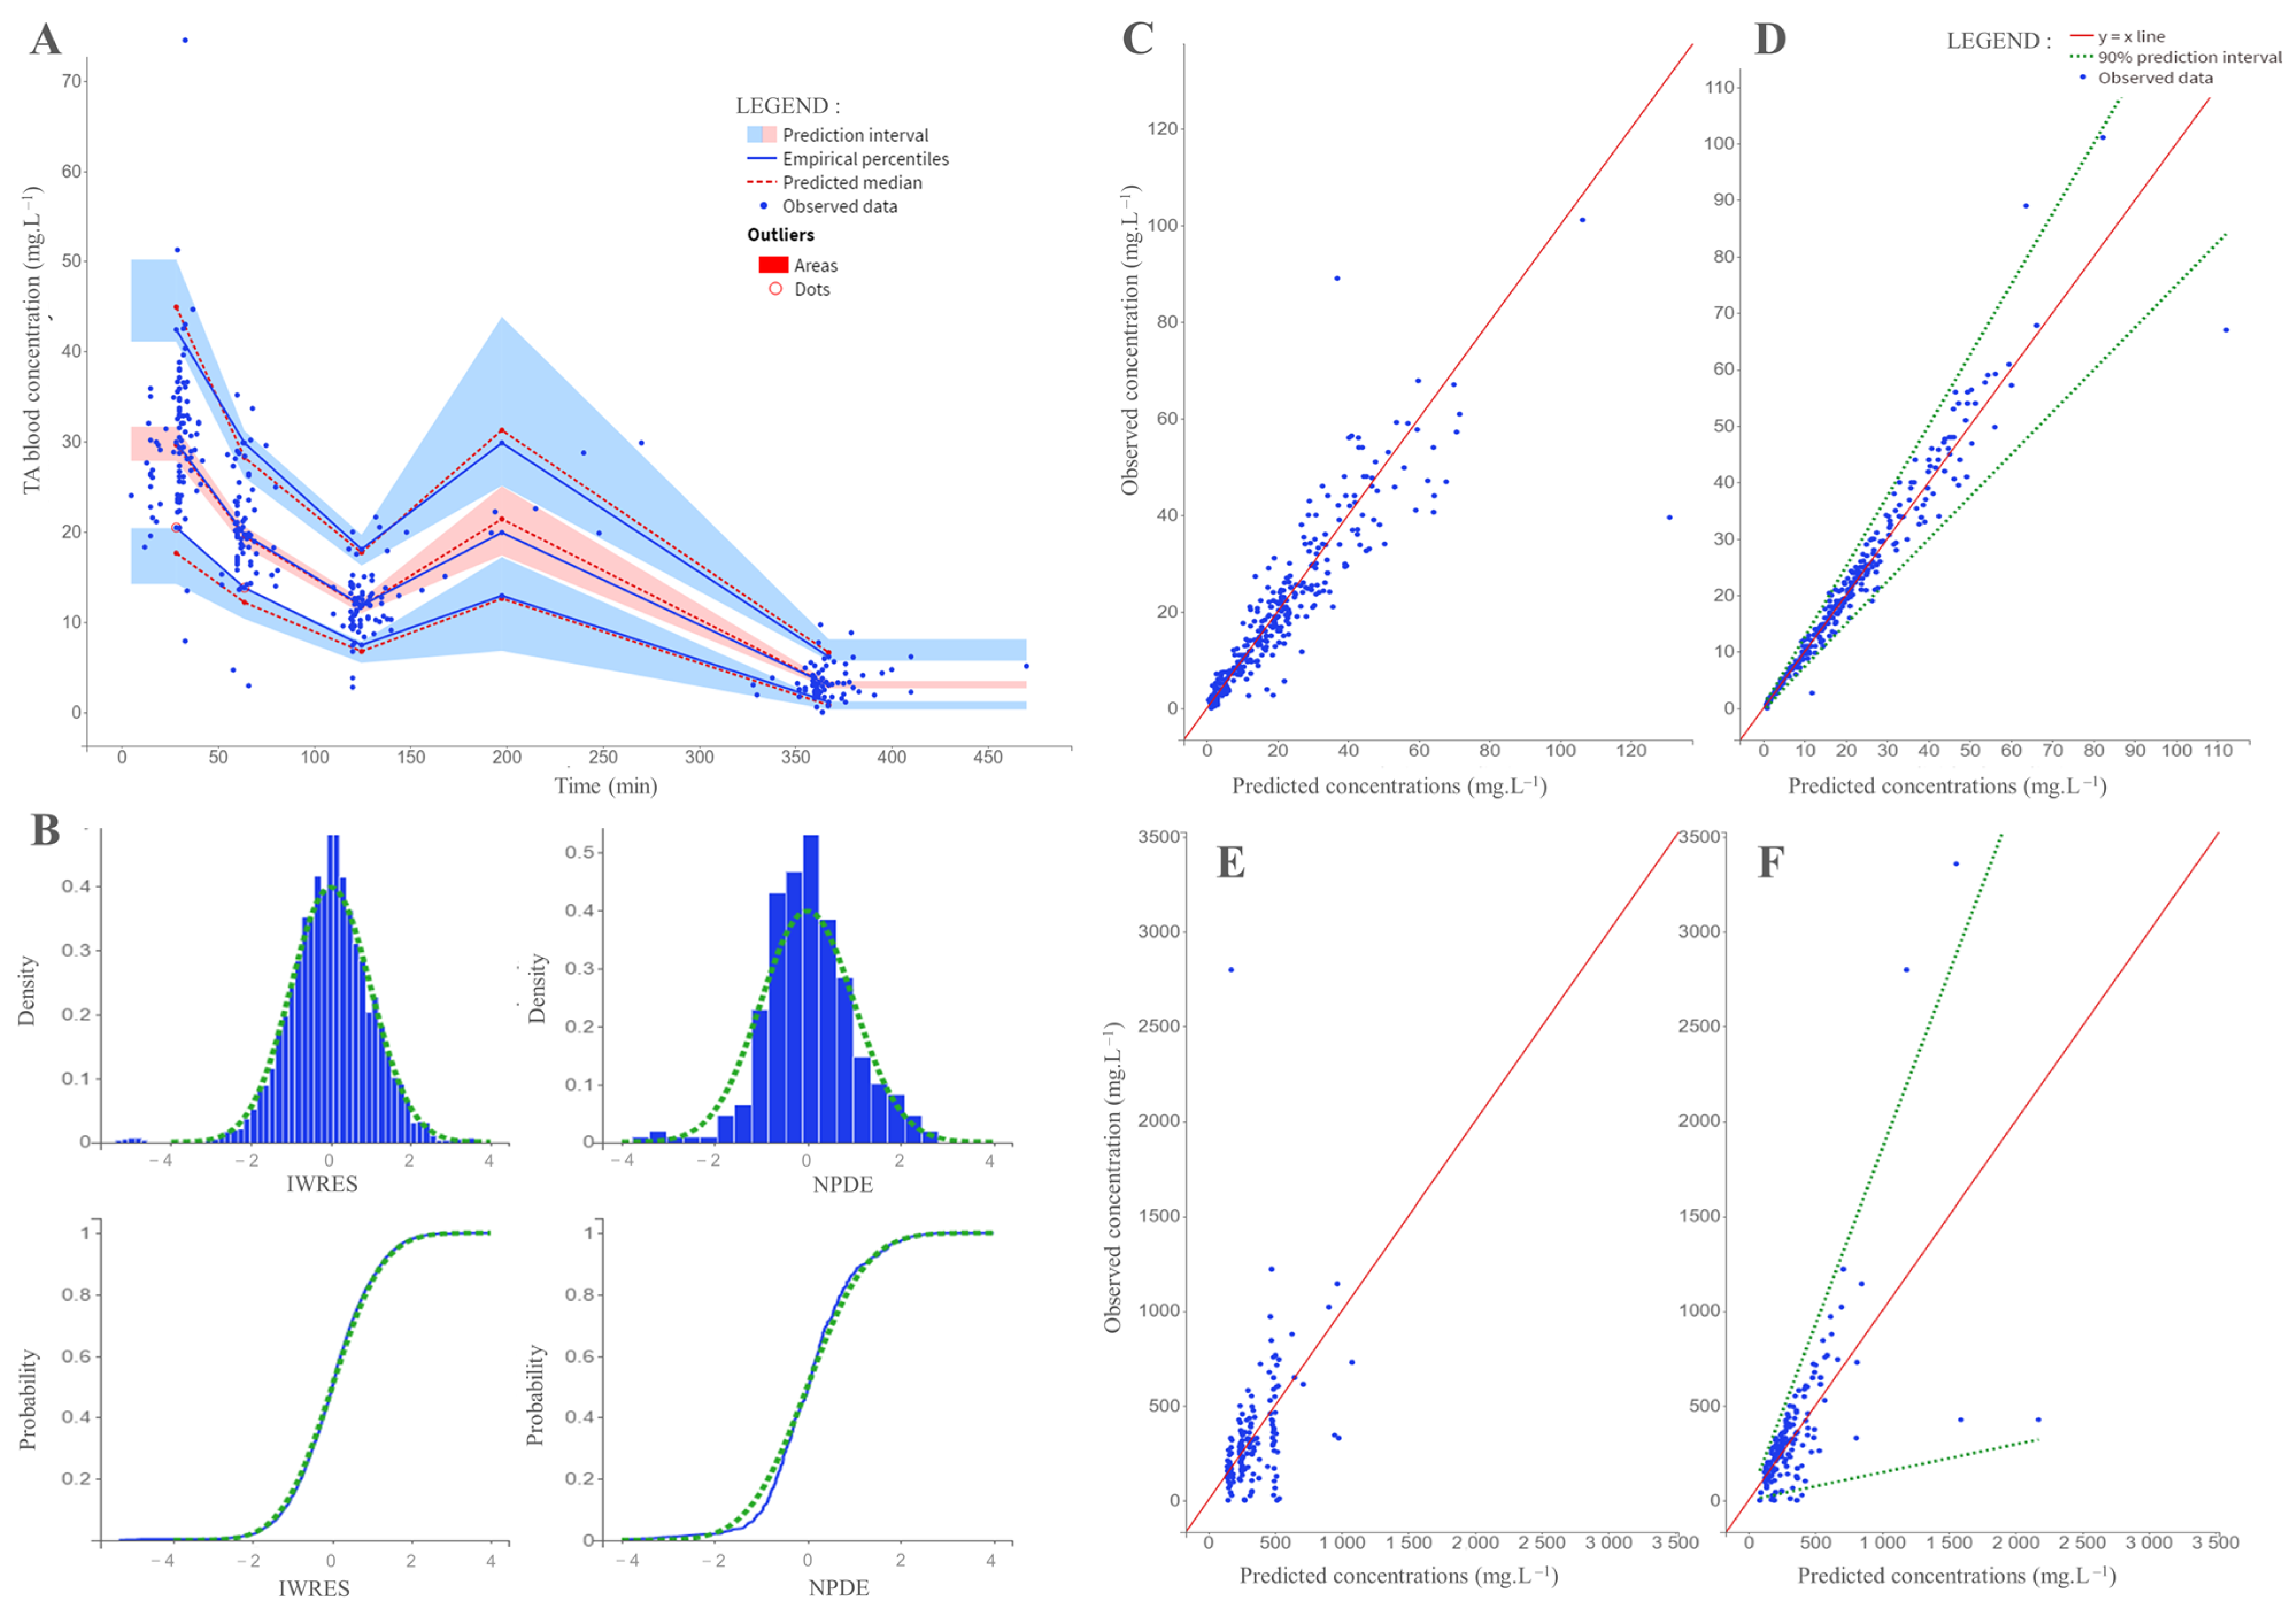
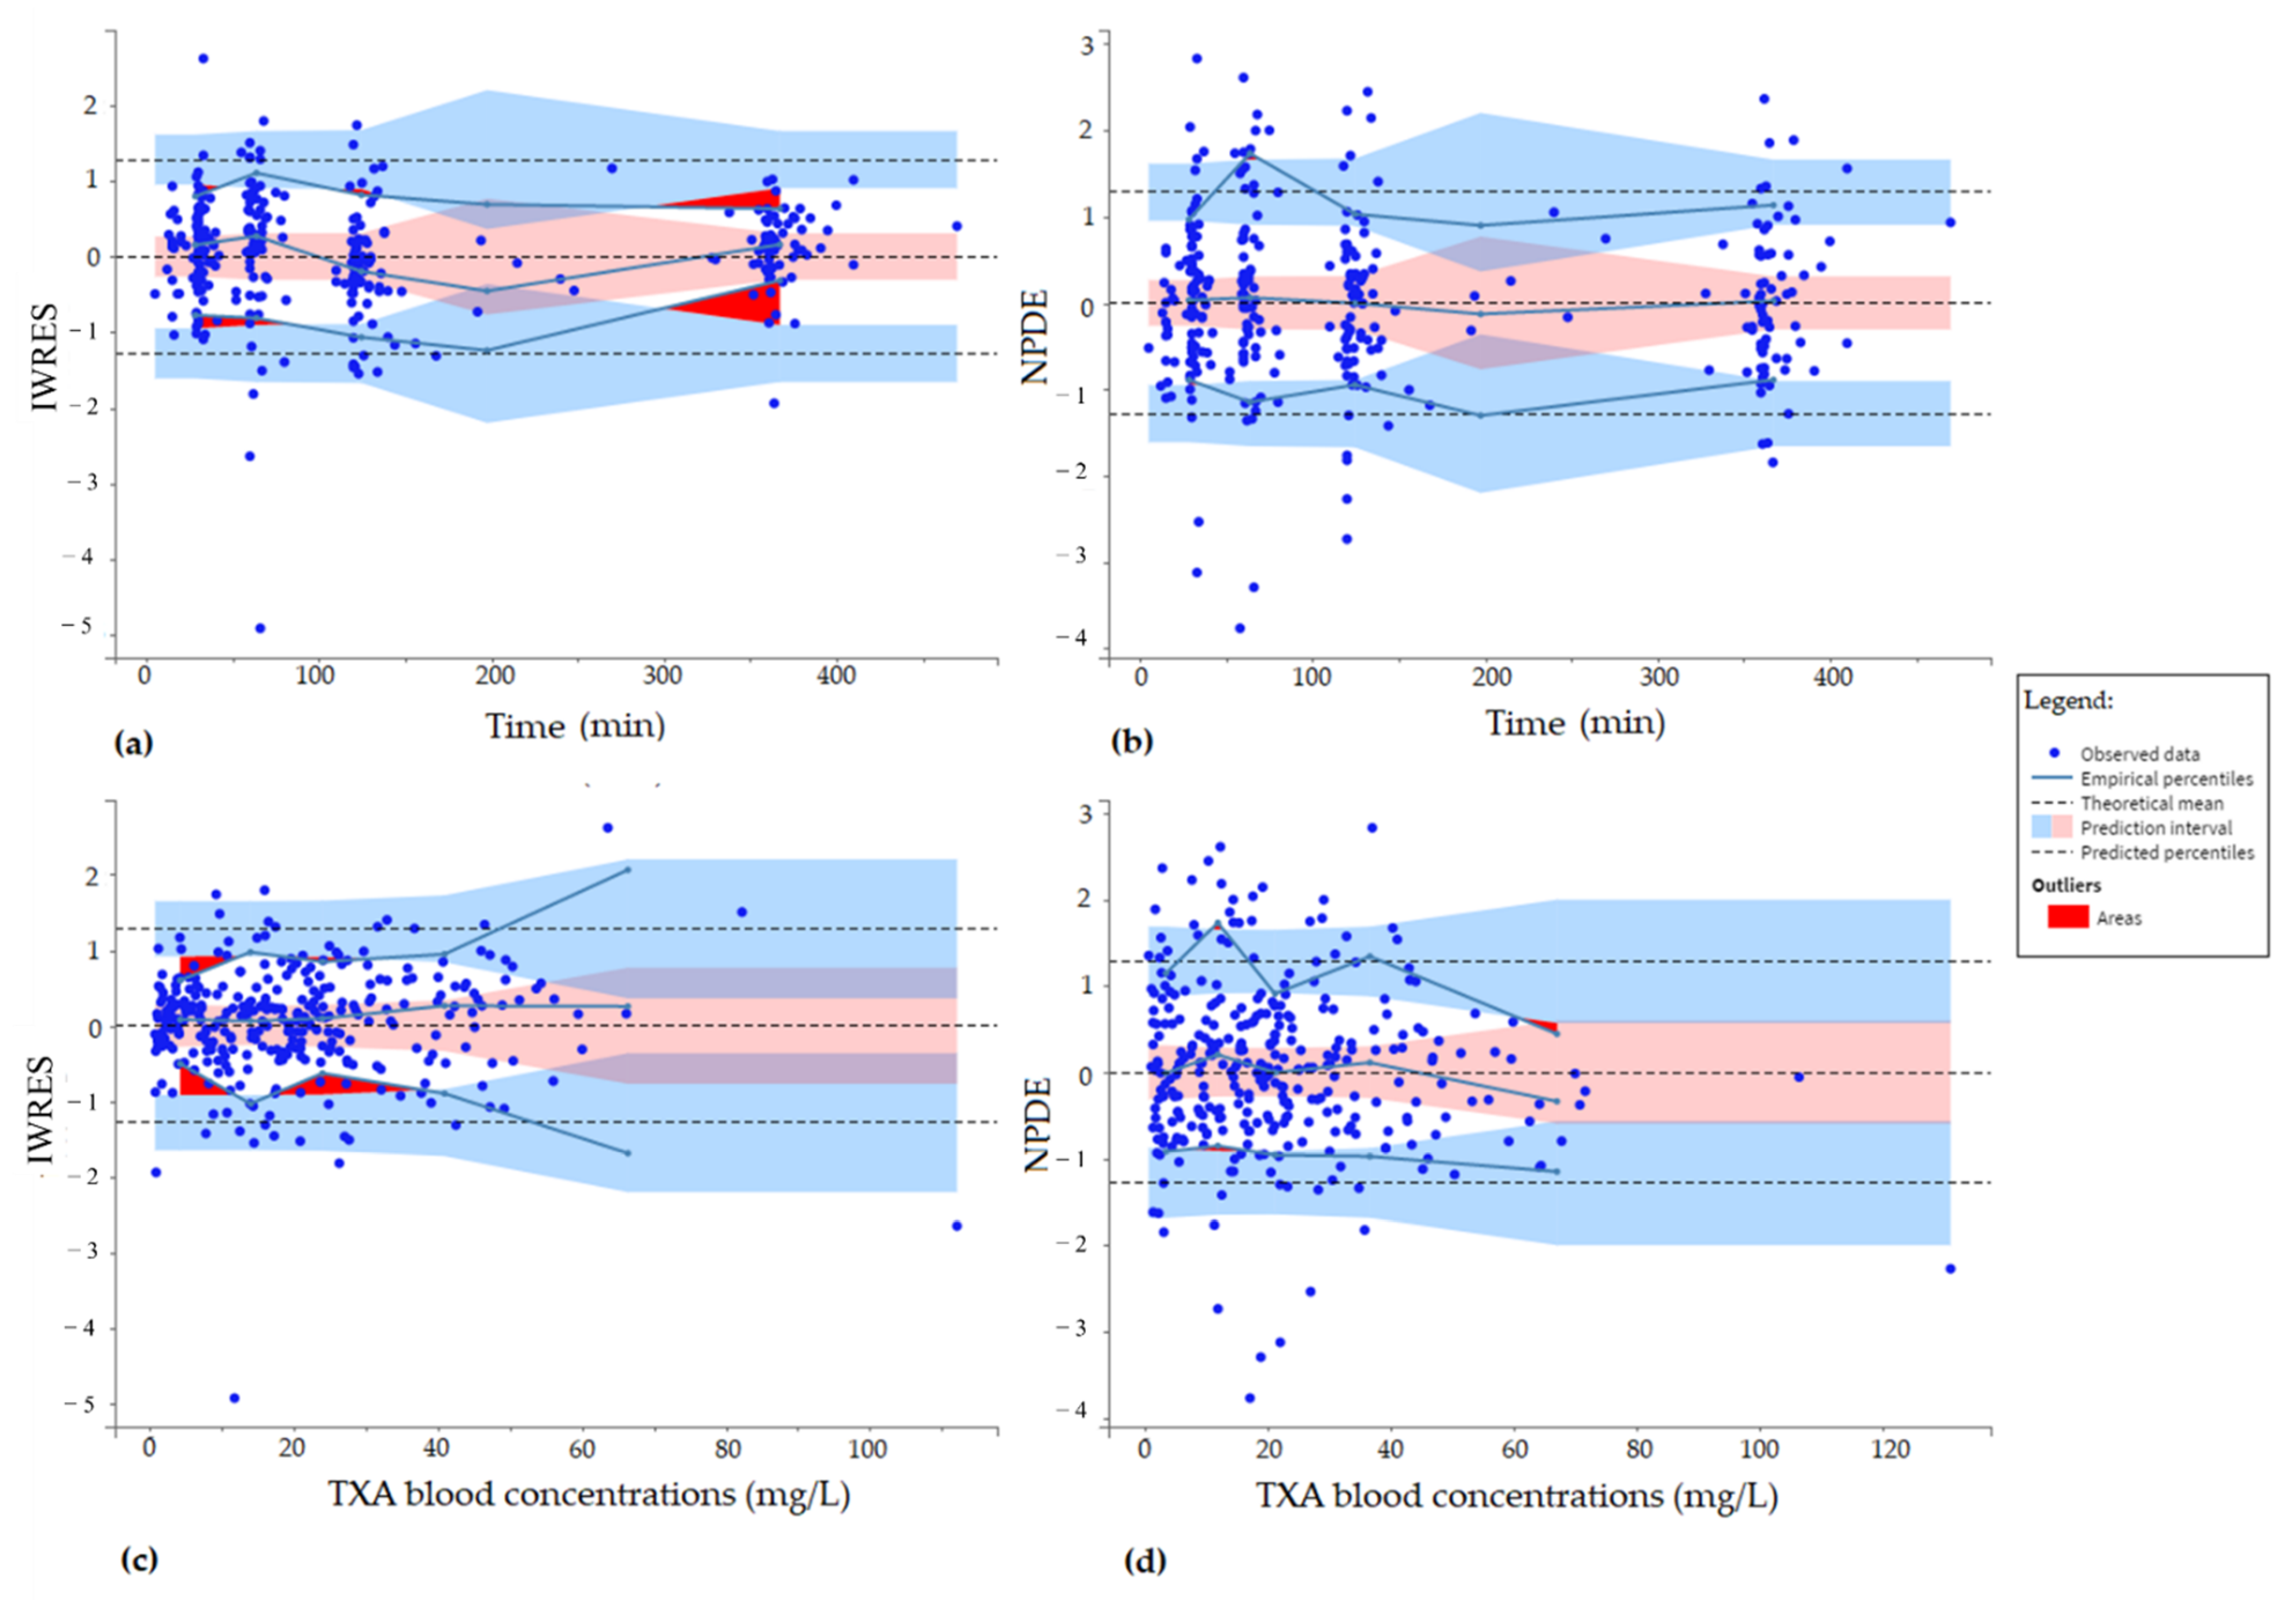
2.7. Model Internal Evaluation
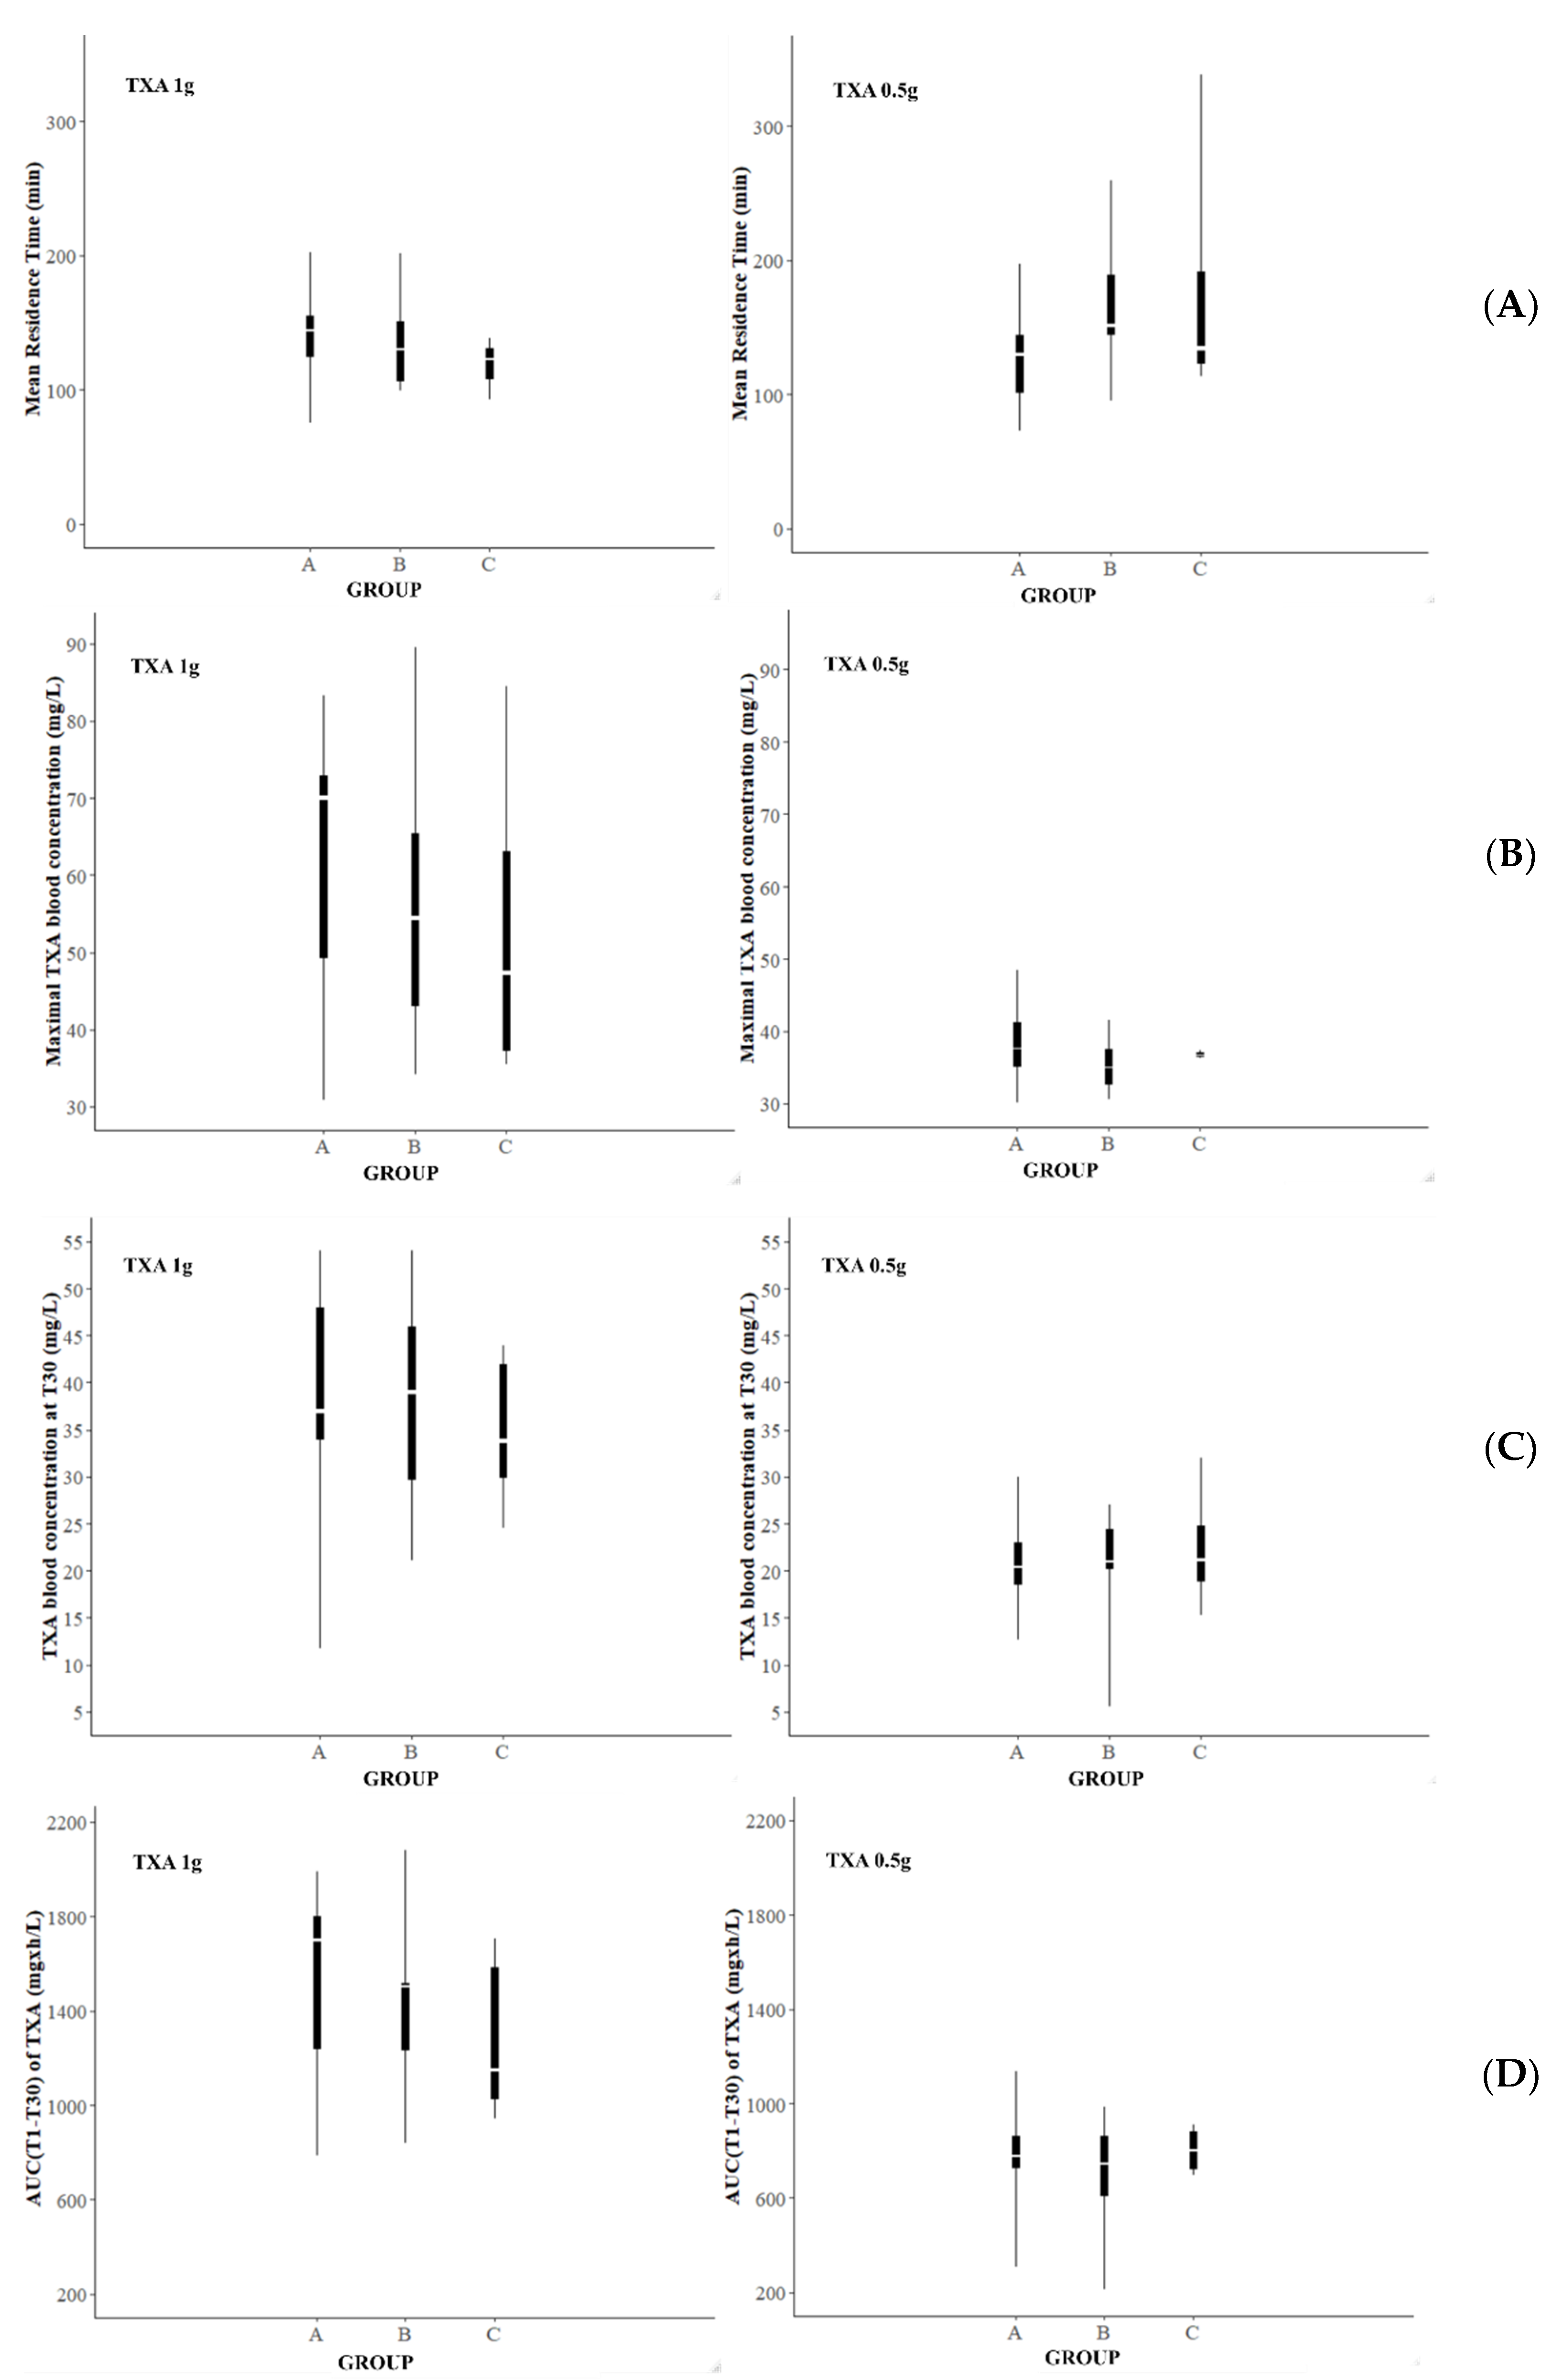
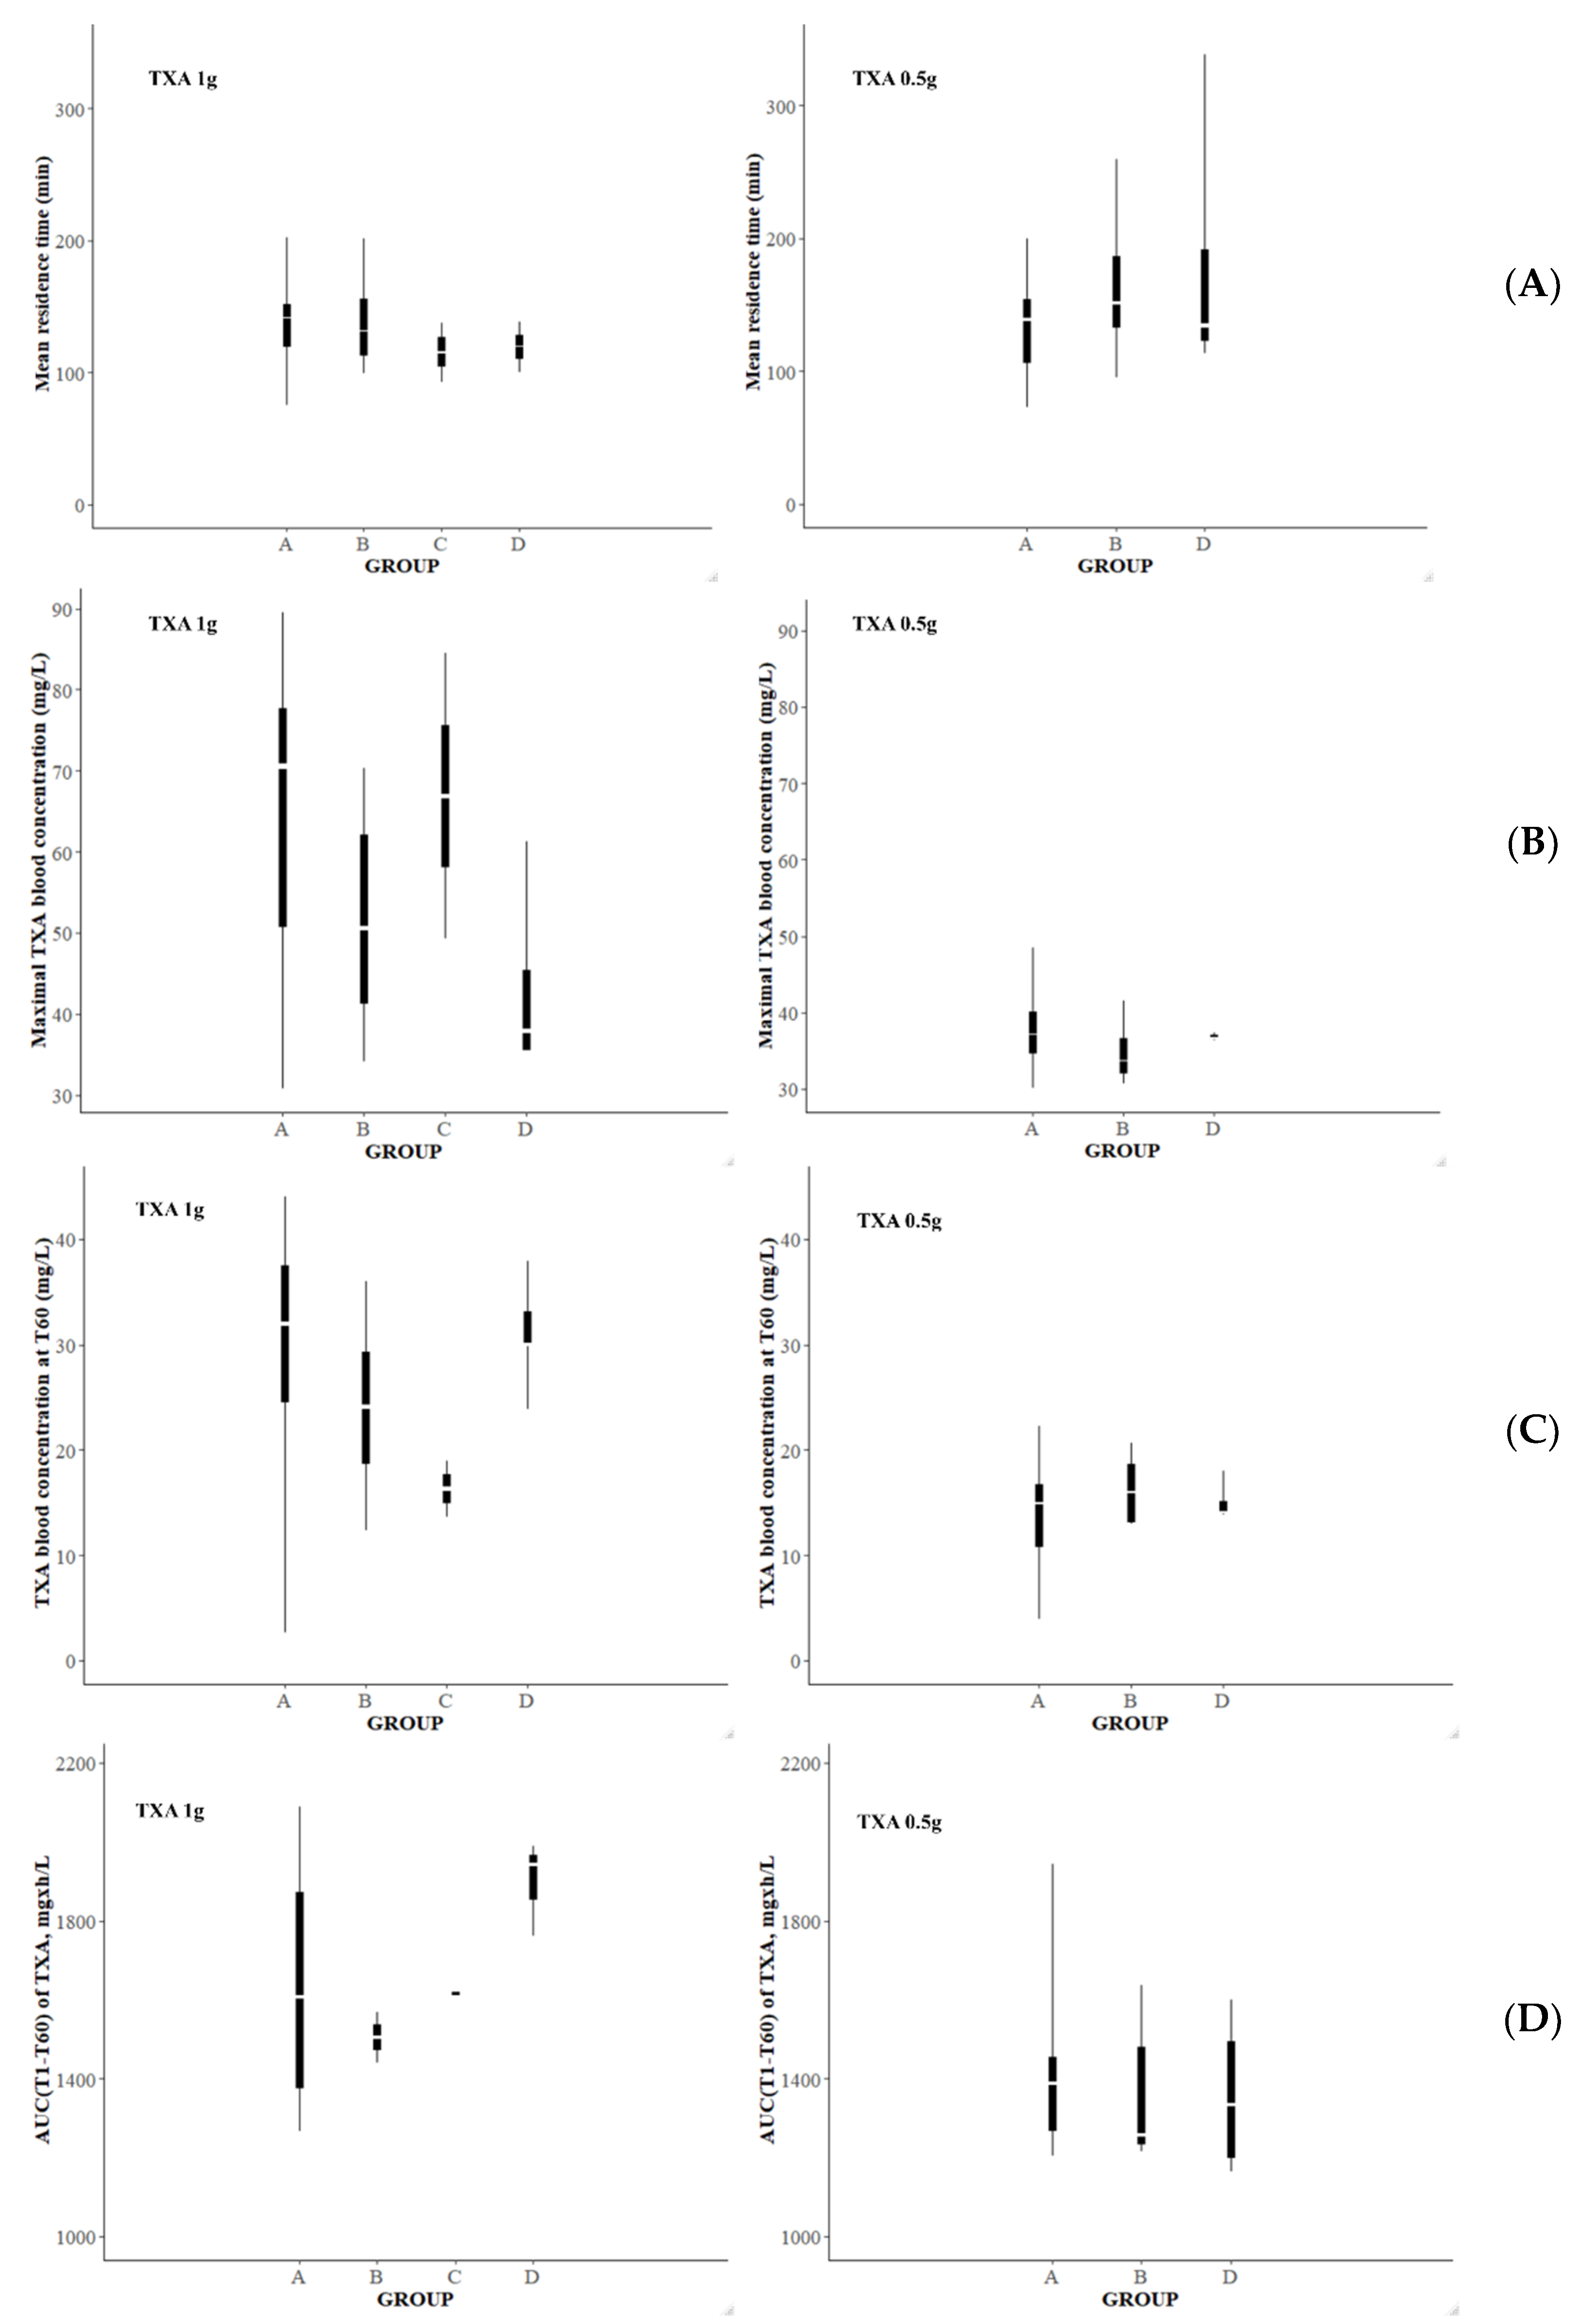
2.8. Simulations to Derive Optimal Dosing
3. Results
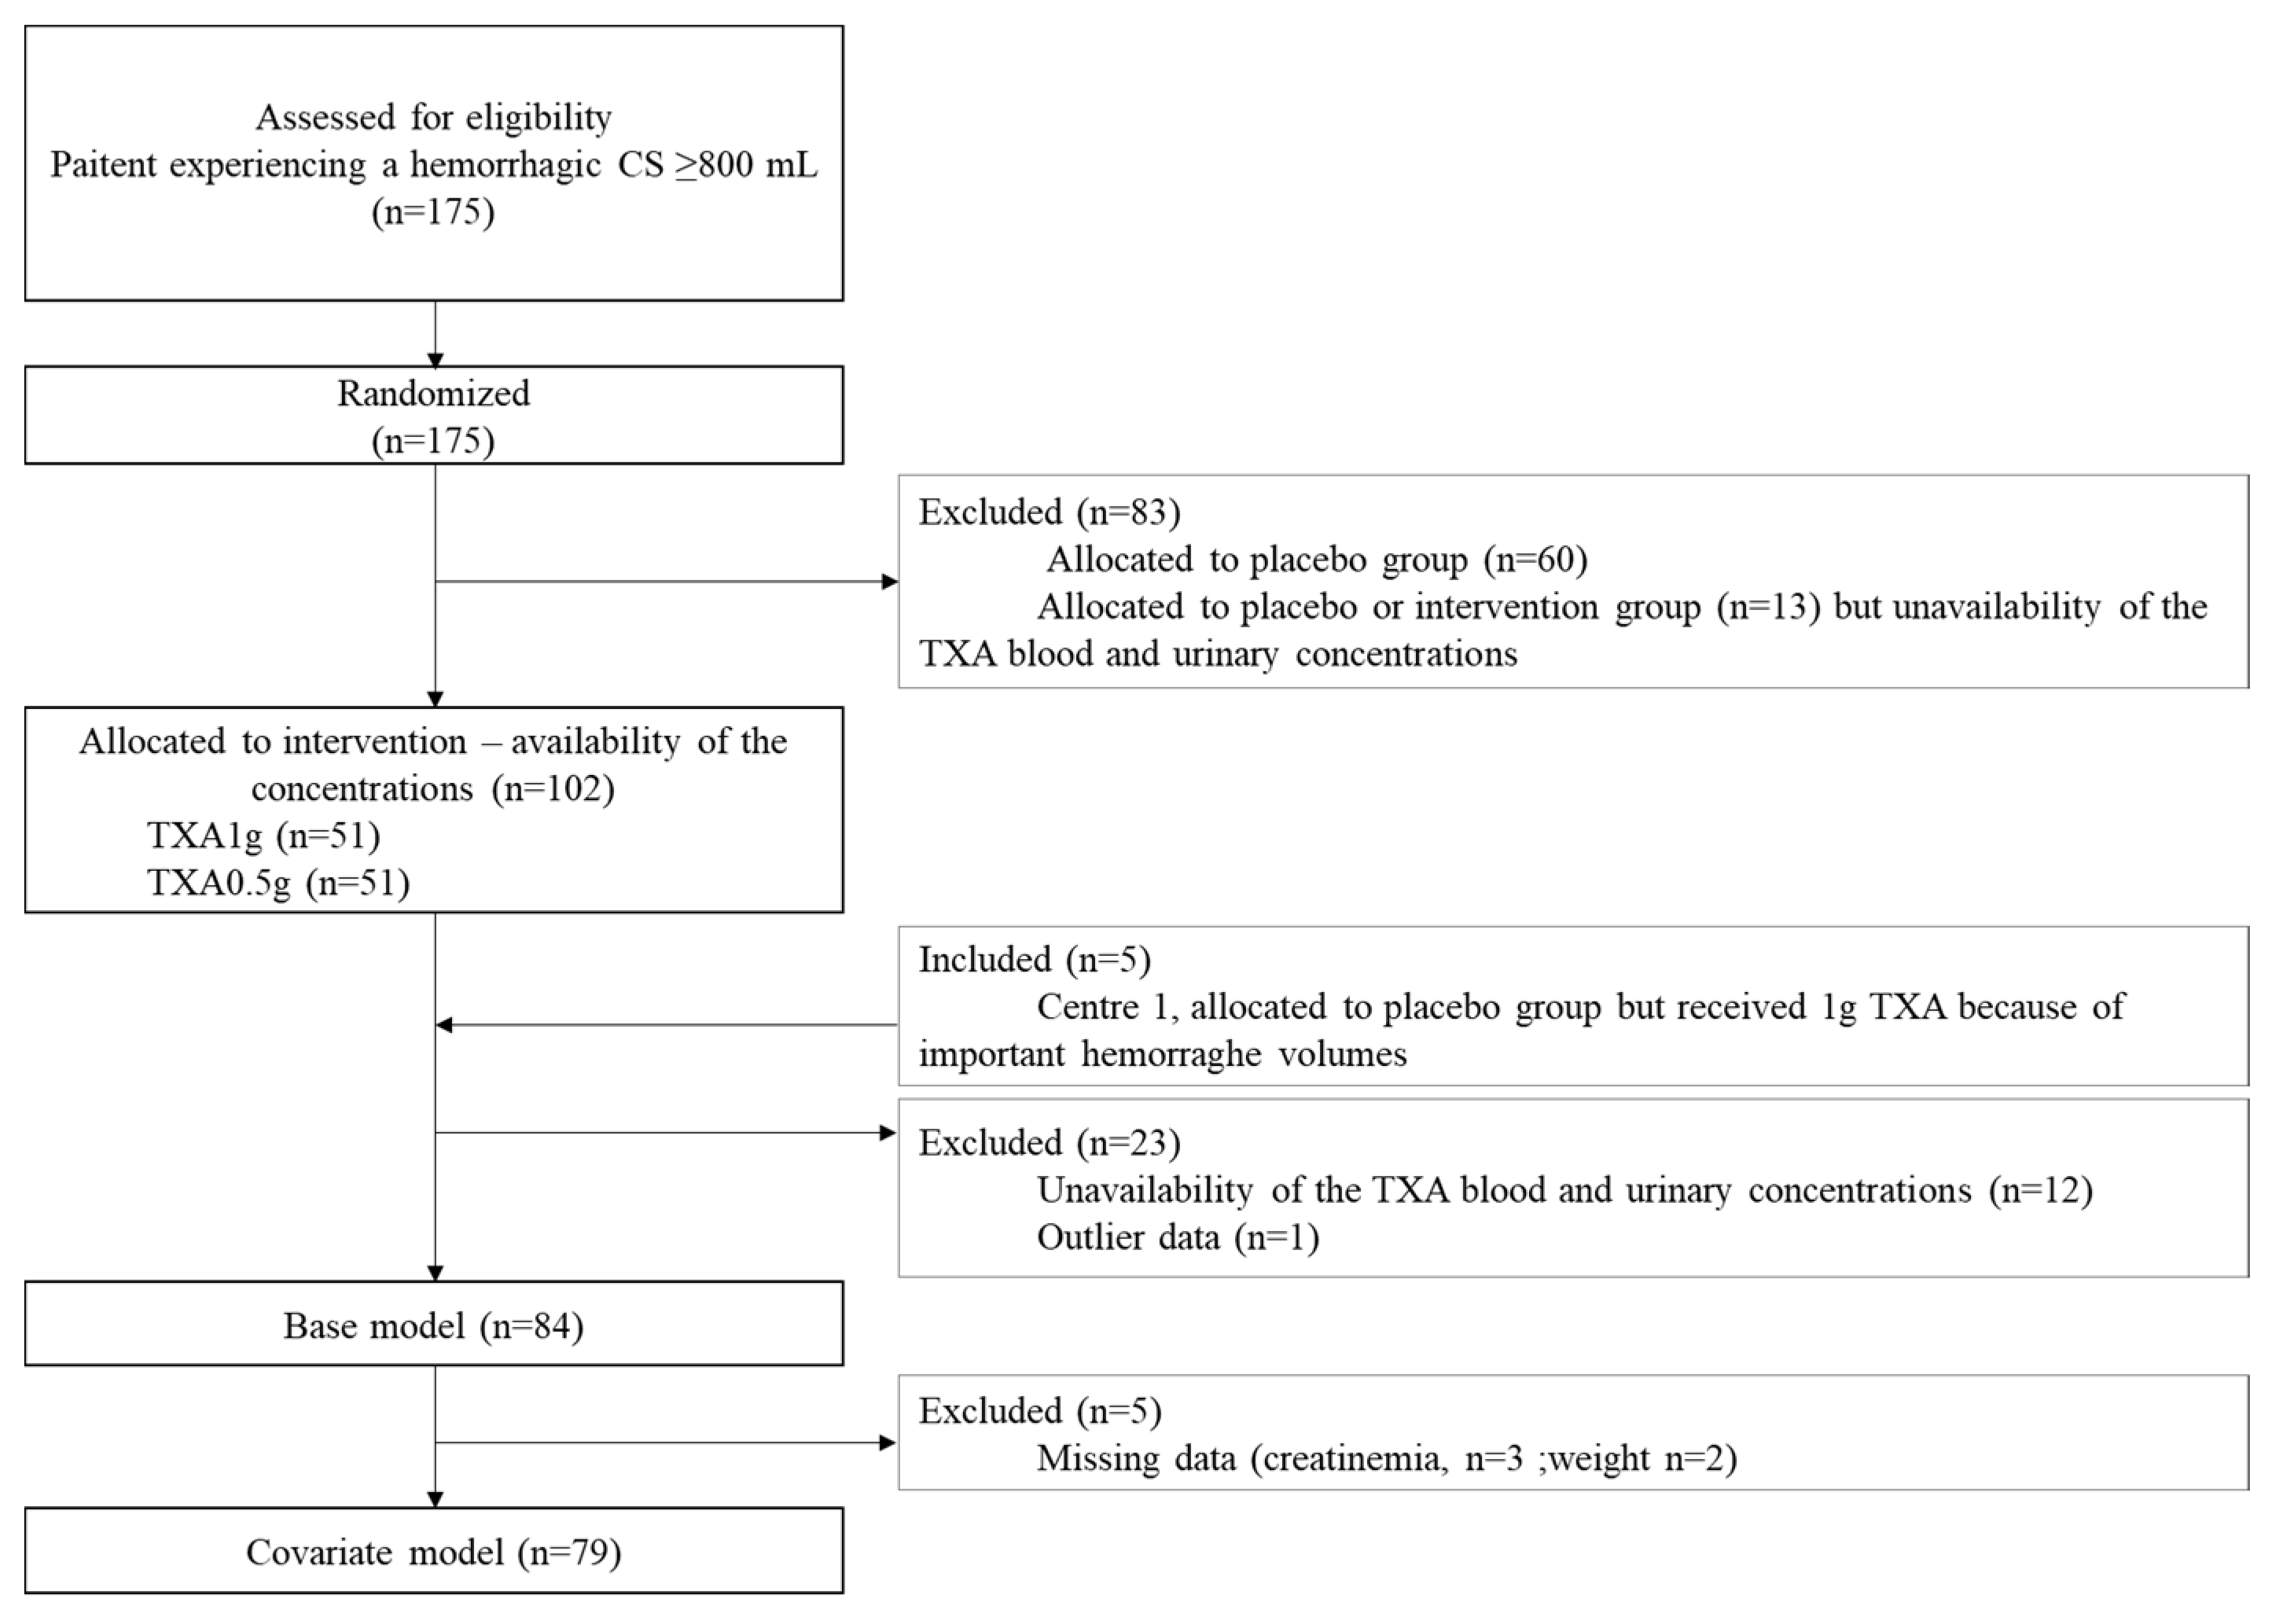
3.1. Recruitment
3.2. Exploratory Analysis
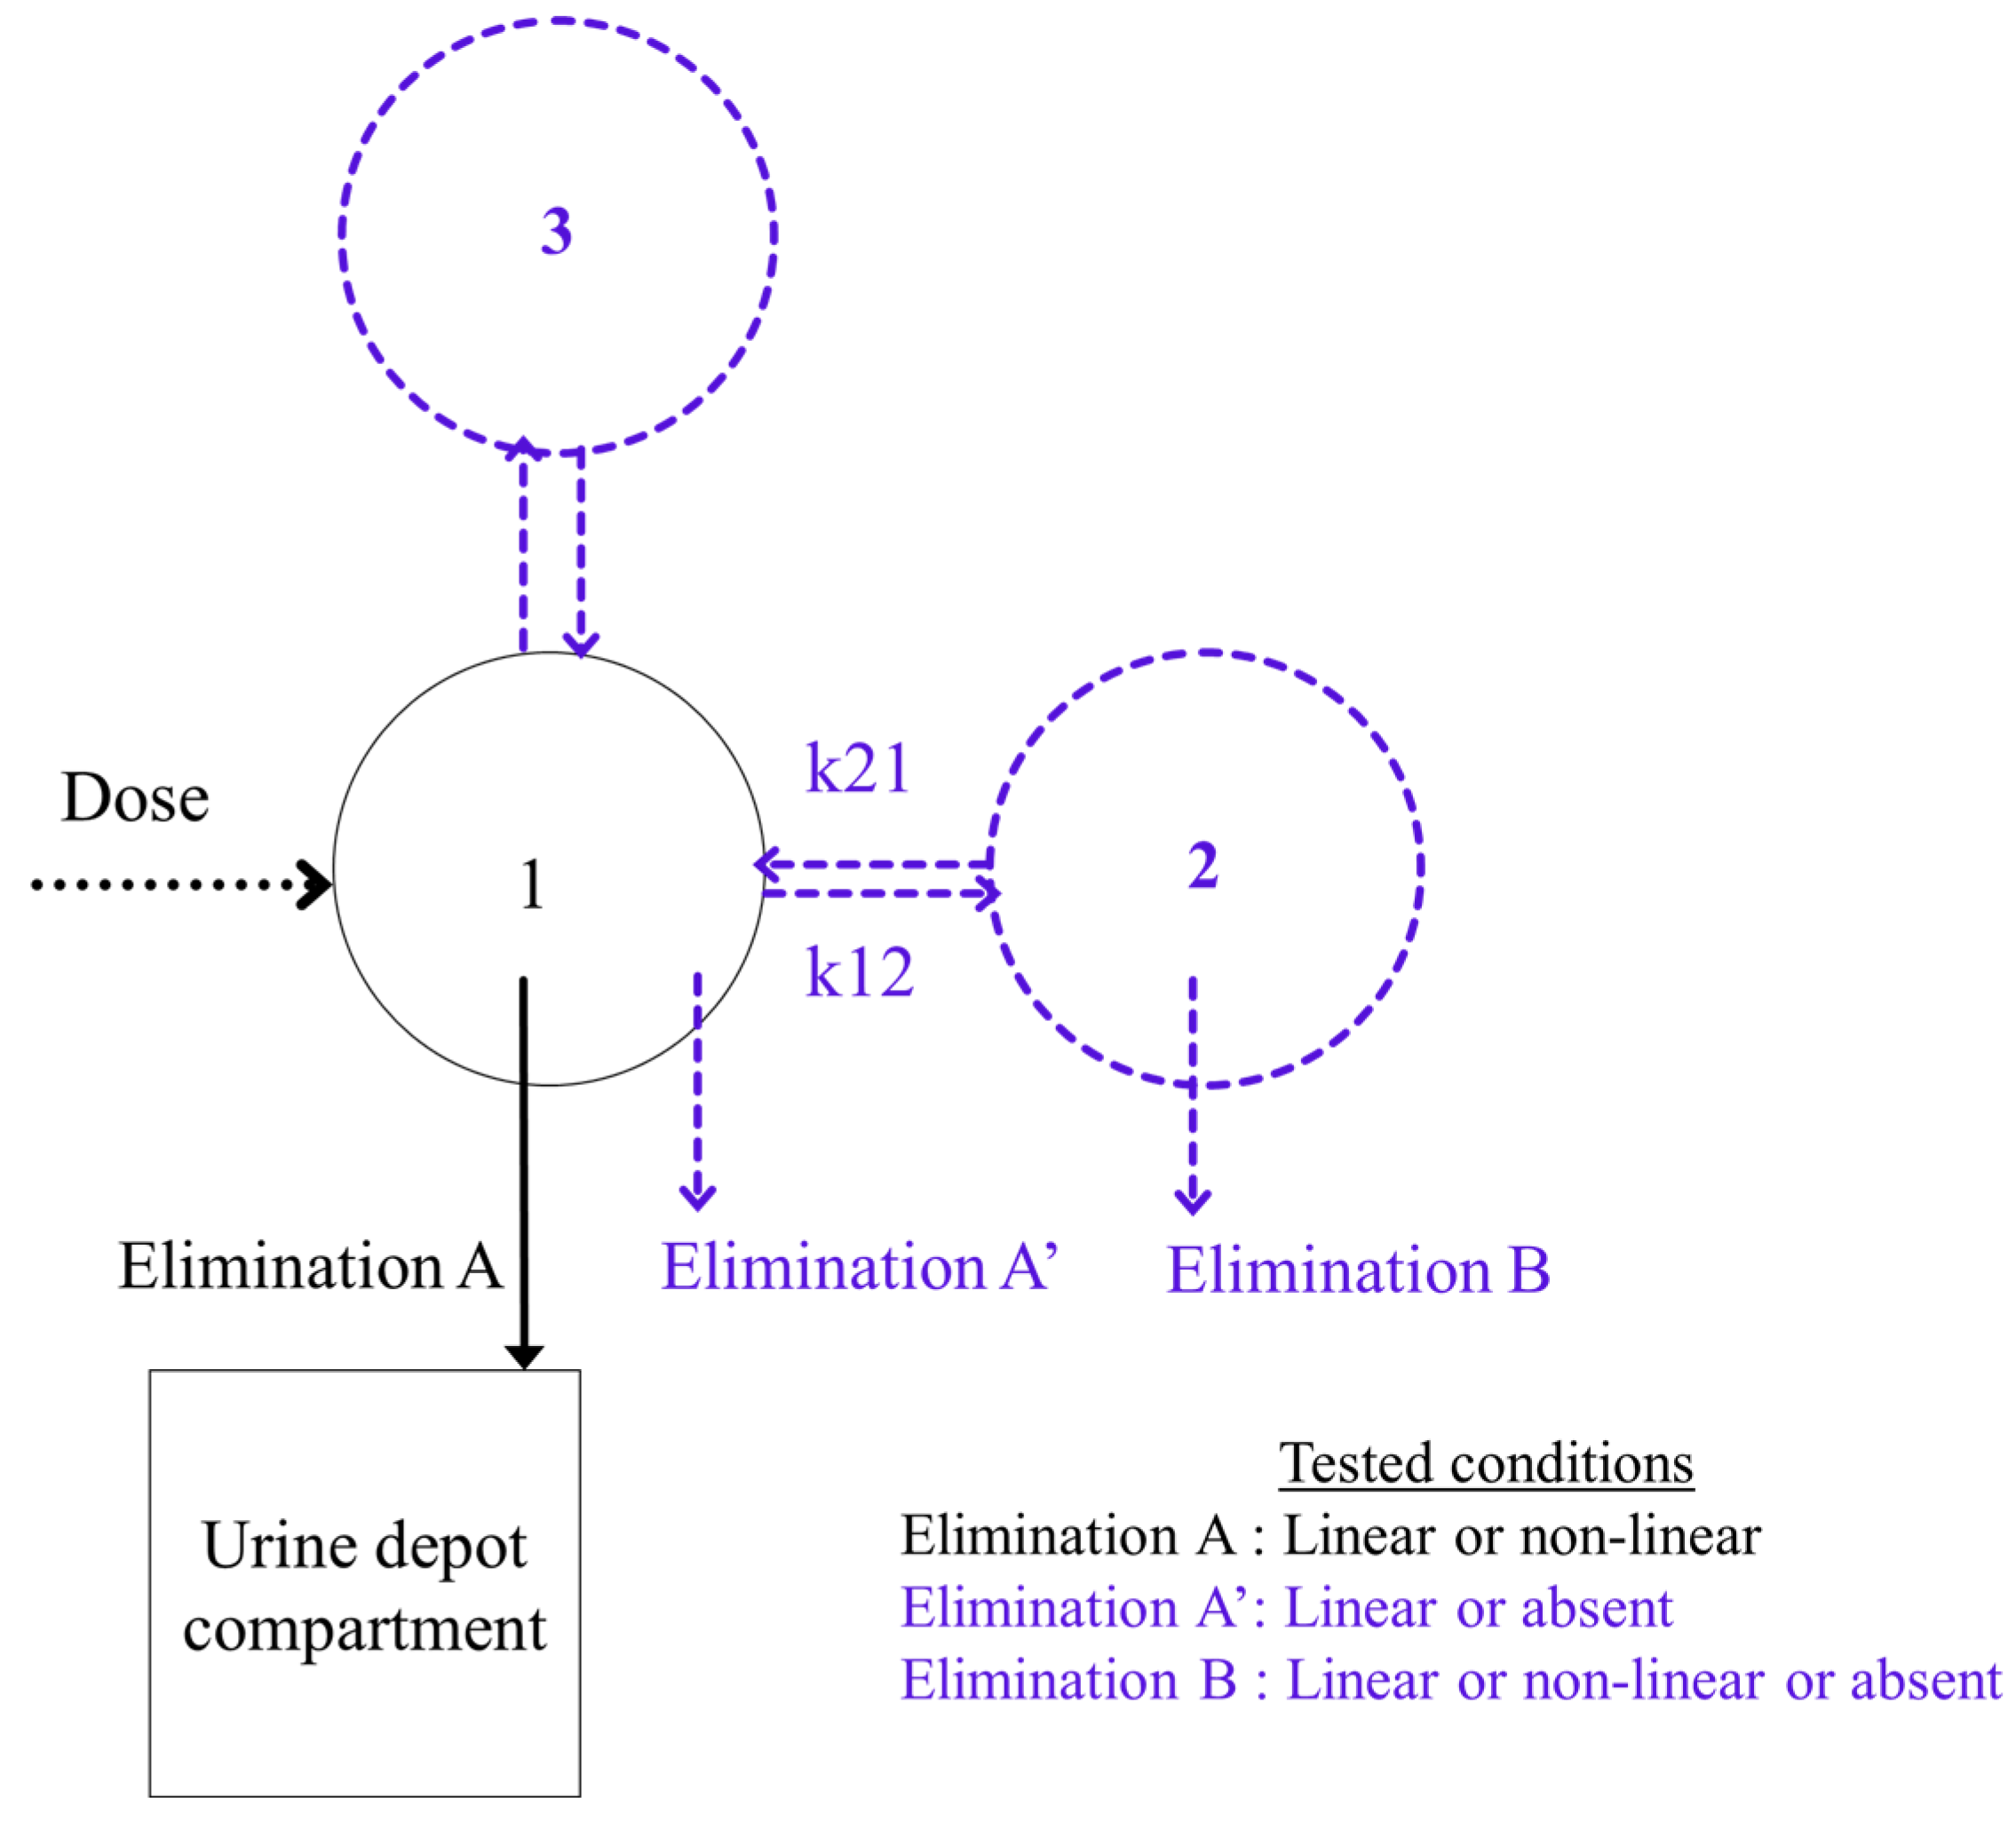
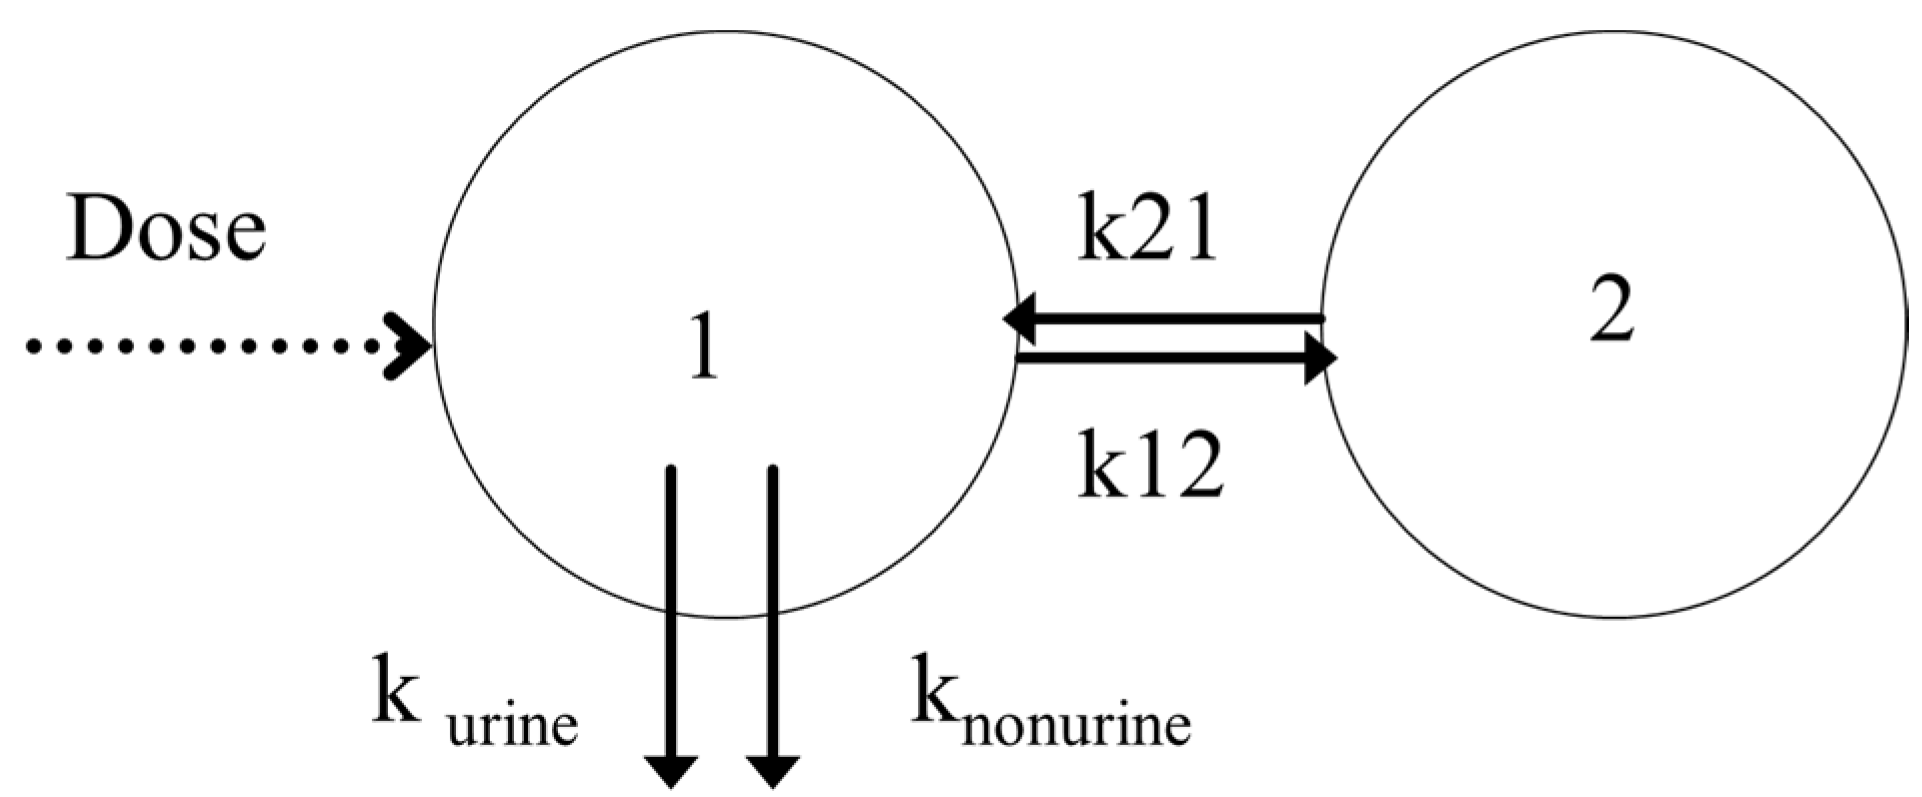
3.3. Base Model
3.4. Covariate Model
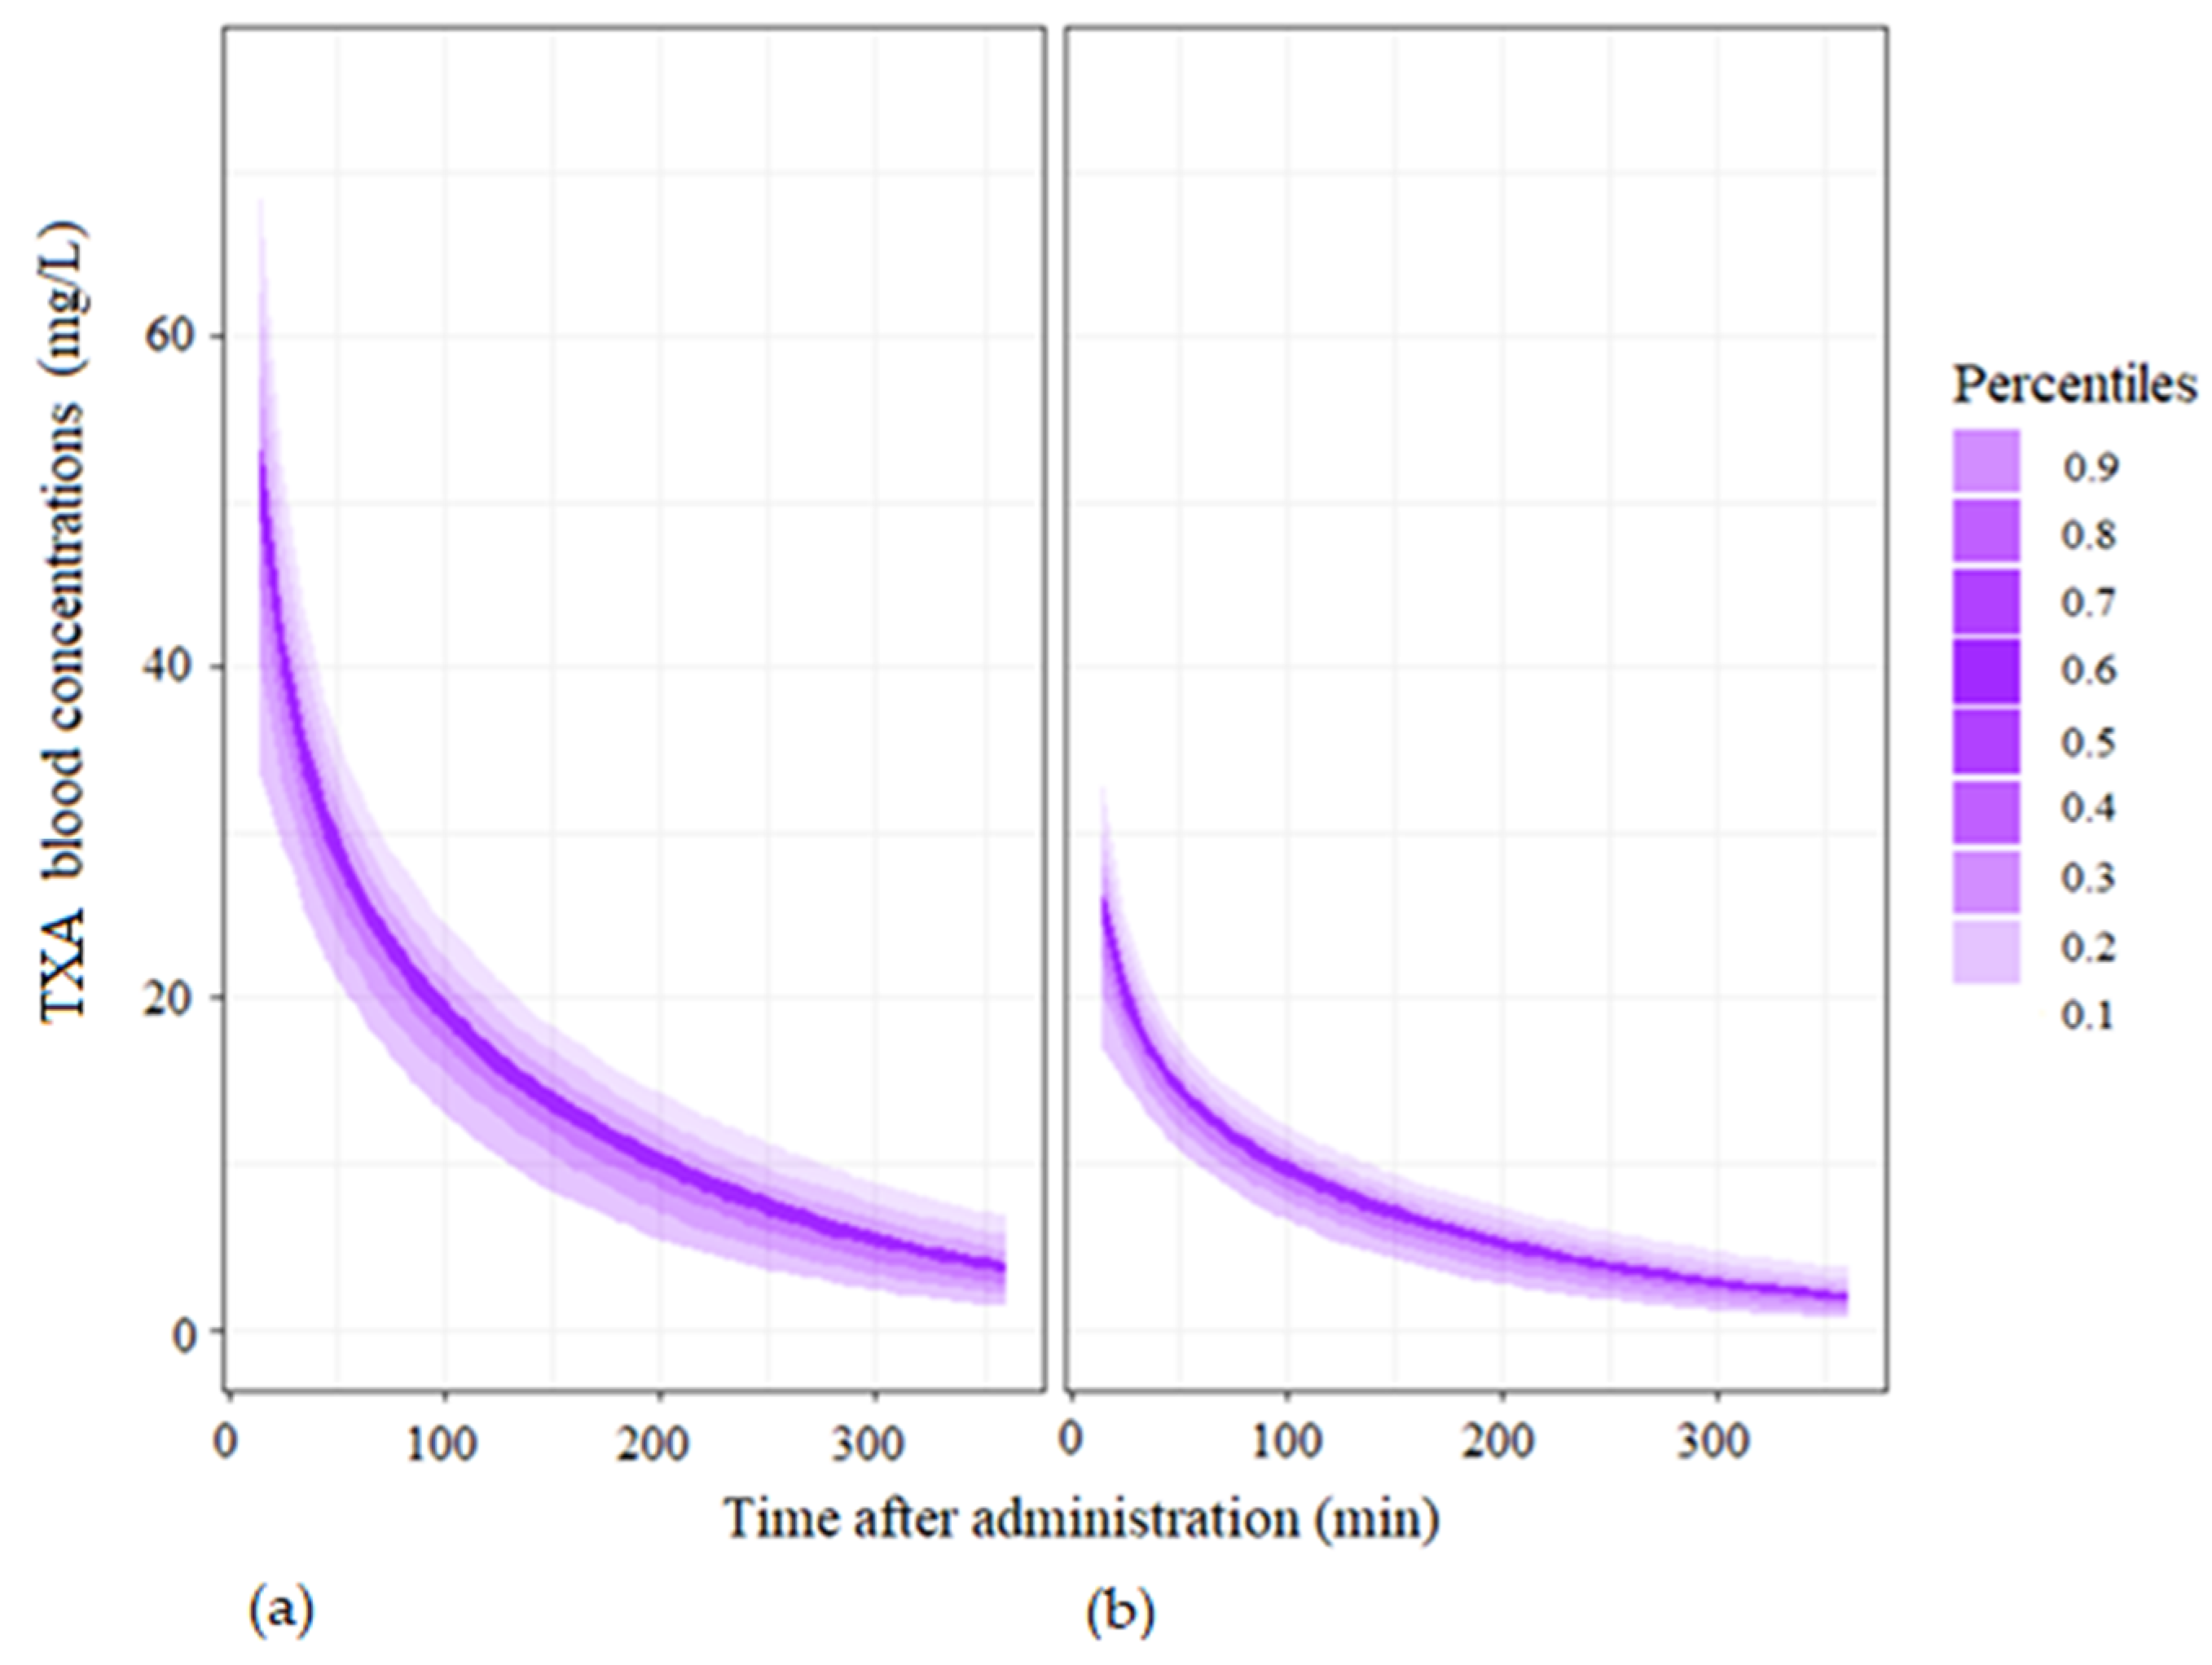
3.5. Simulations
3.6. Noncompartmental Analysis
4. Discussion
5. Conclusions
Author Contributions
Funding
Institutional Review Board Statement
Informed Consent Statement
Data Availability Statement
Acknowledgments
Conflicts of Interest
Appendix A

| Parameters | Formula |
|---|---|
| ABW, adjusted body weight, kg | |
| BMI, body mass index, kg/m2 | |
| LBW, lean body weight, kg | |
| IW, ideal weight, kg Devine et al., 1974, height in cm. | |
| BSA, body surface area, m2 Dubois and Dubois [24], height in m. | |
| eClcr, estimated creatinine clearance, mL/min Cockroft–Gault formula [25] SCr for serum creatinine in mg/dL. | |
| eGFR, estimated glomerular filtration rate, mL/min/1.73 m2, CKD-EPI formula [26] SCr for serum creatinine in mg/dL. | |
| eGFR, estimated glomerular filtration rate, mL/min/1.73 m2, MDRD formula [27] SCr for serum creatinine in mg/dL. |
Appendix B

Appendix C
| Patient | Age | BW | BWbef | eClcr | Blood Loss at T0 | Inclusion Group | Time of Rescue Dose (Dose) | Additional Blood Loss at the Time of Second Dose | TXA Amount Measured in the Total Urine at T360 |
|---|---|---|---|---|---|---|---|---|---|
| Units | - | kg | kg | mL·min−1 | mL | - | Min | mL | mg |
| 01-1-049 | 33 | 73 | 60 | 151.6 | 1019 | TXA1g | 117 (1 g) | 802 | 1144 |
| 01-1-065 | 40 | 74 | 63 | 148.8 | 850 | TXA1g | 236 (1 g) and 300 (1 g) | 1620 | 1058 |
| 01-1-070 | 36 | 66 | 53 | 72.3 | 1200 | TXA1g | 87 (1 g) | 1175 | 1199 |
| 01-1-099 | 37 | 85 | 75 | 182.4 | 1308 | TXA1g | 36 (1 g) | 345 | 1206 |
| 01-1-108 | 42 | 78 | 65 | 125.3 | 1275 | TXA0.5g | 72 (0.5 g) | 695 | 1303 |
| 01-1-119 | 33 | 86 | 68 | 95.4 | 1020 | TXA1g | 50 (1 g) | 1870 | 344 |
| 01-1-134 | 31 | 70 | 50 | 91.9 | 1720 | TXA1g | 153 (1 g) | 2020 | 105 |
| 01-1-151 | 35 | 115 | 99 | 204.5 | 1900 | TXA1g | 35 (1 g) | 600 | 648 |
| Patient | CL | V1 | V2 | Q | Purine |
|---|---|---|---|---|---|
| Units | L·min−1 | L | L | L·min−1 | - |
| 01-1-049 | 0.16 | 29.37 | 0.32 | 9.5 | 0.61 |
| 01-1-065 | 0.16 | 8.08 | 0.38 | 9.58 | 0.39 |
| 01-1-070 | 0.11 | 16.79 | 0.27 | 10.01 | 0.51 |
| 01-1-099 | 0.12 | 6.43 | 0.068 | 9.4 | 0.46 |
| 01-1-108 | 0.16 | 9.87 | 0.39 | 8.98 | 0.77 |
| 01-1-119 | 0.086 | 14.62 | 0.46 | 9.64 | 0.31 |
| 01-1-134 | 0.11 | 8.21 | 0.38 | 9.64 | 0.36 |
| 01-1-151 | 0.19 | 25.34 | 0.31 | 9.61 | 0.53 |
References
- Say, L.; Chou, D.; Gemmill, A.; Tunçalp, Ö.; Moller, A.B.; Daniels, J.; Gülmezoglu, A.M.; Temmerman, M.; Alkema, L. Global causes of maternal death: A WHO systematic analysis. Lancet Glob. Health 2014, 2, e323–e333. [Google Scholar] [CrossRef] [Green Version]
- Kassebaum, N.J.; Barber, R.M.; Bhutta, Z.A.; Dandona, L.; Gething, P.W.; Hay, S.I.; Kinfu, Y.; Larson, H.J.; Liang, X.; Lim, S.S.; et al. Global, regional, and national levels of maternal mortality, 1990–2015: A systematic analysis for the Global Burden of Disease Study 2015. Lancet 2016, 388, 1775–1812. [Google Scholar] [CrossRef] [Green Version]
- Borovac-Pinheiro, A.; Priyadarshani, P.; Burke, T.F. A review of postpartum haemorrhage in low-income countries and implications for strengthening health systems. Int. J. Gynecol. Obstet. 2021, 154, 393–399. [Google Scholar] [CrossRef] [PubMed]
- Vogel, J.P.; Oladapo, O.T.; Dowswell, T.; Gülmezoglu, A.M. Updated WHO recommendation on intravenous tranexamic acid for the treatment of post-partum haemorrhage. Lancet Glob. Health 2018, 6, e18–e19. [Google Scholar] [CrossRef] [Green Version]
- Cai, J.; Ribkoff, J.; Olson, S.; Raghunathan, V.; Al-Samkari, H.; DeLoughery, T.G.; Shatzel, J.J. The many roles of tranexamic acid: An overview of the clinical indications for TXA in medical and surgical patients. Eur. J. Haematol. 2020, 104, 79–87. [Google Scholar] [CrossRef]
- Ducloy-Bouthors, A.S.; Jude, B.; Duhamel, A.; Broisin, F.; Huissoud, C.; Keita-Meyer, H.; Mandelbrot, L.; Tillouche, N.; Fontaine, S.; Le Goueff, F.; et al. High-dose tranexamic acid reduces blood loss in postpartum haemorrhage. Crit Care 2011, 15, R117. [Google Scholar] [CrossRef] [Green Version]
- Shakur-Still, H.; Roberts, I.; Fawole, B.; Kuti, M.; Olayemi, O.O.; Bello, A.; Huque, S.; Ogunbode, O.; Kotila, T.; Aimakhu, C.; et al. Effect of tranexamic acid on coagulation and fibrinolysis in women with postpartum haemorrhage (WOMAN-ETAC): A single-centre, randomised, double-blind, placebo-controlled trial. Wellcome Open Res. 2018, 3, 100. [Google Scholar] [CrossRef]
- Shakur, H.; Roberts, I.; Bautista, R.; Caballero, J.; Coats, T.; Dewan, Y.; El-Sayed, H.; Gogichaishvili, T.; Gupta, S.; Herrera, J.; et al. Effects of tranexamic acid on death, vascular occlusive events, and blood transfusion in trauma patients with significant haemorrhage (CRASH-2): A randomised, placebo-controlled trial. Lancet 2010, 376, 23–32. [Google Scholar]
- Pilbrant, A.; Schannong, M.; Vessman, J. Pharmacokinetics and bioavailability of tranexamic acid. Eur. J. Clin. Pharm. 1981, 20, 65–72. [Google Scholar] [CrossRef]
- Elkomy, M.H.; Sultan, P.; Drover, D.R.; Epshtein, E.; Galinkin, J.L.; Carvalho, B. Pharmacokinetics of Prophylactic Cefazolin in Parturients Undergoing Cesarean Delivery. Antimicrob. Agents Chemother. 2014, 58, 3504–3513. [Google Scholar] [CrossRef] [Green Version]
- Shakur-Still, H.; Roberts, I.; Fawole, B.; Kuti, M.; Olayemi, O.O.; Bello, A.; Huque, S.; Ogunbode, O.; Kotila, T.; Aimakhu, C. Hypothesis for a partially non urinary elimination of tranexamic acid in haemorrhagic caesarean section: Traces pilot pharmacokinetic study: Pharmacokinetics of tranexamic acid in obstetrics. Eur. J. Pharm. Sci. 2020, 153, 105486. [Google Scholar]
- Ducloy-Bouthors, A.S.; Jeanpierre, E.; Saidi, I.; Baptiste, A.S.; Simon, E.; Lannoy, D.; Duhamel, A.; Allorge, D.; Susen, S.; Hennart , B. TRAnexamic acid in haemorrhagic CESarean section (TRACES) randomized placebo controlled dose-ranging pharmacobiological ancillary trial: Study protocol for a randomized controlled trial. Trials 2018, 19, 149. [Google Scholar] [CrossRef] [PubMed] [Green Version]
- Bouthors, A.S.; Hennart, B.; Jeanpierre, E.; Baptiste, A.S.; Saidi, I.; Simon, E.; Lannoy, D.; Duhamel, A.; Allorge, D.; Susen, S. Therapeutic and pharmaco-biological, dose-ranging multicentre trial to determine the optimal dose of TRAnexamic acid to reduce blood loss in haemorrhagic CESarean delivery (TRACES): Study protocol for a randomised, double-blind, placebo-controlled trial. Trials 2018, 19, 148. [Google Scholar] [CrossRef] [PubMed] [Green Version]
- Ghasemi, A.; Zahediasl, S. Normality Tests for Statistical Analysis: A Guide for Non-Statisticians. Int. J. Endocrinol. Metab. 2012, 10, 486–489. [Google Scholar] [CrossRef] [Green Version]
- Grassin-Delyle, S.; Semeraro, M.; Foissac, F.; Bouazza, N.; Shakur-Still, H.; Roberts, I.; Treluyer, J.M.; Urien, S. Tranexamic acid through intravenous, intramuscular and oral routes: An individual participant data meta-analysis of pharmacokinetic studies in healthy volunteers. Fundam. Clin. Pharmacol. 2019, 33, 670–678. [Google Scholar] [CrossRef]
- Grassin-Delyle, S.; Tremey, B.; Abe, E.; Fischler, M.; Alvarez, J.C.; Devillier, P.; Urien, S. Population pharmacokinetics of tranexamic acid in adults undergoing cardiac surgery with cardiopulmonary bypass. Br. J. Anaesth. 2013, 111, 916–924. [Google Scholar] [CrossRef] [Green Version]
- Grassin-Delyle, S.; Theusinger, O.M.; Albrecht, R.; Mueller, S.; Spahn, D.R.; Urien, S.; Stein, P. Optimisation of the dosage of tranexamic acid in trauma patients with population pharmacokinetic analysis. Anaesthesia 2018, 73, 719–729. [Google Scholar] [CrossRef] [Green Version]
- Dowd, N.P.; Karski, J.M.; Cheng, D.C.; Carroll, J.A.; Lin, Y.; James, R.L.; Butterworth, J. Pharmacokinetics of tranexamic acid during cardiopulmonary bypass. Anesthesiology 2002, 97, 390–399. [Google Scholar] [CrossRef]
- Grassin-Delyle, S.; Semeraro, M.; Lamy, E.; Urien, S.; Runge, I.; Foissac, F.; Bouazza, N.; Treluyer, J.M.; Arribas, M.; Roberts, I.; et al. Pharmacokinetics of tranexamic acid after intravenous, intramuscular, and oral routes: A prospective, randomised, crossover trial in healthy volunteers. Br. J. Anaesth. 2022, 128, 465–472. [Google Scholar] [CrossRef]
- Li, S.; Ahmadzia, H.K.; Guo, D.; Dahmane, E.; Miszta, A.; Luban, N.L.; Berger, J.S.; James, A.H.; Wolberg, A.S.; van den Anker, J.N.; et al. Population pharmacokinetics and pharmacodynamics of Tranexamic acid in women undergoing caesarean delivery. Br. J. Clin. Pharm. 2021, 87, 3531–3541. [Google Scholar] [CrossRef]
- Ahmed, S.B.; Bentley-Lewis, R.; Hollenberg, N.K.; Graves, S.W.; Seely, E.W. A comparison of prediction equations for estimating glomerular filtration rate in pregnancy. Hypertens Pregnancy 2009, 28, 243–255. [Google Scholar] [CrossRef] [PubMed] [Green Version]
- Gao, M.; Vilayur, E.; Ferreira, D.; Nanra, R.; Hawkins, J. Estimating the glomerular filtration rate in pregnancy: The evaluation of the Nanra and CKD-EPI serum creatinine-based equations. Obs. Med. 2021, 14, 31–34. [Google Scholar] [CrossRef] [PubMed]
- Picetti, R.; Shakur-Still, H.; Medcalf, R.L.; Standing, J.F.; Roberts, I. What concentration of tranexamic acid is needed to inhibit fibrinolysis? A systematic review of pharmacodynamics studies. Blood Coagul Fibrinolysis 2019, 30, 1–10. [Google Scholar] [CrossRef] [Green Version]
- Dubois, D.; Dubois, E.F. A formula to estimate the approximate surface area if height and weight be known. Arch. Intern. Med. 1989, 5, 303–311. [Google Scholar]
- Cockcroft, D.W.; Gault, M.H. Prediction of creatinine clearance from serum creatinine. Nephron 1976, 16, 31–41. [Google Scholar] [CrossRef] [PubMed]
- Levey, A.S.; Stevens, L.A.; Schmid, C.H.; Zhang, Y.; Castro, A.F., III; Feldman, H.I.; Kusek, J.W.; Eggers, P.; Van Lente, F.; Greene, T.; et al. A New Equation to Estimate Glomerular Filtration Rate. Ann. Intern. Med. 2009, 150, 604–612. [Google Scholar] [CrossRef]
- Levey, A.S.; Coresh, J.; Greene, T.; Marsh, J.; Stevens, L.A.; Kusek, J.W.; Van Lente, F. Expressing the Modification of Diet in Renal Disease Study equation for estimating glomerular filtration rate with standardized serum creatinine values. Clin. Chem. 2007, 53, 766–772. [Google Scholar] [CrossRef] [Green Version]


| Characteristics, Mean (SD 1) | Group TXA0.5g 2 (n = 34) | Group TXA1g 2 (n = 45) | p-Value |
|---|---|---|---|
| Age (years) | 34 (5) | 33 (4) | 0.47 |
| Height (cm) | 166 (8) | 164 (7) | 0.19 |
| IW 3 (kg) | 58.3 (7.0) | 56.3 (6.3) | 0.19 |
| BW 4 before pregnancy (kg) | 73.2 (21.1) | 72 (17) | 0.46 |
| BW (kg) | 84.3 (18.6) | 83.0 (15.2) | 0.73 |
| BMI 5 before pregnancy (kg/m2) | 26.4 (7.0) | 26.6 (6.0) | 0.54 |
| BMI (kg/m2) | 30.4 (6.0) | 30.8 (5.1) | 0.68 |
| ABW 6 before pregnancy (kg) correction factor = 0.4 1 | 68.7 (10.0) | 67.0 (8.3) | 0.65 |
| LBW 7 before pregnancy (kg) | 43.9 (7.4) | 43.0 (6.3) | 0.65 |
| LBW (kg) | 47.8 (6.4) | 46.9 (5.4) | 0.58 |
| BSA 8 before pregnancy (m2) | 1.8 (0.2) | 1.8 (0.2) | 0.88 |
| BSA (m2) | 1.9 (0.2) | 1.9 (0.2) | 0.54 |
| Serum creatinine concentration (mg/dL) | 6.5 (1.5) | 6.7 (1.6) | 0.25 |
| eClcr 9 (Cockroft–Gault, mL/min) with BW before pregnancy | 150.5 (64.5) | 143.4 (53.2) | 0.47 |
| eClcr (Cockroft–Gault, mL/min) | 172.3 (62.3) | 166.3 (56.1) | 0.42 |
| eGFR 10 (CKD-EPI, mL/min/1.73 m2) with BW before pregnancy | 122.5 (20.8) | 119.7 (17.2) | 0.44 |
| eGFR (CKD-EPI, mL/min/1.73 m2) | 130.3 (19.1) | 127.9 (16.4) | 0.42 |
| eGFR (MDRD, mL/min/1.73 m2) with BW before pregnancy | 117.1 (37.1) | 111.9 (35.5) | 0.42 |
| eGFR (MDRD, mL/min/1.73 m2) | 124.5 (37.5) | 119.5 (37.0) | 0.47 |
| Bleeding volume at inclusion (mL) | 1091 (273) | 1163 (318) | 0.34 |
| Nb 1 of Compartments | Elimination A 2 | Elimination A′ 3 | Elimination B 4 | −2LL 5 | BICc 6 | Condition Index |
|---|---|---|---|---|---|---|
| 1 | First-order | - | - | 4283.98 | 4323.8 | 3 |
| First-order | First-order | - | 4045.05 | 4101.69 | 12 | |
| 2 | Non-linear | - | - | 4229.73 | 4301.42 | 111 |
| 2 | Non-linear | - | First-order | NA 7 | NA | NA |
| 2 | Non-linear | - | Non-linear | NA | NA | NA |
| 2 | First-order | - | - | 4097.00 | 4158.44 | 6 |
| 2 | First-order | - | First-order | 4127.8 | 4199.49 | 33 |
| 2 | First-order | - | Non-linear | 4071.26 | 4153.57 | 84 |
| 2 | First-order | First-order | - | 3980.12 | 4051.81 | 81 |
| 3 | First-order | - | - | 3987.84 | 4080.78 | 14 |
| Model | Parametrization | −2LL 1 | BICc 2 | κ 3 |
|---|---|---|---|---|
| (A): Base model | CL, V1, V2, Q, purine | 3774.45 | 3845.38 | 12.98 |
| (B): (A)+ covariate effect | * eClcr 5 + ηCL 6 | 3725.64 | 3800.94 | 41.21 |
| BWbef 7 + ηV1 | 3760.16 | 3835.46 | 948.88 | |
| BWbef + ηV2 | 3758.82 | 3834.12 | 189.46 | |
| log(BWbef/70) + ηV1 | 3762.93 | 3838.23 | 30.82 | |
| (C): (B) * + covariate effect | BW 8 + ηV1 | 3710.77 | 3790.44 | 227.97 |
| log(BW/70) + ηV1 | 3712.91 | 3792.58 | 71.90 | |
| BWbef + ηV1 | 3714.07 | 3793.74 | 137.24 | |
| ** log(BWbef/70) + ηV1 | 3711.10 | 3790.77 | 35.14 | |
| (D): (C) ** + covariate effect | Age + ηCL | 3705.86 | 3789.90 | 346.30 |
| Parametrization | Original Dataset | Bootstrap | |||
|---|---|---|---|---|---|
| Population Parameters | Covariate Effect | Estimated Values (RSE 1, %) | Shrinkage (Conditional Distribution) % | Median | (Q1; Q3) 2 |
| θCL (L/min) | 0.077 (7.3) | 2.88 | 0.0785 | (0.0746; 0.0825) | |
| βCL | 0.0039 (11.8) | NA 4 | 0.0038 | (0.0035; 0.0042) | |
| θV1 (L) | 9.25 (12.0) | 0.857 | 9.76 | (7.78; 12.61) | |
| βV1 | - | 1.41 (25.8) | NA | 1.31 | (0.93; 1.68) |
| θQ (L/min) | - | 0.32 (15.3) | −3.74 | 0.30 | (0.24; 0.37) |
| θV2 (L) | - | 9.49 (5.1) | 2.64 × 10⁻⁴ | 9.58 | (8.41; 10.36) |
| θpurine | - | 0.54 (7.0) | −1.37 | 0.55 | (0.53; 0.57) |
| ωCL (%) | - | 20 (11.2) | - | 0.19 | (0.18; 0.21) |
| ωV1 (%) | - | 59 (14.1) | - | 0.48 | (0.32; 0.61) |
| ωQ (%) | - | 67 (18.8) | - | 0.65 | (0.54; 0.74) |
| ωV2 (%) | - | 13 (31.9) | - | 0.20 | (0.14; 0.30) |
| ωpurine (%) | - | 46 (11.9) | - | 0.44 | (0.36; 0.52) |
| a1 | NA | 0.44 (33.0) | NA | 0.38 | (0.10; 0.52) |
| b1 | NA | 0.15 (6.8) | NA | 0.15 | (0.14; 0.16) |
| b2 | NA | 0.52 (7.9) | NA | 0.52 | (0.49; 0.54) |
| Mean (10th–90th Percentile) | 15 min after Administration | 30 min after Administration | 60 min after Administration | 120 min after Administration | 360 min after Administration |
|---|---|---|---|---|---|
| Single dose of 0.5 g of TXA | 55.1 (35.3;77.8) | 39.2 (28.7;51.6) | 27.5 (19.6;35.6) | 17.3 (10.7;23.9) | 4.6 (1.3;8.8) |
| Single dose of 1 g of TXA | 27.1 (17.3;37.6) | 19.6 (13.9;25.6) | 13.8 (10.0;18.3) | 8.9 (5.5;12.4) | 2.4 (0.6;4.6) |
Publisher’s Note: MDPI stays neutral with regard to jurisdictional claims in published maps and institutional affiliations. |
© 2022 by the authors. Licensee MDPI, Basel, Switzerland. This article is an open access article distributed under the terms and conditions of the Creative Commons Attribution (CC BY) license (https://creativecommons.org/licenses/by/4.0/).
Share and Cite
Gilliot, S.; Ducloy-Bouthors, A.-S.; Loingeville, F.; Hennart, B.; Allorge, D.; Lebuffe, G.; Odou, P. Pharmacokinetics of Curative Tranexamic Acid in Parturients Undergoing Cesarean Delivery. Pharmaceutics 2022, 14, 578. https://doi.org/10.3390/pharmaceutics14030578
Gilliot S, Ducloy-Bouthors A-S, Loingeville F, Hennart B, Allorge D, Lebuffe G, Odou P. Pharmacokinetics of Curative Tranexamic Acid in Parturients Undergoing Cesarean Delivery. Pharmaceutics. 2022; 14(3):578. https://doi.org/10.3390/pharmaceutics14030578
Chicago/Turabian StyleGilliot, Sixtine, Anne-Sophie Ducloy-Bouthors, Florence Loingeville, Benjamin Hennart, Delphine Allorge, Gilles Lebuffe, and Pascal Odou. 2022. "Pharmacokinetics of Curative Tranexamic Acid in Parturients Undergoing Cesarean Delivery" Pharmaceutics 14, no. 3: 578. https://doi.org/10.3390/pharmaceutics14030578