
Physiologically Based Pharmacokinetic (PBPK) Model of Gold Nanoparticle-Based Drug Delivery System for Stavudine Biodistribution

 , , , and
Abstract
:1. Introduction
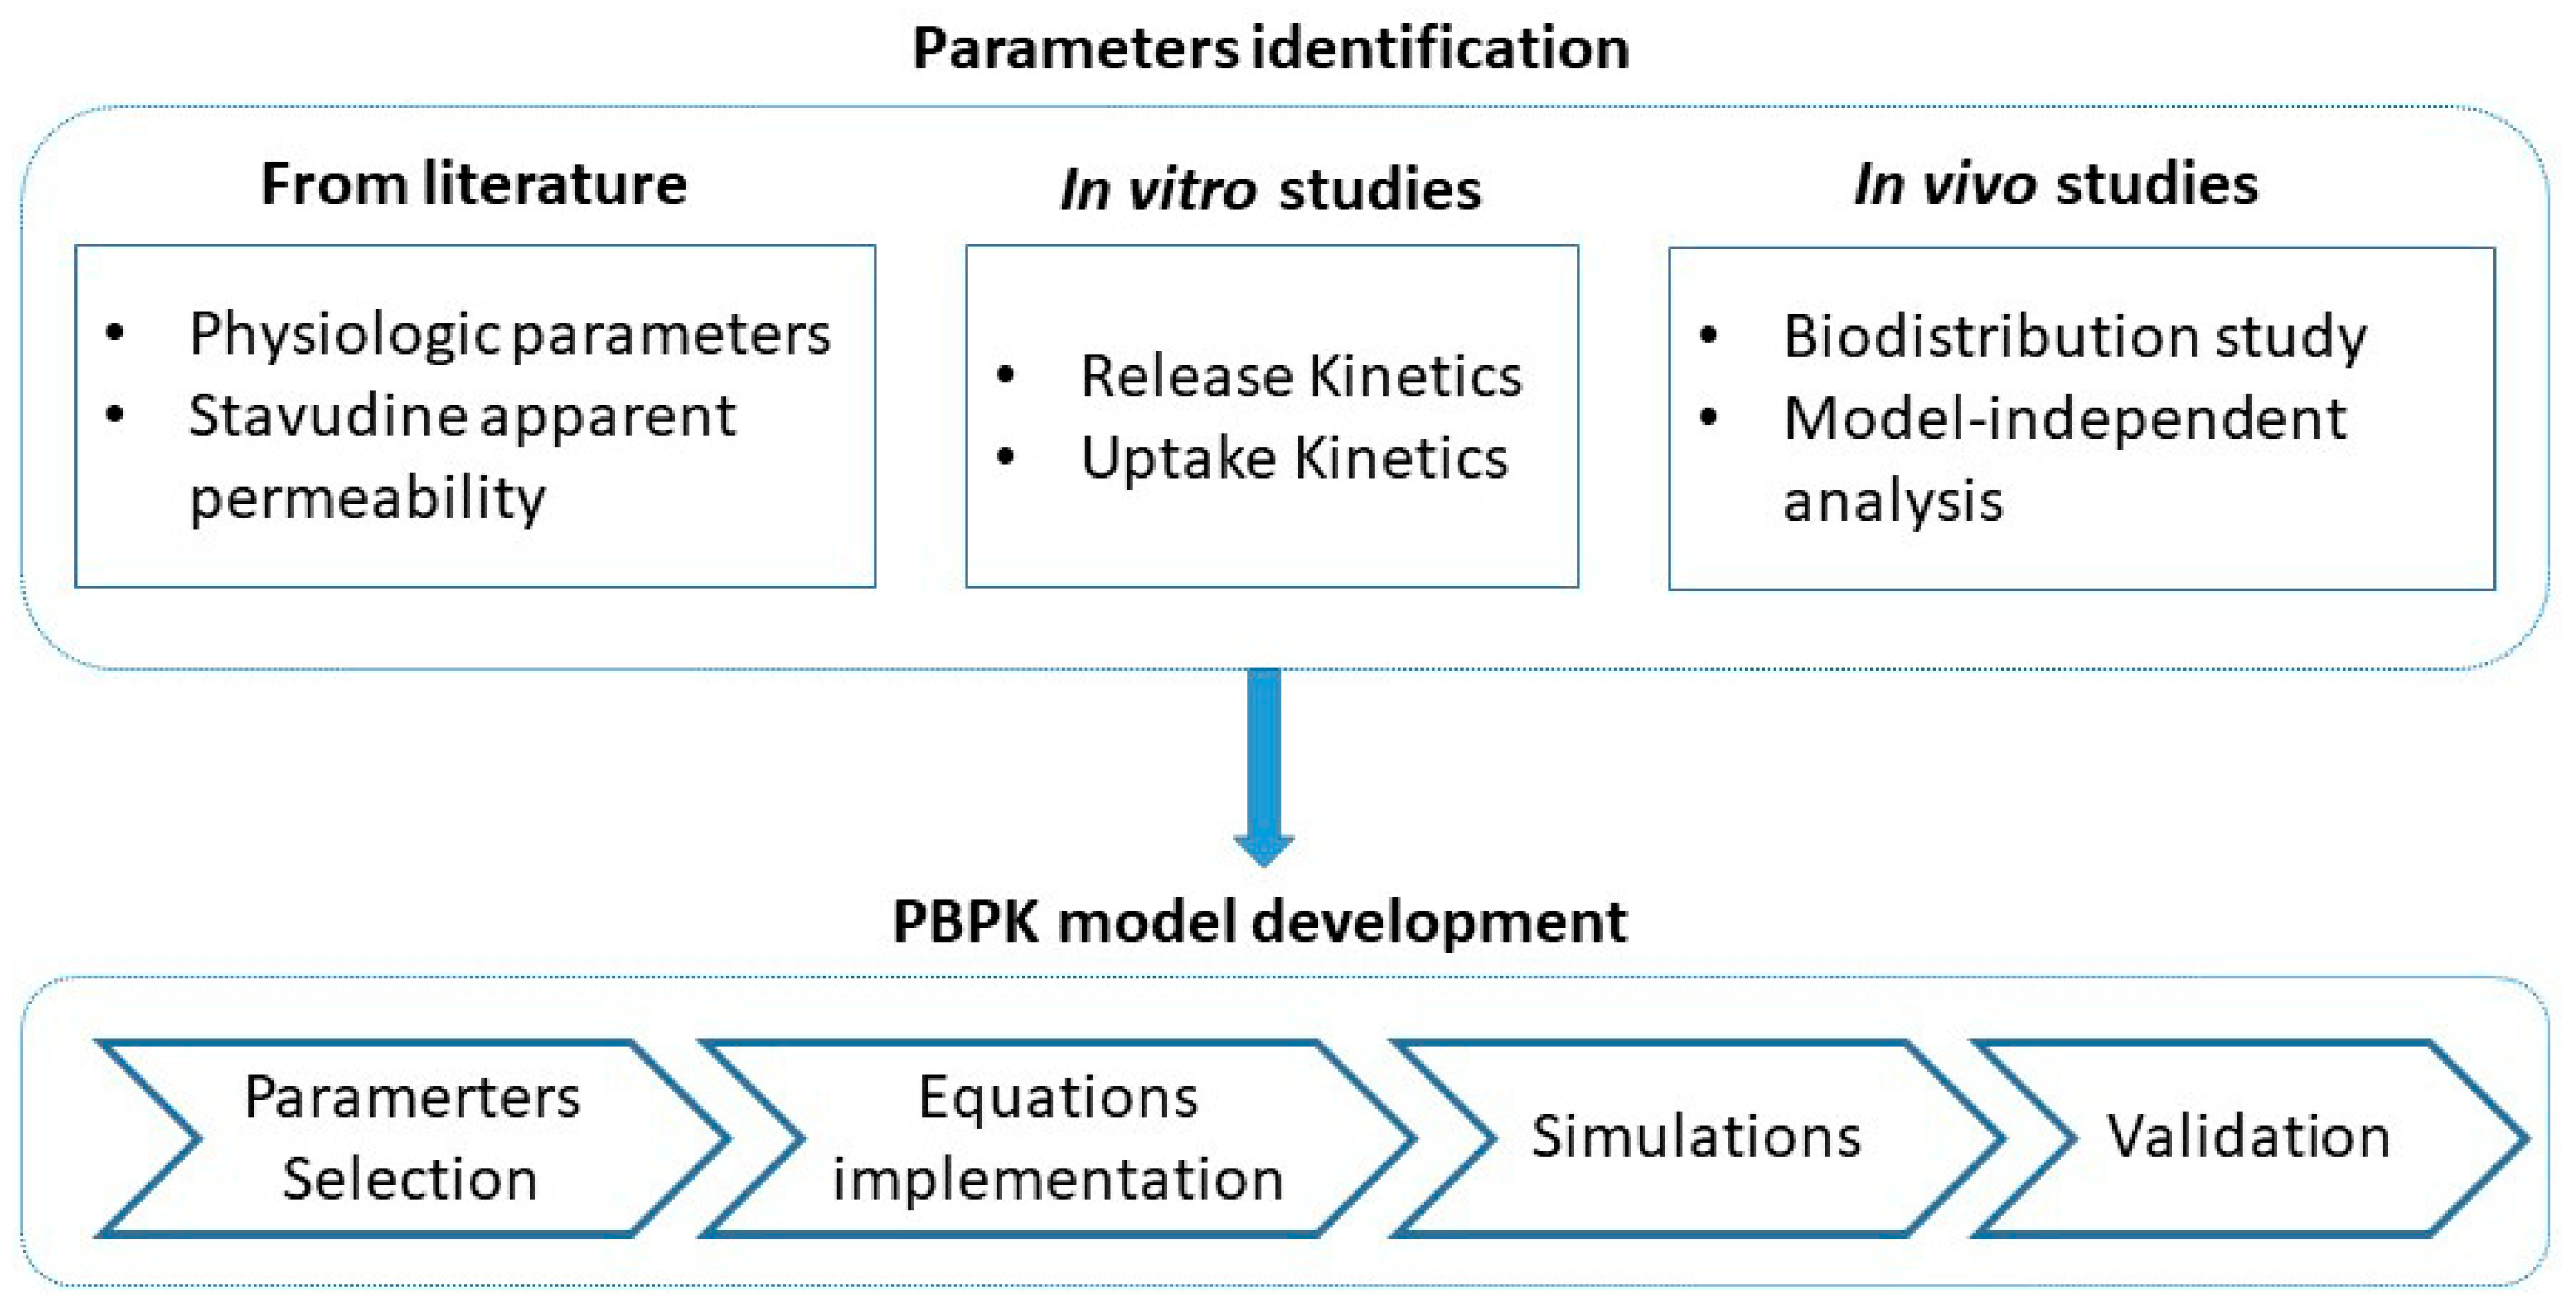
2. Materials and Methods
2.1. Materials
2.2. Development of Stavudine Gold Nanoparticles
- -
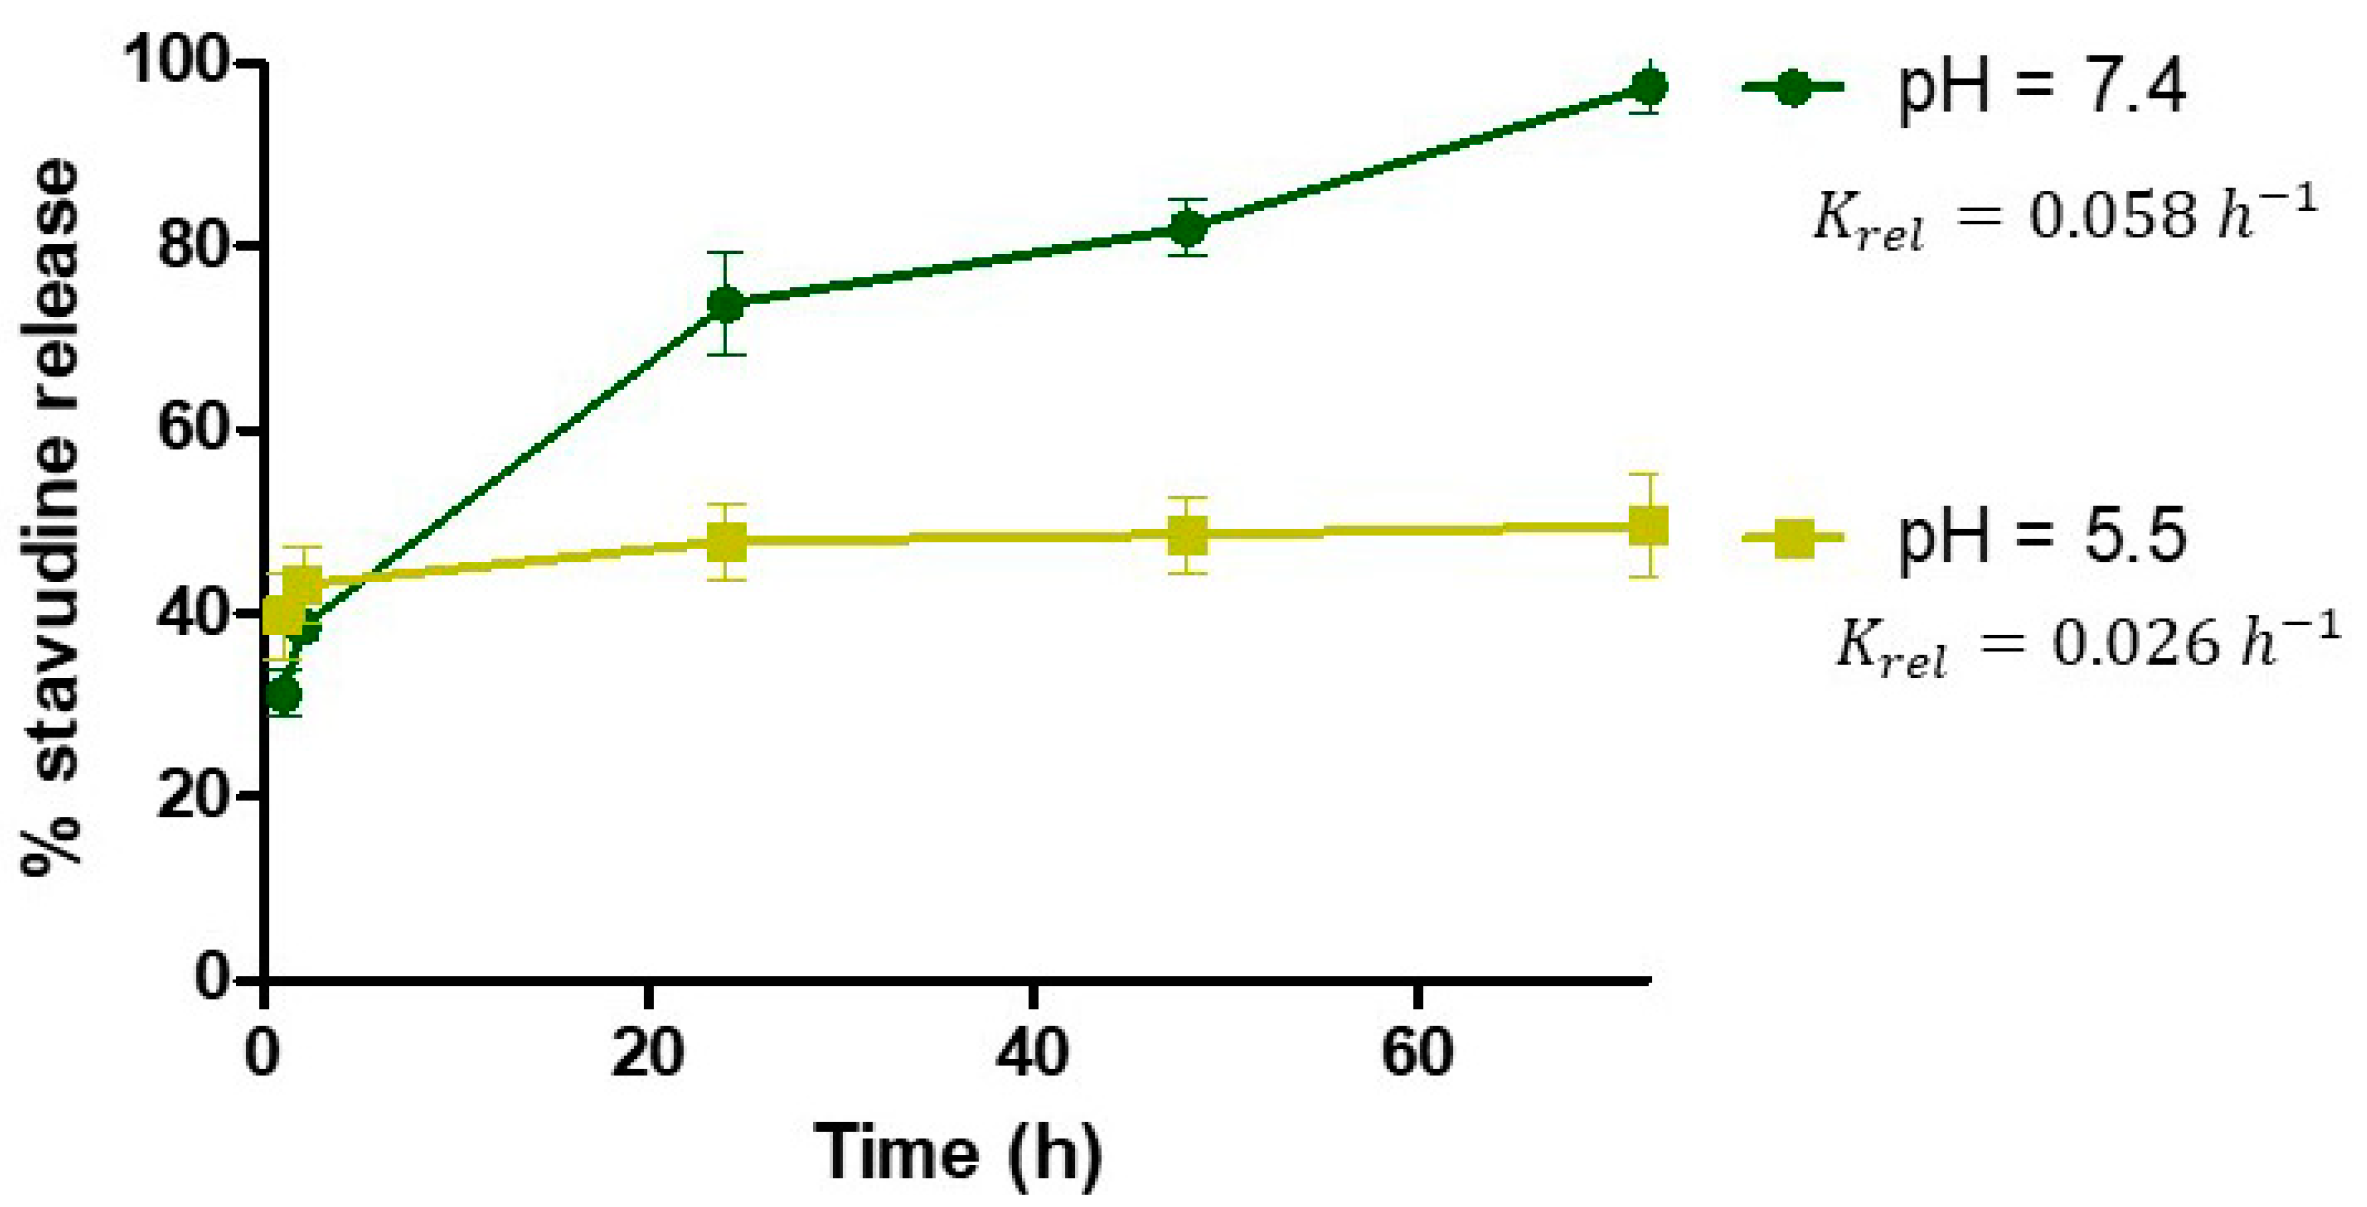
- Drug Release Kinetics
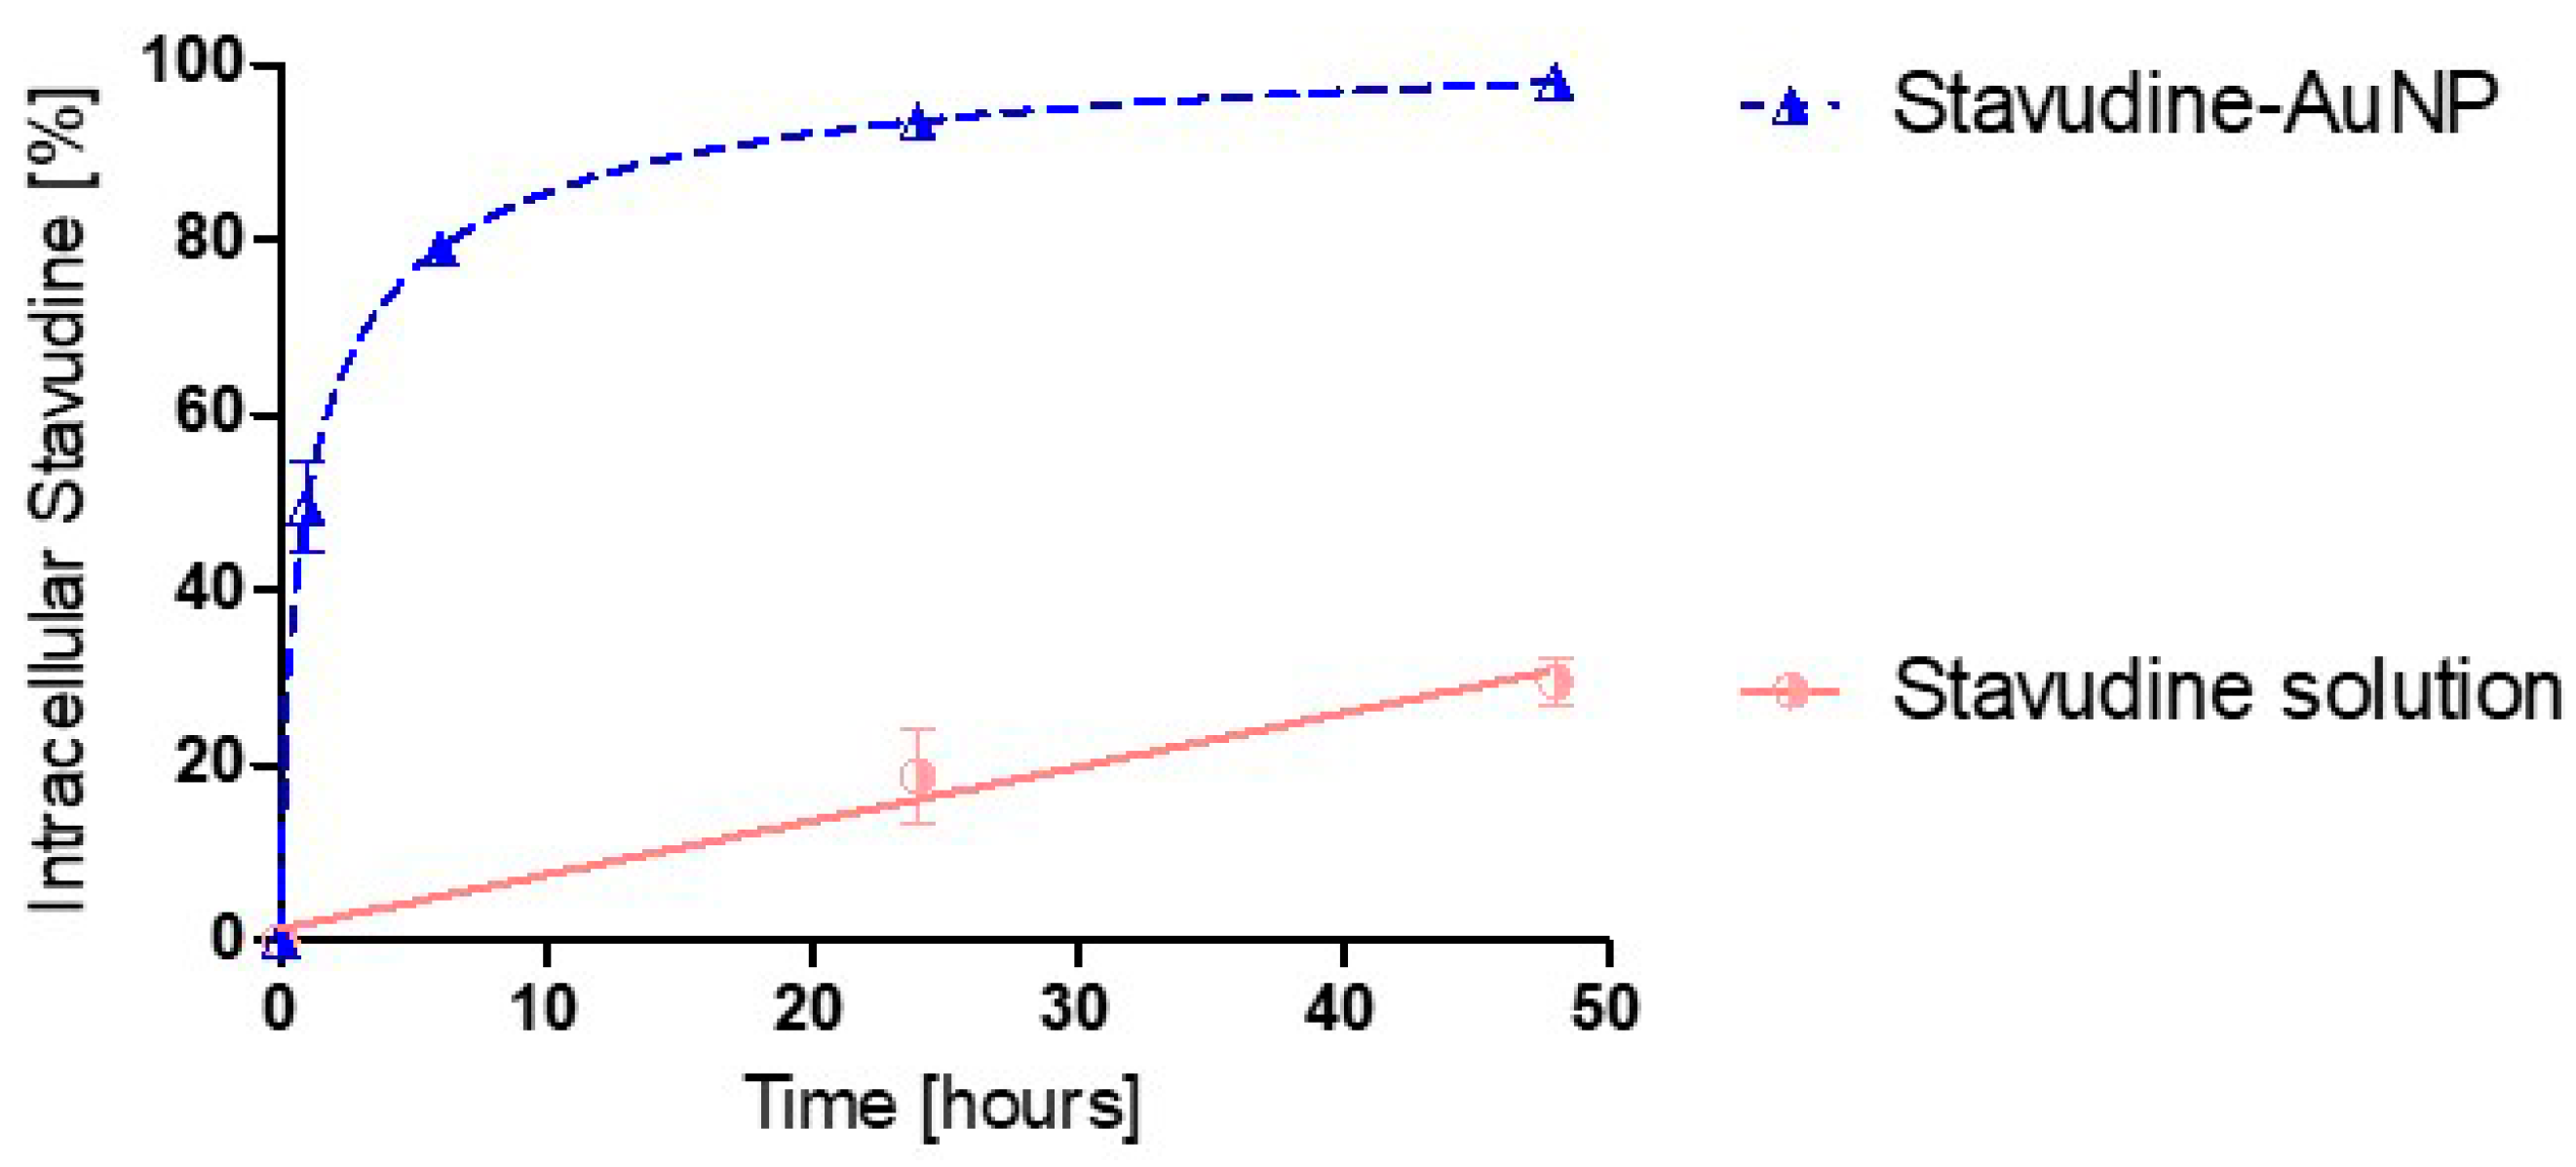
2.3. Uptake Kinetics in Cells
2.4. In Vivo Pharmacokinetic Study
2.5. Quantification of Stavudine by UHPLC Analysis
2.6. Kinetic Analysis
2.6.1. Model-Independent Analysis of In Vivo Study Results
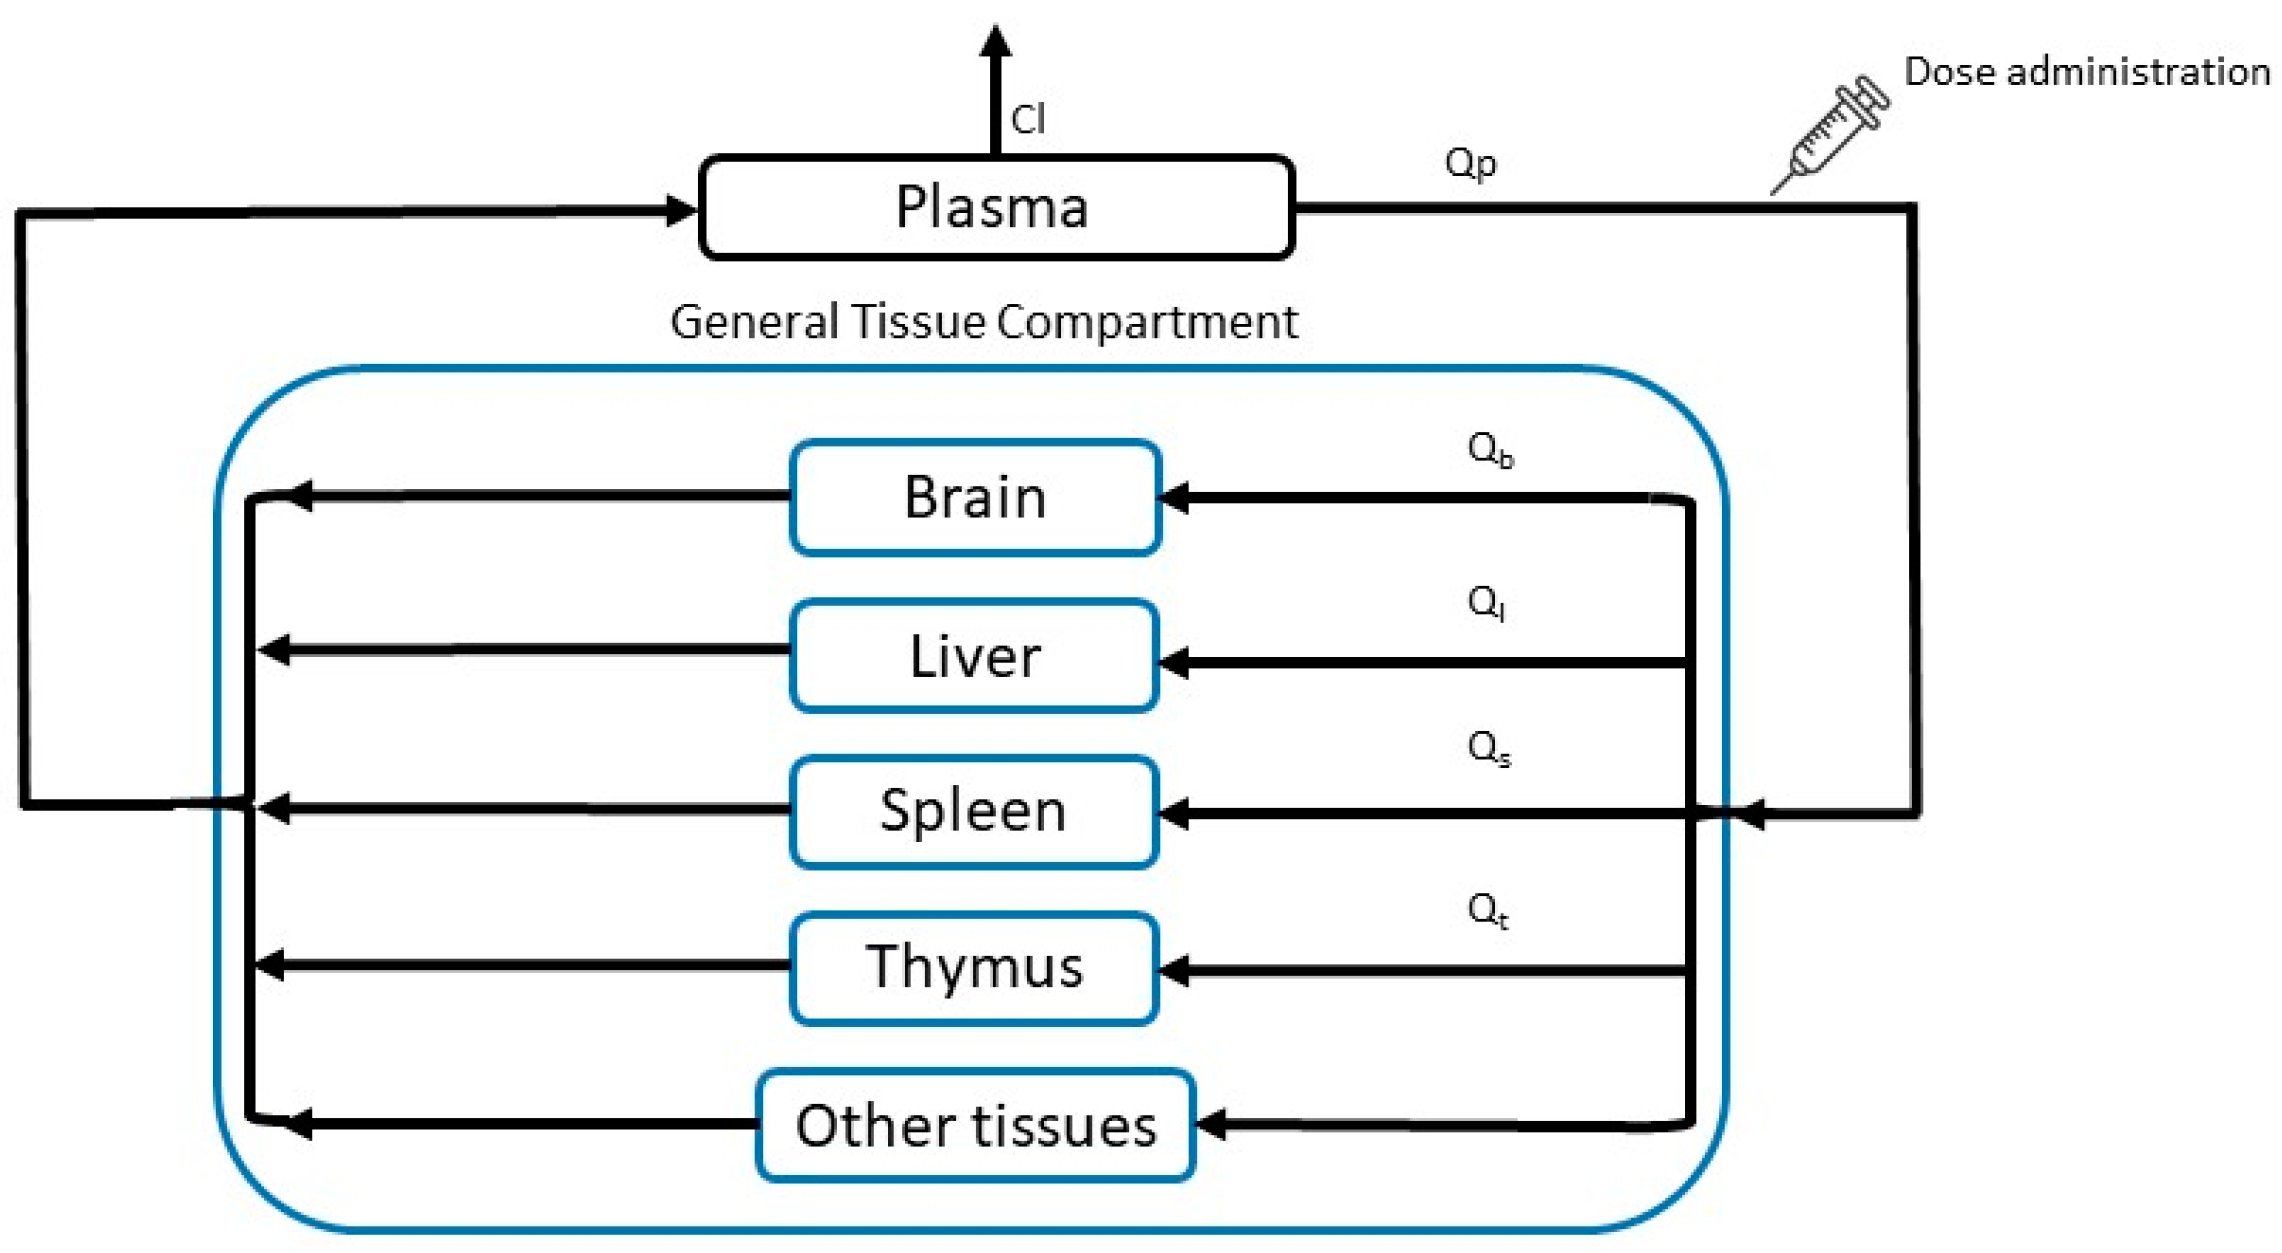
2.6.2. PBPK Model
- Model building
- Model Equations
- -
- Plasma
- -
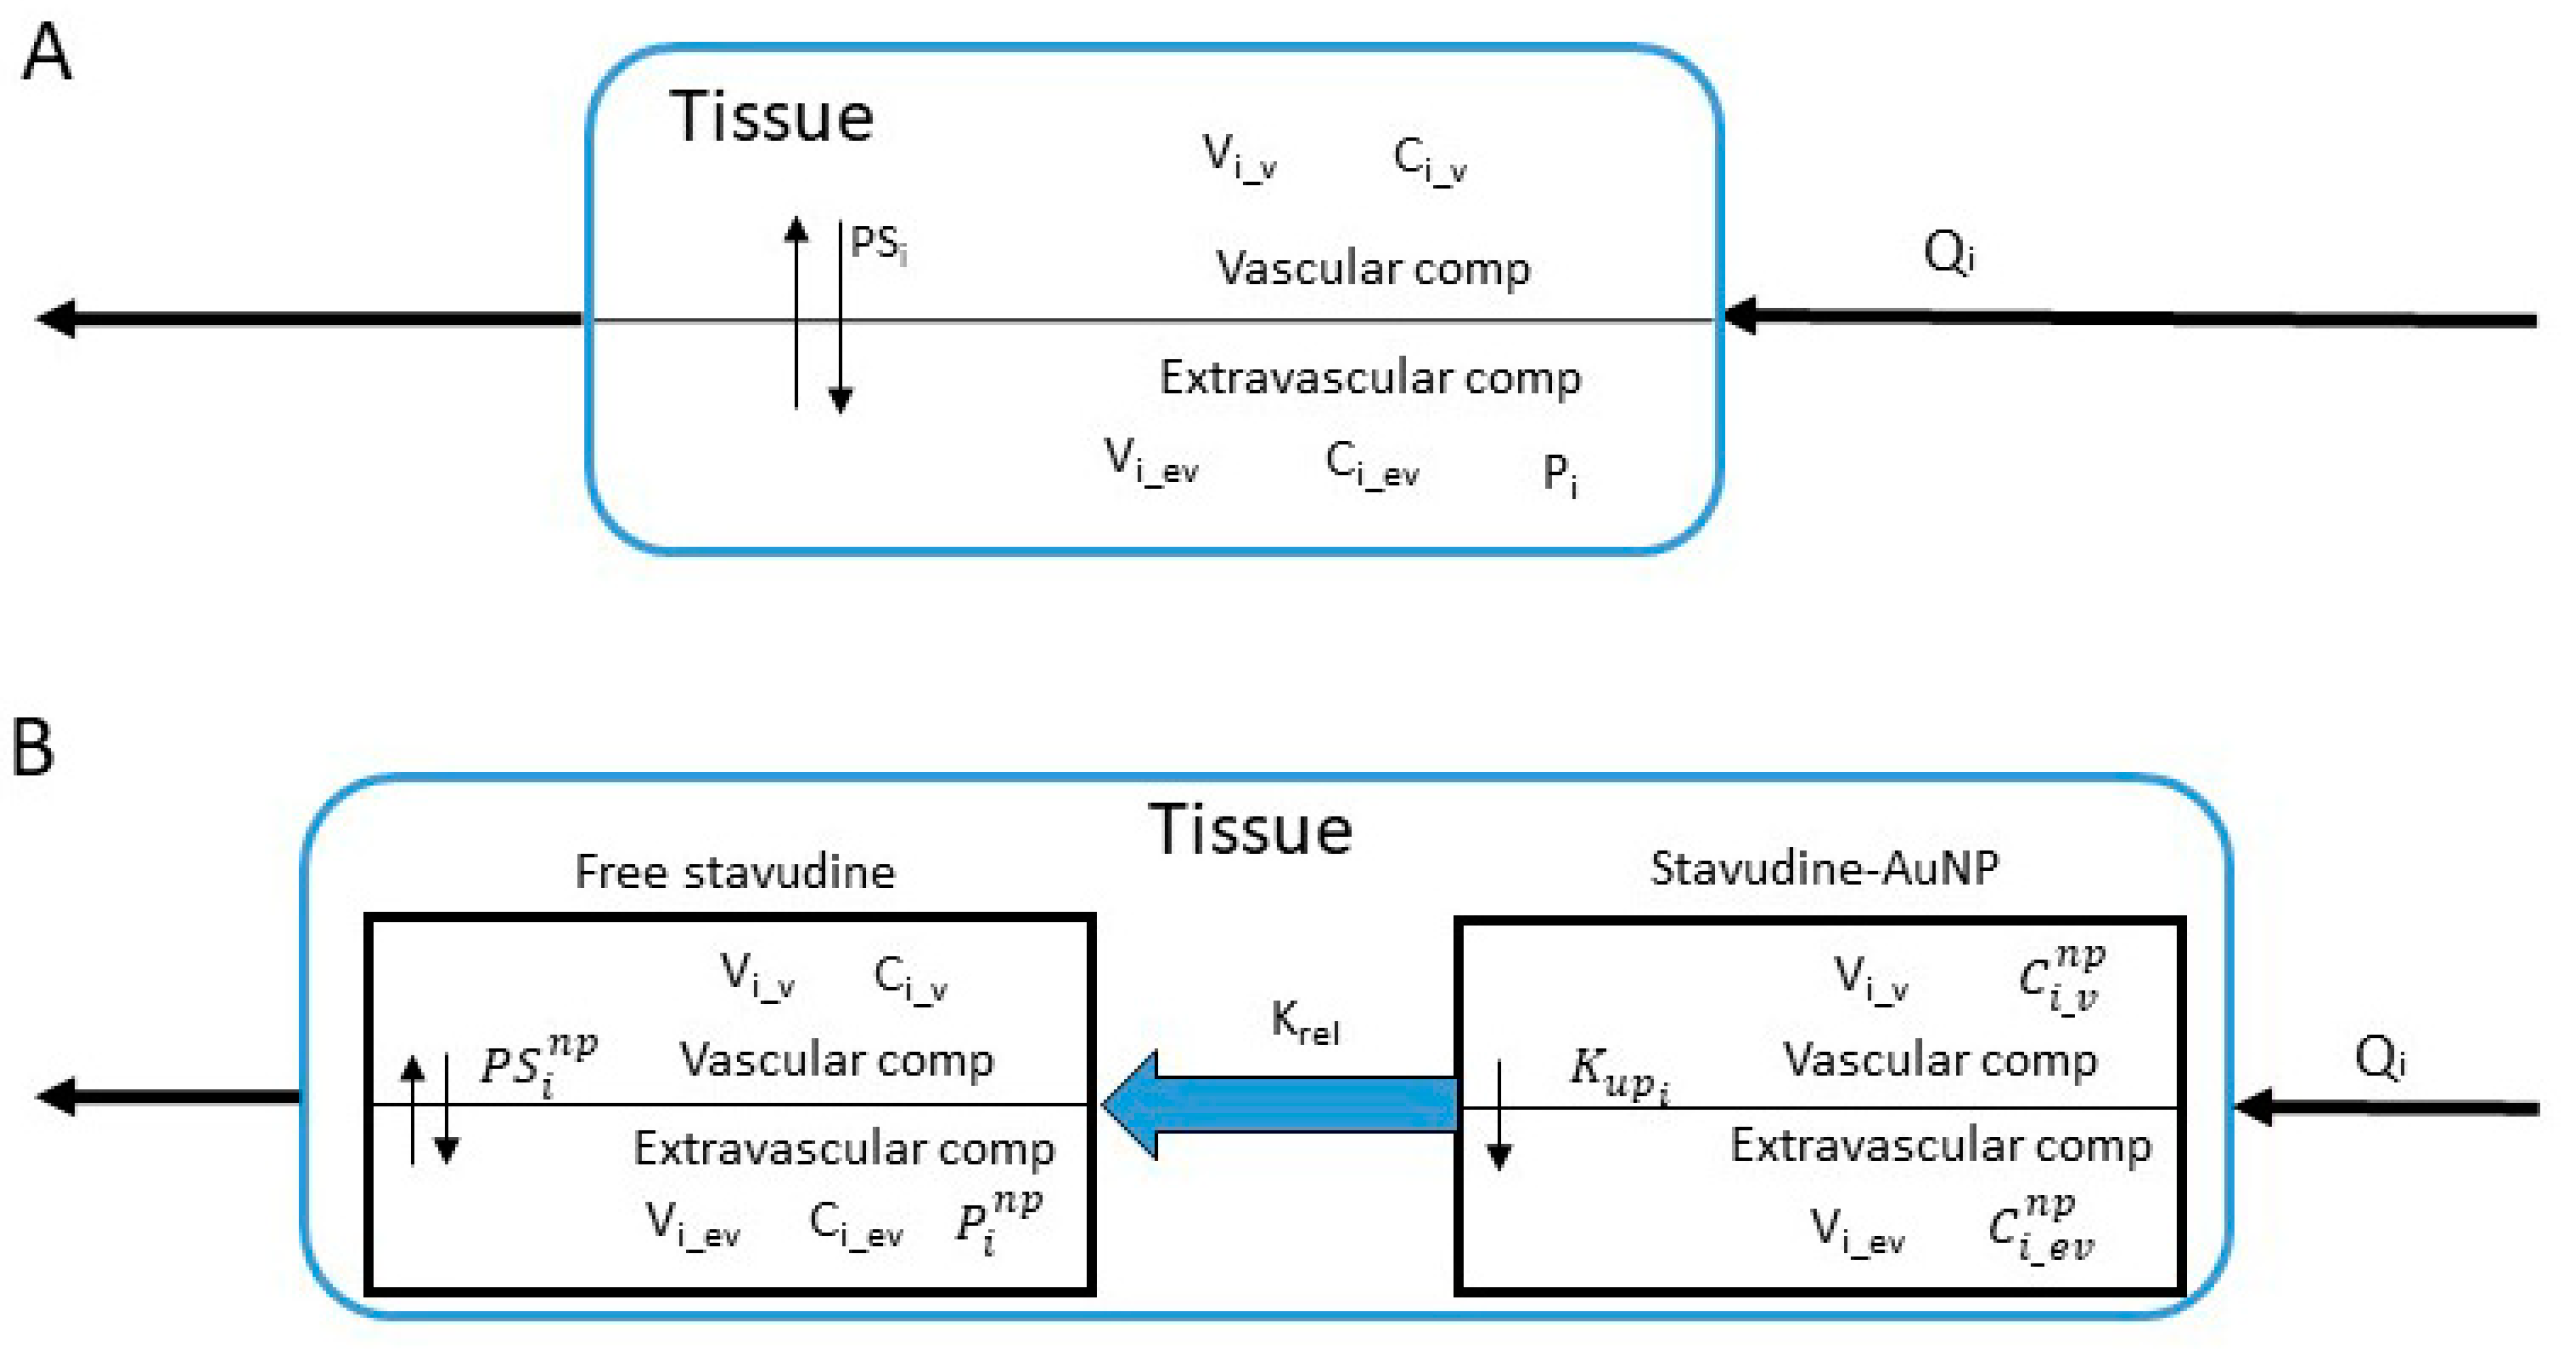
- General Tissue
- -
- Brain
- ○
- Vascular compartment
- ○
- Extravascular compartment
- -
- Liver
- ○
- Vascular compartment
- ○
- Extravascular compartment
- -
- Spleen
- ○
- Vascular compartment
- ○
- Extravascular compartment
- -
- Thymus
- ○
- Vascular compartment
- ○
- Extravascular compartmentwhere subindices and abbreviations mean: b, brain; gt, general tissue; l, liver; p, plasma; s, spleen; t, thymus; Ci_v and Ci_ev, stavudine vascular and extravascular concentration; Cl, clearance; Pi, partition coefficient of each tissue when drug is administered as solution; PSi permeability-surface area coefficient; Qi, blood flow of each tissue; Vi, compartment volume of each tissue; Vd, distribution volume.
- -
- Plasma
- ➢
- Stavudine-AuNP
- ➢
- Free stavudine
- -
- General Tissue
- ➢
- Stavudine-AuNP
- ➢
- Free stavudine
- -
- Brain
- ➢
- Stavudine-AuNP
- ○
- Vascular compartment
- ○
- Extravascular compartment
- ➢
- Free stavudine
- ○
- Vascular compartment
- ○
- Extravascular compartment
- -
- Liver
- ➢
- Stavudine-AuNP
- ○
- Vascular compartment
- ○
- Extravascular compartment
- ➢
- Free stavudine
- ○
- Vascular compartment
- ○
- Extravascular compartment
- -
- Spleen
- ➢
- Stavudine AuNP
- ○
- Vascular compartment
- ○
- Extravascular compartment
- ➢
- Free stavudine
- ○
- Vascular compartment
- ○
- Extravascular compartment
- -
- Thymus
- ➢
- Stavudine-AuNP
- ○
- Vascular compartment
- ○
- Extravascular compartment
- ➢
- Free stavudine
- ○
- Vascular compartment
- ○
- Extravascular compartmentwhere subindices and superindices mean: b, brain; gt, general tissue; l, liver; np, gold nanoparticles based delivery system; p, plasma; s, spleen; t, thymus; and abbreviations mean: stavudine-AuNP vascular and extravascular concentration; Ci_v and Ci_ev, stavudine vascular and extravascular concentration; Cl, clearance; Krel, AuNP release rate constant; Kup, AUNP uptake constant; , partition coefficient when drug is administered with nanoparticles; permeability-surface area coefficient when drug is administered with nanoparticles; Qi, blood flow; Vi, compartment volume; Vd, distribution volume.
- Model Parameters
- Model validation
2.7. Softwares
3. Results
3.1. Development and Characterization of Stavudine Gold Nanoparticles
3.2. Uptake Kinetics in Cells
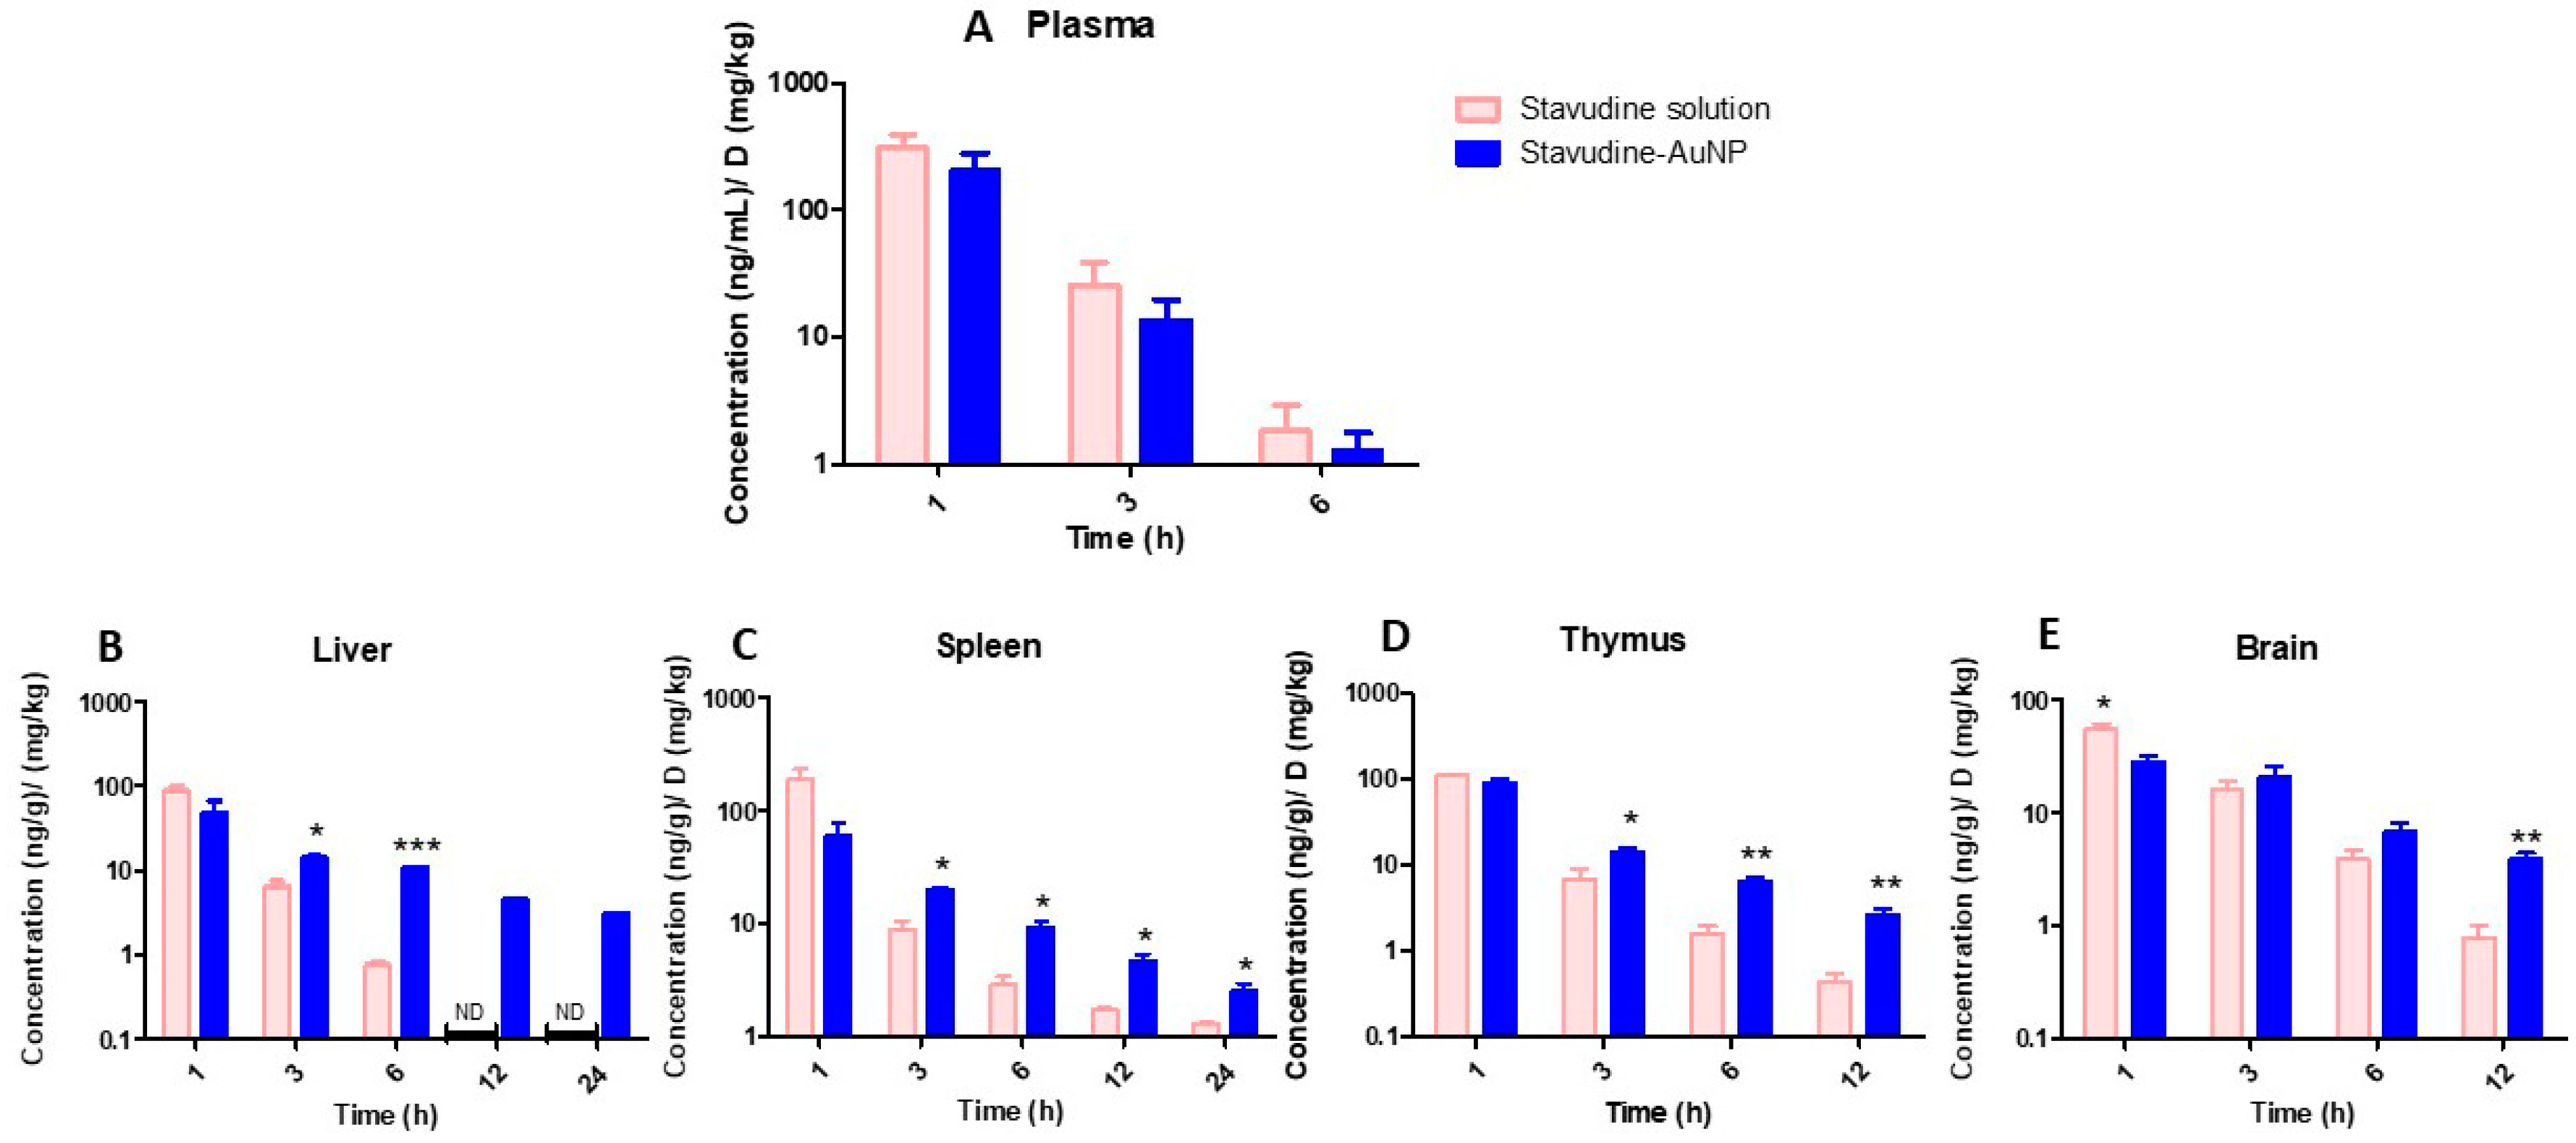
3.3. In Vivo Pharmacokinetic Study
3.4. Kinetic Analysis
3.4.1. Model-Independent Analysis of In Vivo Study Results
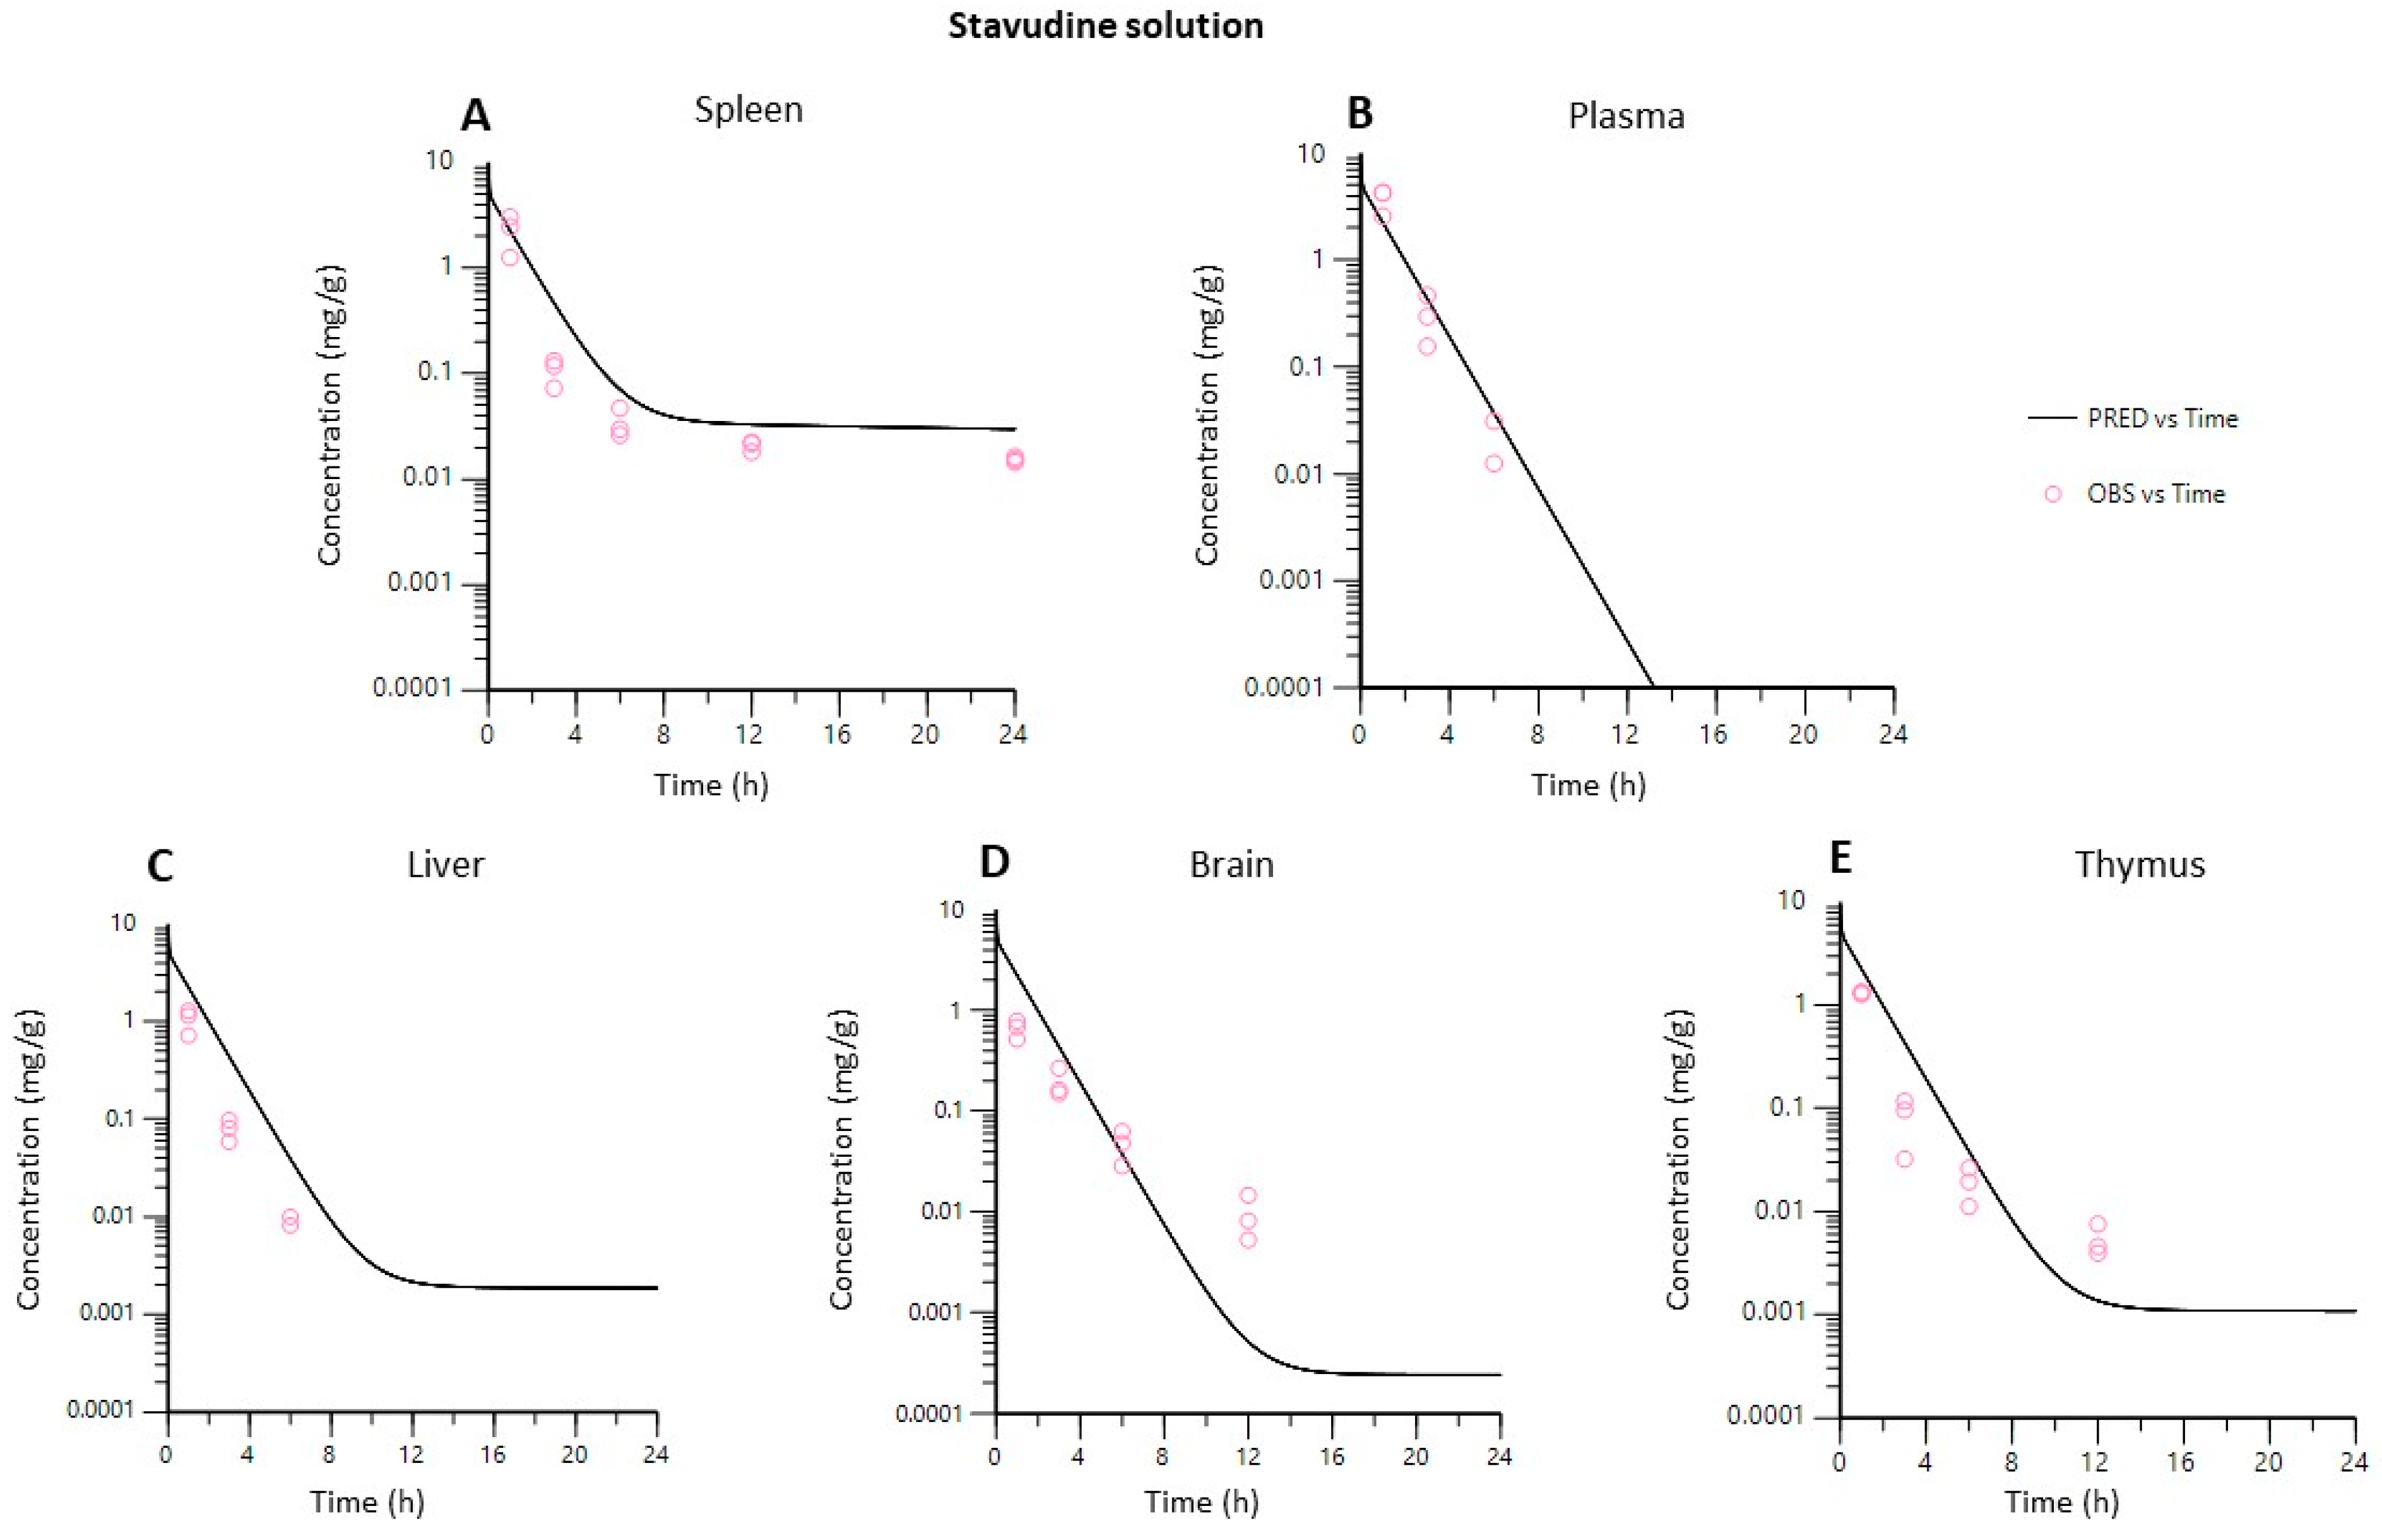
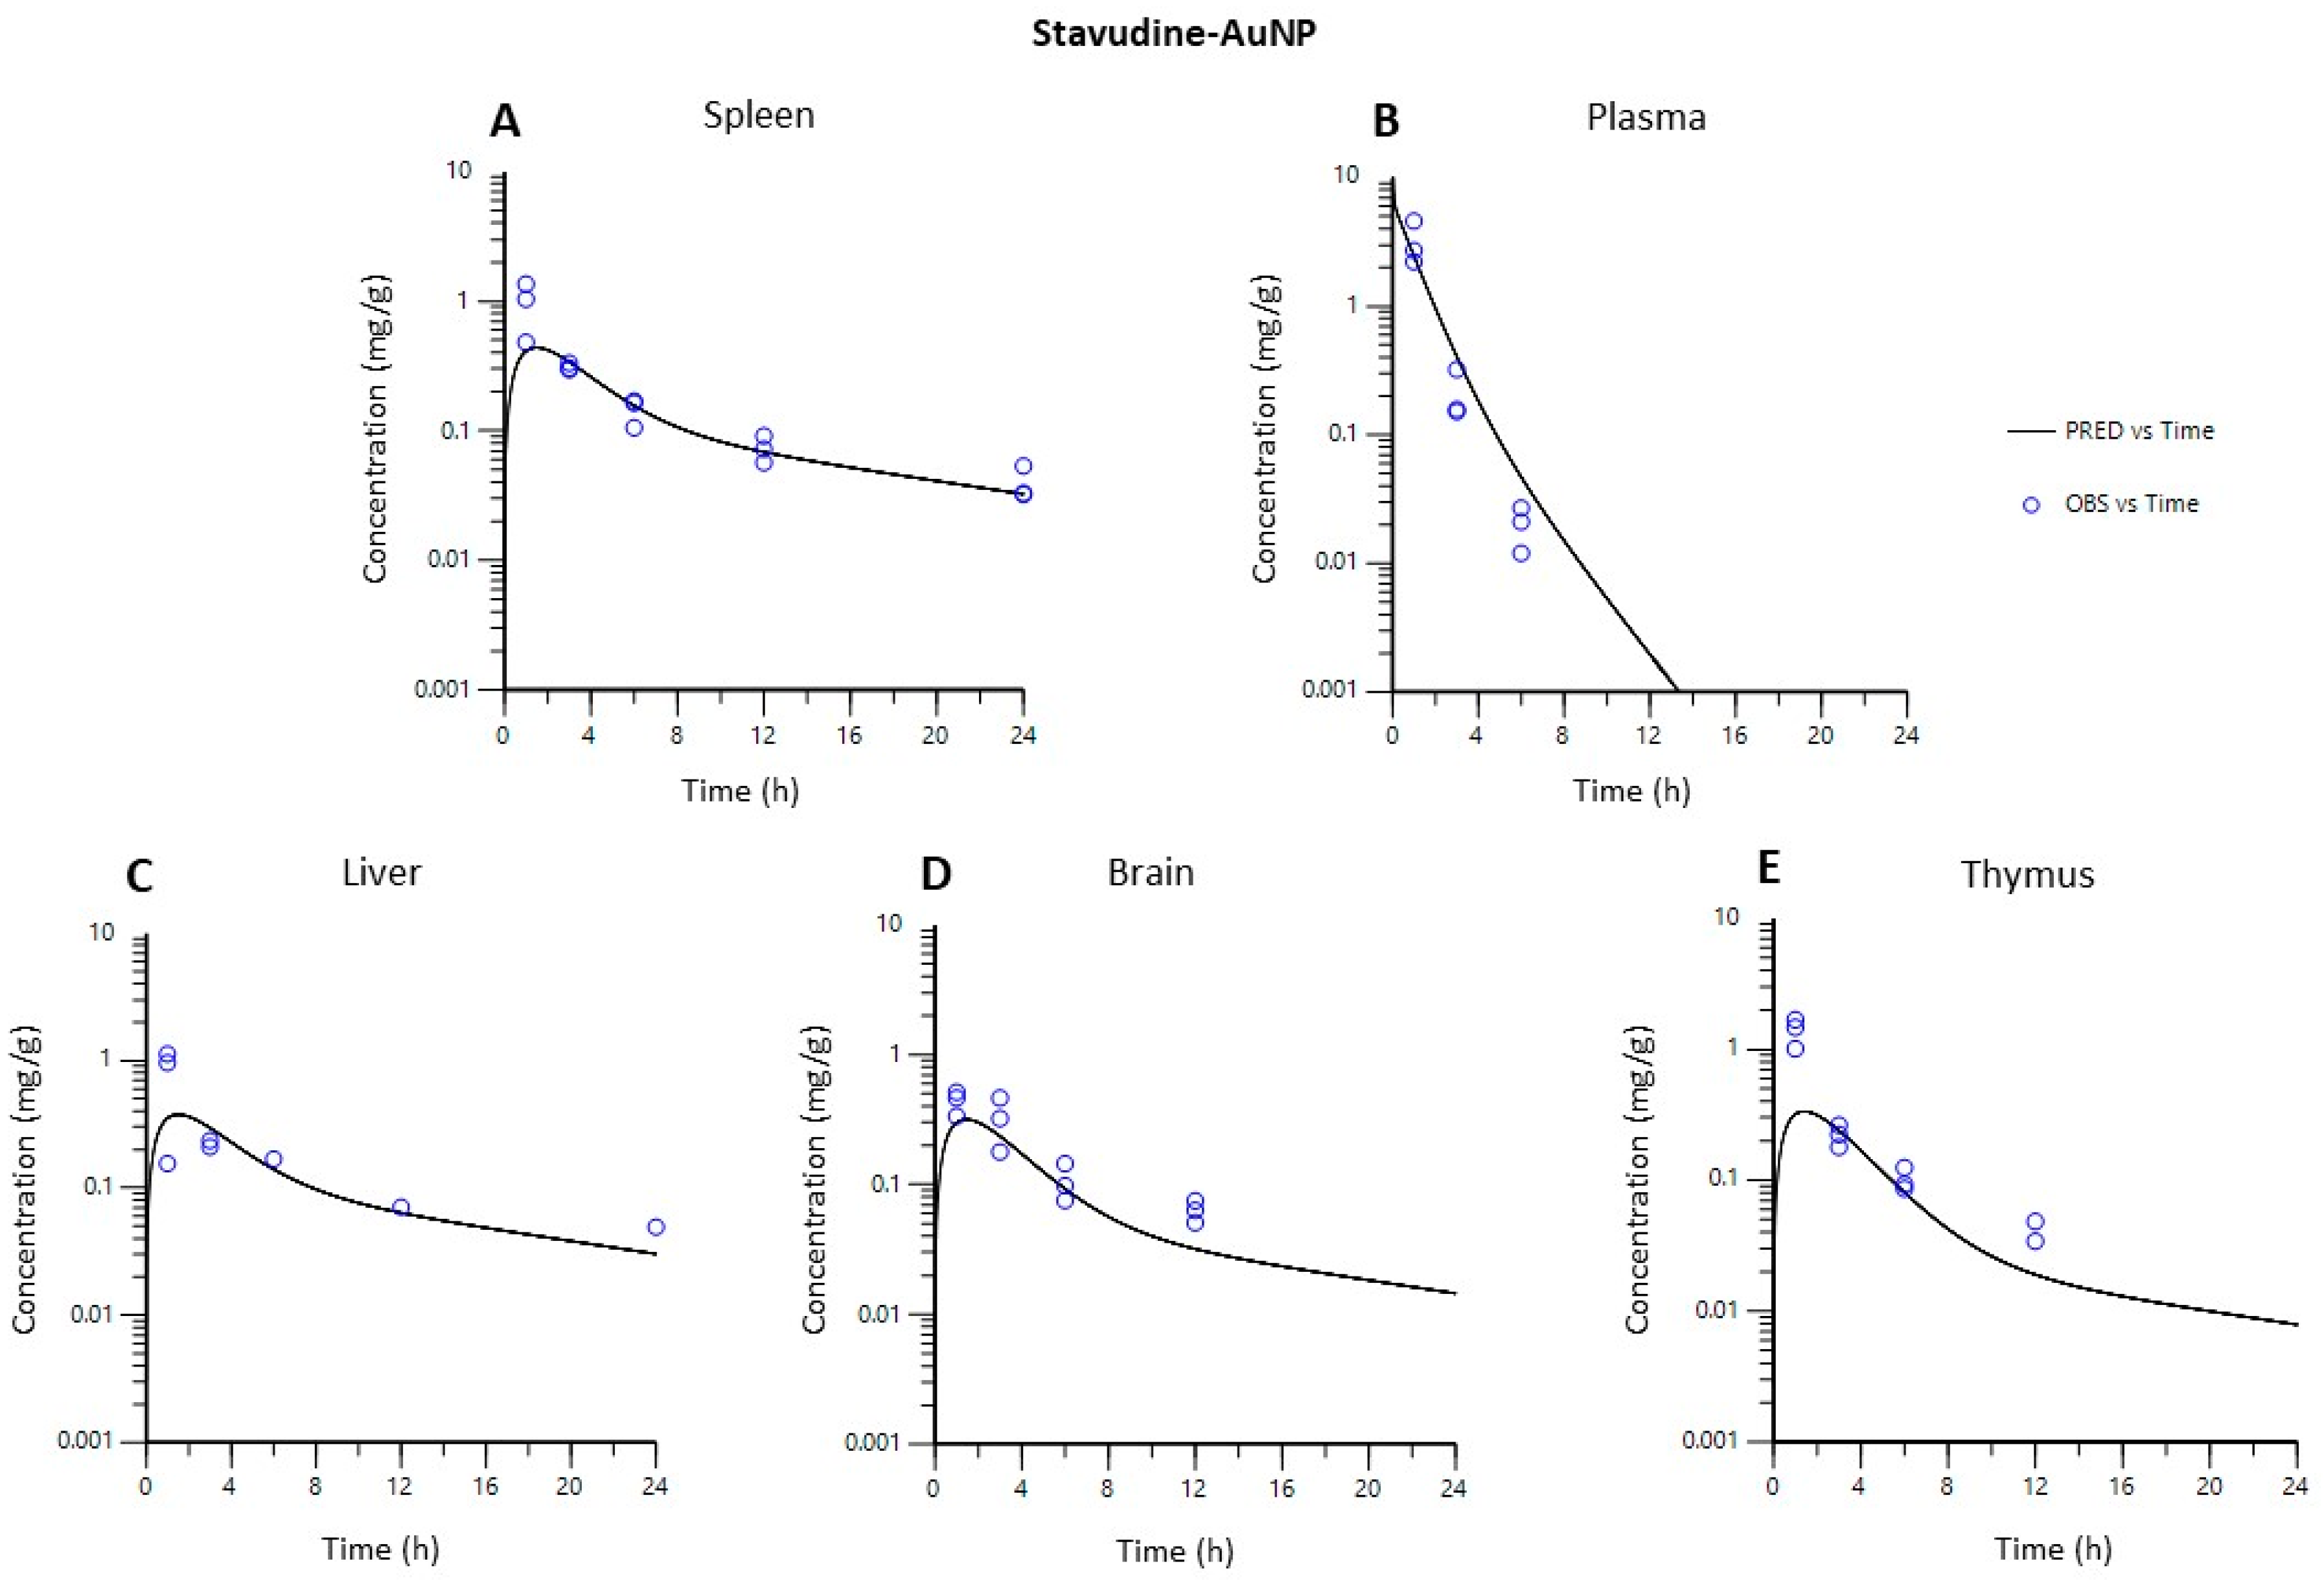
3.4.2. PBPK Model
4. Discussion
5. Conclusions
Author Contributions
Funding
Institutional Review Board Statement
Informed Consent Statement
Data Availability Statement
Conflicts of Interest
References
- Shamsi, M.; Mohammadi, A.; Manshadi, M.K.D.; Sanati-Nezhad, A. Mathematical and Computational Modeling of Nano-Engineered Drug Delivery Systems. J. Control. Release 2019, 307, 150–165. [Google Scholar] [CrossRef] [PubMed]
- Zazo, H.; Colino, C.I.; Lanao, J.M. Current Applications of Nanoparticles in Infectious Diseases. J. Control. Release 2016, 224, 86–102. [Google Scholar] [CrossRef] [PubMed]
- Moradi Kashkooli, F.; Soltani, M.; Souri, M.; Meaney, C.; Kohandel, M. Nexus between in Silico and in Vivo Models to Enhance Clinical Translation of Nanomedicine. Nano Today 2021, 36, 101057. [Google Scholar] [CrossRef]
- Tan, Y.-M.; Chan, M.; Chukwudebe, A.; Domoradzki, J.; Fisher, J.; Hack, C.E.; Hinderliter, P.; Hirasawa, K.; Leonard, J.; Lumen, A.; et al. PBPK Model Reporting Template for Chemical Risk Assessment Applications. Regul. Toxicol. Pharmacol. 2020, 115, 104691. [Google Scholar] [CrossRef] [PubMed]
- Glassman, P.M.; Balthasar, J.P. Physiologically-Based Modeling of Monoclonal Antibody Pharmacokinetics in Drug Discovery and Development. Drug Metab. Pharmacokinet. 2019, 34, 3–13. [Google Scholar] [CrossRef]
- Utembe, W.; Clewell, H.; Sanabria, N.; Doganis, P.; Gulumian, M. Current Approaches and Techniques in Physiologically Based Pharmacokinetic (PBPK) Modelling of Nanomaterials. Nanomaterials 2020, 10, 1267. [Google Scholar] [CrossRef]
- Li, M.; Zou, P.; Tyner, K.; Lee, S. Physiologically Based Pharmacokinetic (PBPK) Modeling of Pharmaceutical Nanoparticles. AAPS J. 2017, 19, 26–42. [Google Scholar] [CrossRef]
- Cao, S.; Woodrow, K.A. Nanotechnology Approaches to Eradicating HIV Reservoirs. Eur. J. Pharm. Biopharm. 2019, 138, 48–63. [Google Scholar] [CrossRef]
- Colino, C.I.; Lanao, J.M.; Gutierrez-Millan, C. Targeting of Hepatic Macrophages by Therapeutic Nanoparticles. Front. Immunol. 2020, 11, 218. [Google Scholar] [CrossRef] [Green Version]
- Martin, J.C.; Hitchcock, M.J.M.; De Clercq, E.; Prusoff, W.H. Early Nucleoside Reverse Transcriptase Inhibitors for the Treatment of HIV: A Brief History of Stavudine (D4T) and Its Comparison with Other Dideoxynucleosides. Antivir. Res. 2010, 85, 34–38. [Google Scholar] [CrossRef]
- Kuo, Y.-C.; Su, F.-L. Transport of Stavudine, Delavirdine, and Saquinavir across the Blood-Brain Barrier by Polybutylcyanoacrylate, Methylmethacrylate-Sulfopropylmethacrylate, and Solid Lipid Nanoparticles. Int. J. Pharm. 2007, 340, 143–152. [Google Scholar] [CrossRef] [PubMed]
- Basu, S.; Mukherjee, B.; Chowdhury, S.R.; Paul, P.; Choudhury, R.; Kumar, A.; Mondal, L.; Hossain, C.M.; Maji, R. Colloidal Gold-Loaded, Biodegradable, Polymer-Based Stavudine Nanoparticle Uptake by Macrophages: An In Vitro Study. Int. J. Nanomed. 2012, 7, 6049–6061. [Google Scholar] [CrossRef] [Green Version]
- Nayak, D.; Boxi, A.; Ashe, S.; Thathapudi, N.C.; Nayak, B. Stavudine Loaded Gelatin Liposomes for HIV Therapy: Preparation, Characterization and in Vitro Cytotoxic Evaluation. Mater. Sci. Eng. C Mater. Biol. Appl. 2017, 73, 406–416. [Google Scholar] [CrossRef] [PubMed]
- Chime, S.A.; Onunkwo, G.C.; Attama, A.A. Evaluation of the Properties of Encapsulated Stavudine Microparticulate Lipid-Based Drug Delivery System in Immunocompromised Wistar Rats. Curr. HIV Res. 2020, 18, 237–247. [Google Scholar] [CrossRef]
- Khlebtsov, N.; Dykman, L. Biodistribution and Toxicity of Engineered Gold Nanoparticles: A Review of in Vitro and in Vivo Studies. Chem. Soc. Rev. 2011, 40, 1647–1671. [Google Scholar] [CrossRef]
- Zazo, H.; Colino, C.I.; Warzecha, K.T.; Hoss, M.; Gbureck, U.; Trautwein, C.; Tacke, F.; Lanao, J.M.; Bartneck, M. Gold Nanocarriers for Macrophage-Targeted Therapy of Human Immunodeficiency Virus. Macromol. Biosci. 2017, 17, 1600359. [Google Scholar] [CrossRef]
- Briones, E. Optimización de Un Método de Cromatografía Liquida de Ultrapresión y Detección Por Espectrometría de Masas Para La Cuantificación de Fármacos Antirretrovirales Análogos Nucleosídicos En Estudios Farmacocinéticos. Estudio de la penetración de agentes antiinfecciosos en macrófagos utilizando eritrocitos portadores. Ph.D. Thesis, University of Salamanca, Salamanca, Spain, 2009. [Google Scholar]
- Weiss, M. On Pharmacokinetics in Target Tissues. Biopharm. Drug Dispos. 1985, 6, 57–66. [Google Scholar] [CrossRef]
- Al Shoyaib, A.; Archie, S.R.; Karamyan, V.T. Intraperitoneal Route of Drug Administration: Should It Be Used in Experimental Animal Studies? Pharm. Res. 2019, 37, 12. [Google Scholar] [CrossRef]
- Nestorov, I. Whole Body Pharmacokinetic Models. Clin. Pharmacokinet. 2003, 42, 883–908. [Google Scholar] [CrossRef]
- Espié, P.; Tytgat, D.; Sargentini-Maier, M.-L.; Poggesi, I.; Watelet, J.-B. Physiologically Based Pharmacokinetics (PBPK). Drug Metab. Rev. 2009, 41, 391–407. [Google Scholar] [CrossRef]
- Li, D.; Johanson, G.; Emond, C.; Carlander, U.; Philbert, M.; Jolliet, O. Physiologically Based Pharmacokinetic Modeling of Polyethylene Glycol-Coated Polyacrylamide Nanoparticles in Rats. Nanotoxicology 2014, 8 (Suppl. 1), 128–137. [Google Scholar] [CrossRef] [PubMed]
- Aborig, M.; Malik, P.R.V.; Nambiar, S.; Chelle, P.; Darko, J.; Mutsaers, A.; Edginton, A.N.; Fleck, A.; Osei, E.; Wettig, S. Biodistribution and Physiologically-Based Pharmacokinetic Modeling of Gold Nanoparticles in Mice with Interspecies Extrapolation. Pharmaceutics 2019, 11, 179. [Google Scholar] [CrossRef] [PubMed] [Green Version]
- Brown, R.P.; Delp, M.D.; Lindstedt, S.L.; Rhomberg, L.R.; Beliles, R.P. Physiological Parameter Values for Physiologically Based Pharmacokinetic Models. Toxicol. Ind. Health 1997, 13, 407–484. [Google Scholar] [CrossRef]
- Silva, A.L.L.; Cristofoletti, R.; Storpirtis, S.; Sousa, V.D.; Junginger, H.E.; Shah, V.P.; Stavchansky, S.; Dressman, J.B.; Barends, D.M. Biowaiver Monographs for Immediate-Release Solid Oral Dosage Forms: Stavudine. J. Pharm. Sci. 2012, 101, 10–16. [Google Scholar] [CrossRef] [PubMed]
- Puttrevu, S.K.; Arora, S.; Polak, S.; Patel, N.K. Physiologically Based Pharmacokinetic Modeling of Transdermal Selegiline and Its Metabolites for the Evaluation of Disposition Differences between Healthy and Special Populations. Pharmaceutics 2020, 12, 942. [Google Scholar] [CrossRef] [PubMed]
- Wang, W.; Ye, Z.; Gao, H.; Ouyang, D. Computational Pharmaceutics—A New Paradigm of Drug Delivery. J. Control. Release 2021, 338, 119–136. [Google Scholar] [CrossRef]
- Sy, S.K.B.; Malmberg, R.; Matsushima, A.; Asin-Prieto, E.; Rosenkranz, B.; Cotton, M.F.; Derendorf, H.; Innes, S. Effect of Reducing the Paediatric Stavudine Dose by Half: A Physiologically-Based Pharmacokinetic Model. Int. J. Antimicrob. Agents 2015, 45, 413–419. [Google Scholar] [CrossRef] [Green Version]
- Dreaden, E.C.; Austin, L.A.; Mackey, M.A.; El-Sayed, M.A. Size Matters: Gold Nanoparticles in Targeted Cancer Drug Delivery. Ther. Deliv. 2012, 3, 457–478. [Google Scholar] [CrossRef] [Green Version]
- Bawa, P.; Pillay, V.; Choonara, Y.E.; Toit, L.C. du Stimuli-Responsive Polymers and Their Applications in Drug Delivery. Biomed. Mater. 2009, 4, 022001. [Google Scholar] [CrossRef]
- Zhang, X.-D.; Wu, D.; Shen, X.; Liu, P.-X.; Yang, N.; Zhao, B.; Zhang, H.; Sun, Y.-M.; Zhang, L.-A.; Fan, F.-Y. Size-Dependent in Vivo Toxicity of PEG-Coated Gold Nanoparticles. Int. J. Nanomed. 2011, 6, 2071–2081. [Google Scholar] [CrossRef] [Green Version]
- Dalvi, B.R.; Siddiqui, E.A.; Syed, A.S.; Velhal, S.M.; Ahmad, A.; Bandivdekar, A.B.; Devarajan, P.V. Nevirapine Loaded Core Shell Gold Nanoparticles by Double Emulsion Solvent Evaporation: In Vitro and in Vivo Evaluation. Curr. Drug Deliv. 2016, 13, 1071–1083. [Google Scholar] [CrossRef] [PubMed]
- Ghosh, S.; Mondal, L.; Chakraborty, S.; Mukherjee, B. Early Stage HIV Management and Reduction of Stavudine-Induced Hepatotoxicity in Rats by Experimentally Developed Biodegradable Nanoparticles. AAPS PharmSciTech 2016, 18, 697–709. [Google Scholar] [CrossRef] [PubMed]
- Mishra, V.; Mahor, S.; Rawat, A.; Gupta, P.N.; Dubey, P.; Khatri, K.; Vyas, S.P. Targeted Brain Delivery of AZT via Transferrin Anchored Pegylated Albumin Nanoparticles. J. Drug Target. 2006, 14, 45–53. [Google Scholar] [CrossRef] [PubMed]
- Kagan, L.; Gershkovich, P.; Wasan, K.M.; Mager, D.E. Dual Physiologically Based Pharmacokinetic Model of Liposomal and Nonliposomal Amphotericin B Disposition. Pharm. Res. 2014, 31, 35–45. [Google Scholar] [CrossRef] [PubMed]
- Maharaj, A.R.; Wu, H.; Hornik, C.P.; Arrieta, A.; James, L.; Bhatt-Mehta, V.; Bradley, J.; Muller, W.J.; Al-Uzri, A.; Downes, K.J.; et al. Use of Normalized Prediction Distribution Errors for Assessing Population Physiologically-Based Pharmacokinetic Model Adequacy. J. Pharmacokinet. Pharmacodyn. 2020, 47, 199–218. [Google Scholar] [CrossRef]
- Oh, N.; Park, J.-H. Surface Chemistry of Gold Nanoparticles Mediates Their Exocytosis in Macrophages. ACS Nano 2014, 8, 6232–6241. [Google Scholar] [CrossRef]


| Tissue | Group | Flow (L/h) | V (L) | PS (L/h) | Kup (h−1) | P |
|---|---|---|---|---|---|---|
| Plasma | Stavudine solution | 3.09 | - | - | - | - |
| Stavudine-AuNP | - | - | 0.56 | - | ||
| Brain | Stavudine solution | 0.08 | 1.5 × 10⁻³ | 3.75 × 10⁻⁷ | - | 0.36 |
| Stavudine-AuNP | 0.17 | 7.9 × 10⁻³ | 0.46 | |||
| Liver | Stavudine solution | 0.60 | 1.2 × 10⁻² | 2.65 × 10⁻⁶ | - | 0.27 |
| Stavudine-AuNP | 14.4 | 0.15 | 0.55 | |||
| Spleen | Stavudine solution | 0.18 | 7.0 × 10⁻⁴ | 7.50 × 10⁻⁶ | - | 0.70 |
| Stavudine-AuNP | 0.49 | 0.03 | 0.77 | |||
| Thymus | Stavudine solution | 0.02 | 5.0 × 10⁻⁴ | 9.62 × 10⁻⁸ | - | 0.28 |
| Stavudine-AuNP | 0.10 | 1.00 × 10⁻³ | 0.61 |
| Tissue | Group | 1 | MRT (h) | t1/2 (h) |
|---|---|---|---|---|
| Plasma | Stavudine solution | 535 | 1.28 | 0.68 |
| Stavudine-AuNP | 342 | 1.25 | 0.70 | |
| Thymus | Stavudine solution | 193 | 1.51 | 1.54 |
| Stavudine-AuNP | 209 | 2.69 | 2.15 | |
| Brain | Stavudine solution | 146 | 2.54 | 1.84 |
| Stavudine-AuNP | 159 | 5.77 | 3.81 | |
| Spleen | Stavudine solution | 352 | 2.98 | 4.34 |
| Stavudine-AuNP | 263 | 7.80 | 5.75 | |
| Liver | Stavudine solution | 151 | 1.28 | 0.74 |
| Stavudine-AuNP | 189 | 5.67 | 4.50 |
| Indices | Plasma | Brain | Liver | Spleen | Thymus |
|---|---|---|---|---|---|
| AFE | 1.61 | 0.71 | 0.81 | 0.85 | 0.57 |
| AAFE | 1.89 | 1.53 | 1.68 | 1.32 | 1.88 |
Publisher’s Note: MDPI stays neutral with regard to jurisdictional claims in published maps and institutional affiliations. |
© 2022 by the authors. Licensee MDPI, Basel, Switzerland. This article is an open access article distributed under the terms and conditions of the Creative Commons Attribution (CC BY) license (https://creativecommons.org/licenses/by/4.0/).
Share and Cite
Zazo, H.; Colino, C.I.; Gutiérrez-Millán, C.; Cordero, A.A.; Bartneck, M.; Lanao, J.M. Physiologically Based Pharmacokinetic (PBPK) Model of Gold Nanoparticle-Based Drug Delivery System for Stavudine Biodistribution. Pharmaceutics 2022, 14, 406. https://doi.org/10.3390/pharmaceutics14020406
Zazo H, Colino CI, Gutiérrez-Millán C, Cordero AA, Bartneck M, Lanao JM. Physiologically Based Pharmacokinetic (PBPK) Model of Gold Nanoparticle-Based Drug Delivery System for Stavudine Biodistribution. Pharmaceutics. 2022; 14(2):406. https://doi.org/10.3390/pharmaceutics14020406
Chicago/Turabian StyleZazo, Hinojal, Clara I. Colino, Carmen Gutiérrez-Millán, Andres A. Cordero, Matthias Bartneck, and José M. Lanao. 2022. "Physiologically Based Pharmacokinetic (PBPK) Model of Gold Nanoparticle-Based Drug Delivery System for Stavudine Biodistribution" Pharmaceutics 14, no. 2: 406. https://doi.org/10.3390/pharmaceutics14020406