
Rare-Earth-Metal (Nd3+, Ce3+ and Gd3+)-Doped CaF2: Nanoparticles for Multimodal Imaging in Biomedical Applications
 ,
,  , , , , and
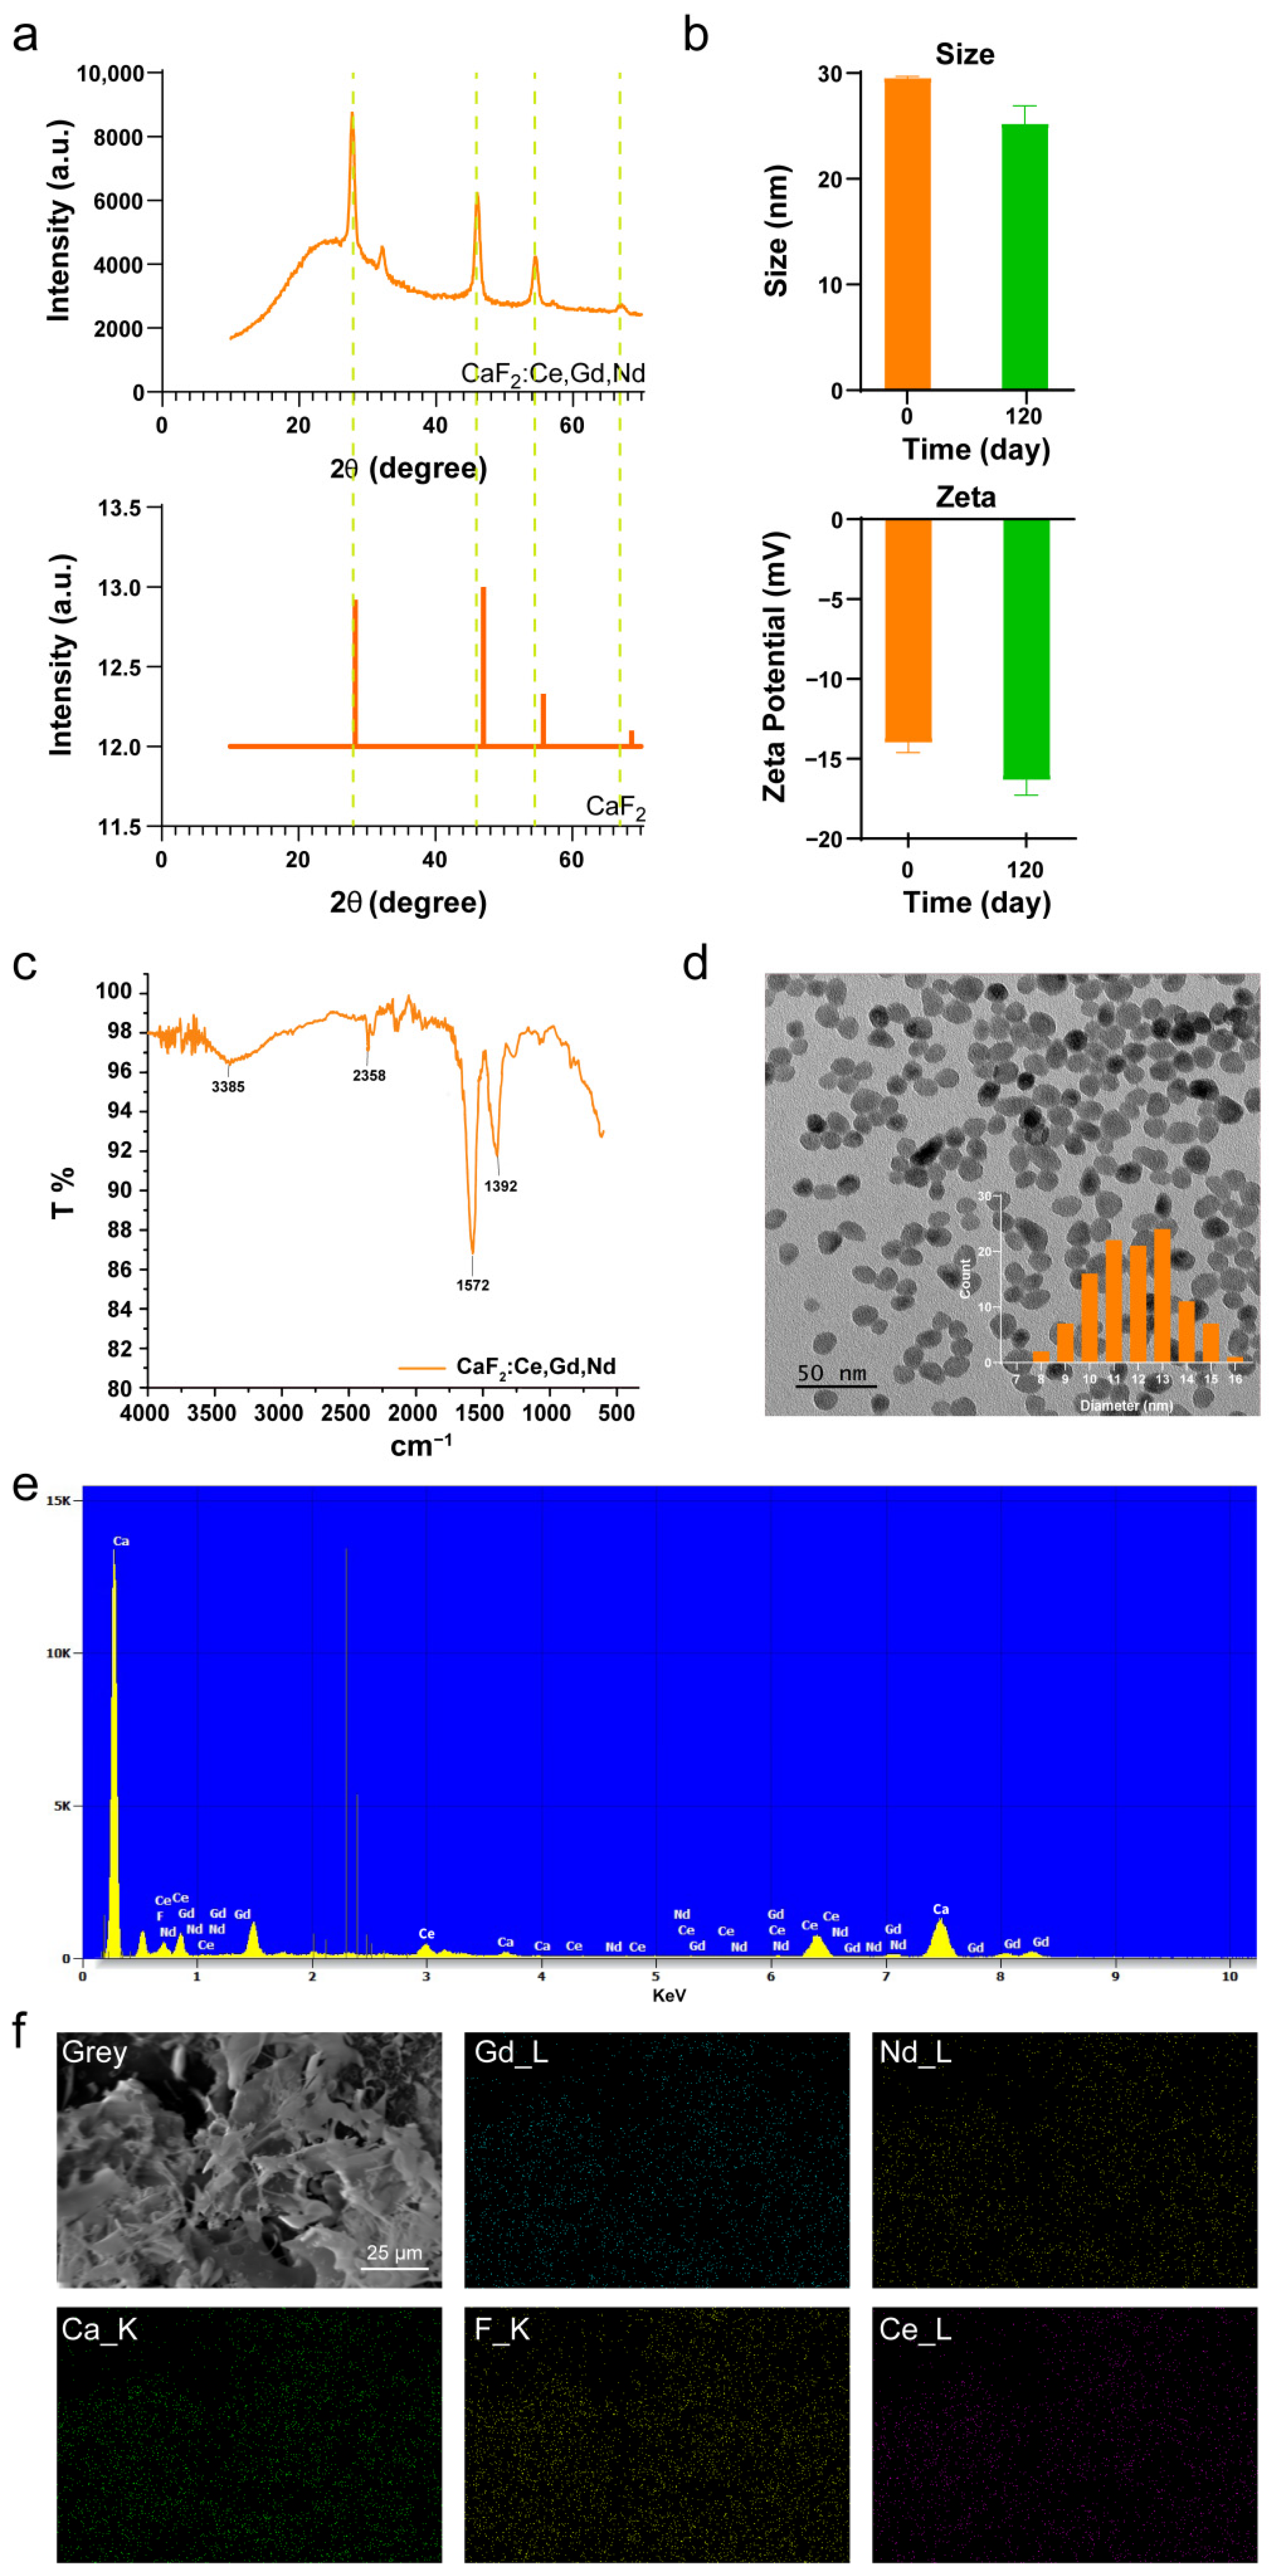
Abstract
:1. Introduction
2. Materials and Methods
2.1. Materials
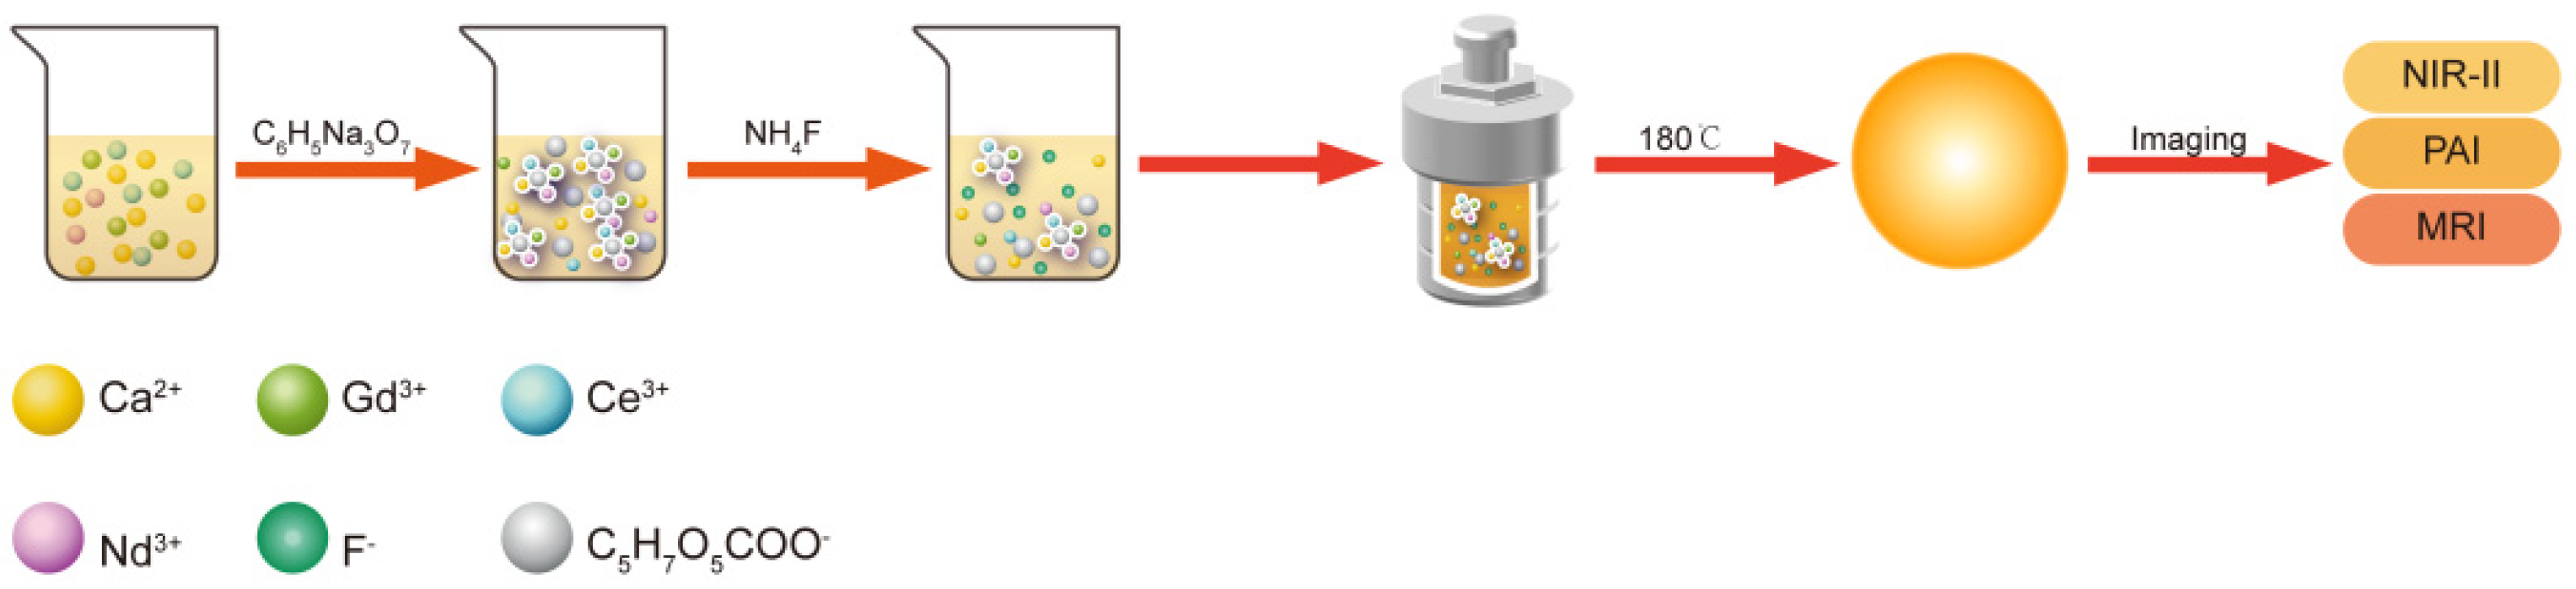
2.2. Synthesis of the CaF2: Ce, Gd, Nd NPs
2.3. Characterization
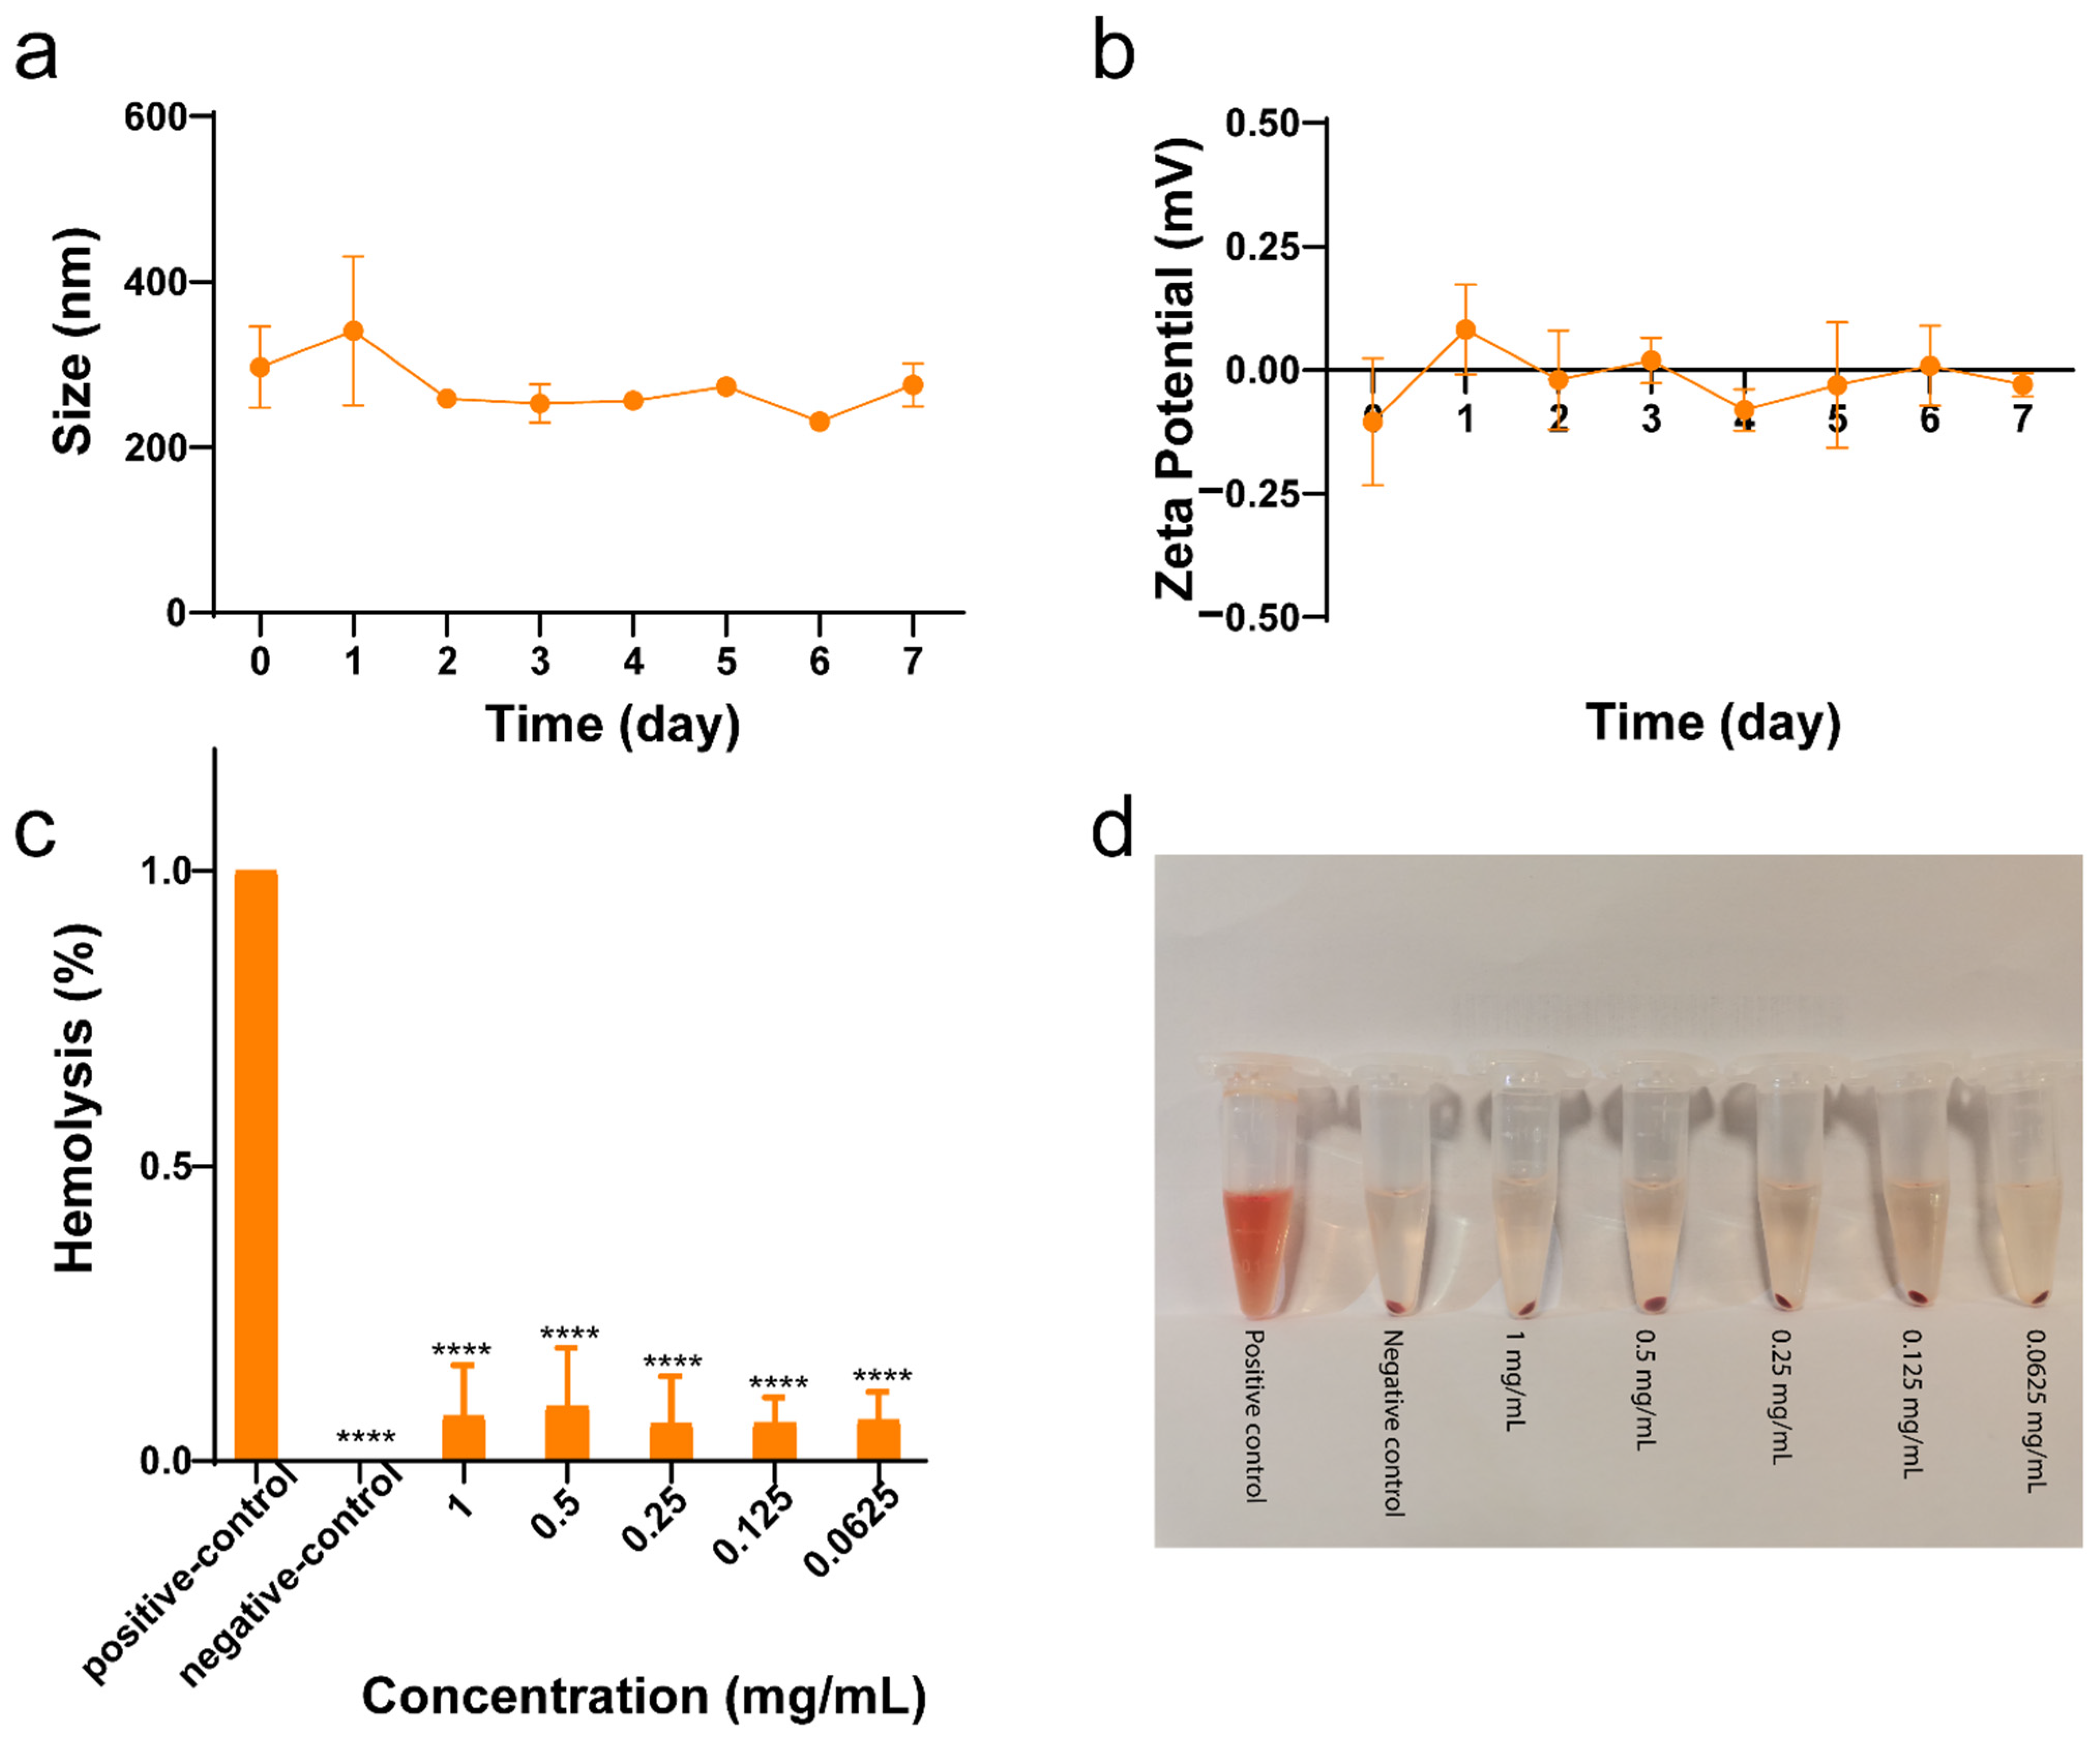
2.4. Stability of CaF2:Ce, Gd, Nd NPs
2.5. Hemolysis of CaF2: Ce, Gd, Nd NPs
2.6. MTS Cytotoxicity Assay of CaF2: Ce, Gd, Nd NPs
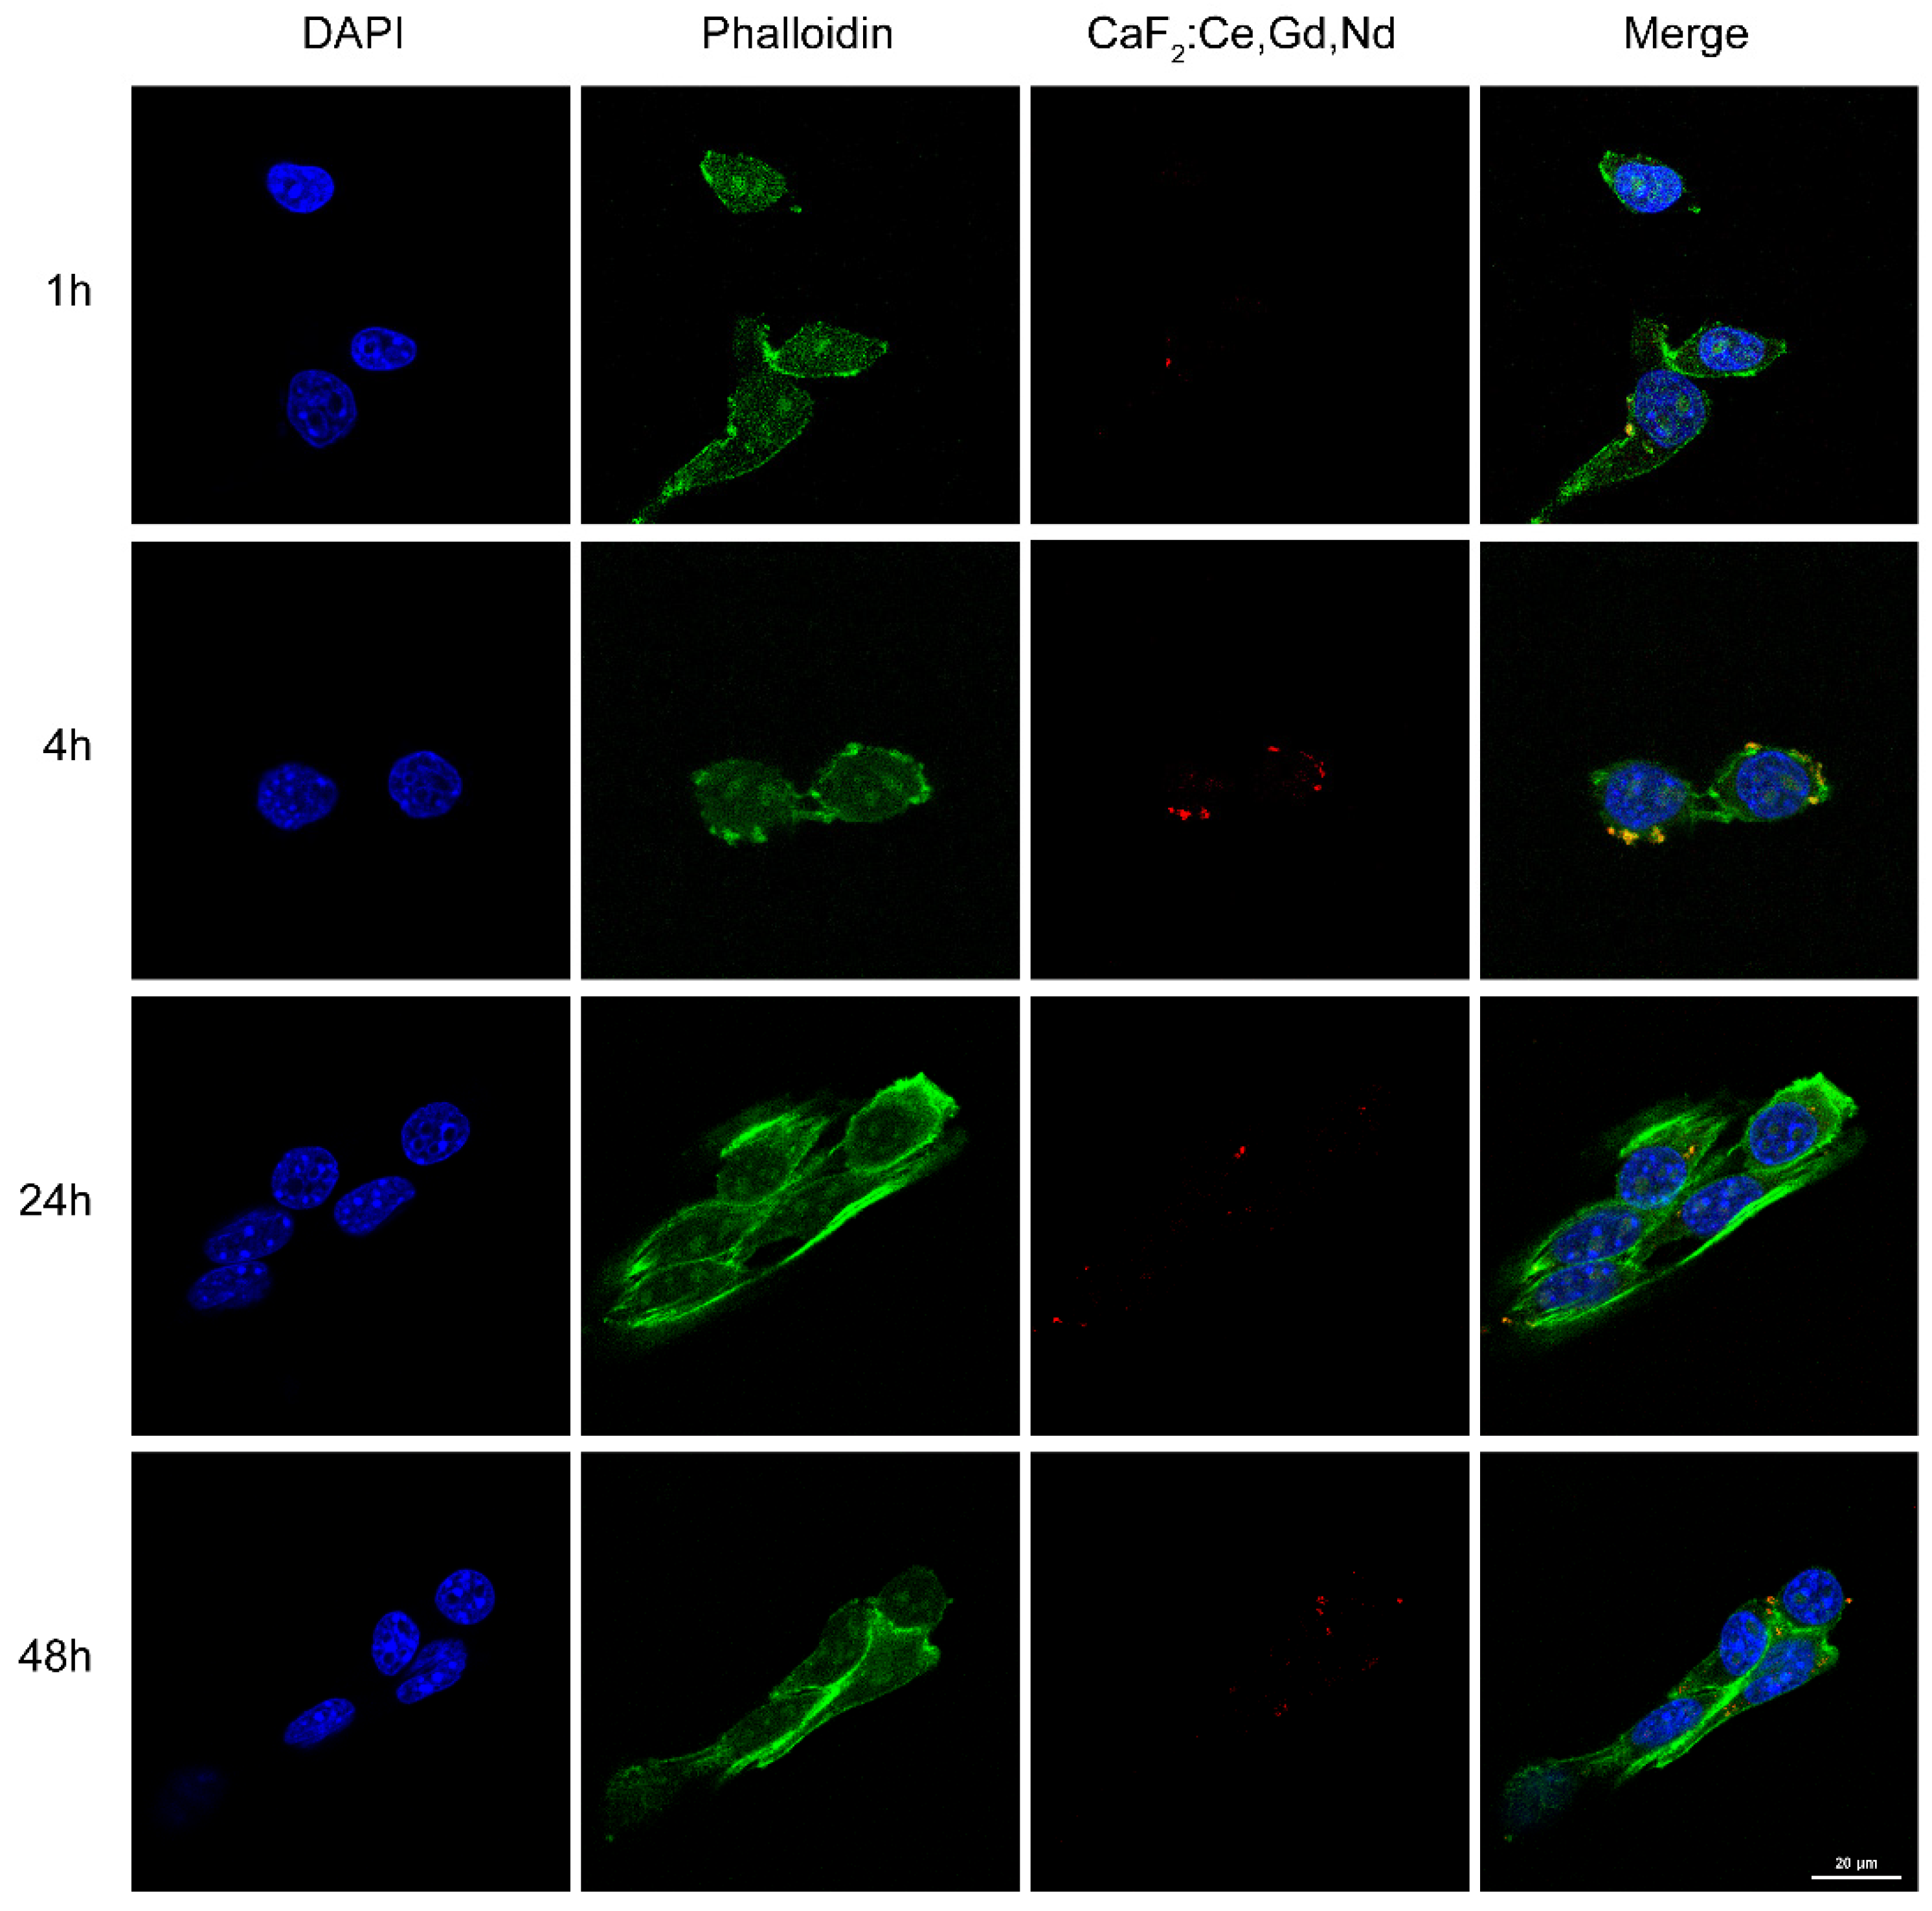
2.7. Uptake of CaF2: Ce, Gd, Nd NPs
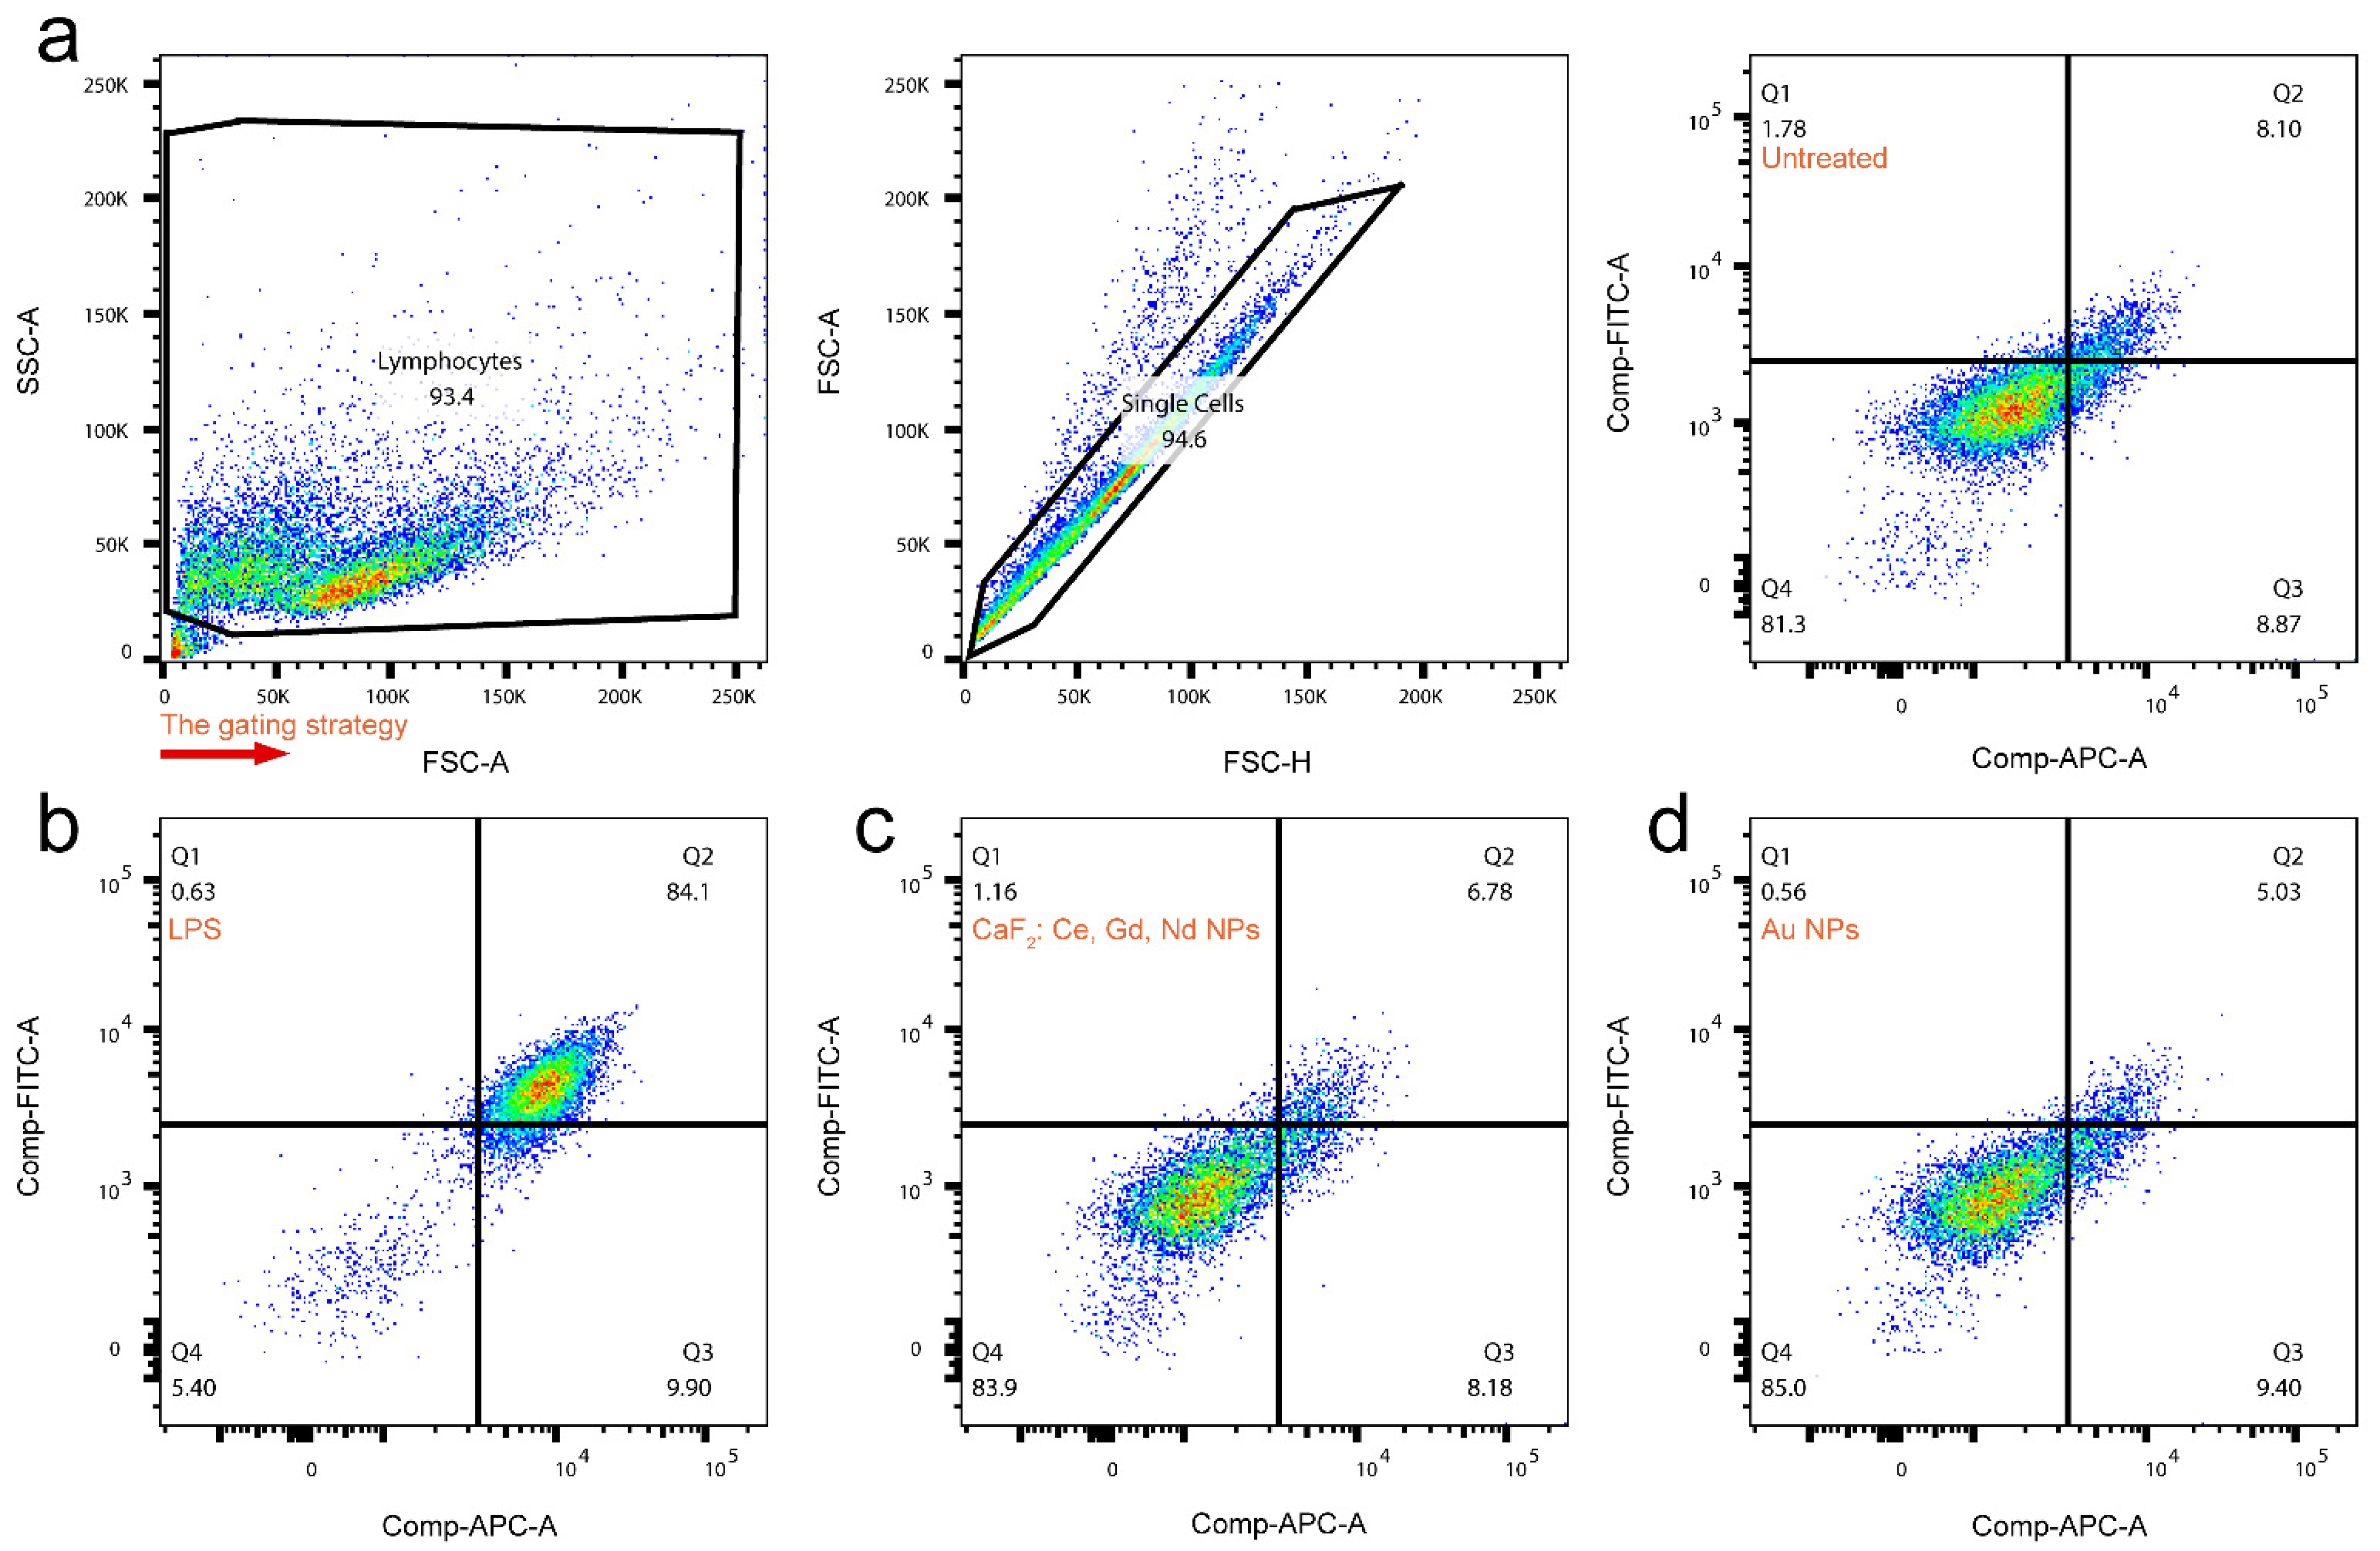
2.8. In Vitro Dendritic Cell (DC) Activation Study
2.9. Multimodal Imaging Properties of CaF2: Ce, Gd, Nd NPs
2.9.1. NIR-II imaging
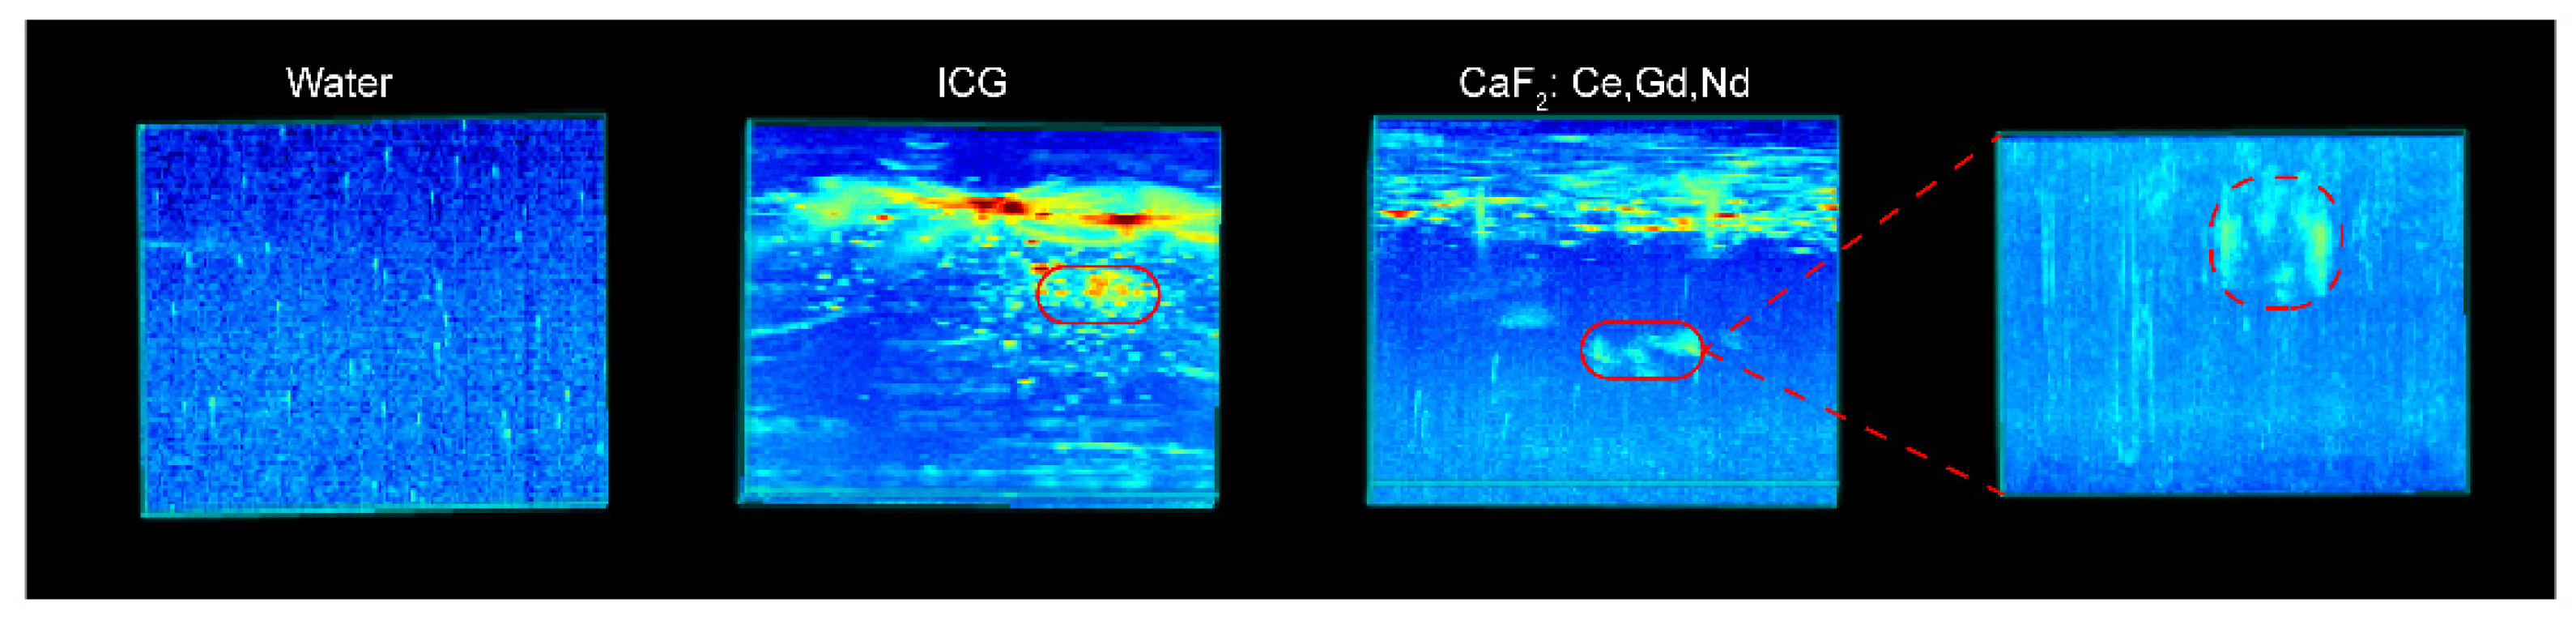
2.9.2. Photoacoustic Imaging
2.9.3. MRI Studies
2.10. Statistical Analysis
3. Results and Discussion
4. Conclusions
Supplementary Materials
Author Contributions
Funding
Institutional Review Board Statement
Informed Consent Statement
Data Availability Statement
Acknowledgments
Conflicts of Interest
References
- Yamabe, Y.; Kuroki, Y.; Ishikawa, T.; Miyakawa, K.; Kuroki, S.; Sekiguchi, R. Tumor Staging of Advanced Esophageal Cancer: Combination of Double-Contrast Esophagography and Contrast-Enhanced CT. Am. J. Roentgenol. 2008, 191, 753–757. [Google Scholar] [CrossRef] [PubMed]
- Lind, P.; Kresnik, E.; Kumnig, G.; Gallowitsch, H.-J.; Igerc, I.; Matschnig, S.; Gomez, I. 18F-FDG-PET in the Follow-up of Thyroid Cancer. Acta Med. Austriaca 2003, 30, 17–21. [Google Scholar] [CrossRef] [PubMed]
- Yun, M.; Kim, W.; Alnafisi, N.; Lacorte, L.; Jang, S.; Alavi, A. 18F-FDG PET in Characterizing Adrenal Lesions Detected on CT or MRI. J. Nucl. Med. 2001, 42, 1795–1799. [Google Scholar] [PubMed]
- Blend, M.J.; Rohany, M.; Jones-Martinez, N.; De Leon, O.A. Case Study of Tc-99m HMPAO Brain SPECT Imaging in a Patient with Hepatic Encephalopathy and Carotid Artery Stenosis. Clin. Nucl. Med. 2010, 35, 317–320. [Google Scholar] [CrossRef]
- Rocchi, G.; Kasprzak, J.D.; Galema, T.W.; de Jong, N.; Ten Cate, F.J. Usefulness of power Doppler contrast echocardiography to identify reperfusion after acute myocardial infarction. Am. J. Cardiol. 2001, 87, 278–282. [Google Scholar] [CrossRef]
- Gambhir, S.S. Molecular imaging of cancer with positron emission tomography. Nat. Rev. Cancer 2002, 2, 683–693. [Google Scholar] [CrossRef]
- Ziegler, S.I. Positron emission tomography: Principles, technology, and recent developments. Nucl. Phys. A 2005, 752, 679–687. [Google Scholar] [CrossRef]
- Mahmoudi, M.; Serpooshan, V.; Laurent, S. Engineered nanoparticles for biomolecular imaging. Nanoscale 2011, 3, 3007–3026. [Google Scholar] [CrossRef]
- Beekman, F.J.; McElroy, D.P.; Berger, F.; Gambhir, S.S.; Hoffman, E.J.; Cherry, S.R. Towards in vivo nuclear microscopy: Iodine-125 imaging in mice using micro-pinholes. Eur. J. Nucl. Med. Mol. Imaging 2002, 29, 933–938. [Google Scholar] [CrossRef]
- Chatziioannou, A.; Tai, Y.C.; Doshi, N.; Cherry, S.R. Detector development for microPET II: A 1 μl resolution PET scanner for small animal imaging. Phys. Med. Biol. 2001, 46, 2899–2910. [Google Scholar] [CrossRef]
- Weissleder, R. A clearer vision for in vivo imaging. Nat. Biotechnol. 2001, 19, 316–317. [Google Scholar] [CrossRef]
- Li, X.; Wang, J.; An, Z.; Yang, M.; Baranov, E.; Jiang, P.; Sun, F.; Moossa, A.R.; Hoffman, R.M. Optically imageable metastatic model of human breast cancer. Clin. Exp. Metastasis 2002, 19, 347–350. [Google Scholar] [CrossRef] [PubMed]
- Hilderbrand, S.A.; Kelly, K.A.; Weissleder, R.; Tung, C.-H. Monofunctional Near-Infrared Fluorochromes for Imaging Applications. Bioconj. Chem. 2005, 16, 1275–1281. [Google Scholar] [CrossRef] [PubMed]
- Wunder, A.; Schellenberger, E.; Mahmood, U.; Bogdanov, A.; Müller-Ladner, U.; Weissleder, R.; Josephson, L. Methotrexate-Induced Accumulation of Fluorescent Annexin V in Collagen-Induced Arthritis. Mol. Imaging 2005, 4, 15353500200504142. [Google Scholar] [CrossRef] [PubMed]
- Arap, W.; Pasqualini, R.; Montalti, M.; Petrizza, L.; Prodi, L.; Rampazzo, E.; Zaccheroni, N.; Marchiò, S. Luminescent silica nanoparticles for cancer diagnosis. Curr. Med. Chem. 2013, 20, 2195–2211. [Google Scholar] [CrossRef] [PubMed]
- Zoetelief, H. Physics for diagnostic radiology, third edition. Radiat. Prot. Dosim. 2013, 154, 526–529. [Google Scholar] [CrossRef]
- Lee, N.; Choi, S.H.; Hyeon, T. Nano-Sized CT Contrast Agents. Adv. Mater. 2013, 25, 2641–2660. [Google Scholar] [CrossRef]
- Debbage, P.; Jaschke, W. Molecular imaging with nanoparticles: Giant roles for dwarf actors. Histochem. Cell Biol. 2008, 130, 845–875. [Google Scholar] [CrossRef]
- Gallo, J.; Long, N.J.; Aboagye, E.O. Magnetic nanoparticles as contrast agents in the diagnosis and treatment of cancer. Chem. Soc. Rev. 2013, 42, 7816–7833. [Google Scholar] [CrossRef]
- Kasban, H.; El-Bendary, M.; Salama, D. A comparative study of medical imaging techniques. Int. J. Inf. Sci. Intell. Syst. 2015, 4, 37–58. [Google Scholar]
- DH, T. Foster FS. In vivo ultrasound biomicroscopy in devel—Opmental biology. Trends Biotechnol. 2002, 20, S29–S33. [Google Scholar]
- Kiessling, F.; Fokong, S.; Bzyl, J.; Lederle, W.; Palmowski, M.; Lammers, T. Recent advances in molecular, multimodal and theranostic ultrasound imaging. Adv. Drug Deliv. Rev. 2014, 72, 15–27. [Google Scholar] [CrossRef] [PubMed]
- Zackrisson, S.; van de Ven, S.M.W.Y.; Gambhir, S.S. Light In and Sound Out: Emerging Translational Strategies for Photoacoustic Imaging. Cancer Res. 2014, 74, 979–1004. [Google Scholar] [CrossRef] [PubMed]
- Eliseeva, S.V.; Bünzli, J.-C.G. Lanthanide luminescence for functional materials and bio-sciences. Chem. Soc. Rev. 2010, 39, 189–227. [Google Scholar] [CrossRef]
- Dong, H.; Du, S.-R.; Zheng, X.-Y.; Lyu, G.-M.; Sun, L.-D.; Li, L.-D.; Zhang, P.-Z.; Zhang, C.; Yan, C.-H. Lanthanide Nanoparticles: From Design toward Bioimaging and Therapy. Chem. Rev. 2015, 115, 10725–10815. [Google Scholar] [CrossRef] [PubMed]
- Yu, Z.; Eich, C.; Cruz, L.J. Recent Advances in Rare-Earth-Doped Nanoparticles for NIR-II Imaging and Cancer Theranostics. Front. Chem. 2020, 8. [Google Scholar] [CrossRef] [PubMed]
- Bünzli, J.-C.G.; Piguet, C. Taking advantage of luminescent lanthanide ions. Chem. Soc. Rev. 2005, 34, 1048–1077. [Google Scholar] [CrossRef] [PubMed]
- Pokhrel, M.; Mimun, L.C.; Yust, B.; Kumar, G.A.; Dhanale, A.; Tang, L.; Sardar, D.K. Stokes emission in GdF3:Nd3+ nanoparticles for bioimaging probes. Nanoscale 2014, 6, 1667–1674. [Google Scholar] [CrossRef]
- Qin, Q.-S.; Zhang, P.-Z.; Sun, L.-D.; Shi, S.; Chen, N.-X.; Dong, H.; Zheng, X.-Y.; Li, L.-M.; Yan, C.-H. Ultralow-power near-infrared excited neodymium-doped nanoparticles for long-term in vivo bioimaging. Nanoscale 2017, 9, 4660–4664. [Google Scholar] [CrossRef]
- Wang, Y.-F.; Liu, G.-Y.; Sun, L.-D.; Xiao, J.-W.; Zhou, J.-C.; Yan, C.-H. Nd3+-Sensitized Upconversion Nanophosphors: Efficient In Vivo Bioimaging Probes with Minimized Heating Effect. ACS Nano 2013, 7, 7200–7206. [Google Scholar] [CrossRef]
- Cao, C.; Liu, Q.; Shi, M.; Feng, W.; Li, F. Lanthanide-Doped Nanoparticles with Upconversion and Downshifting Near-Infrared Luminescence for Bioimaging. Inorg. Chem. 2019, 58, 9351–9357. [Google Scholar] [CrossRef]
- Tiwari, S.P.; Maurya, S.K.; Yadav, R.S.; Kumar, A.; Kumar, V.; Joubert, M.-F.; Swart, H.C. Future prospects of fluoride based upconversion nanoparticles for emerging applications in biomedical and energy harvesting. J. Vac. Sci. Technol. B 2018, 36, 060801. [Google Scholar] [CrossRef]
- Dubey, V.; Som, S.; Kumar, V. Luminescent Materials in Display and Biomedical Applications; CRC Press, Taylor & Francis Group: Boca Raton, FL, USA, 2021. [Google Scholar]
- Falcony, C.; Aguilar-Frutis, M.A.; García-Hipólito, M. Spray Pyrolysis Technique; High-K Dielectric Films and Luminescent Materials: A Review. Micromachines 2018, 9, 414. [Google Scholar] [CrossRef] [PubMed]
- Grzeszkiewicz, K.; Marciniak, L.; Stręk, W.; Hreniak, D. Downconversion in Y2Si2O7: Pr3+, Yb3+ polymorphs for its possible application as luminescent concentrators in photovoltaic solar-cells. J. Lumin. 2016, 177, 172–177. [Google Scholar] [CrossRef]
- Tan, J.; Jin, X. Monodisperse, colloidal and luminescent calcium fluoride nanoparticles via a citrate-assisted hydrothermal route. J. Colloid Interface Sci. 2018, 531, 444–450. [Google Scholar] [CrossRef] [PubMed]
- Cortelletti, P.; Facciotti, C.; Cantarelli, I.X.; Canton, P.; Quintanilla, M.; Vetrone, F.; Speghini, A.; Pedroni, M. Nd3+ activated CaF2 NPs as colloidal nanothermometers in the biological window. Opt. Mater. 2017, 68, 29–34. [Google Scholar] [CrossRef]
- Su, L.; Xu, J.; Li, H.; Wen, L.; Yang, W.; Zhao, Z.; Si, J.; Dong, Y.; Zhou, G. Crystal growth and spectroscopic characterization of Yb-doped and Yb, Na-codoped CaF2 laser crystals by TGT. J. Cryst. Growth 2005, 277, 264–268. [Google Scholar] [CrossRef]
- Gao, X.; Fang, G.; Wang, Y.; Zhu, Z.; You, Z.; Li, J.; Sun, Y.; Tu, C. Visible and mid-infrared spectral performances of Dy3+: CaF2 and Dy3+/ Y3+: CaF2 crystals. J. Alloys Compd. 2021, 856, 158083. [Google Scholar] [CrossRef]
- Cortelletti, P.; Pedroni, M.; Boschi, F.; Pin, S.; Ghigna, P.; Canton, P.; Vetrone, F.; Speghini, A. Luminescence of Eu3+ Activated CaF2 and SrF2 Nanoparticles: Effect of the Particle Size and Codoping with Alkaline Ions. Cryst. Growth Des. 2018, 18, 686–694. [Google Scholar] [CrossRef]
- Xu, B.; Li, D.; Huang, Z.; Tang, C.; Mo, W.; Ma, Y. Alleviating luminescence concentration quenching in lanthanide doped CaF2 based nanoparticles through Na+ ion doping. Dalton Trans. 2018, 47, 7534–7540. [Google Scholar] [CrossRef]
- Serrano, D.; Braud, A.; Doualan, J.L.; Camy, P.; Moncorgé, R. Pr3+ cluster management in CaF2 by codoping with Lu3+ or Yb3+ for visible lasers and quantum down-converters. J. Opt. Soc. Am. B 2012, 29, 1854–1862. [Google Scholar] [CrossRef]
- Yu, H.; Su, L.; Qian, X.; Jiang, D.; Wu, Q.; Tang, F.; Wang, J.; Xu, J. Influence of Gd3+ on the Optical Properties of Dy3+-Activated CaF2 Single Crystal for White LED Application. J. Electron. Mater. 2019, 48, 2910–2915. [Google Scholar] [CrossRef]
- Normani, S.; Braud, A.; Soulard, R.; Doualan, J.L.; Benayad, A.; Menard, V.; Brasse, G.; Moncorgé, R.; Goossens, J.P.; Camy, P. Site selective analysis of Nd3+–Lu3+ codoped CaF2 laser crystals. CrystEngComm 2016, 18, 9016–9025. [Google Scholar] [CrossRef]
- Zhang, Z.; Wang, S.; Feng, X.; Wu, Q.; Qian, X.; Wu, A.; Liu, J.; Mei, B.; Su, L. Growth, Characterization, and Efficient Continuous-Wave Laser Operation in Nd, Gd:CaF2 Single-Crystal Fibers. Cryst. Growth Des. 2020, 20, 6329–6336. [Google Scholar] [CrossRef]
- Yu, Z.; He, Y.; Schomann, T.; Wu, K.; Hao, Y.; Suidgeest, E.; Zhang, H.; Eich, C.; Cruz, L.J. Achieving Effective Multimodal Imaging with Rare-Earth Ion-Doped CaF2 Nanoparticles. Pharmaceutics 2022, 14, 840. [Google Scholar] [CrossRef] [PubMed]
- Wang, T.; Yu, Y.; Ji, X.; Xu, W.; Fu, Y.; Cao, H.; He, Q.; Cheng, J. A new method to synthesize Sub-10 nm CaF2: Nd3+ nanoparticles and fluorescent enhancement via Li+ ions or Ce3+ ions doping. Dyes Pigments 2020, 175, 108129. [Google Scholar] [CrossRef]
- Ni, D.; Zhang, J.; Wang, J.; Hu, P.; Jin, Y.; Tang, Z.; Yao, Z.; Bu, W.; Shi, J. Oxygen vacancy enables markedly enhanced magnetic resonance imaging-guided photothermal therapy of a Gd3+-doped contrast agent. ACS Nano 2017, 11, 4256–4264. [Google Scholar] [CrossRef] [PubMed]
- Rajendran, D.; Elizabeth, J.; Manoharan, S.; Vellala, N.; Kootallur, B.; Paul, P.M.; Angamuthu, A.; Bhagavathsingh, J. Synthesis, Characterization and Relaxivity Validations of Gd (III) Complex of DOTA Tetrahydrazide as MRI Contrast Agent. J. Mol. Struct. 2022, 132474. [Google Scholar] [CrossRef]
- Pedroni, M.; Piccinelli, F.; Passuello, T.; Polizzi, S.; Ueda, J.; Haro-González, P.; Martinez Maestro, L.; Jaque, D.; García-Solé, J.; Bettinelli, M.; et al. Water (H2O and D2O) Dispersible NIR-to-NIR Upconverting Yb3+/Tm3+ Doped MF2 (M = Ca, Sr) Colloids: Influence of the Host Crystal. Cryst. Growth Des. 2013, 13, 4906–4913. [Google Scholar] [CrossRef]
- De Anda, J.; Huerta, E.F.; Balderas, J.U.; Righini, G.C.; Falcony, C. The effect of Li+ incorporation in Yb3+-Nd3+ co-doped CaF2 phosphors over the NIR photoluminescence emission excited under visible light. Ceram. Int. 2021, 47, 4694–4701. [Google Scholar] [CrossRef]
- Yu, Z.-f.; Shi, J.-p.; Li, J.-l.; Li, P.-h.; Zhang, H.-w. Luminescence enhancement of CaF2:Nd3+ nanoparticles in the second near-infrared window for in vivo imaging through Y3+ doping. J. Mater. Chem. B 2018, 6, 1238–1243. [Google Scholar] [CrossRef]
- Li, X.; Hao, Q.; Jiang, D.; Wu, Q.; Zhang, Z.; Zhang, Z.; Liu, J.; Su, L. Smooth and flat photoluminescence spectra of Nd3+ active ions in tri-doped CaF2 single crystals. Opt. Mater. Express 2020, 10, 704–714. [Google Scholar] [CrossRef]
- Sasidharan, S.; Jayasree, A.; Fazal, S.; Koyakutty, M.; Nair, S.V.; Menon, D. Ambient temperature synthesis of citrate stabilized and biofunctionalized, fluorescent calcium fluoride nanocrystals for targeted labeling of cancer cells. Biomater. Sci. 2013, 1, 294–305. [Google Scholar] [CrossRef] [PubMed]
- Varga, Z.; Fehér, B.; Kitka, D.; Wacha, A.; Bóta, A.; Berényi, S.; Pipich, V.; Fraikin, J.-L. Size measurement of extracellular vesicles and synthetic liposomes: The impact of the hydration shell and the protein corona. Colloids Surf. B Biointerfaces 2020, 192, 111053. [Google Scholar] [CrossRef] [PubMed]
- Wang, S.; Jiang, D.; Wu, Q.; Pang, S.; Wang, J.; Qian, X.; Liu, J.; Mei, B.; Su, L. Spectral properties and highly efficient continuous-wave laser operation in Nd, Gd: CaF2 crystals. J. Alloys Compd. 2019, 781, 629–632. [Google Scholar] [CrossRef]
- Serqueira, E.O.; Dantas, N.O.; Monte, A.F.G.; Bell, M.J.V. Judd Ofelt calculation of quantum efficiencies and branching ratios of Nd3+ doped glasses. J. Non-Cryst. Solids 2006, 352, 3628–3632. [Google Scholar] [CrossRef]
- De la Rosa-Cruz, E.; Kumar, G.A.; Diaz-Torres, L.A.; Martínez, A.; Barbosa-García, O. Spectroscopic characterization of Nd3+ ions in barium fluoroborophosphate glasses. Opt. Mater. 2001, 18, 321–329. [Google Scholar] [CrossRef]
- Turri, G.; Webster, S.; Bass, M.; Toncelli, A. Temperature-Dependent Stimulated Emission Cross-Section in Nd3+: YLF Crystal. Materials 2021, 14, 431. [Google Scholar] [CrossRef]
- Fornaguera, C.; Calderó, G.; Mitjans, M.; Vinardell, M.P.; Solans, C.; Vauthier, C. Interactions of PLGA nanoparticles with blood components: Protein adsorption, coagulation, activation of the complement system and hemolysis studies. Nanoscale 2015, 7, 6045–6058. [Google Scholar] [CrossRef]
- Alkahtani, M.; Alsofyani, N.; Alfahd, A.; Almuqhim, A.A.; Almughem, F.A.; Alshehri, A.A.; Qasem, H.; Hemmer, P.R. Engineering Red-Enhanced and Biocompatible Upconversion Nanoparticles. Nanomaterials 2021, 11, 284. [Google Scholar] [CrossRef]
- Villadangos, J.A.; Cardoso, M.a.; Steptoe, R.J.; van Berkel, D.; Pooley, J.; Carbone, F.R.; Shortman, K. MHC Class II Expression Is Regulated in Dendritic Cells Independently of Invariant Chain Degradation. Immunity 2001, 14, 739–749. [Google Scholar] [CrossRef]
- Cruz, L.J.; Rosalia, R.A.; Kleinovink, J.W.; Rueda, F.; Löwik, C.W.G.M.; Ossendorp, F. Targeting nanoparticles to CD40, DEC-205 or CD11c molecules on dendritic cells for efficient CD8+ T cell response: A comparative study. J. Control. Release 2014, 192, 209–218. [Google Scholar] [CrossRef] [PubMed]
- Minns, D.; Smith, K.J.; Findlay, E.G. Orchestration of adaptive T cell responses by neutrophil granule contents. Mediat. Inflamm. 2019, 2019, 8968943. [Google Scholar] [CrossRef] [PubMed]
- Sheng, Y.; Liao, L.-D.; Bandla, A.; Liu, Y.-H.; Yuan, J.; Thakor, N.; Tan, M.C. Enhanced near-infrared photoacoustic imaging of silica-coated rare-earth doped nanoparticles. Mater. Sci. Eng. C 2017, 70, 340–346. [Google Scholar] [CrossRef] [PubMed]
- Visscher, M.; Pouw, J.J.; van Baarlen, J.; Klaase, J.M.; Ten Haken, B. Quantitative analysis of superparamagnetic contrast agent in sentinel lymph nodes using ex vivo vibrating sample magnetometry. IEEE Trans. Biomed. Eng. 2013, 60, 2594–2602. [Google Scholar] [CrossRef] [PubMed]
- Yang, W.; Zhang, Z.; Zhang, X.; Wang, X.; Jiang, X.; Leng, Z.; Lin, H.; Zeng, F.; Li, C.; Su, Z. Enhancement of fluorescence and magnetic properties of CeF3: RE3+ (Tb, Gd) nanoparticles via multi-band UV excitation and Li doping regulation. Ceram. Int. 2021, 47, 16450–16459. [Google Scholar] [CrossRef]
- Kadria-Vili, Y.; Neumann, O.; Zhao, Y.; Nordlander, P.; Martinez, G.V.; Bankson, J.A.; Halas, N.J. Gd2O3-mesoporous silica/gold nanoshells: A potential dual T1/T2 contrast agent for MRI-guided localized near-IR photothermal therapy. Proc. Natl. Acad. Sci. USA 2022, 119, e2123527119. [Google Scholar]


Publisher’s Note: MDPI stays neutral with regard to jurisdictional claims in published maps and institutional affiliations. |
© 2022 by the authors. Licensee MDPI, Basel, Switzerland. This article is an open access article distributed under the terms and conditions of the Creative Commons Attribution (CC BY) license (https://creativecommons.org/licenses/by/4.0/).
Share and Cite
Yu, Z.; He, Y.; Schomann, T.; Wu, K.; Hao, Y.; Suidgeest, E.; Zhang, H.; Eich, C.; Cruz, L.J. Rare-Earth-Metal (Nd3+, Ce3+ and Gd3+)-Doped CaF2: Nanoparticles for Multimodal Imaging in Biomedical Applications. Pharmaceutics 2022, 14, 2796. https://doi.org/10.3390/pharmaceutics14122796
Yu Z, He Y, Schomann T, Wu K, Hao Y, Suidgeest E, Zhang H, Eich C, Cruz LJ. Rare-Earth-Metal (Nd3+, Ce3+ and Gd3+)-Doped CaF2: Nanoparticles for Multimodal Imaging in Biomedical Applications. Pharmaceutics. 2022; 14(12):2796. https://doi.org/10.3390/pharmaceutics14122796
Chicago/Turabian StyleYu, Zhenfeng, Yuanyuan He, Timo Schomann, Kefan Wu, Yang Hao, Ernst Suidgeest, Hong Zhang, Christina Eich, and Luis J. Cruz. 2022. "Rare-Earth-Metal (Nd3+, Ce3+ and Gd3+)-Doped CaF2: Nanoparticles for Multimodal Imaging in Biomedical Applications" Pharmaceutics 14, no. 12: 2796. https://doi.org/10.3390/pharmaceutics14122796