
Selenium Nanoparticles Can Influence the Immune Response Due to Interactions with Antibodies and Modulation of the Physiological State of Granulocytes
 , , ,
, , ,
Abstract
:1. Introduction
2. Materials and Methods
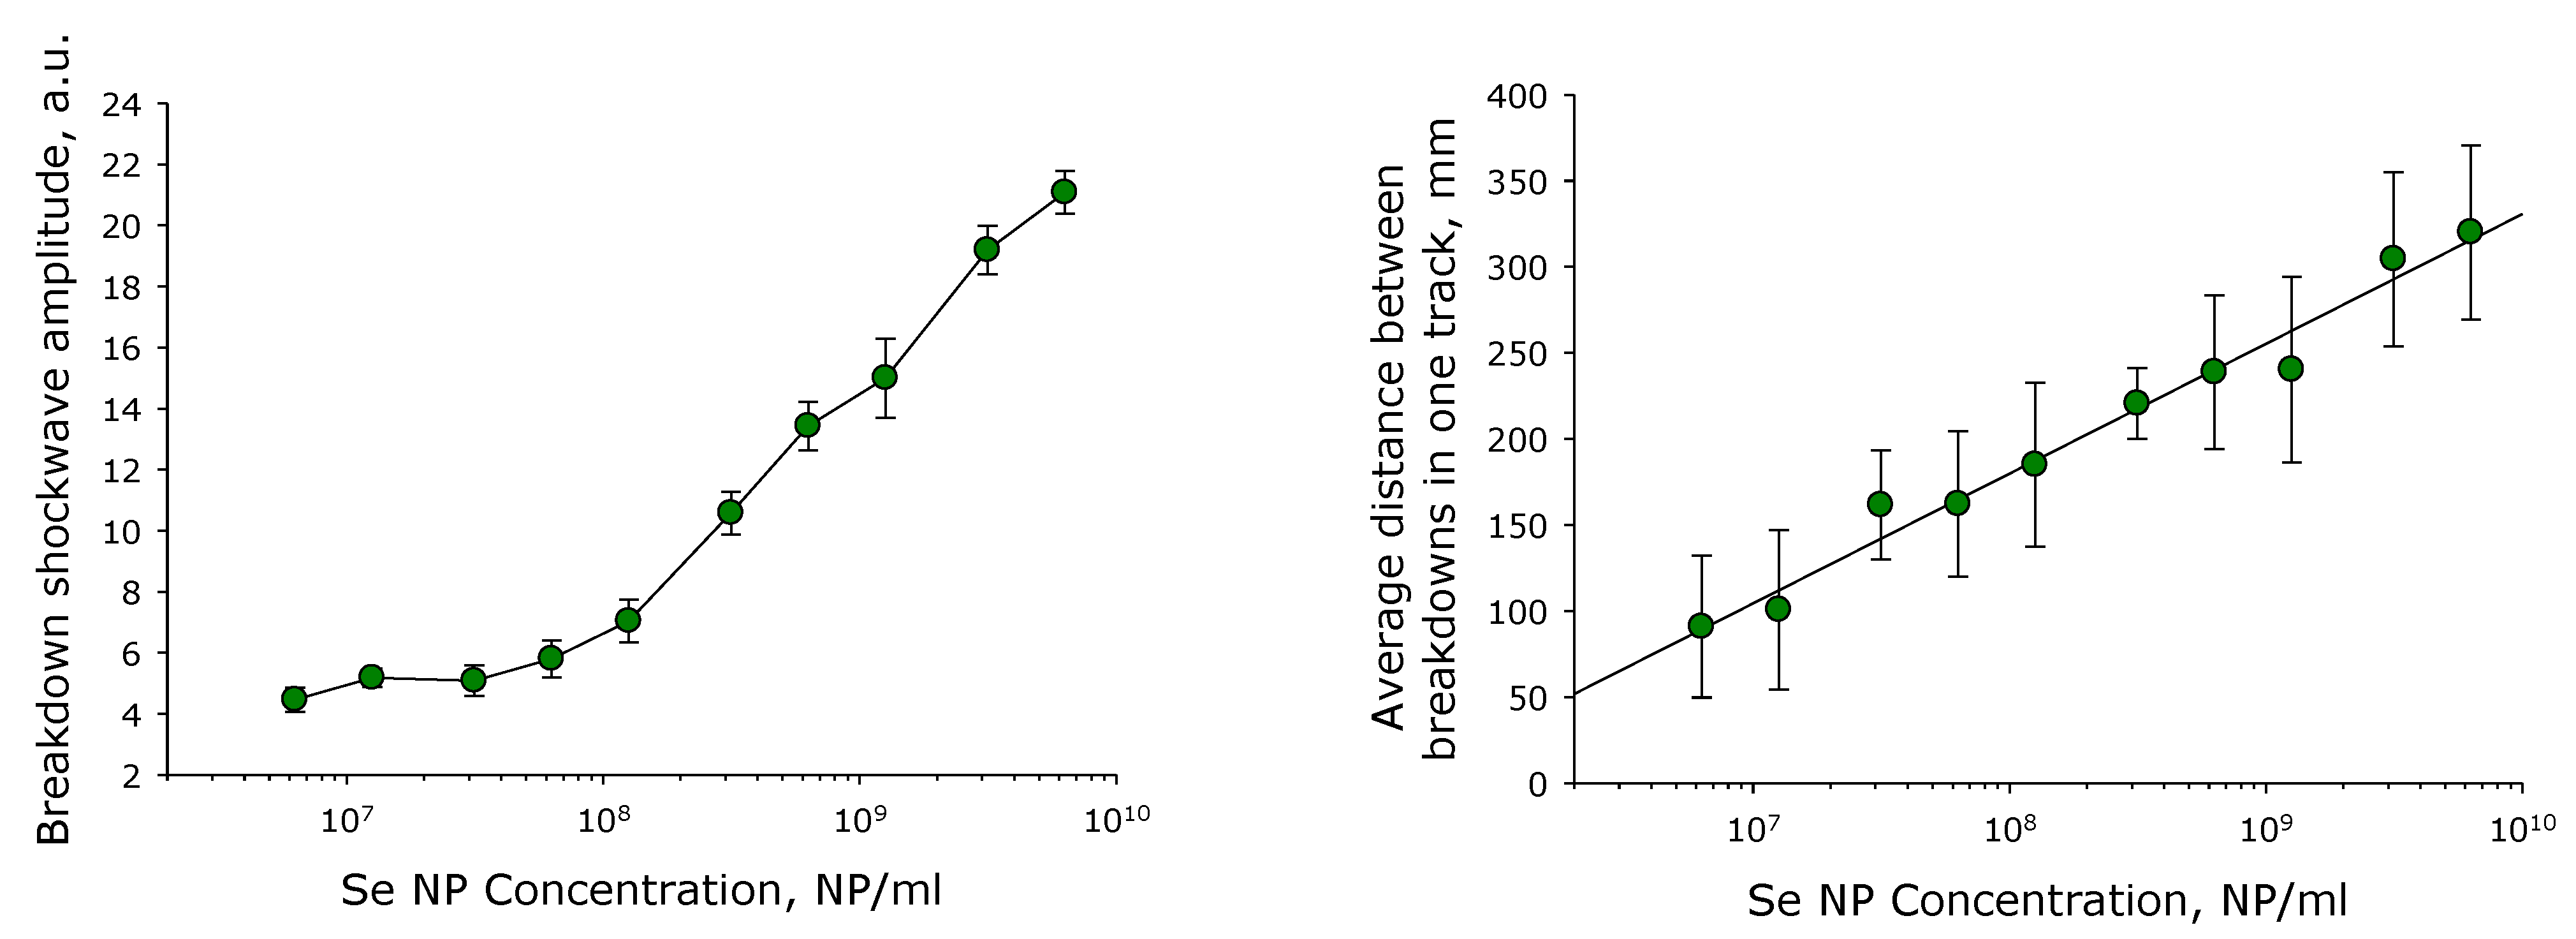
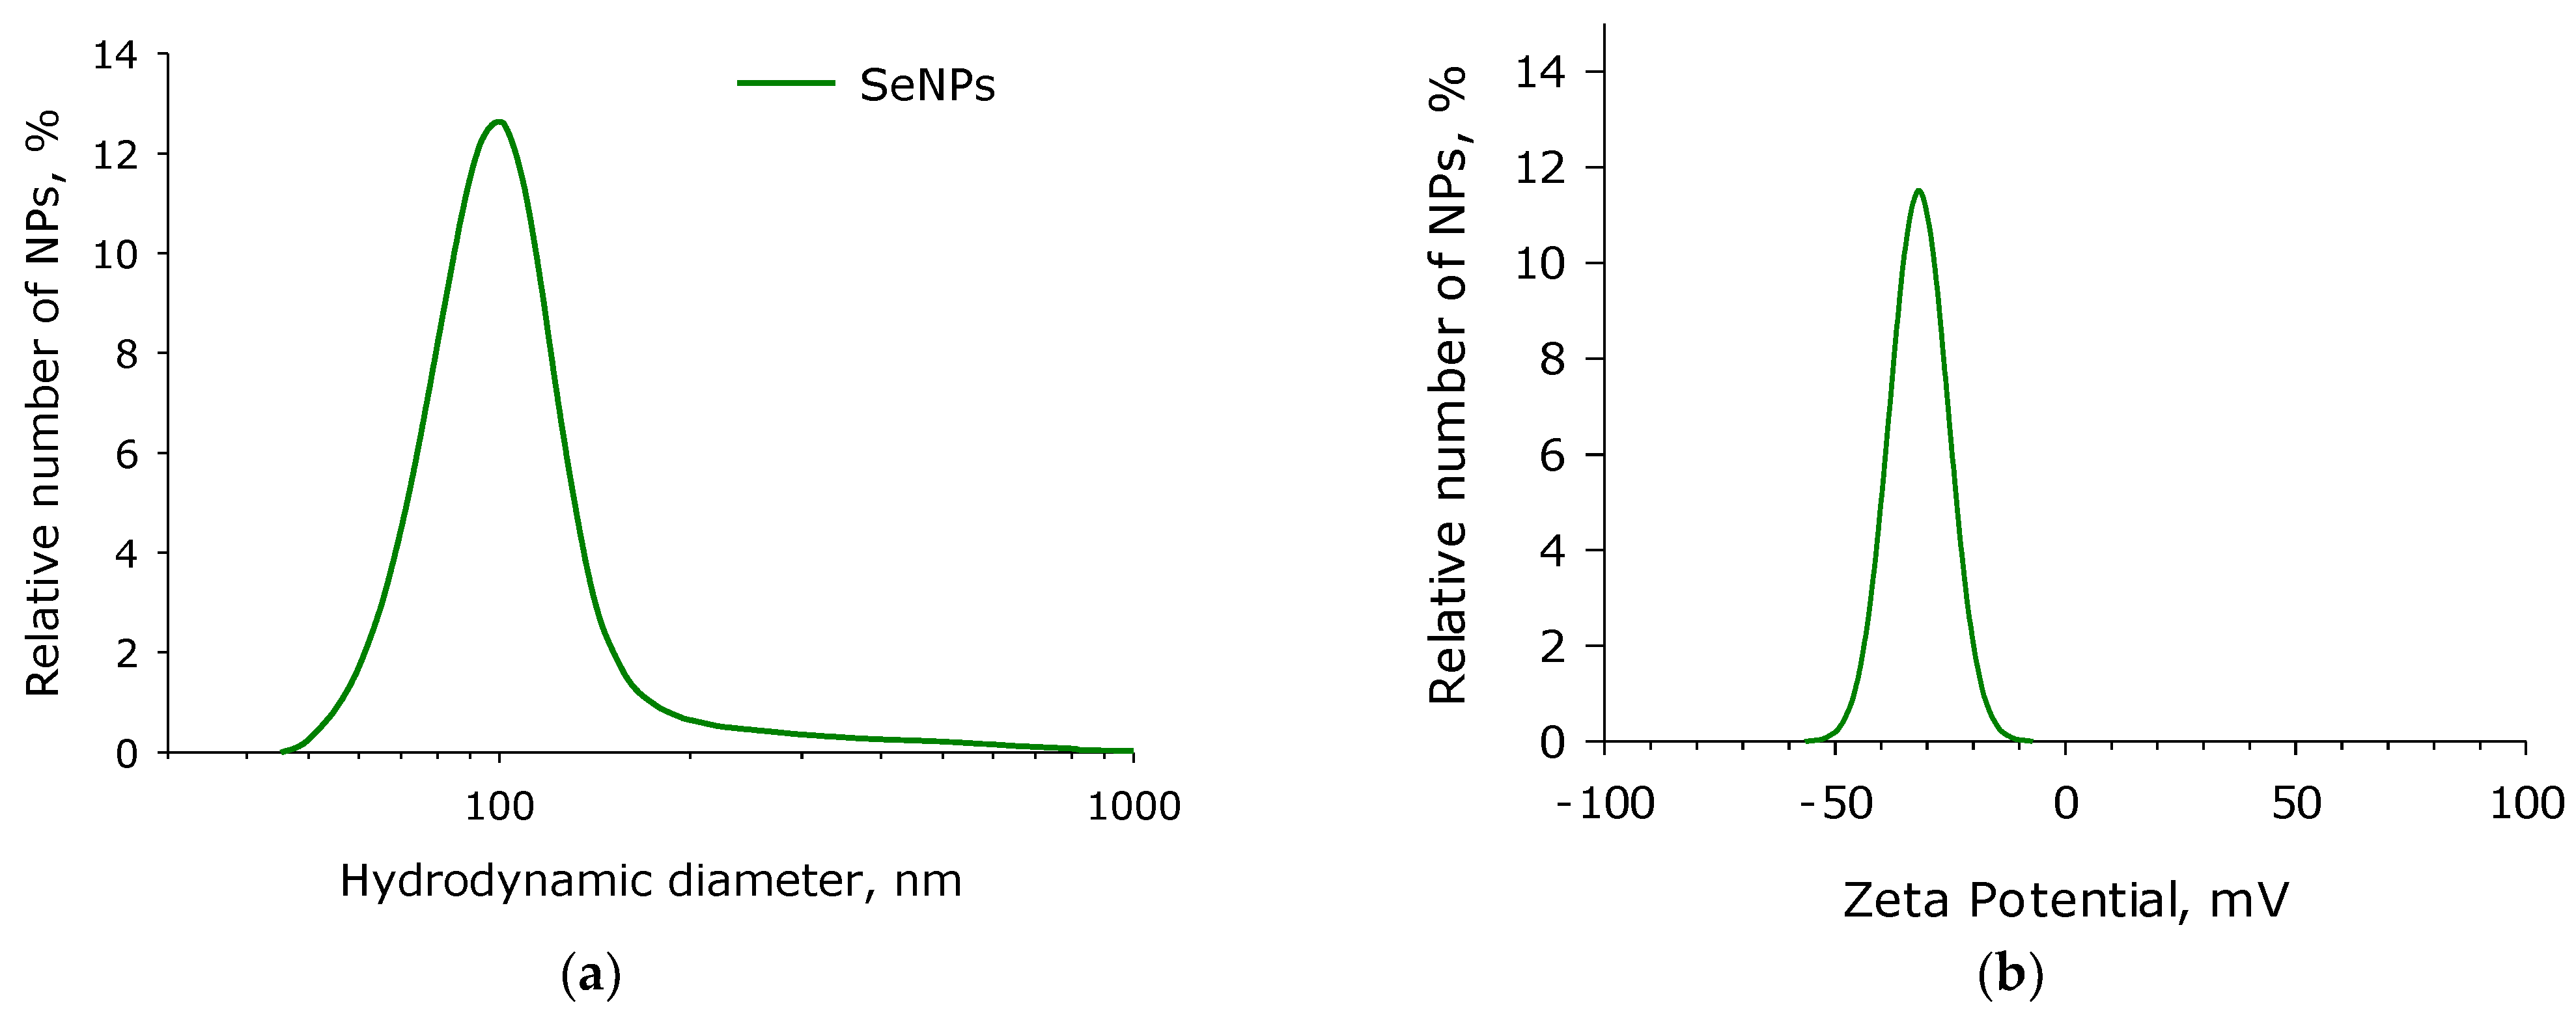
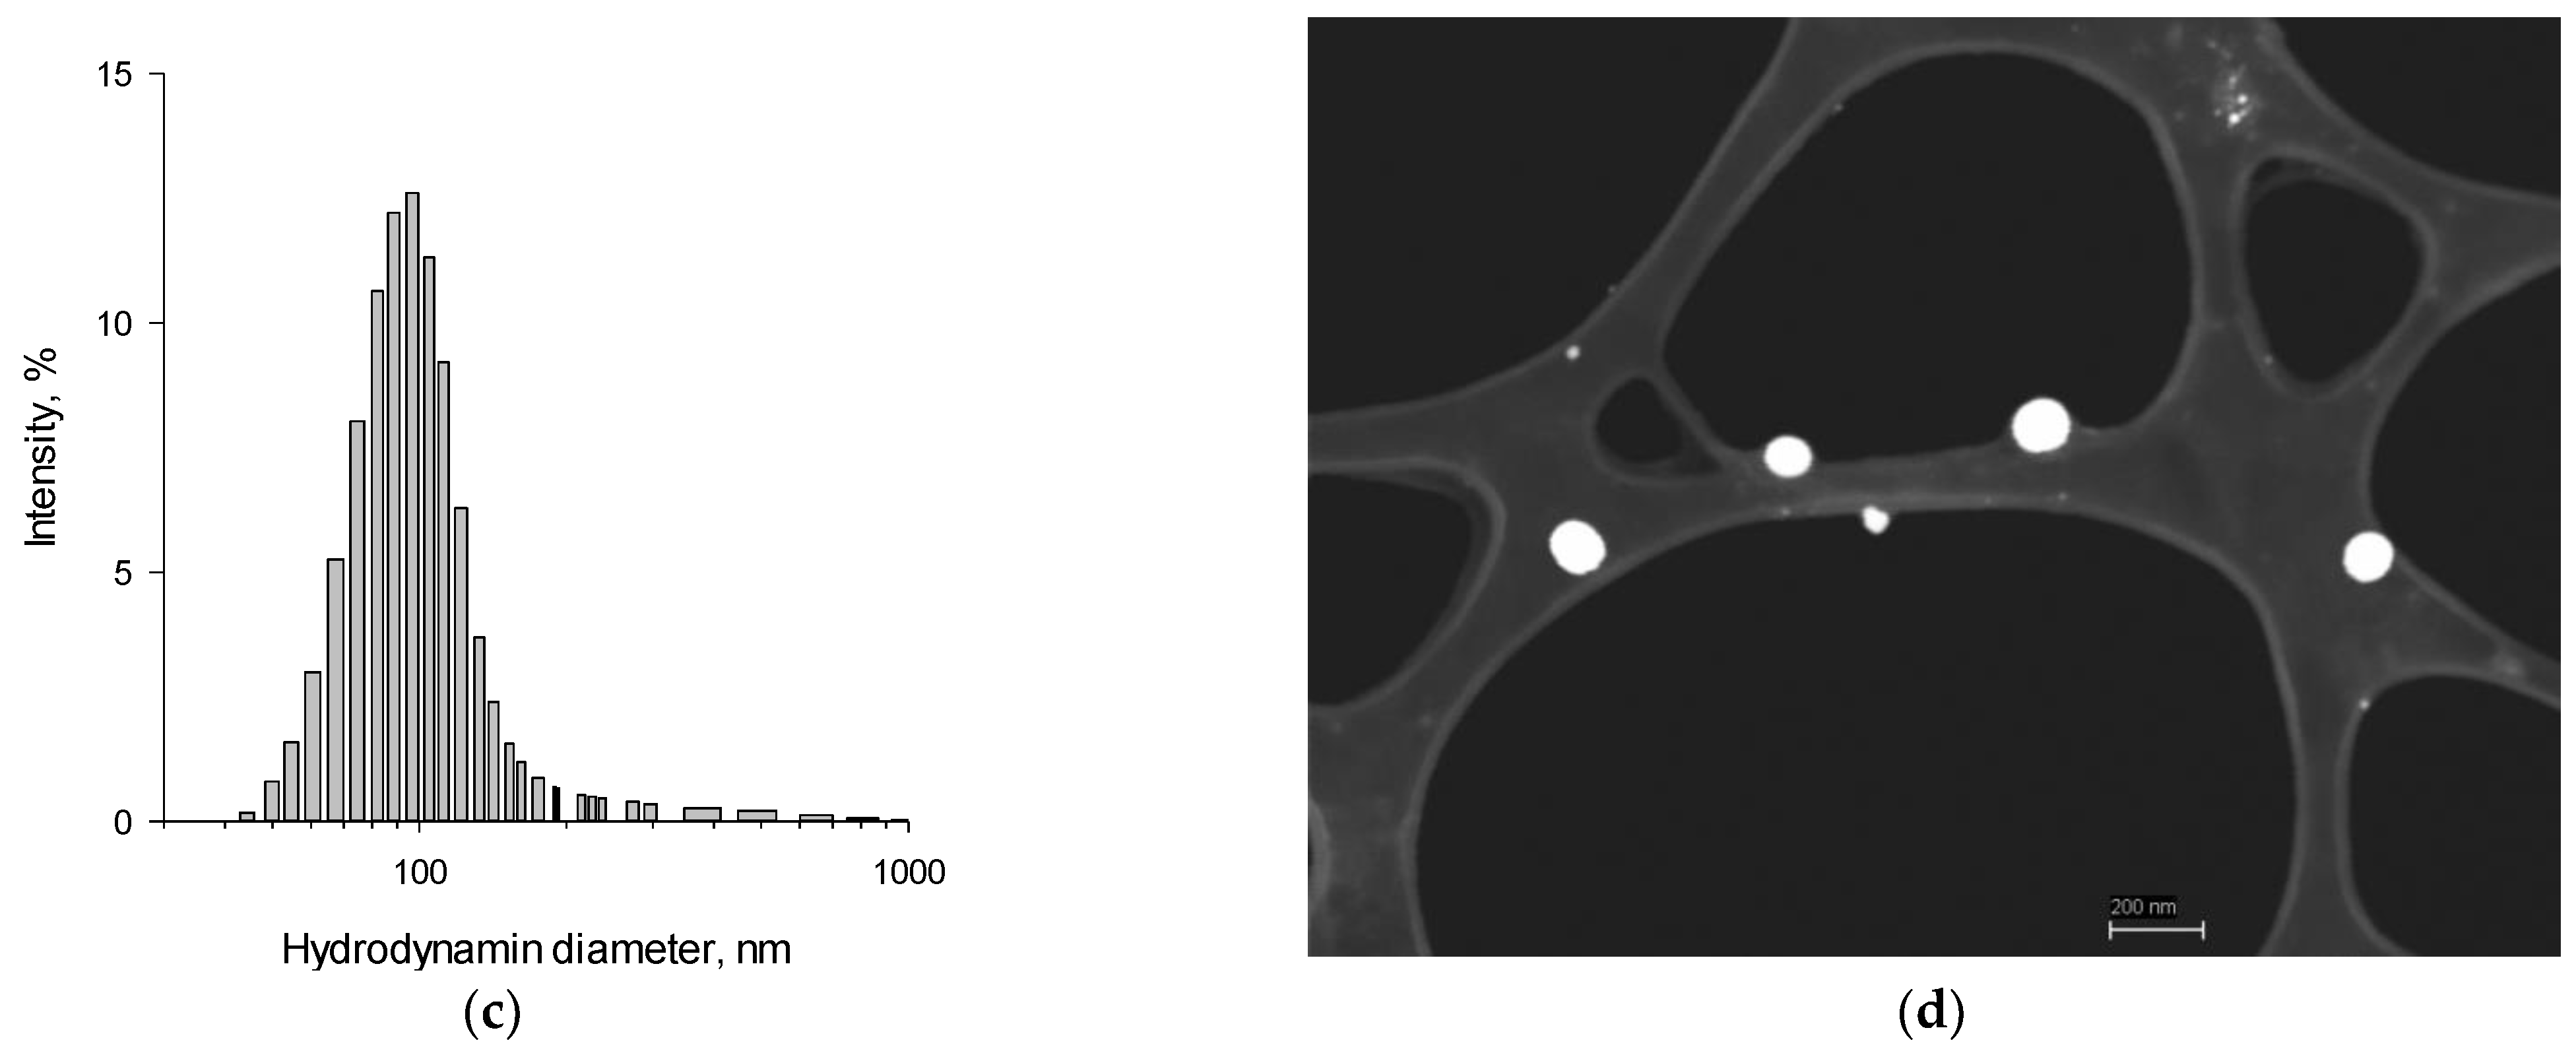
2.1. SeNPs Fabrication and Characterisation
2.2. Animal Study
2.3. Isolation of Granulocytes
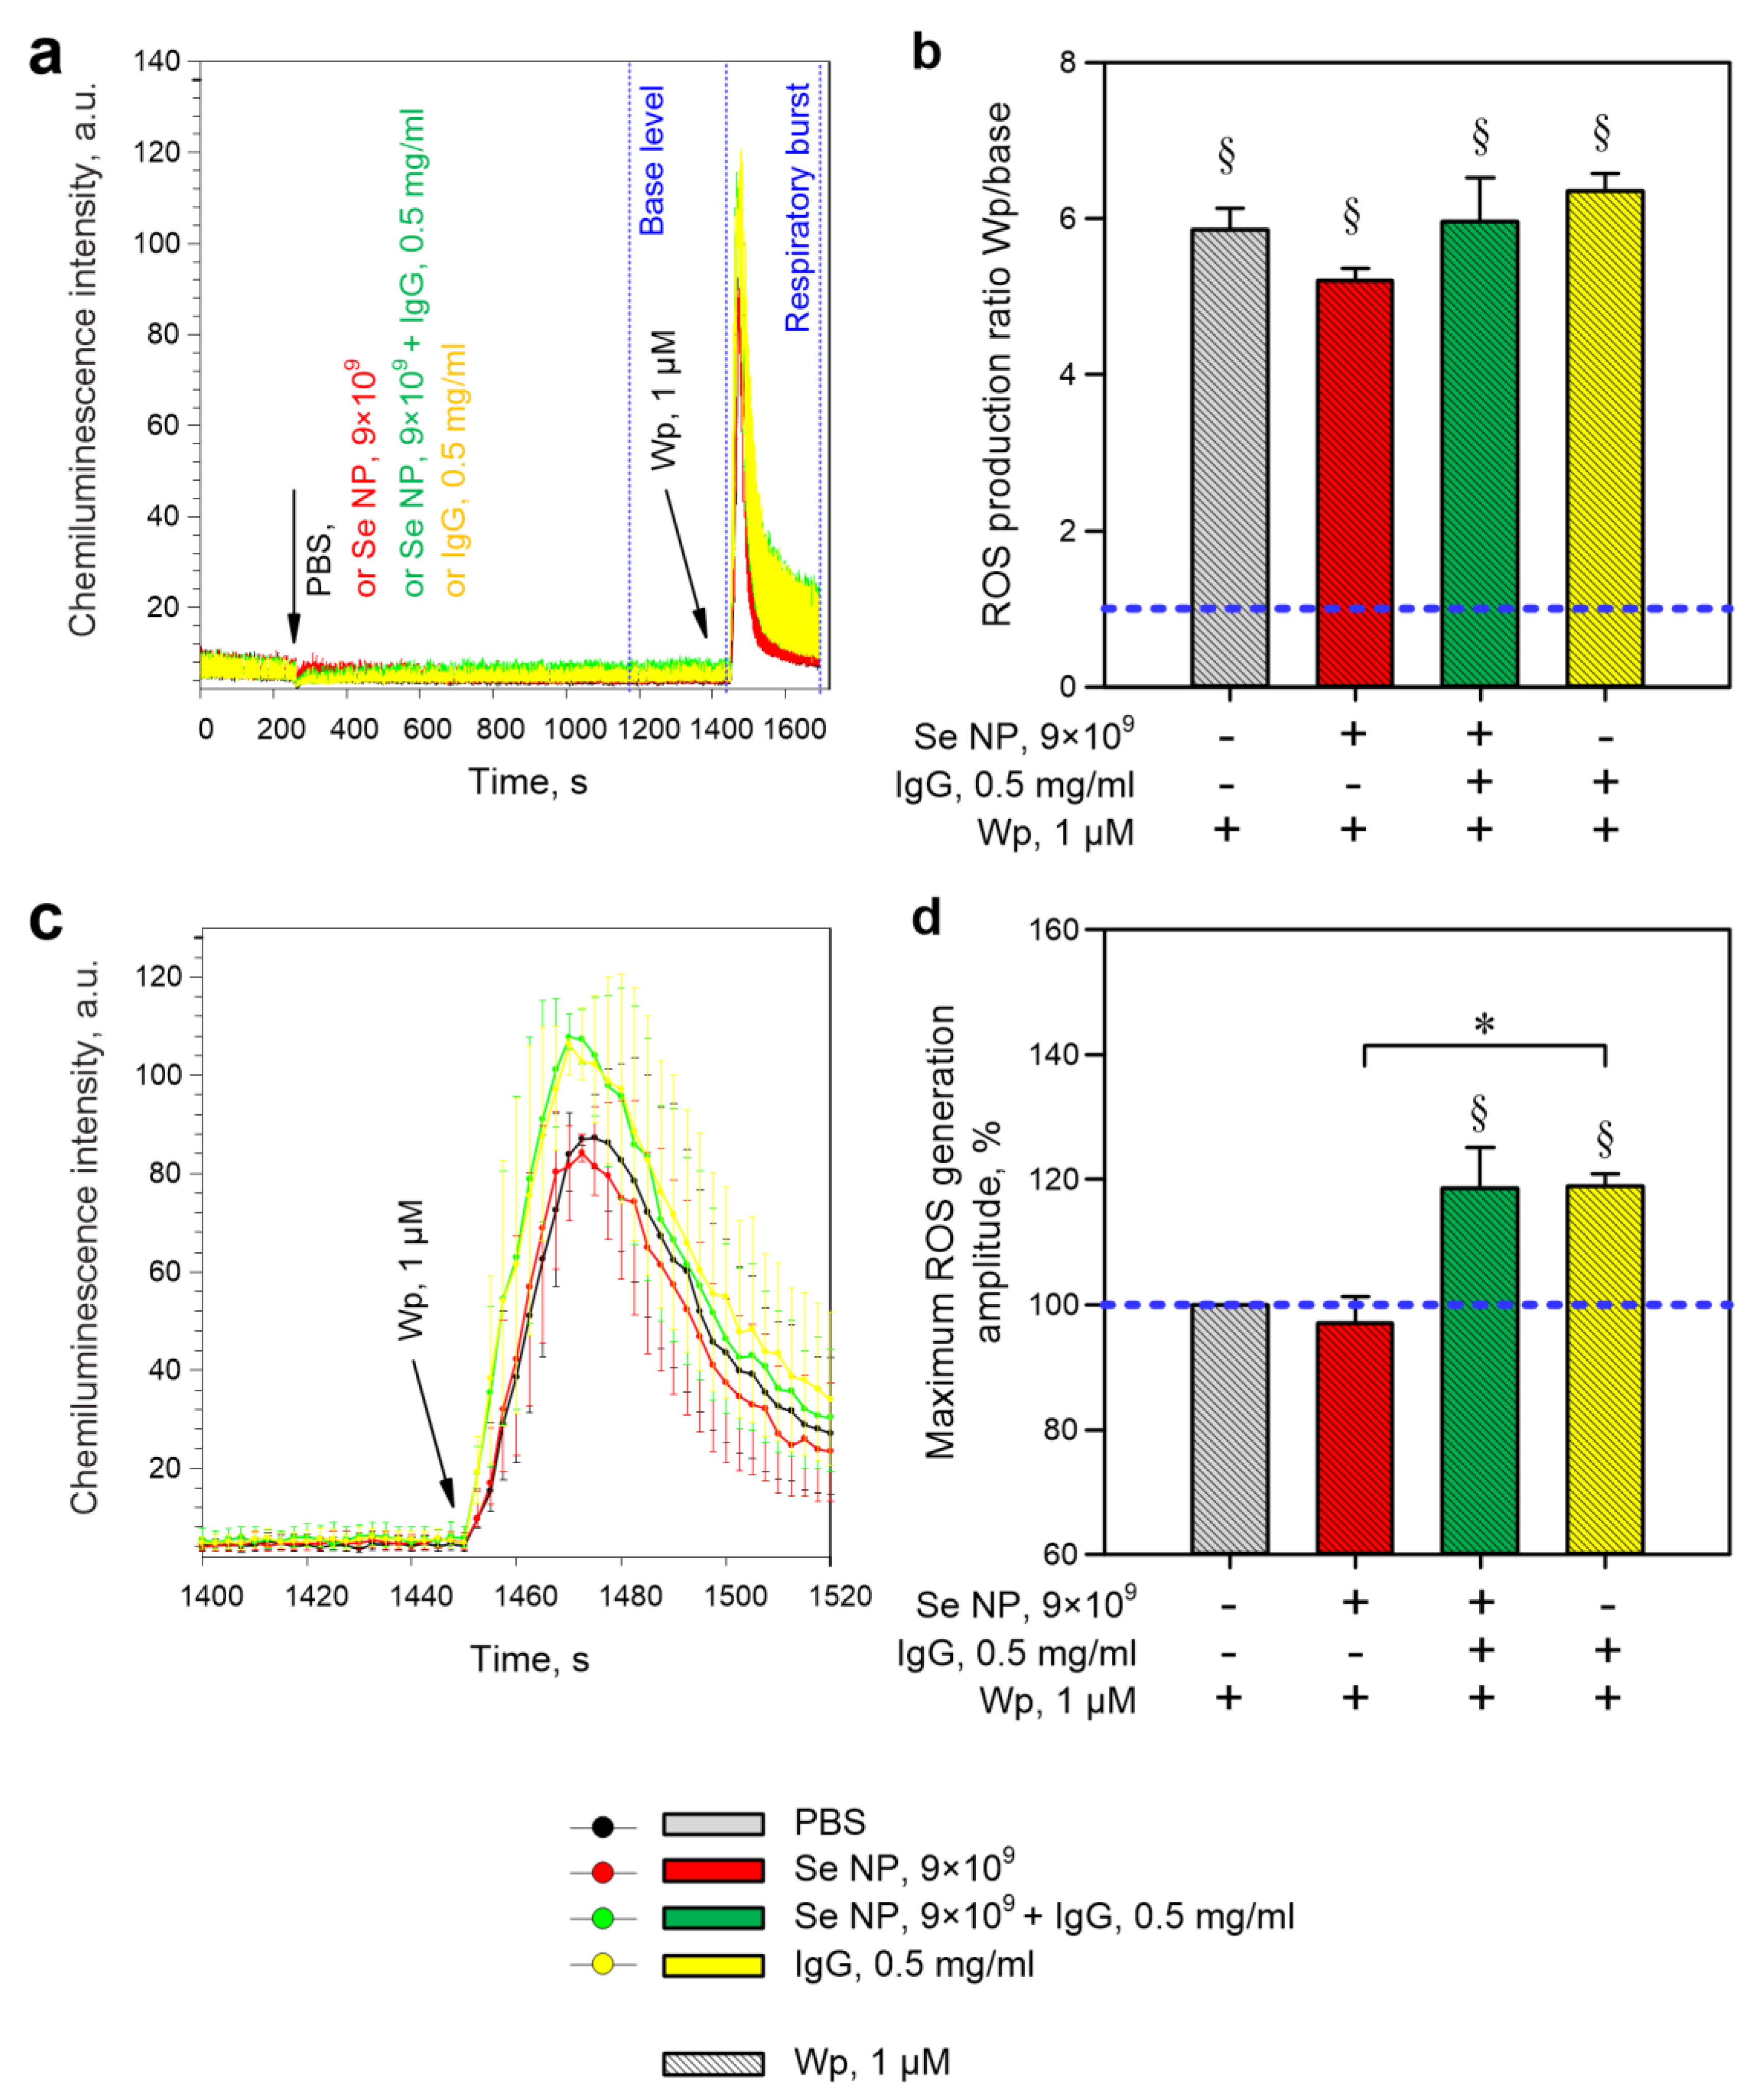
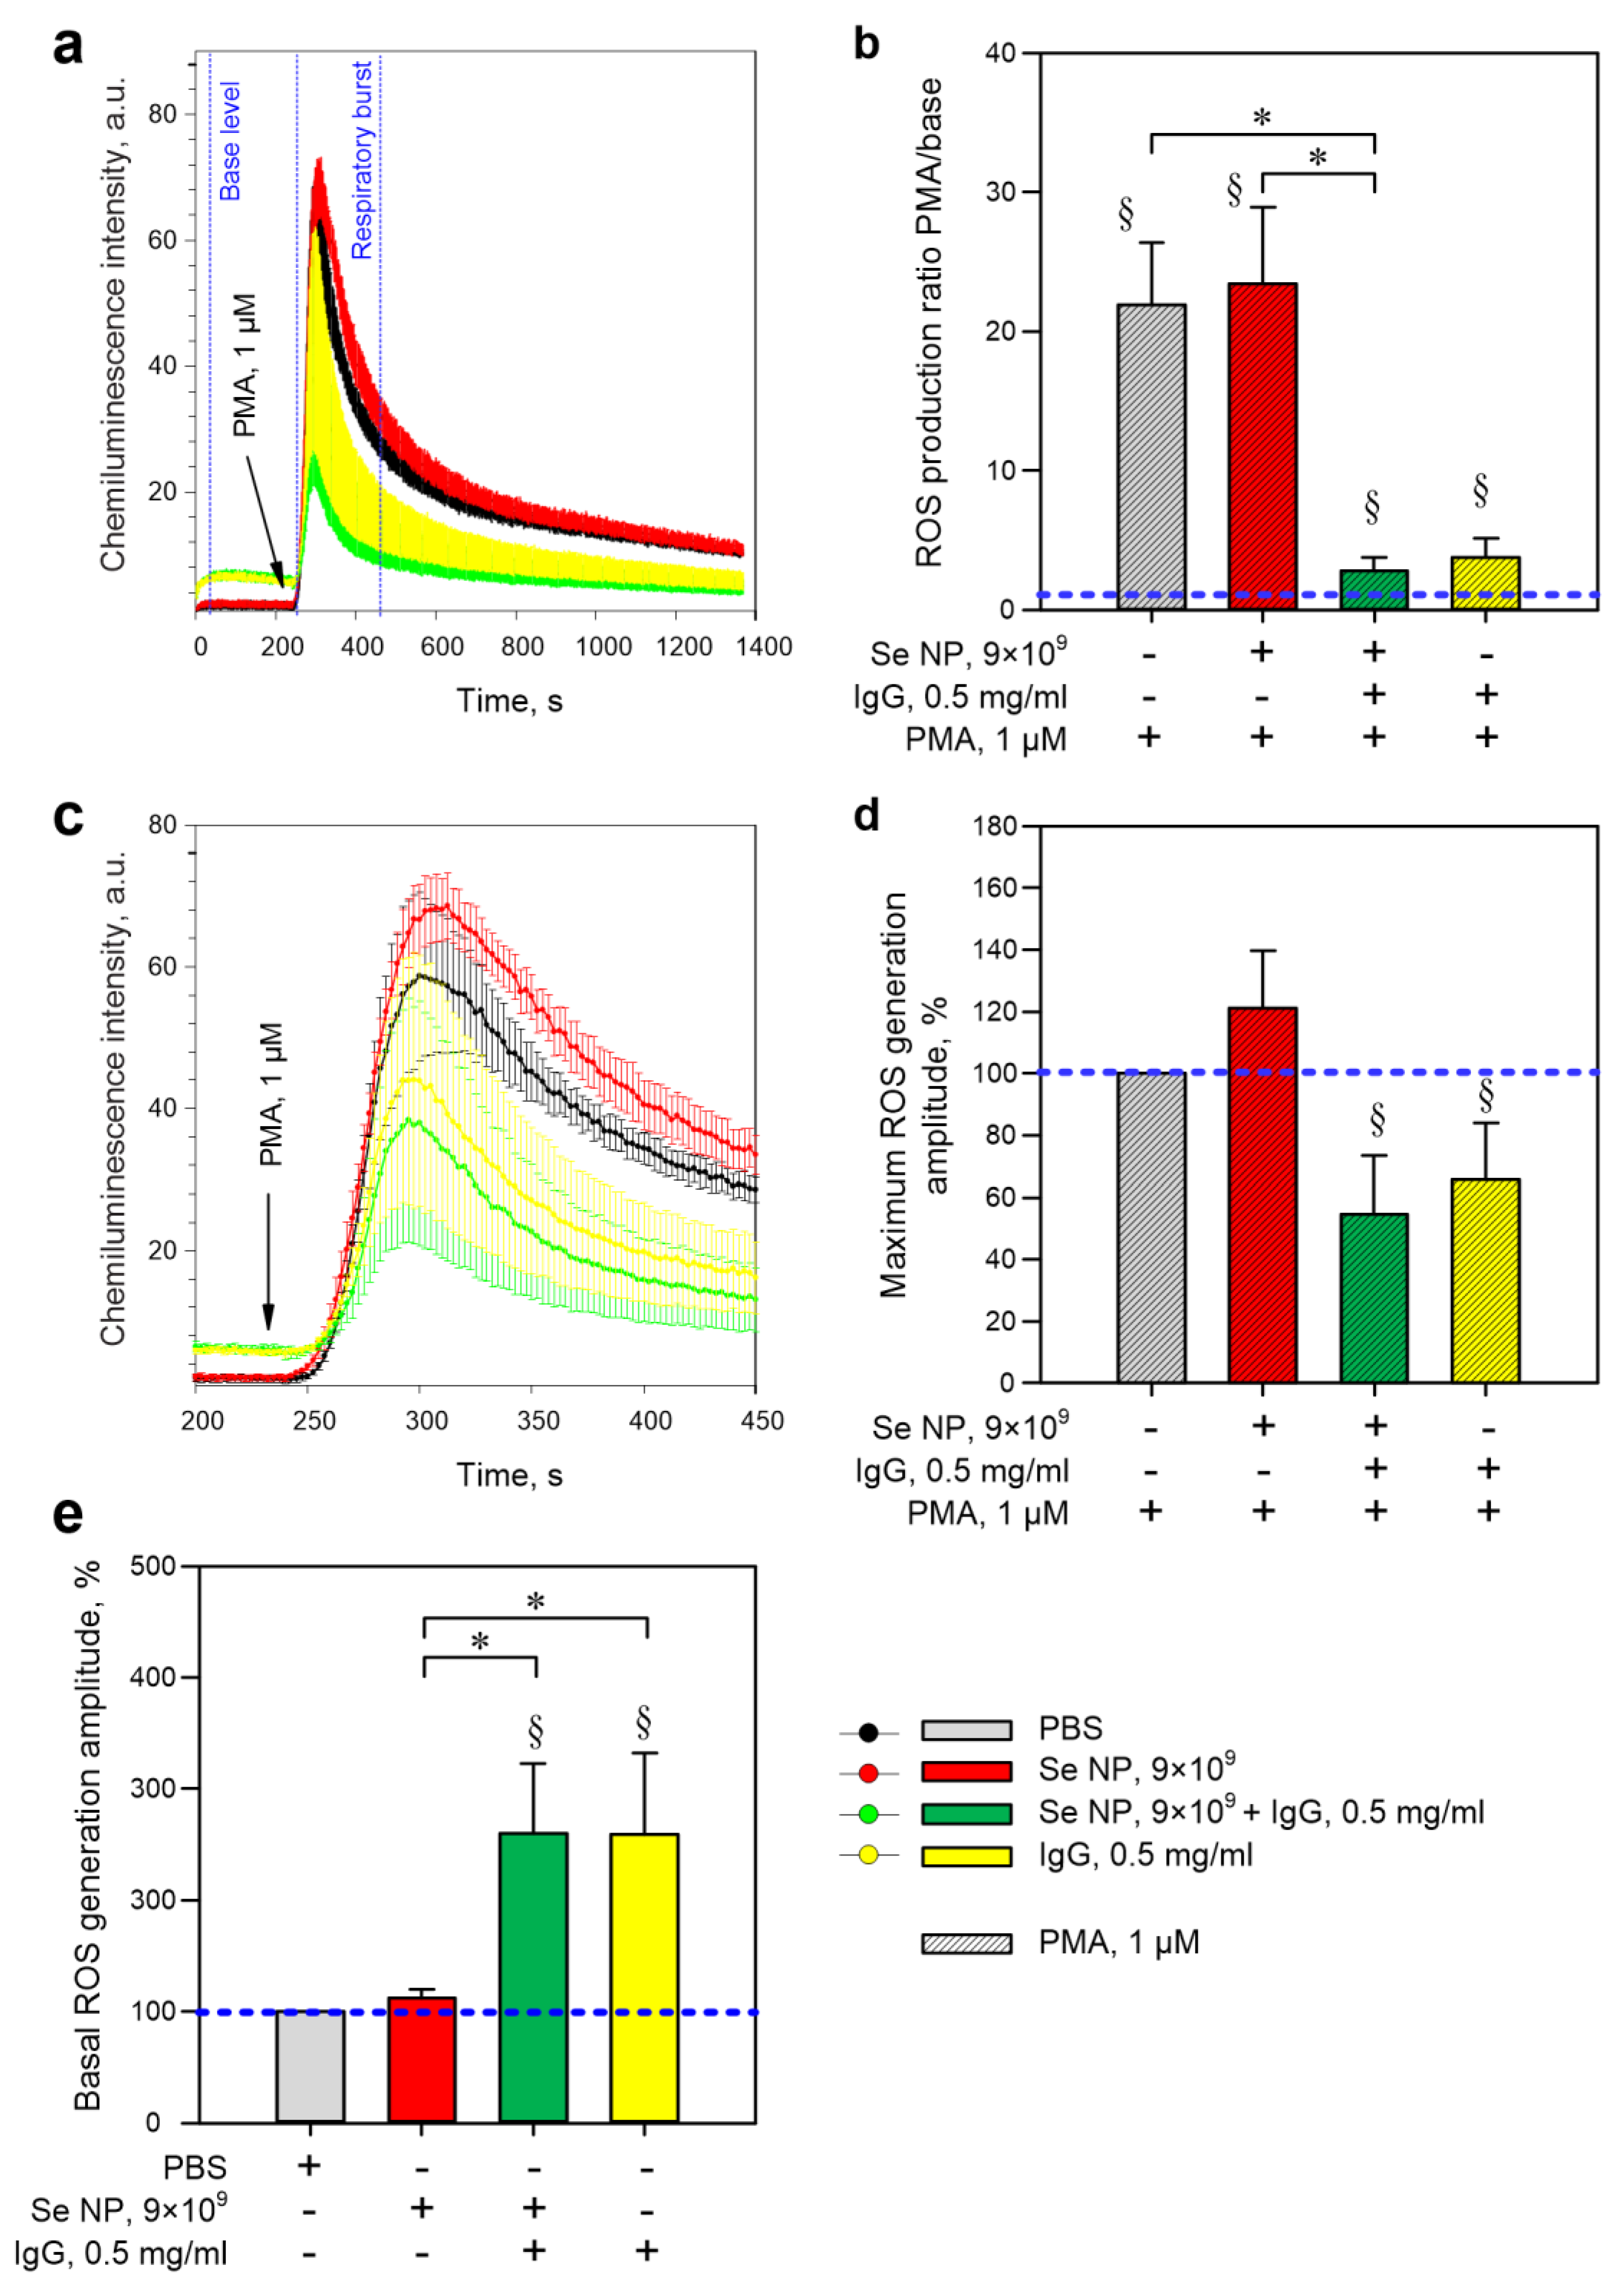
2.4. Evaluation of ROS Production
2.5. Assessment of Calcium Responses of Cells
2.6. Micronucleus Test
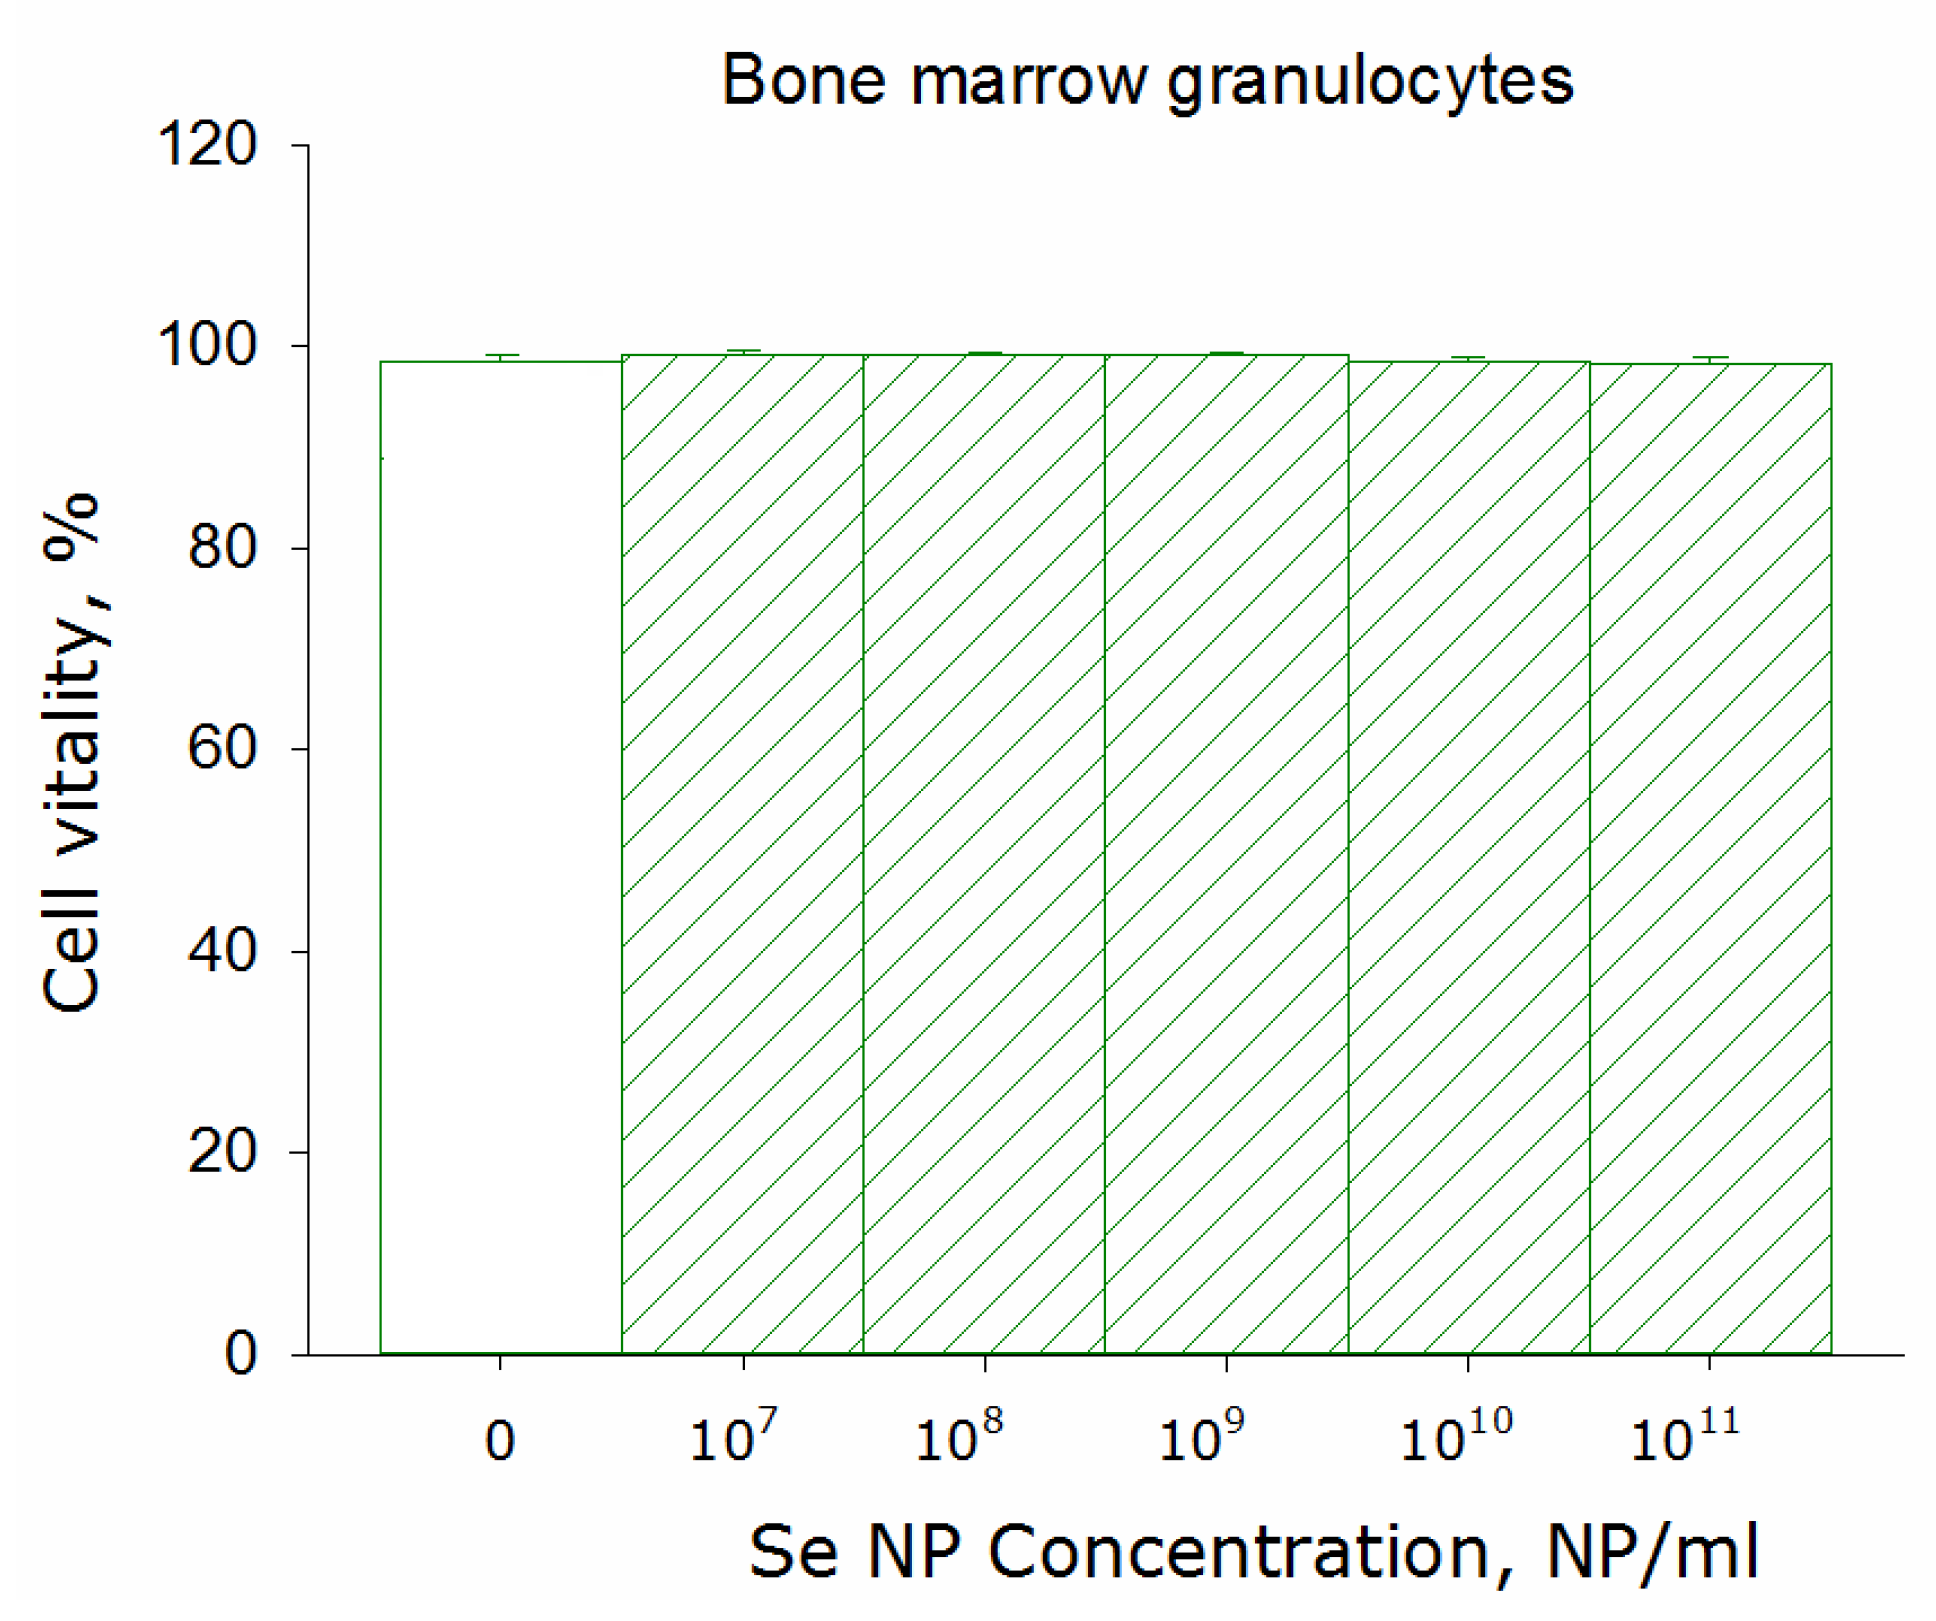
2.7. Cytotoxicity Assay
2.8. Gene Expression
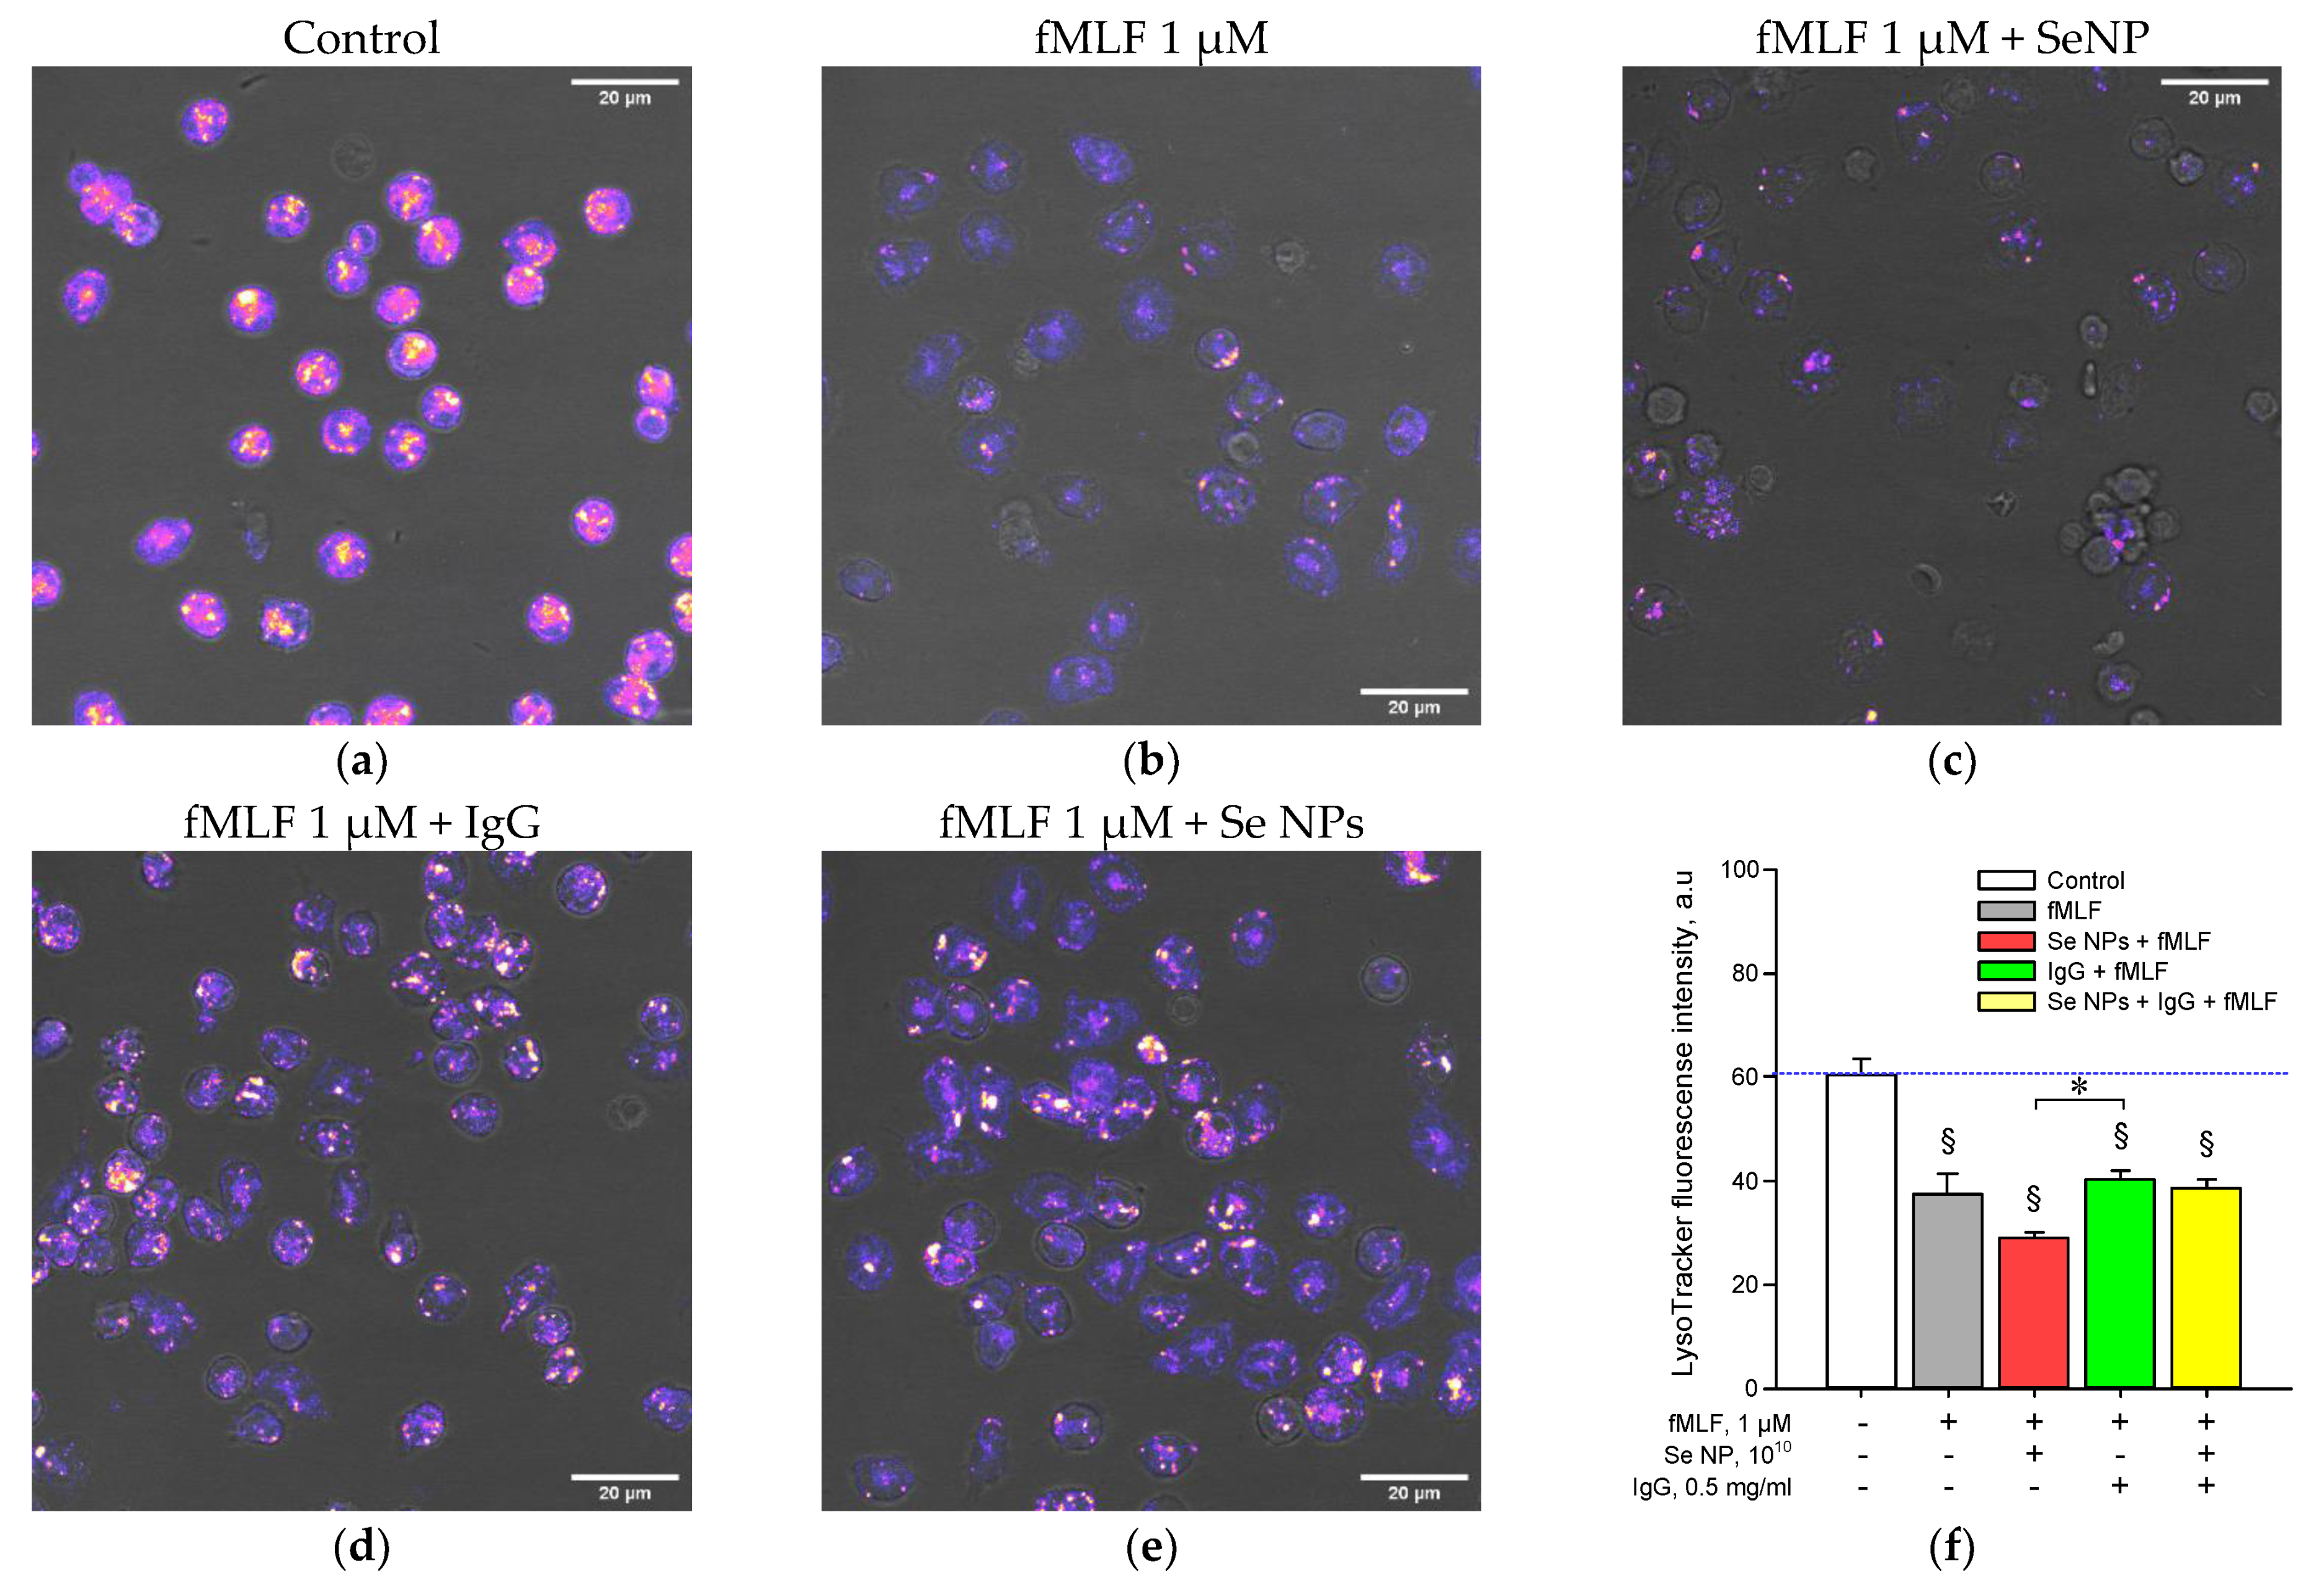
2.9. Degranulation Assay
2.10. Optical Research Methods
2.11. Statistics
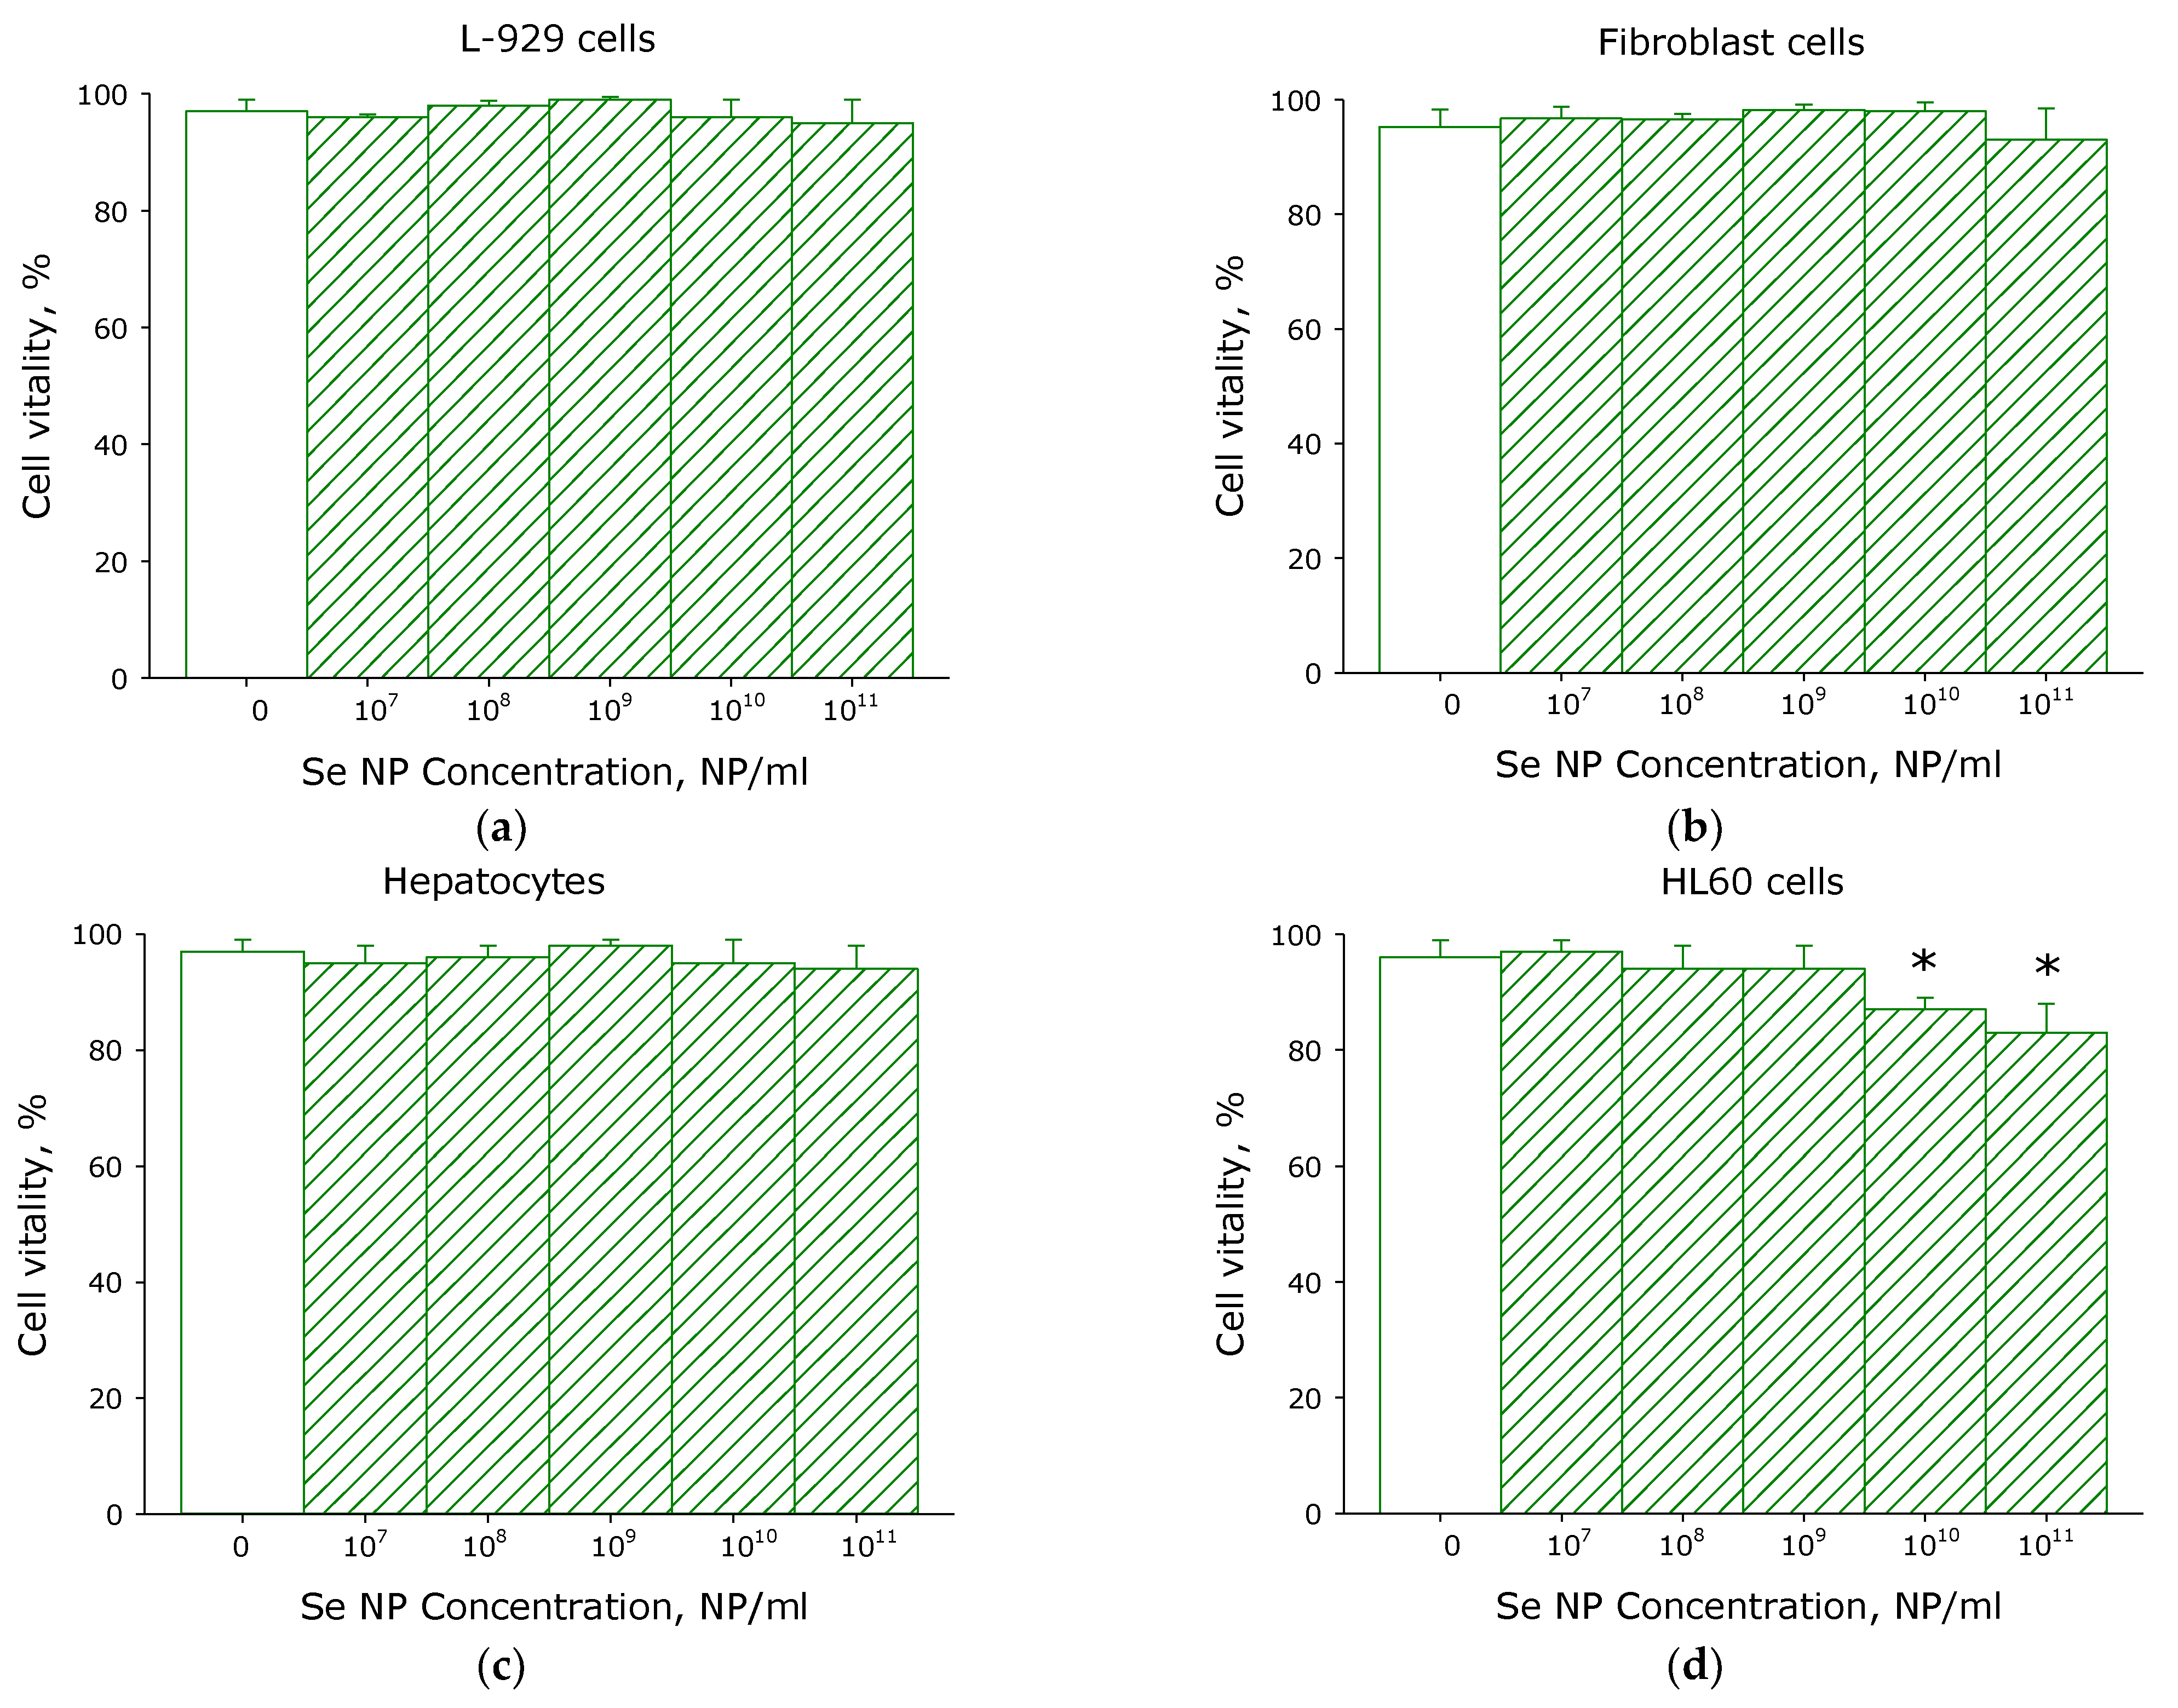
3. Results
4. Discussion
5. Conclusions
Author Contributions
Funding
Institutional Review Board Statement
Informed Consent Statement
Data Availability Statement
Conflicts of Interest
Appendix A


References
- Janghorbani, M.; Martin, R.F.; Kasper, L.J.; Sun, X.F.; Young, V.R. The selenite-exchangeable metabolic pool in humans: A new concept for the assessment of selenium status. Am. J. Clin. Nutr. 1990, 51, 670–677. [Google Scholar] [CrossRef] [PubMed]
- Zhang, Y.; Jin, J.; Huang, B.; Ying, H.; He, J.; Jiang, L. Selenium Metabolism and Selenoproteins in Prokaryotes: A Bioinformatics Perspective. Biomolecules 2022, 12, 917. [Google Scholar] [CrossRef] [PubMed]
- Veisa, V.; Kalere, I.; Zake, T.; Strele, I.; Makrecka-Kuka, M.; Upmale-Engela, S.; Skesters, A.; Rezeberga, D.; Lejnieks, A.; Pudule, I.; et al. Assessment of Iodine and Selenium Nutritional Status in Women of Reproductive Age in Latvia. Medicina 2021, 57, 1211. [Google Scholar] [CrossRef] [PubMed]
- Siddik, M.A.B.; Vatsos, I.N.; Rahman, M.A.; Pham, H.D. Selenium-Enriched Spirulina (SeE-SP) Enhance Antioxidant Response, Immunity, and Disease Resistance in Juvenile Asian Seabass, Lates calcarifer. Antioxidants 2022, 11, 1572. [Google Scholar] [CrossRef] [PubMed]
- Proshin, A.N.; Orlova, M.A.; Trofimova, T.P. Biological activity of some sulfur- and selenium-containing spiro compounds. Russ. Chem. Bull. 2017, 66, 1931–1933. [Google Scholar] [CrossRef]
- Gudkov, S.V.; Popova, N.R.; Bruskov, V.I. Radioprotective substances: History, trends and prospects. Biophysics 2015, 60, 659–667. [Google Scholar] [CrossRef]
- Guillin, O.M.; Vindry, C.; Ohlmann, T.; Chavatte, L. Selenium, Selenoproteins and Viral Infection. Nutrients 2019, 11, 2101. [Google Scholar] [CrossRef] [Green Version]
- Xia, H.; Zhang, L.; Dai, J.; Liu, X.; Zhang, X.; Zeng, Z.; Jia, Y. Effect of selenium and peroxynitrite on immune function of immature dendritic cells in humans. Med. Sci. Monit. Int. Med. J. Exp. Clin. Res. 2021, 27, e929004-1. [Google Scholar] [CrossRef]
- Zhang, L.; Xia, H.; Xia, K.; Liu, X.; Zhang, X.; Dai, J.; Zeng, Z.; Jia, Y. Selenium regulation of the immune function of dendritic cells in mice through the ERK, Akt and RhoA/ROCK pathways. Biol. Trace Elem. Res. 2021, 199, 3360–3370. [Google Scholar] [CrossRef]
- Varlamova, E.G.; Turovsky, E.A.; Babenko, V.A.; Plotnikov, E.Y. The Mechanisms Underlying the Protective Action of Selenium Nanoparticles against Ischemia/Reoxygenation Are Mediated by the Activation of the Ca2+ Signaling System of Astrocytes and Reactive Astrogliosis. Int. J. Mol. Sci. 2021, 22, 12825. [Google Scholar] [CrossRef]
- Kuropatkina, T.; Pavlova, O.; Gulyaev, M.; Pirogov, Y.; Khutorova, A.; Stvolinsky, S.; Medvedeva, N.; Medvedev, O. Sex-Dependent Protective Effect of Combined Application of Solubilized Ubiquinol and Selenium on Monocrotaline-Induced Pulmonary Hypertension in Wistar Rats. Antioxidants 2022, 11, 549. [Google Scholar] [CrossRef]
- Avery, J.C.; Hoffmann, P.R. Selenium, Selenoproteins, and Immunity. Nutrients 2018, 10, 1203. [Google Scholar] [CrossRef] [Green Version]
- Varlamova, E.G.; Turovsky, E.A.; Blinova, E.V. Therapeutic Potential and Main Methods of Obtaining Selenium Nanoparticles. Int. J. Mol. Sci. 2021, 22, 10808. [Google Scholar] [CrossRef]
- Bora, K.A.; Hashmi, S.; Zulfiqar, F.; Abideen, Z.; Ali, H.; Siddiqui, Z.S.; Siddique, K.H.M. Recent progress in bio-mediated synthesis and applications of engineered nanomaterials for sustainable agriculture. Front. Plant Sci. 2022, 13, 999505. [Google Scholar] [CrossRef]
- Khurana, A.; Tekula, S.; Saifi, M.A.; Venkatesh, P.; Godugu, C. Therapeutic applications of selenium nanoparticles. Biomed. Pharmacother. 2019, 111, 802–812. [Google Scholar] [CrossRef]
- Hosnedlova, B.; Kepinska, M.; Skalickova, S.; Fernandez, C.; Ruttkay-Nedecky, B.; Peng, Q.; Baron, M.; Melcova, M.; Opatrilova, R.; Zidkova, J. Nano-selenium and its nanomedicine applications: A critical review. Int. J. Nanomed. 2018, 13, 2107. [Google Scholar] [CrossRef] [Green Version]
- Varlamova, E.G.; Goltyaev, M.V.; Mal’tseva, V.N.; Turovsky, E.A.; Sarimov, R.M.; Simakin, A.V.; Gudkov, S.V. Mechanisms of the Cytotoxic Effect of Selenium Nanoparticles in Different Human Cancer Cell Lines. Int. J. Mol. Sci. 2021, 22, 7798. [Google Scholar] [CrossRef]
- Maiyo, F.; Singh, M. Selenium nanoparticles: Potential in cancer gene and drug delivery. Nanomedicine 2017, 12, 1075–1089. [Google Scholar] [CrossRef]
- Pi, J.; Shen, L.; Yang, E.; Shen, H.; Huang, D.; Wang, R.; Hu, C.; Jin, H.; Cai, H.; Cai, J.; et al. Macrophage-Targeted Isoniazid–Selenium Nanoparticles Promote Antimicrobial Immunity and Synergize Bactericidal Destruction of Tuberculosis Bacilli. Angew. Chem. Int. Ed. 2020, 59, 3226–3234. [Google Scholar] [CrossRef]
- Gautam, P.K.; Kumar, S.; Tomar, M.S.; Singh, R.K.; Acharya, A.; Kumar, S.; Ram, B. Selenium nanoparticles induce suppressed function of tumor associated macrophages and inhibit Dalton’s lymphoma proliferation. Biochem. Biophys. Rep. 2017, 12, 172–184. [Google Scholar] [CrossRef]
- Dung, N.T.; Trong, T.D.; Vu, N.T.; Binh, N.T.; Minh, T.T.L.; Luan, L.Q. Radiation Synthesis of Selenium Nanoparticles Capped with β-Glucan and Its Immunostimulant Activity in Cytoxan-Induced Immunosuppressed Mice. Nanomaterials 2021, 11, 2439. [Google Scholar] [CrossRef] [PubMed]
- Ferro, C.; Florindo, H.F.; Santos, H.A. Selenium Nanoparticles for Biomedical Applications: From Development and Characterization to Therapeutics. Adv. Healthc. Mater. 2021, 10, 2100598. [Google Scholar] [CrossRef] [PubMed]
- Gao, S.; Yang, X.; Xu, J.; Qiu, N.; Zhai, G. Nanotechnology for Boosting Cancer Immunotherapy and Remodeling Tumor Microenvironment: The Horizons in Cancer Treatment. ACS Nano 2021, 15, 12567–12603. [Google Scholar] [CrossRef] [PubMed]
- Zeng, Y.; Xiang, Y.; Sheng, R.; Tomás, H.; Rodrigues, J.; Gu, Z.; Zhang, H.; Gong, Q.; Luo, K. Polysaccharide-based nanomedicines for cancer immunotherapy: A review. Bioact. Mater. 2021, 6, 3358–3382. [Google Scholar] [CrossRef] [PubMed]
- Lin, A.; Loré, K. Granulocytes: New Members of the Antigen-Presenting Cell Family. Front. Immunol. 2017, 8, 1781. [Google Scholar] [CrossRef] [Green Version]
- Fingerhut, L.; Dolz, G.; De Buhr, N. What Is the Evolutionary Fingerprint in Neutrophil Granulocytes? Int. J. Mol. Sci. 2020, 21, 4523. [Google Scholar] [CrossRef]
- Peiseler, M.; Kubes, P. More friend than foe: The emerging role of neutrophils in tissue repair. J. Clin. Investig. 2019, 129, 2629–2639. [Google Scholar] [CrossRef] [Green Version]
- Stoiber, W.; Obermayer, A.; Steinbacher, P.; Krautgartner, W.-D. The Role of Reactive Oxygen Species (ROS) in the Formation of Extracellular Traps (ETs) in Humans. Biomolecules 2015, 5, 702–723. [Google Scholar] [CrossRef] [Green Version]
- Lehman, H.K.; Segal, B.H. The role of neutrophils in host defense and disease. J. Allergy Clin. Immunol. 2020, 145, 1535–1544. [Google Scholar] [CrossRef]
- Phillipson, M.; Kubes, P. The neutrophil in vascular inflammation. Nat. Med. 2011, 17, 1381–1390. [Google Scholar] [CrossRef]
- Kang, H.; Seo, J.; Yang, E.-J.; Choi, I.-H. Silver Nanoparticles Induce Neutrophil Extracellular Traps Via Activation of PAD and Neutrophil Elastase. Biomolecules 2021, 11, 317. [Google Scholar] [CrossRef]
- Galvão, I.; Athayde, R.M.; Perez, D.A.; Reis, A.C.; Rezende, L.; De Oliveira, V.L.S.; Rezende, B.M.; Gonçalves, W.A.; Sousa, L.P.; Teixeira, M.M.; et al. ROCK Inhibition Drives Resolution of Acute Inflammation by Enhancing Neutrophil Apoptosis. Cells 2019, 8, 964. [Google Scholar] [CrossRef] [Green Version]
- Vinolo, M.A.R.; Rodrigues, H.G.; Nachbar, R.T.; Curi, R. Regulation of Inflammation by Short Chain Fatty Acids. Nutrients 2011, 3, 858–876. [Google Scholar] [CrossRef] [Green Version]
- Gál, P.; Varinská, L.; Fáber, L.; Novák, Š.; Szabo, P.; Mitrengová, P.; Mirossay, A.; Mučaji, P.; Smetana, K. How Signaling Molecules Regulate Tumor Microenvironment: Parallels to Wound Repair. Molecules 2017, 22, 1818. [Google Scholar] [CrossRef] [Green Version]
- Chiu, M.L.; Goulet, D.R.; Teplyakov, A.; Gilliland, G.L. Antibody Structure and Function: The Basis for Engineering Therapeutics. Antibodies 2019, 8, 55. [Google Scholar] [CrossRef] [Green Version]
- Wang, Y.; Jönsson, F. Expression, Role, and Regulation of Neutrophil Fcγ Receptors. Front. Immunol. 2019, 10, 1958. [Google Scholar] [CrossRef]
- Carlos, R.; Eileen, U.-Q. Neutrophil Activation by Antibody Receptors Periodical Neutrophil Activation by Antibody Receptors. 2018, Chapter 3. Available online: https://www.intechopen.com/chapters/63248 (accessed on 3 October 2022).
- Lehmann, K.; Müller, J.P.; Schlott, B.; Skroblin, P.; Barz, D.; Norgauer, J.; Wetzker, R. PI3Kγ controls oxidative bursts in neutrophils via interactions with PKCα and p47phox. Biochem. J. 2009, 419, 603–610. [Google Scholar] [CrossRef] [Green Version]
- Zeng, H. Selenium as an essential micronutrient: Roles in cell cycle and apoptosis. Molecules 2009, 14, 1263–1278. [Google Scholar] [CrossRef] [Green Version]
- Gopalakrishna, R.; Jaken, S. Protein kinase C signaling and oxidative stress. Free Radic. Biol. Med. 2000, 28, 1349–1361. [Google Scholar] [CrossRef]
- Unni, E.; Koul, D.; Yung, W.K.; Sinha, R. Se-methylselenocysteine inhibits phosphatidylinositol 3-kinase activity of mouse mammary epithelial tumor cells in vitro. Breast Cancer Res. BCR 2005, 7, R699–R707. [Google Scholar] [CrossRef]
- Ayyyzhy, K.O.; Voronov, V.V.; Gudkov, S.V.; Rakov, I.I.; Simakin, A.V.; Shafeev, G.A. Laser Fabrication and Fragmentation of Selenium Nanoparticles in Aqueous Media. Phys. Wave Phenom. 2019, 27, 113–118. [Google Scholar] [CrossRef]
- Simakin, A.V.; Baimler, I.V.; Smirnova, V.V.; Uvarov, O.V.; Kozlov, V.A.; Gudkov, S.V. Evolution of the Size Distribution of Gold Nanoparticles under Laser Irradiation. Phys. Wave Phenom. 2021, 29, 102–107. [Google Scholar] [CrossRef]
- Filina, J.V.; Gabdoulkhakova, A.G.; Safronova, V.G. RhoA/ROCK downregulates FPR2-mediated NADPH oxidase activation in mouse bone marrow granulocytes. Cell. Signal. 2014, 26, 2138–2146. [Google Scholar] [CrossRef]
- Hao, L.; Marshall, A.J.; Liu, L. Bam32/DAPP1-Dependent Neutrophil Reactive Oxygen Species in WKYMVm-Induced Microvascular Hyperpermeability. Front. Immunol. 2020, 11, 1028. [Google Scholar] [CrossRef] [PubMed]
- Sokolov, A.V.; Kostevich, V.A.; Varfolomeeva, E.Y.; Grigorieva, D.V.; Gorudko, I.V.; Kozlov, S.O.; Kudryavtsev, I.V.; Mikhalchik, E.V.; Filatov, M.V.; Cherenkevich, S.N.; et al. Capacity of ceruloplasmin to scavenge products of the respiratory burst of neutrophils is not altered by the products of reactions catalyzed by myeloperoxidase. Biochem. Cell Biol. Biochim. Et Biol. Cell. 2018, 96, 457–467. [Google Scholar] [CrossRef] [Green Version]
- Safronova, V.G.; Vulfius, C.A.; Astashev, M.E.; Tikhonova, I.V.; Serov, D.A.; Jirova, E.A.; Pershina, E.V.; Senko, D.A.; Zhmak, M.N.; Kasheverov, I.E. α9α10 nicotinic acetylcholine receptors regulate murine bone marrow granulocyte functions. Immunobiology 2021, 226, 152047. [Google Scholar] [CrossRef]
- Turovsky, E.A.; Turovskaya, M.V.; Berezhnov, A.V.; Tolmacheva, A.V.; Kaimachnikov, N.P.; Dolgacheva, L.P.; Zinchenko, V.P.; Maevskii, E.I.; Dynnik, V.V. Convergence of Ca2+ signaling pathways in adipocytes. The role of L-arginine and protein kinase G in generation of transient and periodic Ca2+ signals. Biochem. Suppl. Ser. A Membr. Cell Biol. 2012, 6, 35–44. [Google Scholar] [CrossRef]
- Serov, D.; Tikhonova, I.; Safronova, V.; Astashev, M. Calcium activity in response to nAChR ligands in murine bone marrow granulocytes with different Gr-1 expression. Cell Biol. Int. 2021, 45, 1533–1545. [Google Scholar] [CrossRef]
- Serov, D.; Astashev, M.; Tikhonova, I.; Safronova, V. The Influence of Exogenous ATP on Functional Responses of Murine Bone Marrow Granulocytes. Biol. Membr. 2019, 36, 61–71. [Google Scholar] [CrossRef]
- Sharapov, M.G.; Novoselov, V.I.; Fesenko, E.E.; Bruskov, V.I.; Gudkov, S.V. The role of peroxiredoxin 6 in neutralization of X-ray mediated oxidative stress: Effects on gene expression, preservation of radiosensitive tissues and postradiation survival of animals. Free. Radic. Res. 2017, 51, 148–166. [Google Scholar] [CrossRef]
- Gudkov, S.V.; Gudkova, O.Y.; Chernikov, A.V.; Bruskov, V.I. Protection of mice against X-ray injuries by the post-irradiation administration of guanosine and inosine. Int. J. Radiat. Biol. 2009, 85, 116–125. [Google Scholar] [CrossRef]
- Sharapov, M.G.; Novoselov, V.I.; Samygina, V.R.; Konarev, P.V.; Molochkov, A.V.; Sekirin, A.B.; Balkanov, A.S.; Gudkov, S.V. A chimeric recombinant protein with peroxidase and superoxide dismutase activities: Physico-chemical characterization and applicability to neutralize oxidative stress caused by ionizing radiation. Biochem. Eng. J. 2020, 159, 107603. [Google Scholar] [CrossRef]
- Sheshachalam, A.; Baier, A.; Eitzen, G. The effect of Rho drugs on mast cell activation and degranulation. J. Leukoc. Biol. 2017, 102, 71–81. [Google Scholar] [CrossRef] [Green Version]
- Penkov, N.V. Temporal Dynamics of the Scattering Properties of Deionized Water. Phys. Wave Phenom. 2020, 28, 135–139. [Google Scholar] [CrossRef]
- Sarimov, R.M.; Lednev, V.N.; Sibirev, A.V.; Gudkov, S.V. The Use of Fluorescence Spectra for the Detection of Scab and Rot in Fruit and Vegetable Crops. Front. Phys. 2021, 8, 640887. [Google Scholar] [CrossRef]
- Nagaev, E.I.; Baimler, I.V.; Baryshev, A.S.; Astashev, M.E.; Gudkov, S.V. Effect of Laser-Induced Optical Breakdown on the Structure of Bsa Molecules in Aqueous Solutions: An Optical Study. Molecules 2022, 27, 6752. [Google Scholar] [CrossRef]
- Aimmler, R.; Simon, S.I.; Sperandio, M. Calcium signalling and related ion channels in neutrophil recruitment and function. Eur. J. Clin. Investig. 2018, 48, e12964. [Google Scholar] [CrossRef]
- Barkur, S.; Lukose, J.; Chidangil, S. Probing Nanoparticle–Cell Interaction Using Micro-Raman Spectroscopy: Silver and Gold Nanoparticle-Induced Stress Effects on Optically Trapped Live Red Blood Cells. ACS Omega 2020, 5, 1439–1447. [Google Scholar] [CrossRef]
- Li, L.; Mu, Q.; Zhang, B.; Yan, B. Analytical strategies for detecting nanoparticle-protein interactions. Analyst 2010, 135, 1519–1530. [Google Scholar] [CrossRef] [Green Version]
- Shen, X.C.; Liou, X.Y.; Ye, L.P.; Liang, H.; Wang, Z.Y. Spectroscopic studies on the interaction between human hemoglobin and CdS quantum dots. J. Colloid Interface Sci. 2007, 311, 400–406. [Google Scholar] [CrossRef]
- Huang, R.; Carney, R.P.; Stellacci, F.; Lau, B.L.T. Protein–nanoparticle interactions: The effects of surface compositional and structural heterogeneity are scale dependent. Nanoscale 2013, 5, 6928–6935. [Google Scholar] [CrossRef] [PubMed] [Green Version]
- Ferreira, L.F.; Picco, A.S.; Galdino, F.E.; Albuquerque, L.J.C.; Berret, J.-F.; Cardoso, M.B. Nanoparticle–Protein Interaction: Demystifying the Correlation between Protein Corona and Aggregation Phenomena. ACS Appl. Mater. Interfaces 2022, 14, 28559–28569. [Google Scholar] [CrossRef] [PubMed]
- Lombaert, I.M.; Wierenga, P.K.; Kok, T.; Kampinga, H.H.; Dehaan, G.; Coppes, R.P. Mobilization of bone marrow stem cells by granulocyte colony-stimulating factor ameliorates radiation-induced damage to salivary glands. Clin. Cancer Res. 2006, 12, 1804–1812. [Google Scholar] [CrossRef] [PubMed] [Green Version]
- Zaichkina, S.I.; Rozanova, O.M.; Aptikaeva, G.F.; Achmadieva, A.C.; Klokov, D.Y. Low Doses of Gamma-Radiation Induce Nonlinear Dose Responses in Mammalian and Plant Cells. Nonlinearity Biol. Toxicol. Med. 2004, 2, 15401420490519861. [Google Scholar] [CrossRef] [PubMed] [Green Version]
- Cartwright, G.; Athens, J.; Wintrobe, M. Analytical review: The kinetics of granulopoiesis in normal man. Blood 1964, 24, 780–803. [Google Scholar] [CrossRef]
- Bratton, D.L.; Henson, P.M. Neutrophil clearance: When the party is over, clean-up begins. Trends Immunol. 2011, 32, 350–357. [Google Scholar] [CrossRef] [Green Version]
- Khawaja, A.A.; Pericleous, C.; Ripoll, V.M.; Porter, J.C.; Giles, I.P. Autoimmune rheumatic disease IgG has differential effects upon neutrophil integrin activation that is modulated by the endothelium. Sci. Rep. 2019, 9, 1283. [Google Scholar] [CrossRef] [Green Version]
- Robinson, J.; Watson, F.; Bucknall, R.C.; Edwards, S.W. Activation of neutrophil reactive-oxidant production by synovial fluid from patients with inflammatory joint disease. Soluble and insoluble immunoglobulin aggregates activate different pathways in primed and unprimed cells. Biochem. J. 1992, 286, 345–351. [Google Scholar] [CrossRef] [Green Version]
- Fossati, G.; Bucknall, R.C.; Edwards, S.W. Insoluble and soluble immune complexes activate neutrophils by distinct activation mechanisms: Changes in functional responses induced by priming with cytokines. Ann. Rheum. Dis. 2002, 61, 13–19. [Google Scholar] [CrossRef] [Green Version]
- Llewellyn, D.; De Cassan, S.C.; Williams, A.R.; Douglas, A.D.; Forbes, E.K.; Adame-Gallegos, J.R.; Shi, J.; Pleass, R.J.; Draper, S.J. Assessment of antibody-dependent respiratory burst activity from mouse neutrophils on Plasmodium yoelii malaria challenge outcome. J. Leukoc. Biol. 2014, 95, 369–382. [Google Scholar] [CrossRef]
- Napolitano, F.; Rossi, F.W.; Pesapane, A.; Varricchio, S.; Ilardi, G.; Mascolo, M.; Staibano, S.; Lavecchia, A.; Ragno, P.; Selleri, C.; et al. N-Formyl Peptide Receptors Induce Radical Oxygen Production in Fibroblasts Derived From Systemic Sclerosis by Interacting With a Cleaved Form of Urokinase Receptor. Front. Immunol. 2018, 9, 574. [Google Scholar] [CrossRef] [Green Version]
- He, H.-Q.; Ye, R.D. The Formyl Peptide Receptors: Diversity of Ligands and Mechanism for Recognition. Molecules 2017, 22, 455. [Google Scholar] [CrossRef] [Green Version]
- Christophe, T.; Karlsson, A.; Dugave, C.; Rabiet, M.J.; Boulay, F.; Dahlgren, C. The synthetic peptide Trp-Lys-Tyr-Met-Val-Met-NH2 specifically activates neutrophils through FPRL1/lipoxin A4 receptors and is an agonist for the orphan monocyte-expressed chemoattractant receptor FPRL2. J. Biol. Chem. 2001, 276, 21585–21593. [Google Scholar] [CrossRef] [Green Version]
- Forsman, H.; Kalderén, C.; Nordin, A.; Nordling, E.; Jensen, A.J.; Dahlgren, C. Stable formyl peptide receptor agonists that activate the neutrophil NADPH-oxidase identified through screening of a compound library. Biochem. Pharmacol. 2011, 81, 402–411. [Google Scholar] [CrossRef] [Green Version]
- Belambri, S.A.; Rolas, L.; Raad, H.; Hurtado-Nedelec, M.; Dang, P.M.-C.; El-Benna, J. NADPH oxidase activation in neutrophils: Role of the phosphorylation of its subunits. Eur. J. Clin. Investig. 2018, 48, e12951. [Google Scholar] [CrossRef] [Green Version]
- Jaconi, M.E.; Rivest, R.W.; Schlegel, W.; Wollheim, C.B.; Pittet, D.; Lew, P.D. Spontaneous and chemoattractant-induced oscillations of cytosolic free calcium in single adherent human neutrophils. J. Biol. Chem. 1988, 263, 10557–10560. [Google Scholar] [CrossRef]
- Forsman, H.; Dahlgren, C. The FPR2-induced rise in cytosolic calcium in human neutrophils relies on an emptying of intracellular calcium stores and is inhibited by a gelsolin-derived PIP2-binding peptide. BMC Cell Biol. 2010, 11, 52. [Google Scholar] [CrossRef] [Green Version]
- Dahlgren, C.; Holdfeldt, A.; Lind, S.; Mårtensson, J.; Gabl, M.; Björkman, L.; Sundqvist, M.; Forsman, H. Neutrophil Signaling That Challenges Dogmata of G Protein-Coupled Receptor Regulated Functions. ACS Pharmacol. Transl. Sci. 2020, 3, 203–220. [Google Scholar] [CrossRef]
- Zheng, Y.; Zhong, L.; Shen, X. Effect of selenium-supplement on the calcium signaling in human endothelial cells. J. Cell. Physiol. 2005, 205, 97–106. [Google Scholar] [CrossRef]
- Uğuz, A.C.; Nazıroğlu, M. Effects of Selenium on Calcium Signaling and Apoptosis in Rat Dorsal Root Ganglion Neurons Induced by Oxidative Stress. Neurochem. Res. 2012, 37, 1631–1638. [Google Scholar] [CrossRef]
- Safir, N.; Wendel, A.; Saile, R.; Chabraoui, L. The effect of selenium on immune functions of J774.1 cells. Clin. Chem. Lab. Med. 2003, 41, 1005–1011. [Google Scholar] [CrossRef] [PubMed]
- Zhang, W.; Voice, J.; Lachmann, P.J. A systematic study of neutrophil degranulation and respiratory burst in vitro by defined immune complexes. Clin. Exp. Immunol. 1995, 101, 507–514. [Google Scholar] [CrossRef] [PubMed]
- Hugejiletu, H.; Bobe, G.; Vorachek, W.R.; Gorman, M.E.; Mosher, W.D.; Pirelli, G.J.; Hall, J.A. Selenium Supplementation Alters Gene Expression Profiles Associated with Innate Immunity in Whole-Blood Neutrophils of Sheep. Biol. Trace Elem. Res. 2013, 154, 28–44. [Google Scholar] [CrossRef] [PubMed]
- Li, X.; Xing, M.; Chen, M.; Zhao, J.; Fan, R.; Zhao, X.; Cao, C.; Yang, J.; Zhang, Z.; Xu, S. Effects of selenium-lead interaction on the gene expression of inflammatory factors and selenoproteins in chicken neutrophils. Ecotoxicol. Environ. Saf. 2017, 139, 447–453. [Google Scholar] [CrossRef] [PubMed]
- Li, W.; Khor, T.O.; Xu, C.; Shen, G.; Jeong, W.-S.; Yu, S.; Kong, A.-N. Activation of Nrf2-antioxidant signaling attenuates NFκB-inflammatory response and elicits apoptosis. Biochem. Pharmacol. 2008, 76, 1485–1489. [Google Scholar] [CrossRef] [Green Version]
- Dabravolski, S.A.; Sukhorukov, V.N.; Kalmykov, V.A.; Orekhov, N.A.; Grechko, A.V.; Orekhov, A.N. Heat Shock Protein 90 as Therapeutic Target for CVDs and Heart Ageing. Int. J. Mol. Sci. 2022, 23, 649. [Google Scholar] [CrossRef]
- Liu, J.; Yang, Y.; Zeng, X.; Bo, L.; Jiang, S.; Du, X.; Xie, Y.; Jiang, R.; Zhao, J.; Song, W. Investigation of selenium pretreatment in the attenuation of lung injury in rats induced by fine particulate matters. Environ. Sci. Pollut. Res. 2017, 24, 4008–4017. [Google Scholar] [CrossRef]
- Javdani, M.; Habibi, A.; Shirian, S.; Kojouri, G.A.; Hosseini, F. Effect of Selenium Nanoparticle Supplementation on Tissue Inflammation, Blood Cell Count, and IGF-1 Levels in Spinal Cord Injury-Induced Rats. Biol. Trace Elem. Res. 2019, 187, 202–211. [Google Scholar] [CrossRef]
- Sarimov, R.M.; Binhi, V.N.; Matveeva, T.A.; Penkov, N.V.; Gudkov, S.V. Unfolding and Aggregation of Lysozyme under the Combined Action of Dithiothreitol and Guanidine Hydrochloride: Optical Studies. Int. J. Mol. Sci. 2021, 22, 2710. [Google Scholar] [CrossRef]
- Biswas, B.; Muttathukattil, A.N.; Reddy, G.; Singh, P.C. Contrasting Effects of Guanidinium Chloride and Urea on the Activity and Unfolding of Lysozyme. ACS Omega 2018, 3, 14119–14126. [Google Scholar] [CrossRef]
- Sarimov, R.M.; Matveyeva, T.A.; Binhi, V.N. Laser interferometry of the hydrolytic changes in protein solutions: The refractive index and hydration shells. J. Biol. Phys. 2018, 44, 345–360. [Google Scholar] [CrossRef]
- Teale, F.W.J.; Weber, G. Ultraviolet fluorescence of the aromatic amino acids. Biochem. J. 1957, 65, 476–482. [Google Scholar] [CrossRef]
- Bunkin, N.F.; Shkirin, A.V.; Lyakhov, G.A.; Kobelev, A.V.; Penkov, N.V.; Ugraitskaya, S.V.; Fesenko, E.E., Jr. Droplet-like heterogeneity of aqueous tetrahydrofuran solutions at the submicrometer scale. J. Chem. Phys. 2016, 145, 184501. [Google Scholar] [CrossRef]


| Genes | GenBank Accession | Oligonucleotide 5′-3′ | Amplicon Size, bp | |
|---|---|---|---|---|
| 1 | Actb | NM_007393.4 | CCTTCCTTCTTGGGTATGGAATCC | 115 |
| CACCAGACAGCACTGTGTTGGCA | ||||
| 2 | HSP90 | NM_011631 | GTCCGCCGTGTGTTCATCAT | 168 |
| GCACTTCTTGACGATGTTCTTGC | ||||
| 3 | KEAP-1 | NM_016679 | TGCCCCTGTGGTCAAAGT | 104 |
| GGTTCGGTTACCGTCCTGC | ||||
| 4 | NF-kb | NM_008689 | CCACGCTCAGCTTGTGAGGGAT | 106 |
| GGCCAAGTGCAGAGGTGTCTGAT | ||||
| 5 | NRF2 | NM_010902 | CTCGCTGGAAAAAGAAGTG | 240 |
| CCGTCCAGGAGTTCAGAGG | ||||
| 6 | Catalase | NM_009804 | AGCGACCAGATGAAGCAGTG | 181 |
| TCCGCTCTCTGTCAAAGTGTG | ||||
| 7 | SOD2 | NM_013671 | GCGGTCGTGTAAACCTCAT | 240 |
| CCAGAGCCTCGTGGTACTTC | ||||
| 8 | Prx6 | NM_007453 | TAAGGACAGGGACATTTCCATCC | 145 |
| CCGTGGAGTTAGGGTAGAGGA | ||||
| 9 | Xrcc4 | NM_028012 | GAGACACCGAATGCAGAAGA | 121 |
| GGTGCTCTCCTCTTTCAAGG | ||||
| 10 | Xrcc5 | NM_009533 | GAAGAACAGCGCTTCAACAG | 92 |
| TCCTGAACAACAATTTCCCA | ||||
| 11 | LigIV | NM_176953 | ATGGCTTCCTCACAAACTTCAC | 103 |
| TTTCTGCACGGTCTTTACCTTT | ||||
| 12 | TNFa | NM_013693 | ATGAGAAGTTCCCAAATGGC | 125 |
| CTCCACTTGGTGGTTTGCTA | ||||
| 13 | AP-1 | NM_010591 | CACGGAGAAGAAGCTCACAA | 126 |
| ACTTGTTACCGGTCCTCTGG | ||||
| 14 | Ki67 | NM_001081117 | ATCATTGACCGCTCCTTTAGGT | 104 |
| GCTCGCCTTGATGGTTCCT | ||||
| 15 | IL6 | NM_031168 | TAGTCCTTCCTACCCCAATTTCC | 76 |
| TTGGTCCTTAGCCACTCCTTC |
| SeNPs, NP/mL | Number of Animals | Number of Cells | Number of Cells with MN | Percentage of Cells with MN |
|---|---|---|---|---|
| 0 | 5 | 12560 | 69 | 0.55 ± 0.06 |
| 109 | 5 | 12758 | 73 | 0.57 ± 0.07 |
| 1010 | 5 | 12931 | 81 | 0.62 ± 0.06 |
| 1011 | 5 | 12652 | 90 | 0.71 ± 0.07 * |
| Genes | Relative Gene Expression | |||
|---|---|---|---|---|
| Control | Se NPs | IgG | Se NPs + IgG | |
| HO-1 | 1 | 0.64 ± 0.03 | 0.15 ± 0.01 | 0.48 ± 0.02 |
| HSP90 | 1 | 3.03 ± 0.58 * | 2.35 ± 0.51 * | 3.83 ± 0.78 * |
| NFkb | 1 | 1.80 ± 0.11 * | 0.67 ± 0.01 * | 2.60 ± 0.22 * |
| NRF2 | 1 | 1.43 ± 0.17 * | 0.93 ± 0.04 * | 0.71 ± 0.06 * |
| Catalase | 1 | 1.19 ± 0.12 * | 0.42 ± 0.00 * | 1.61 ± 0.12 * |
| SOD2 | 1 | 4.06 ± 0.34 * | 0.94 ± 0.01 * | 6.06 ± 0.17 * |
| Prx6 | 1 | 0.09 ± 0.01 * | 0.14 ± 0.02 * | 0.14 ± 0.01 * |
| Xrcc4 | 1 | 1.56 ± 0.12 * | 0.87 ± 0.03 * | 2.30 ± 0.06 * |
| Xrcc5 | 1 | 1.08 ± 0.13 | 0.92 ± 0.02 | 1.65 ± 0.15 |
| TNF-α | 1 | 1.72 ± 0.12 * | 0.94 ± 0.01 | 1.06 ± 0.11 |
| AP-1 | 1 | 1.12 ± 0.16 | 0.65 ± 0.06 | 1.41 ± 0.10 |
| Ki67 | 1 | 0.67 ± 0.02 * | 0.76 ± 0.02 * | 1.02 ± 0.13 |
| IL6 | 1 | 1.27 ± 0.12 * | 0.14±0.01 * | 2.00 ± 0.24 * |
Publisher’s Note: MDPI stays neutral with regard to jurisdictional claims in published maps and institutional affiliations. |
© 2022 by the authors. Licensee MDPI, Basel, Switzerland. This article is an open access article distributed under the terms and conditions of the Creative Commons Attribution (CC BY) license (https://creativecommons.org/licenses/by/4.0/).
Share and Cite
Khabatova, V.V.; Serov, D.A.; Tikhonova, I.V.; Astashev, M.E.; Nagaev, E.I.; Sarimov, R.M.; Matveyeva, T.A.; Simakin, A.V.; Gudkov, S.V. Selenium Nanoparticles Can Influence the Immune Response Due to Interactions with Antibodies and Modulation of the Physiological State of Granulocytes. Pharmaceutics 2022, 14, 2772. https://doi.org/10.3390/pharmaceutics14122772
Khabatova VV, Serov DA, Tikhonova IV, Astashev ME, Nagaev EI, Sarimov RM, Matveyeva TA, Simakin AV, Gudkov SV. Selenium Nanoparticles Can Influence the Immune Response Due to Interactions with Antibodies and Modulation of the Physiological State of Granulocytes. Pharmaceutics. 2022; 14(12):2772. https://doi.org/10.3390/pharmaceutics14122772
Chicago/Turabian StyleKhabatova, Venera V., Dmitriy A. Serov, Irina V. Tikhonova, Maxim E. Astashev, Egor I. Nagaev, Ruslan M. Sarimov, Tatiana A. Matveyeva, Alexander V. Simakin, and Sergey V. Gudkov. 2022. "Selenium Nanoparticles Can Influence the Immune Response Due to Interactions with Antibodies and Modulation of the Physiological State of Granulocytes" Pharmaceutics 14, no. 12: 2772. https://doi.org/10.3390/pharmaceutics14122772