
Cytoprotective Properties of a New Nanocomplex of Selenium with Taxifolin in the Cells of the Cerebral Cortex Exposed to Ischemia/Reoxygenation
 , , and
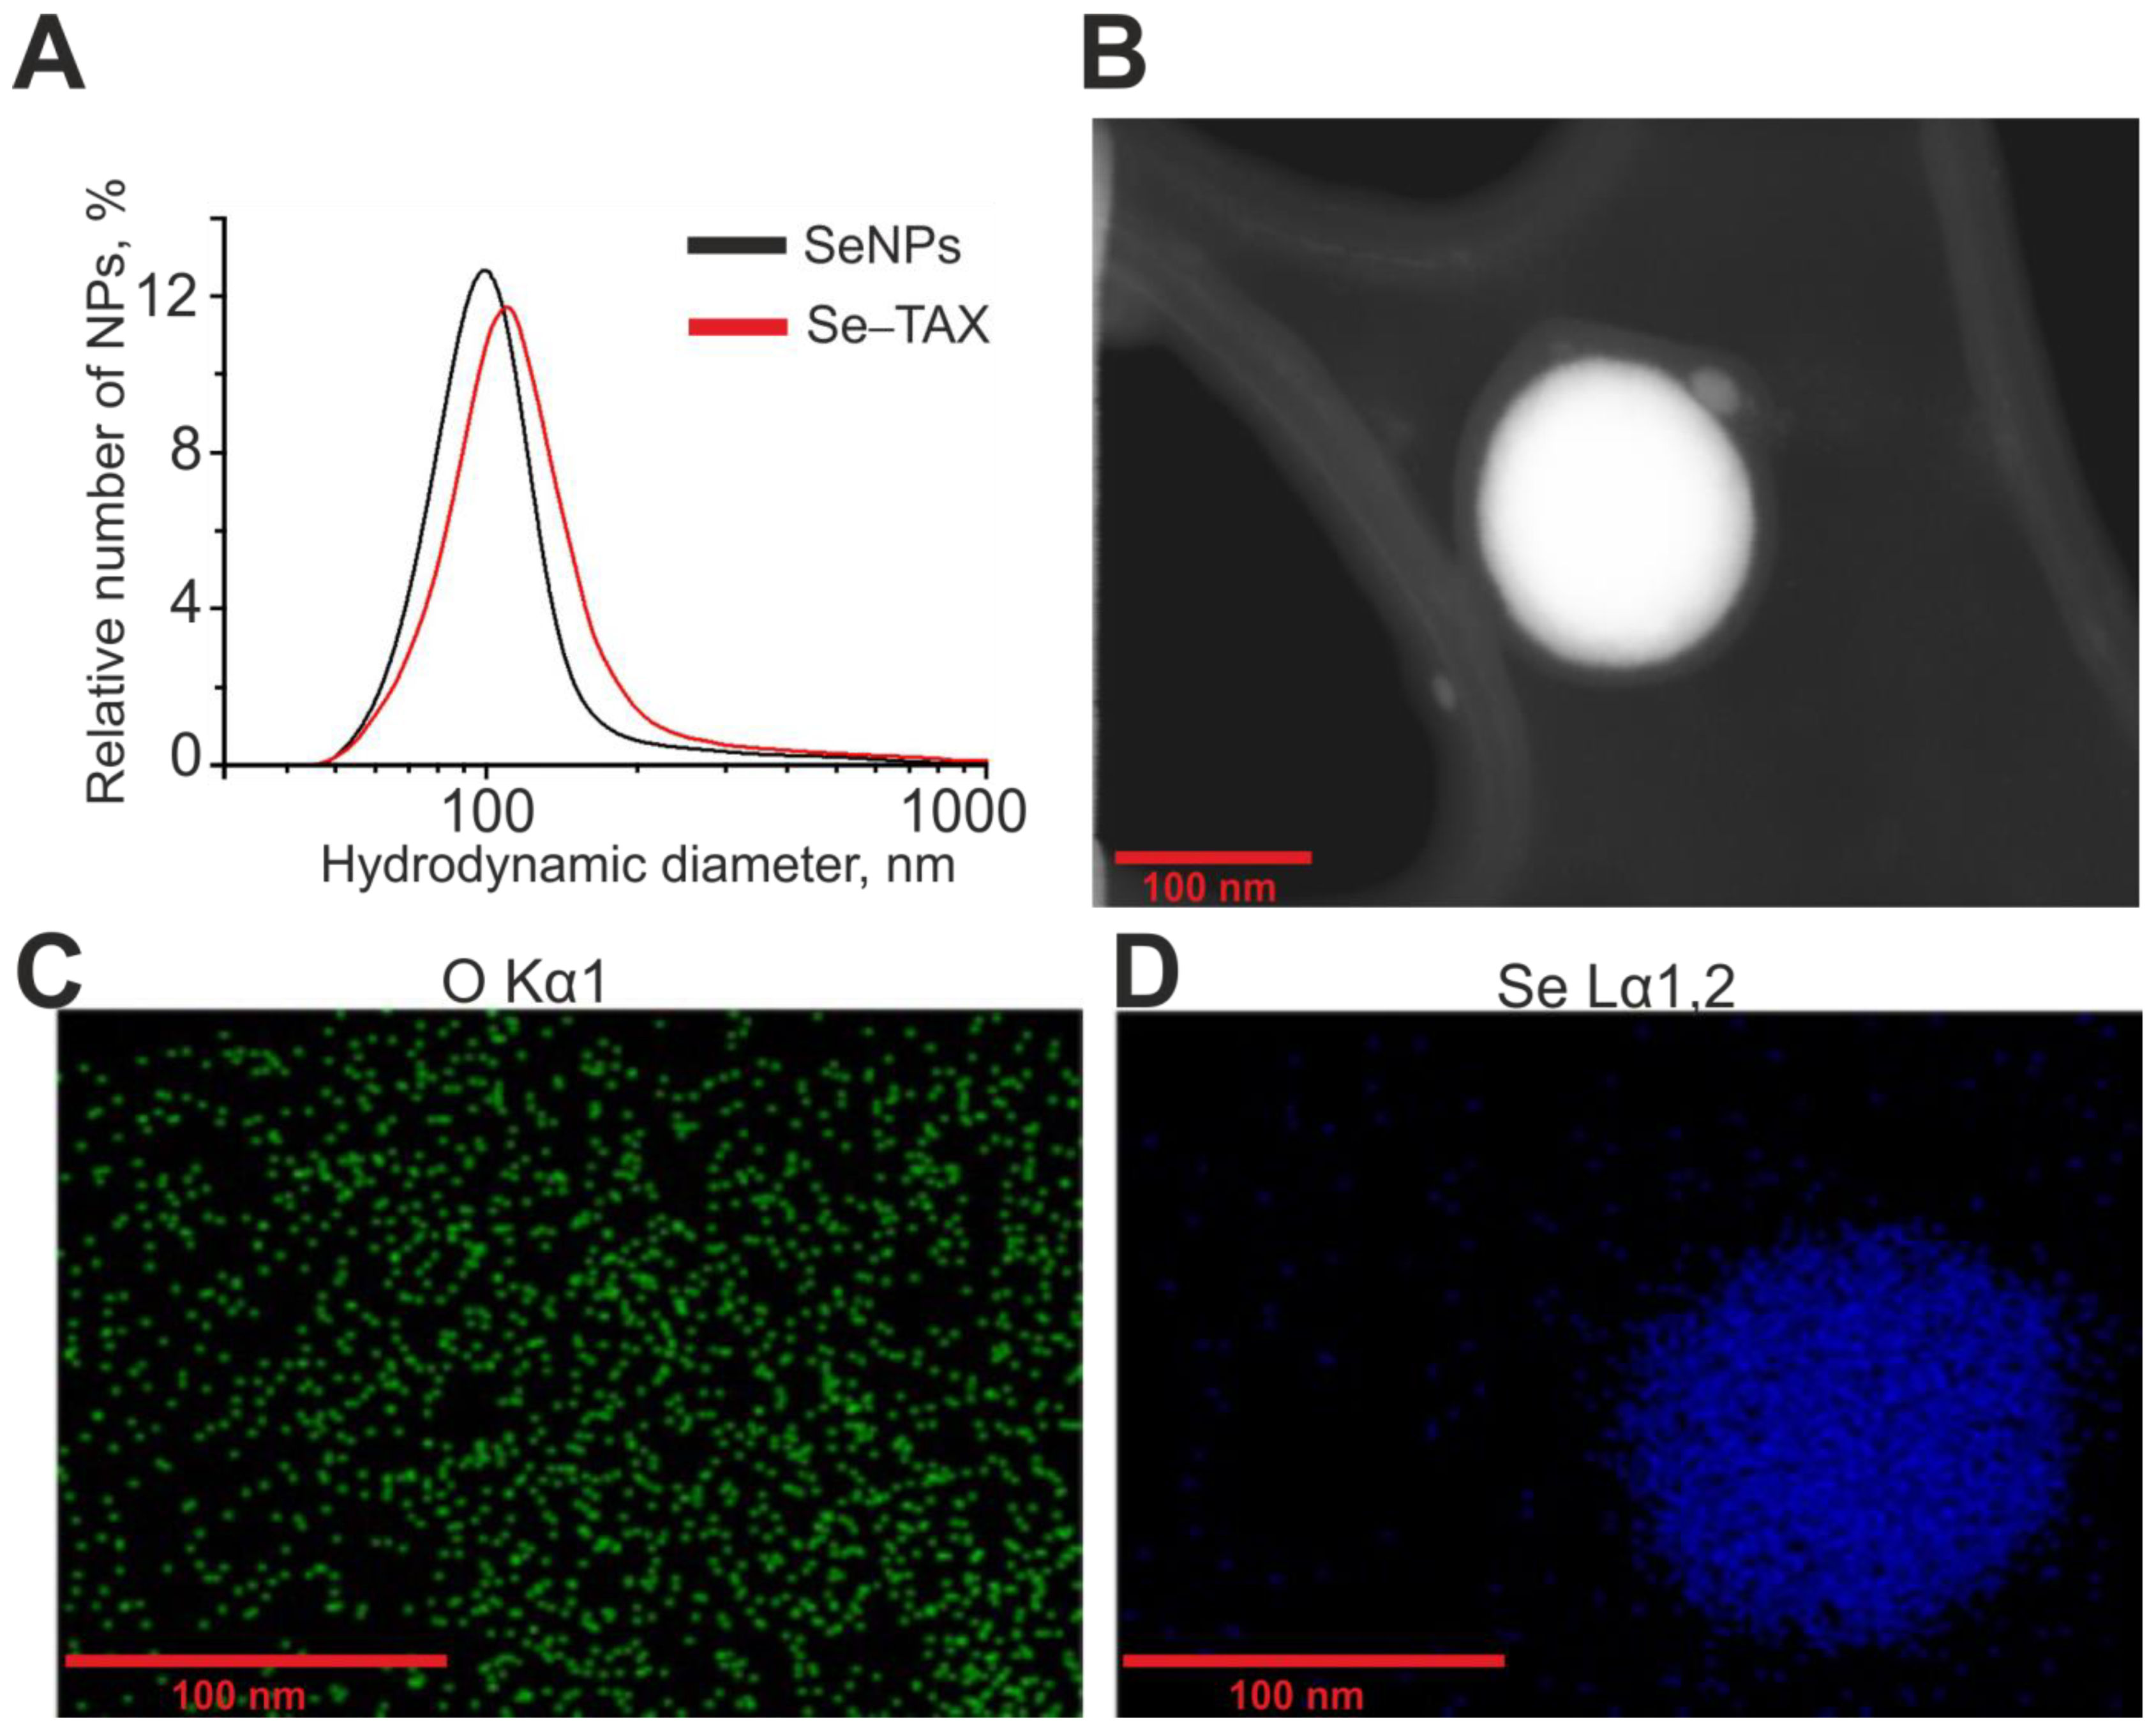
Abstract
:1. Introduction
2. Materials and Methods
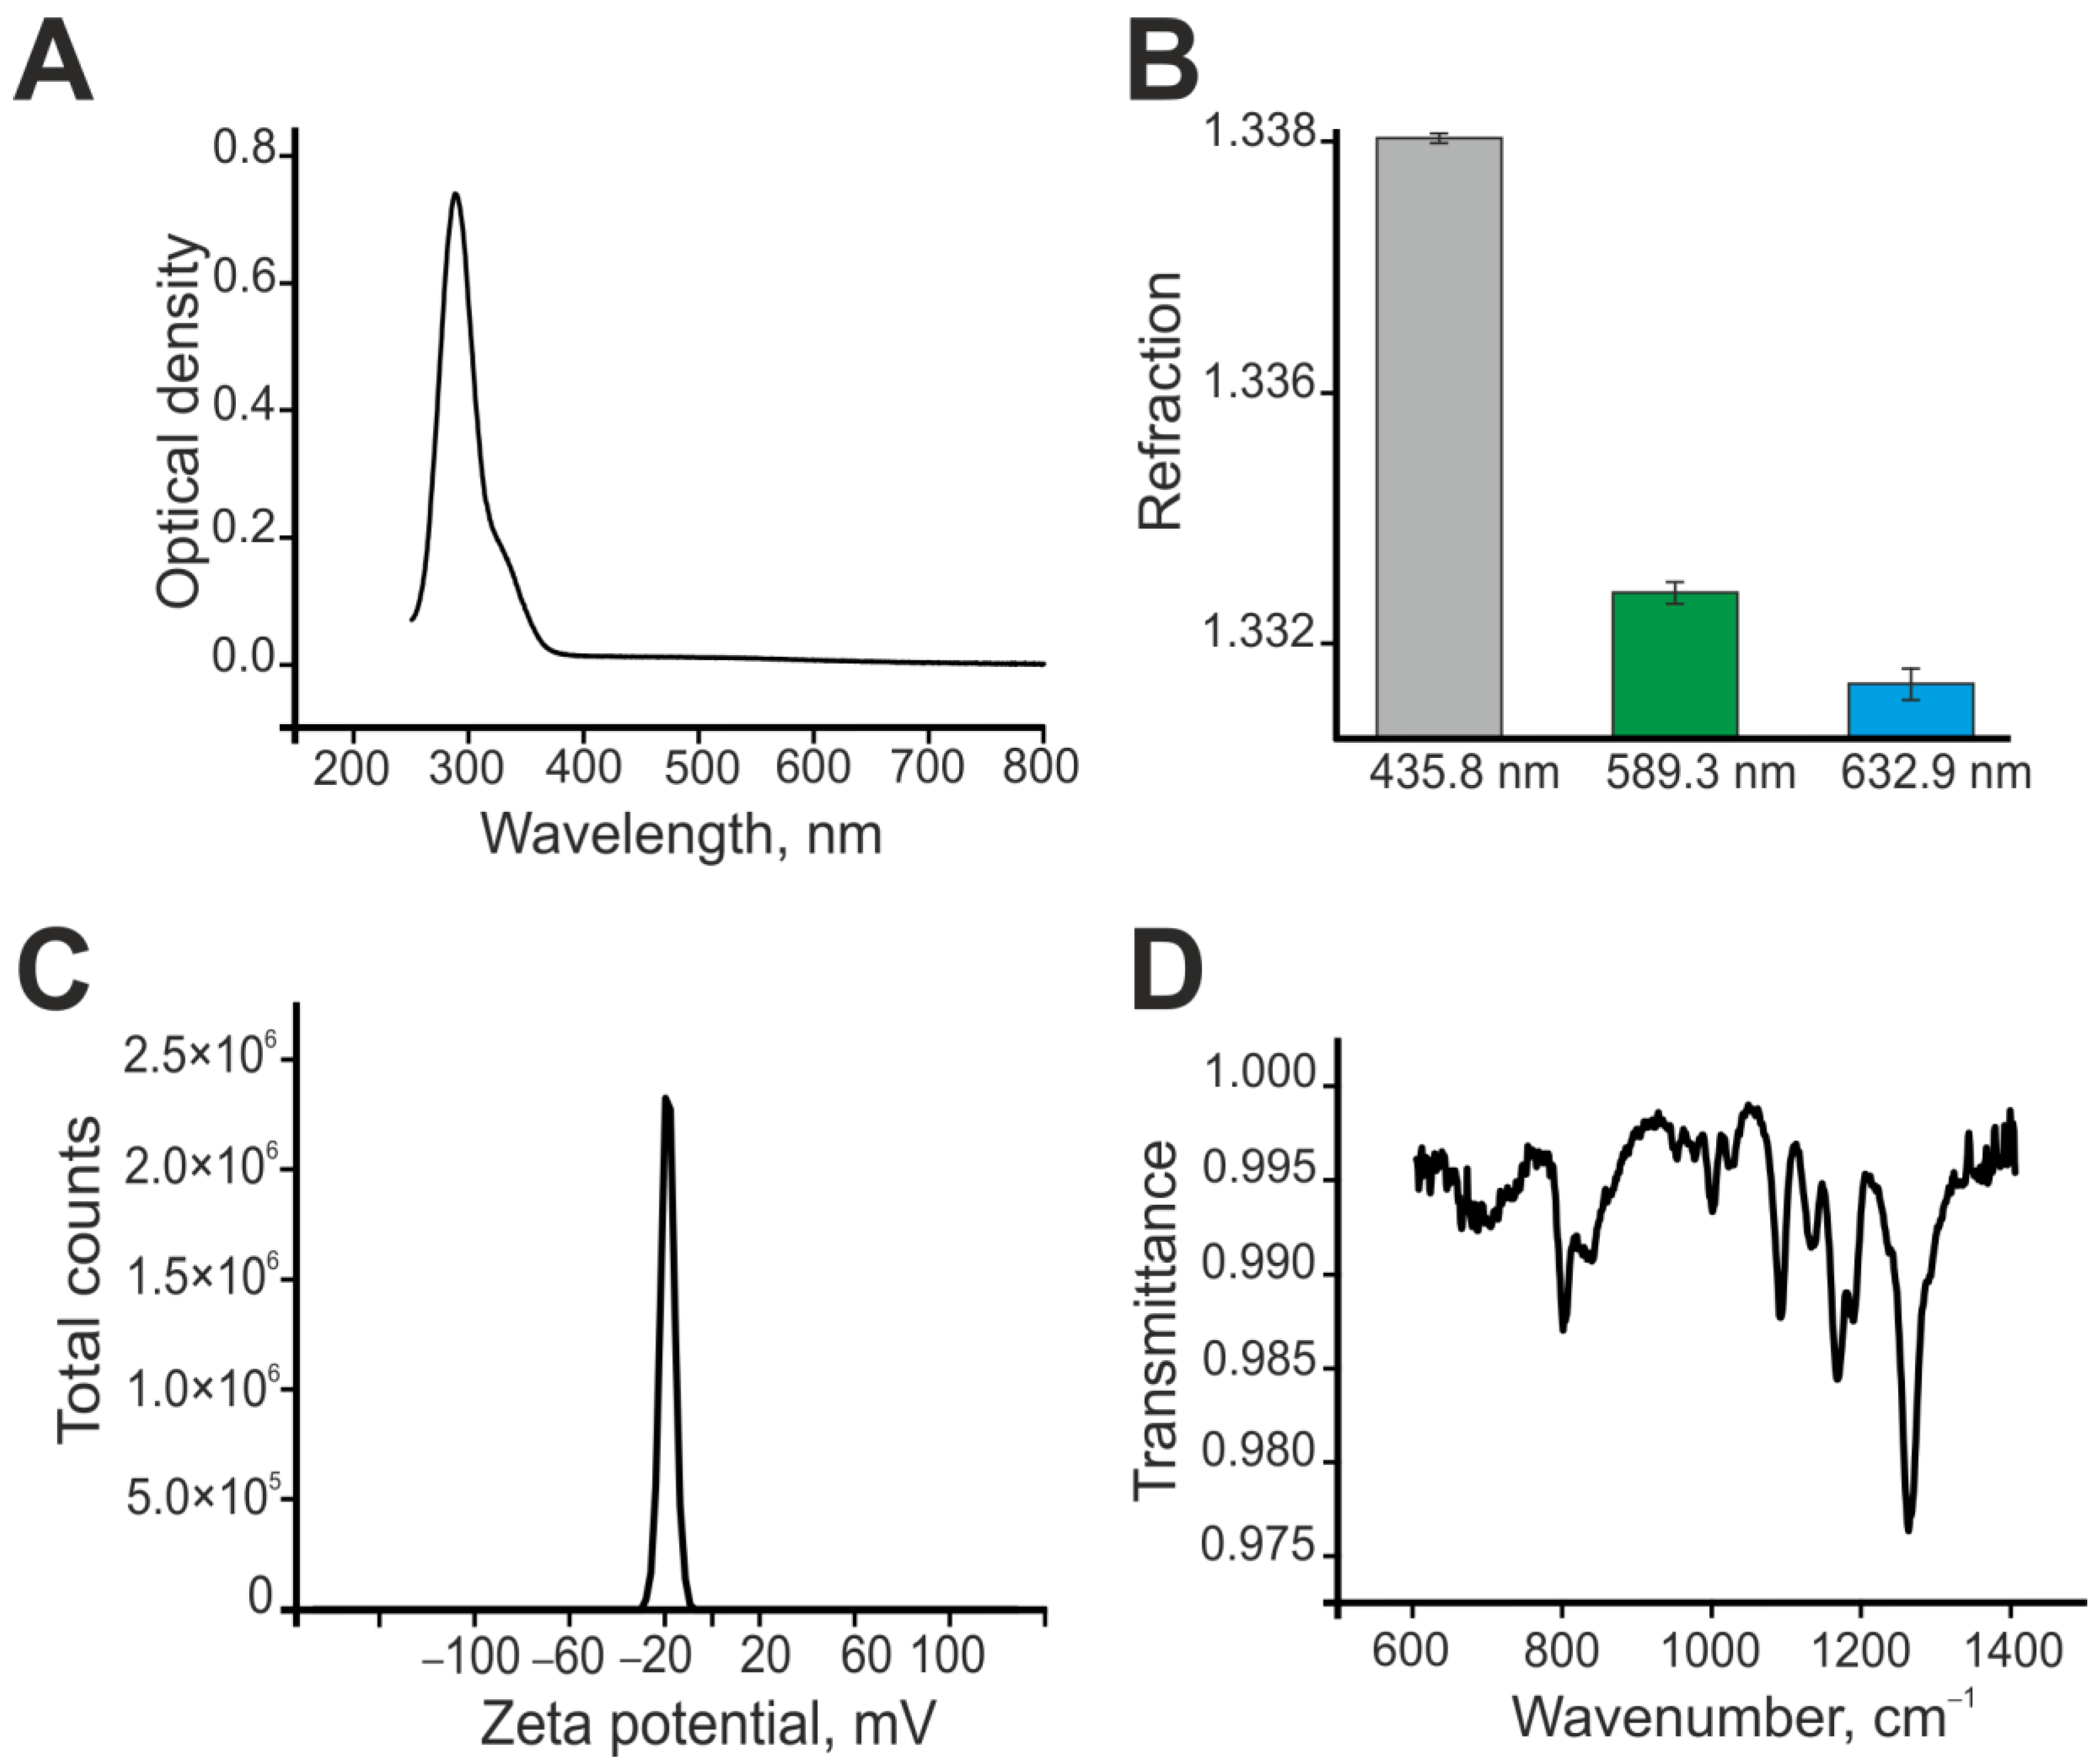
2.1. Preparation and Characterization of Selenium Nanoparticles
2.2. Preparation of Mixed Neuroglial Cell Cultures
2.3. Measurement of ROS Production
2.4. Fluorescent Ca2+ Measurements
2.5. Simulation of Ischemia-like Conditions
2.6. Assessment of Cell Viability and Apoptosis
2.7. Extraction of RNA
2.8. Quantitative Real-Time Polymerase Chain Reaction (RT-qPCR)
2.9. Statistical Analysis
3. Results
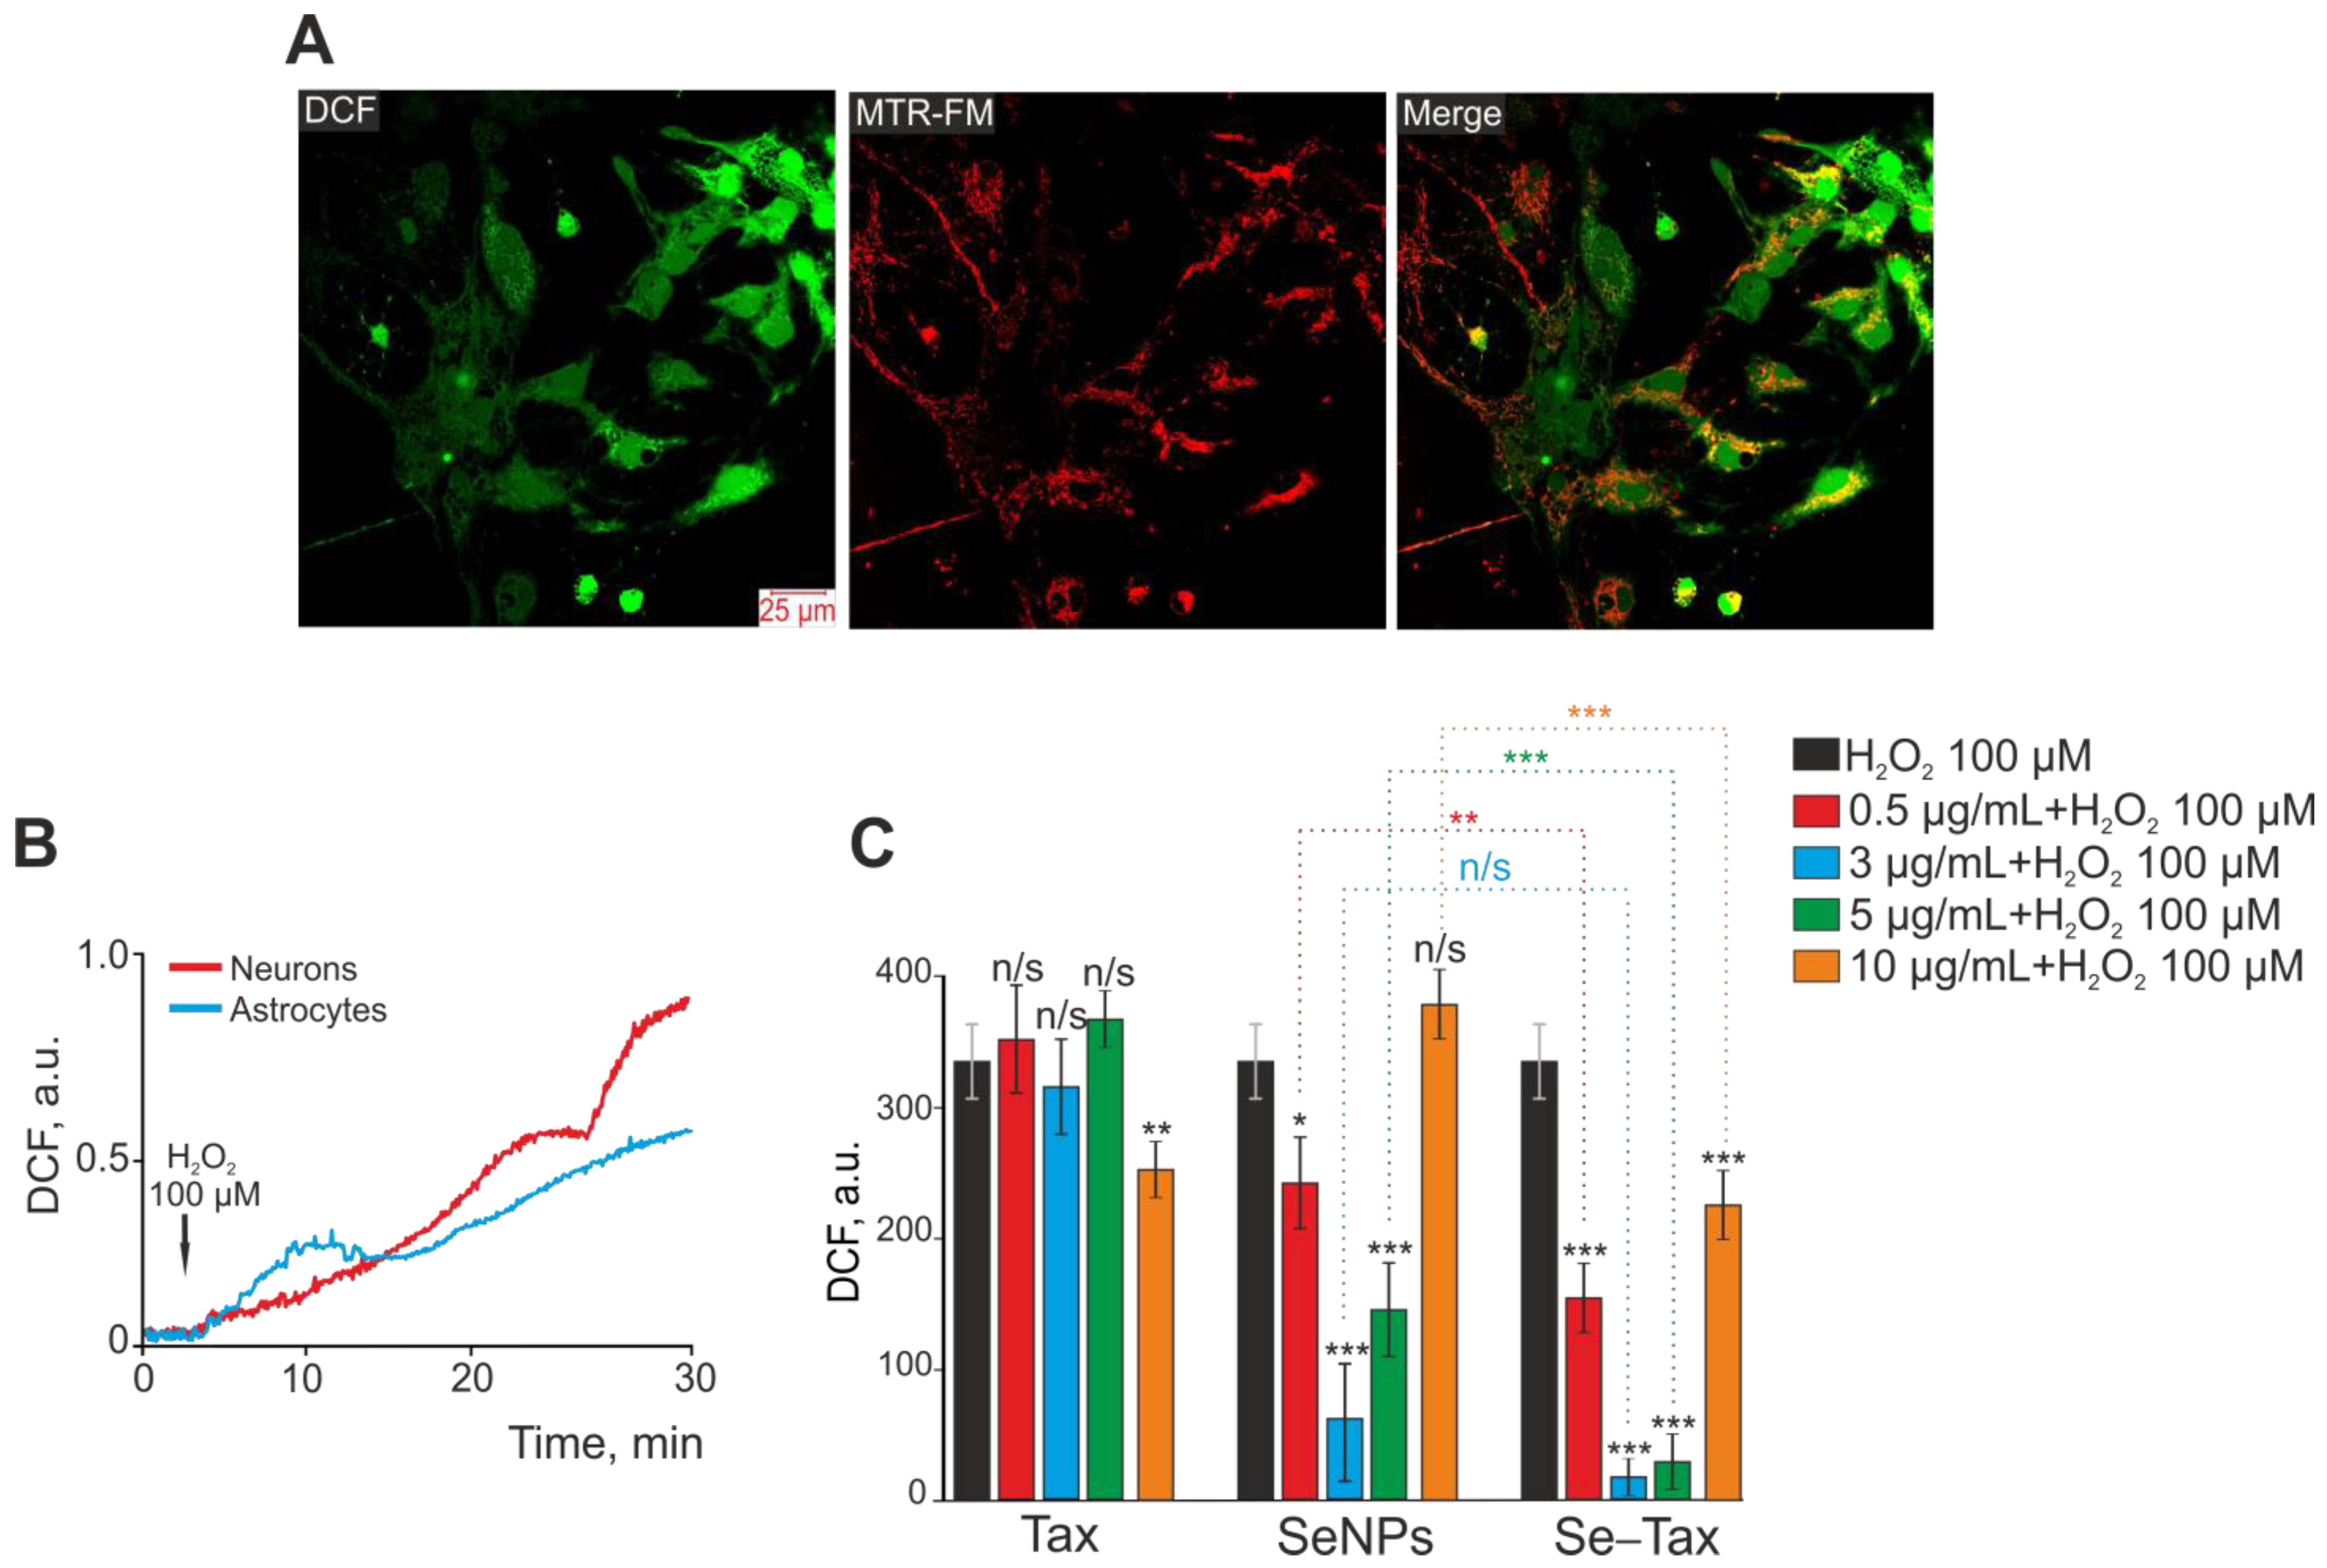
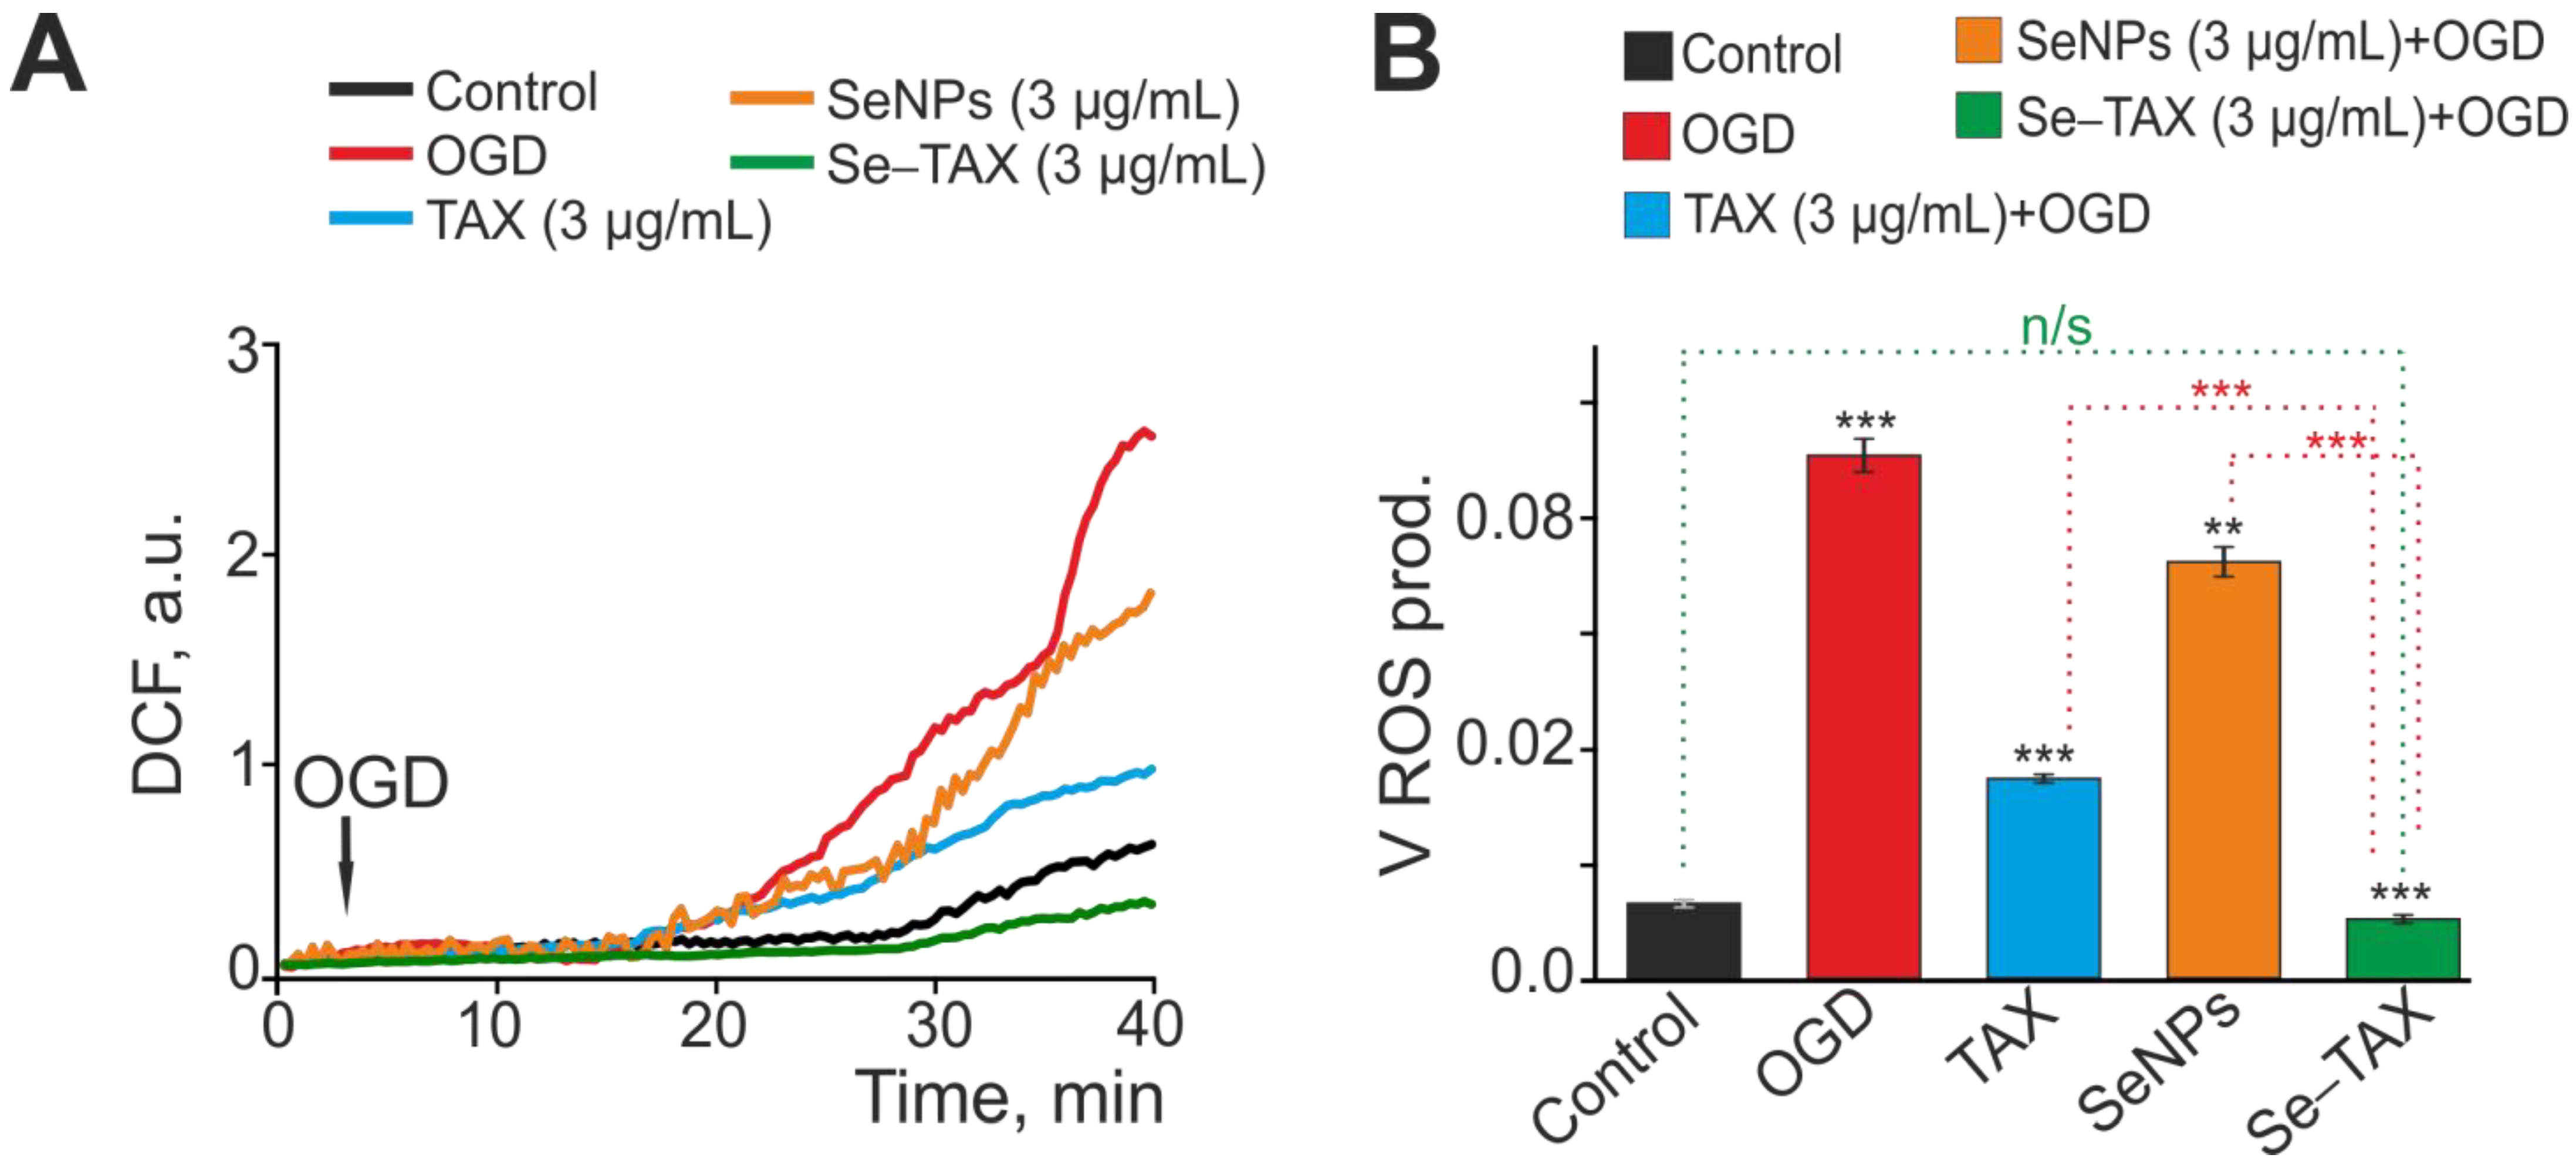
3.1. Dose-Dependent Effect of Taxifolin (TAX), Selenium Nanoparticles (SeNPs), and Selenium–Taxifolin Nanocomplex (Se–TAX) on H2O2-Induced ROS Production in Cerebral Cortex Cells
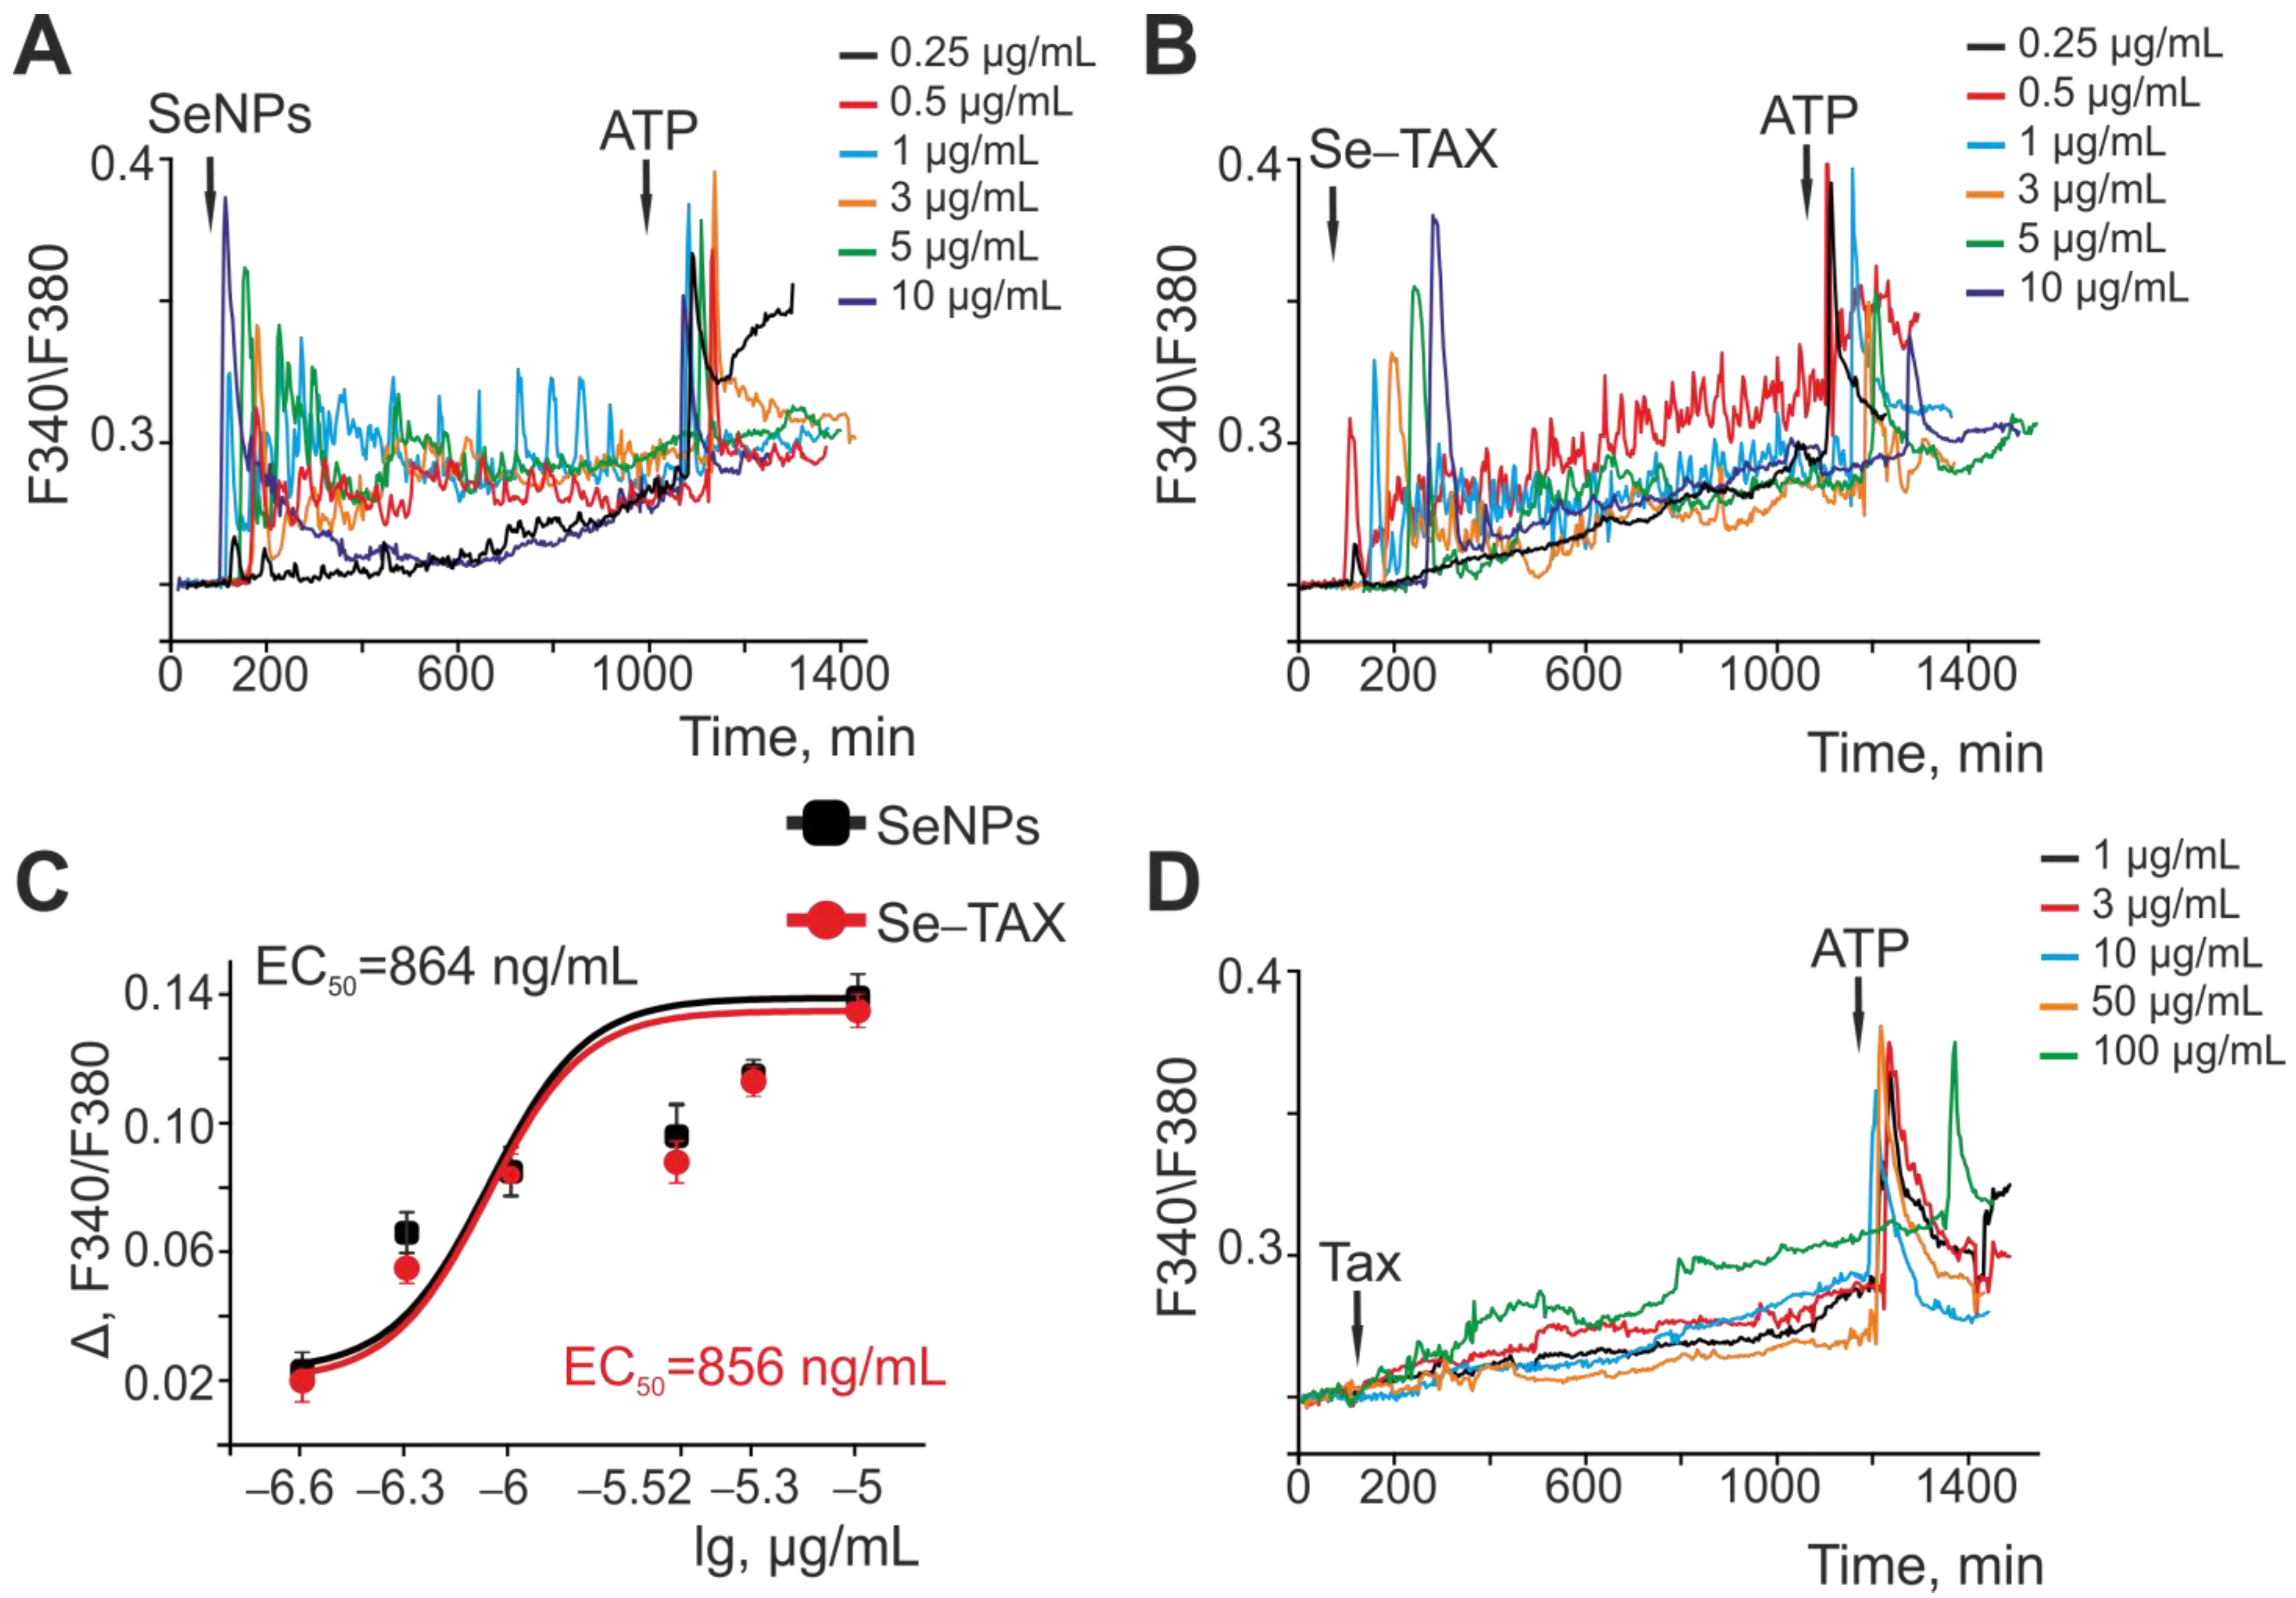
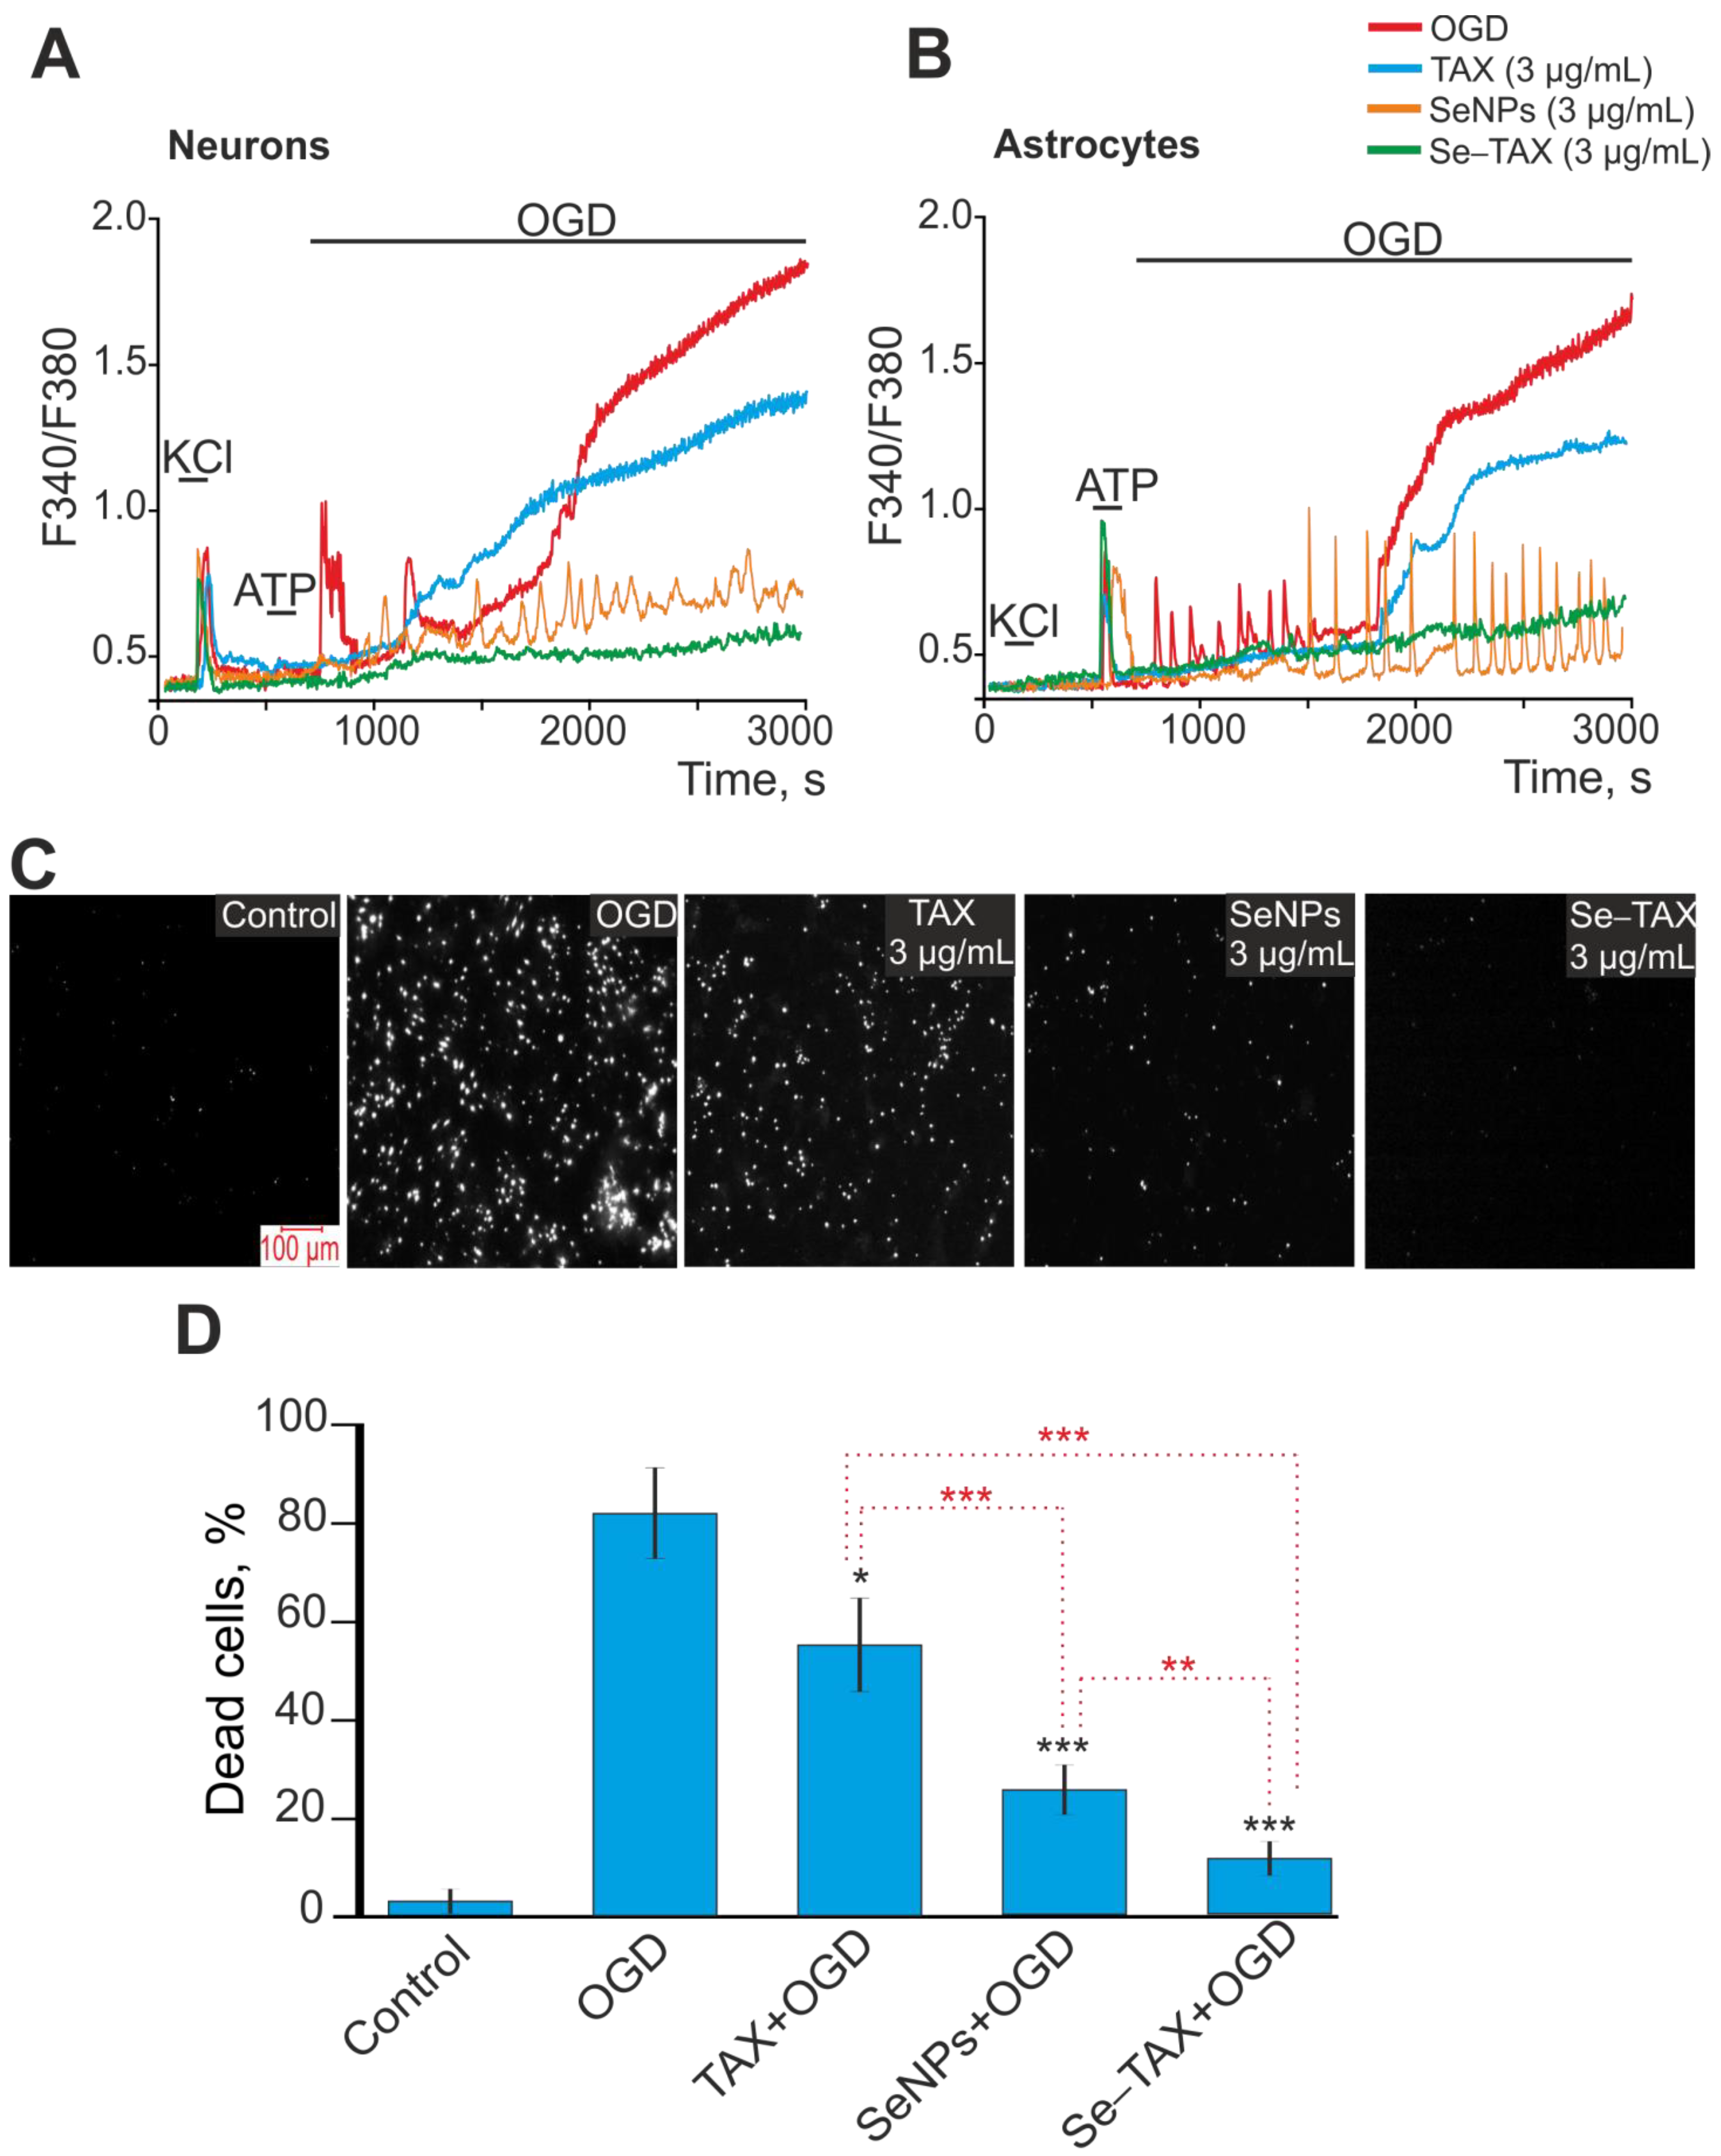
3.2. Effects on the Calcium Dynamics in Astrocytes of the Cerebral Cortex
3.3. SeNPs and Se–TAX Suppress ROS Production and Generate a Global Increase in [Ca2+]i during Ischemia
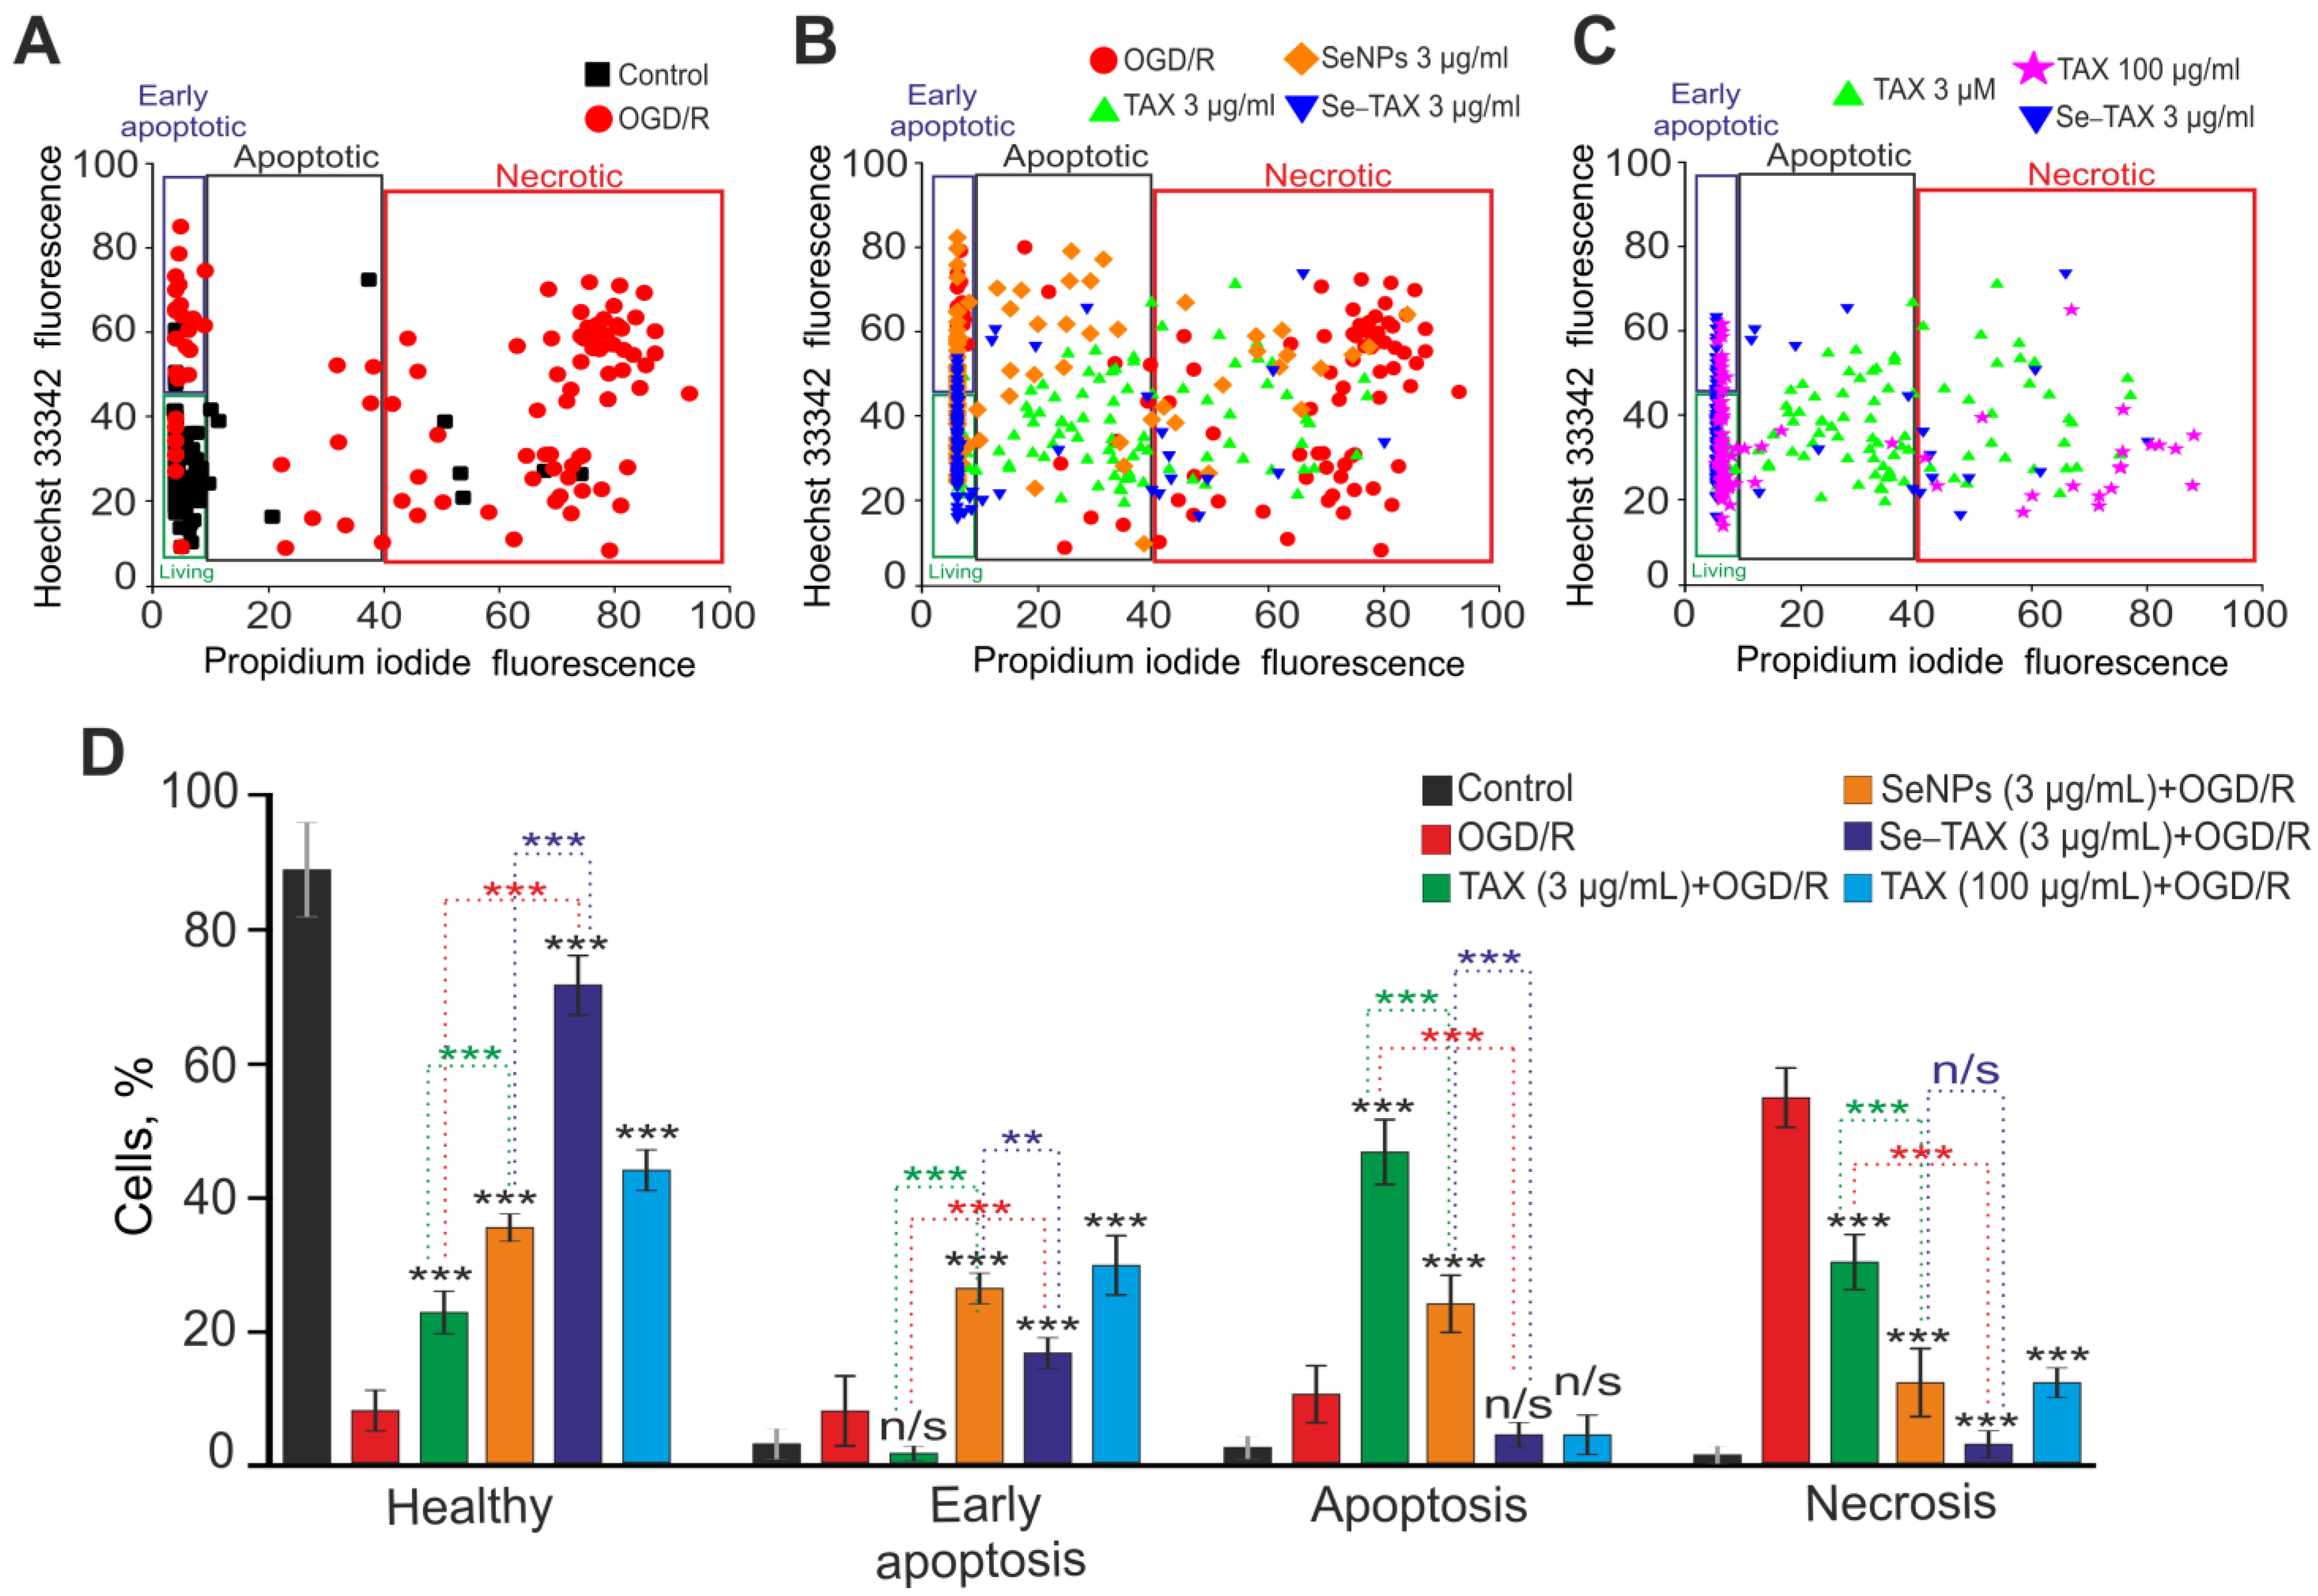
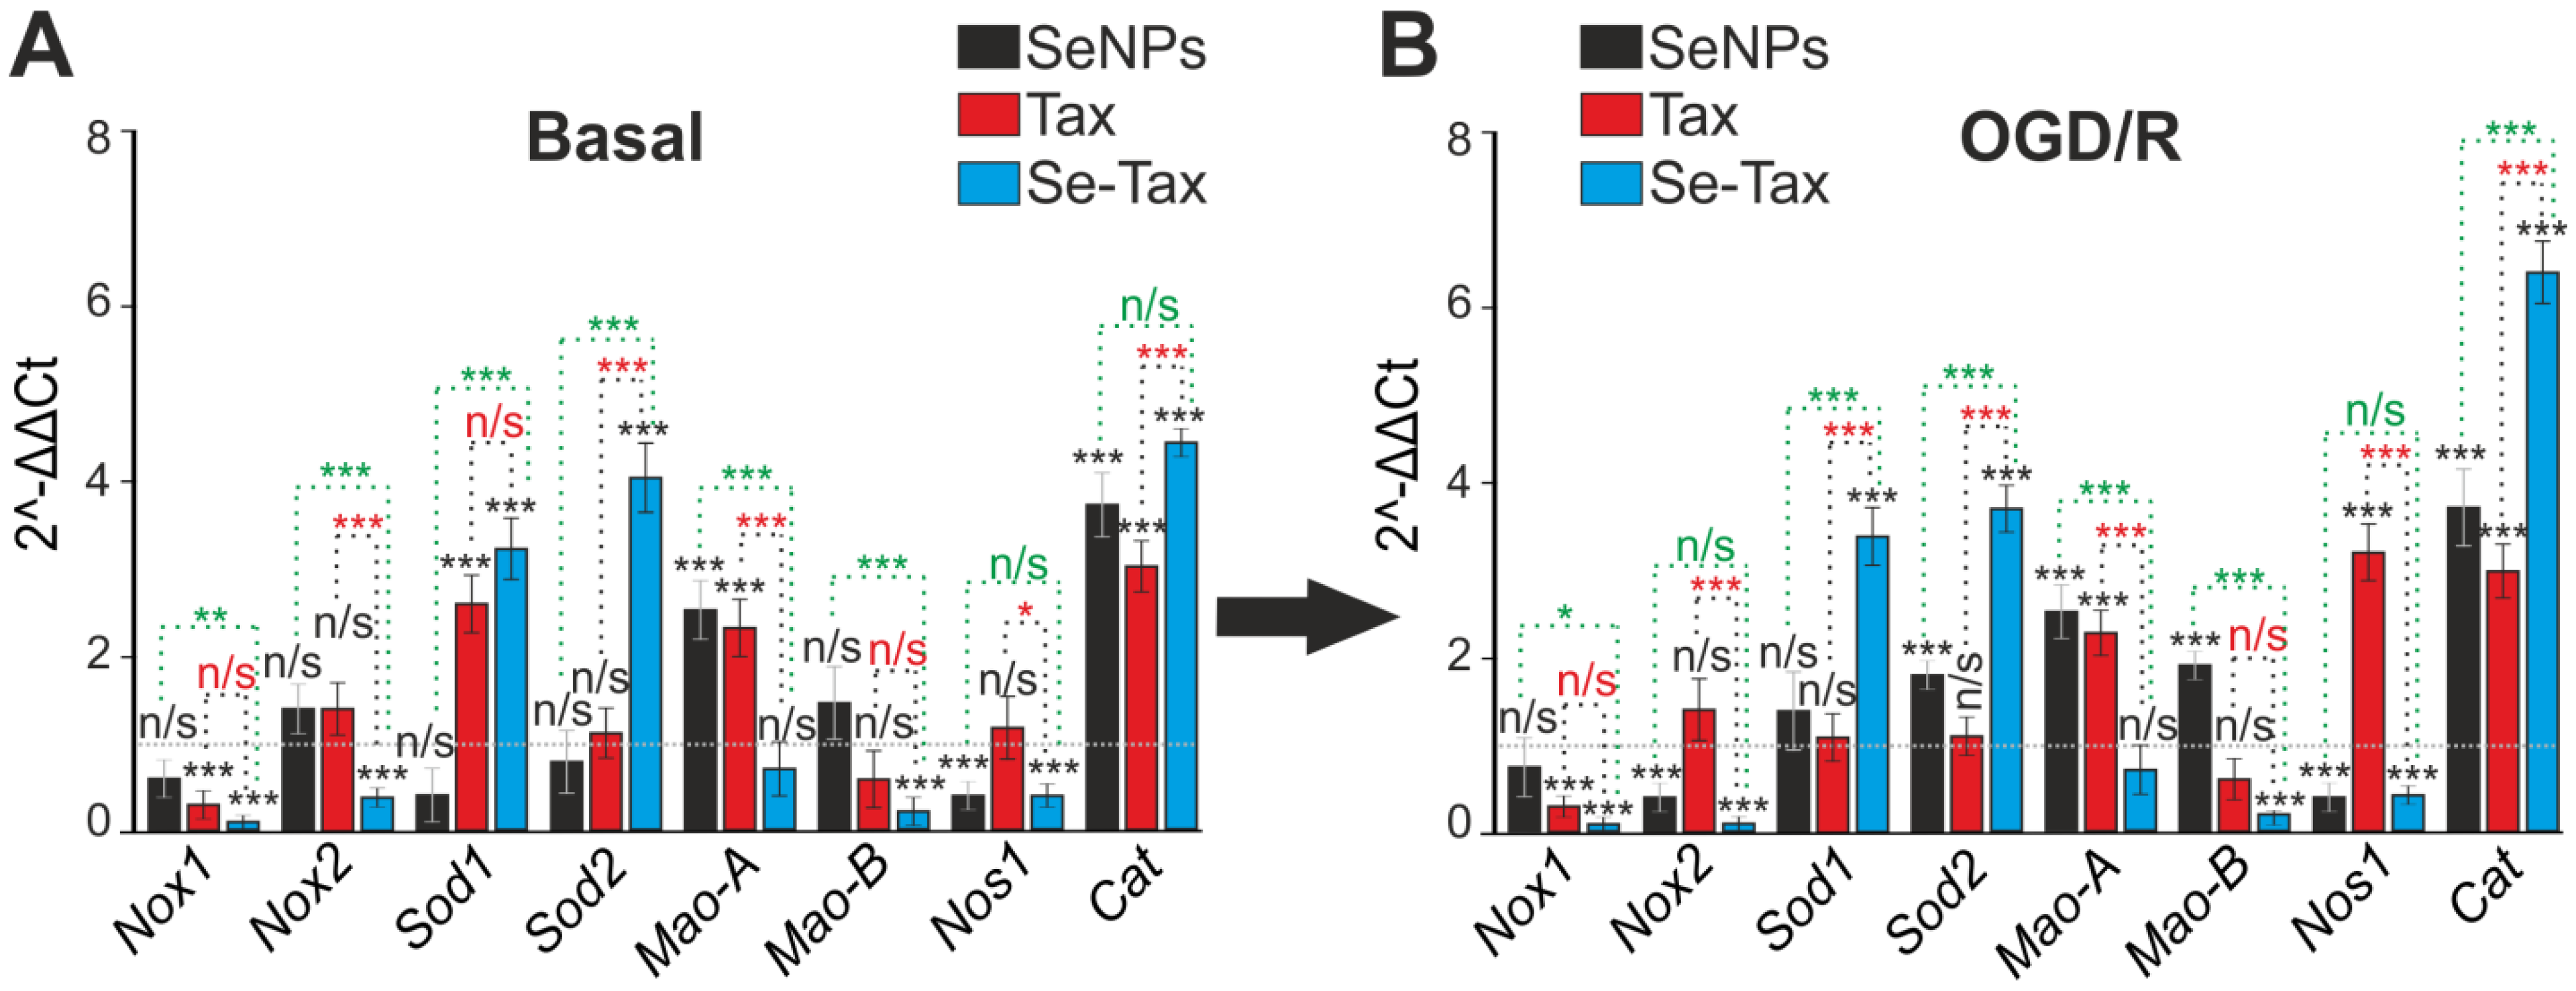
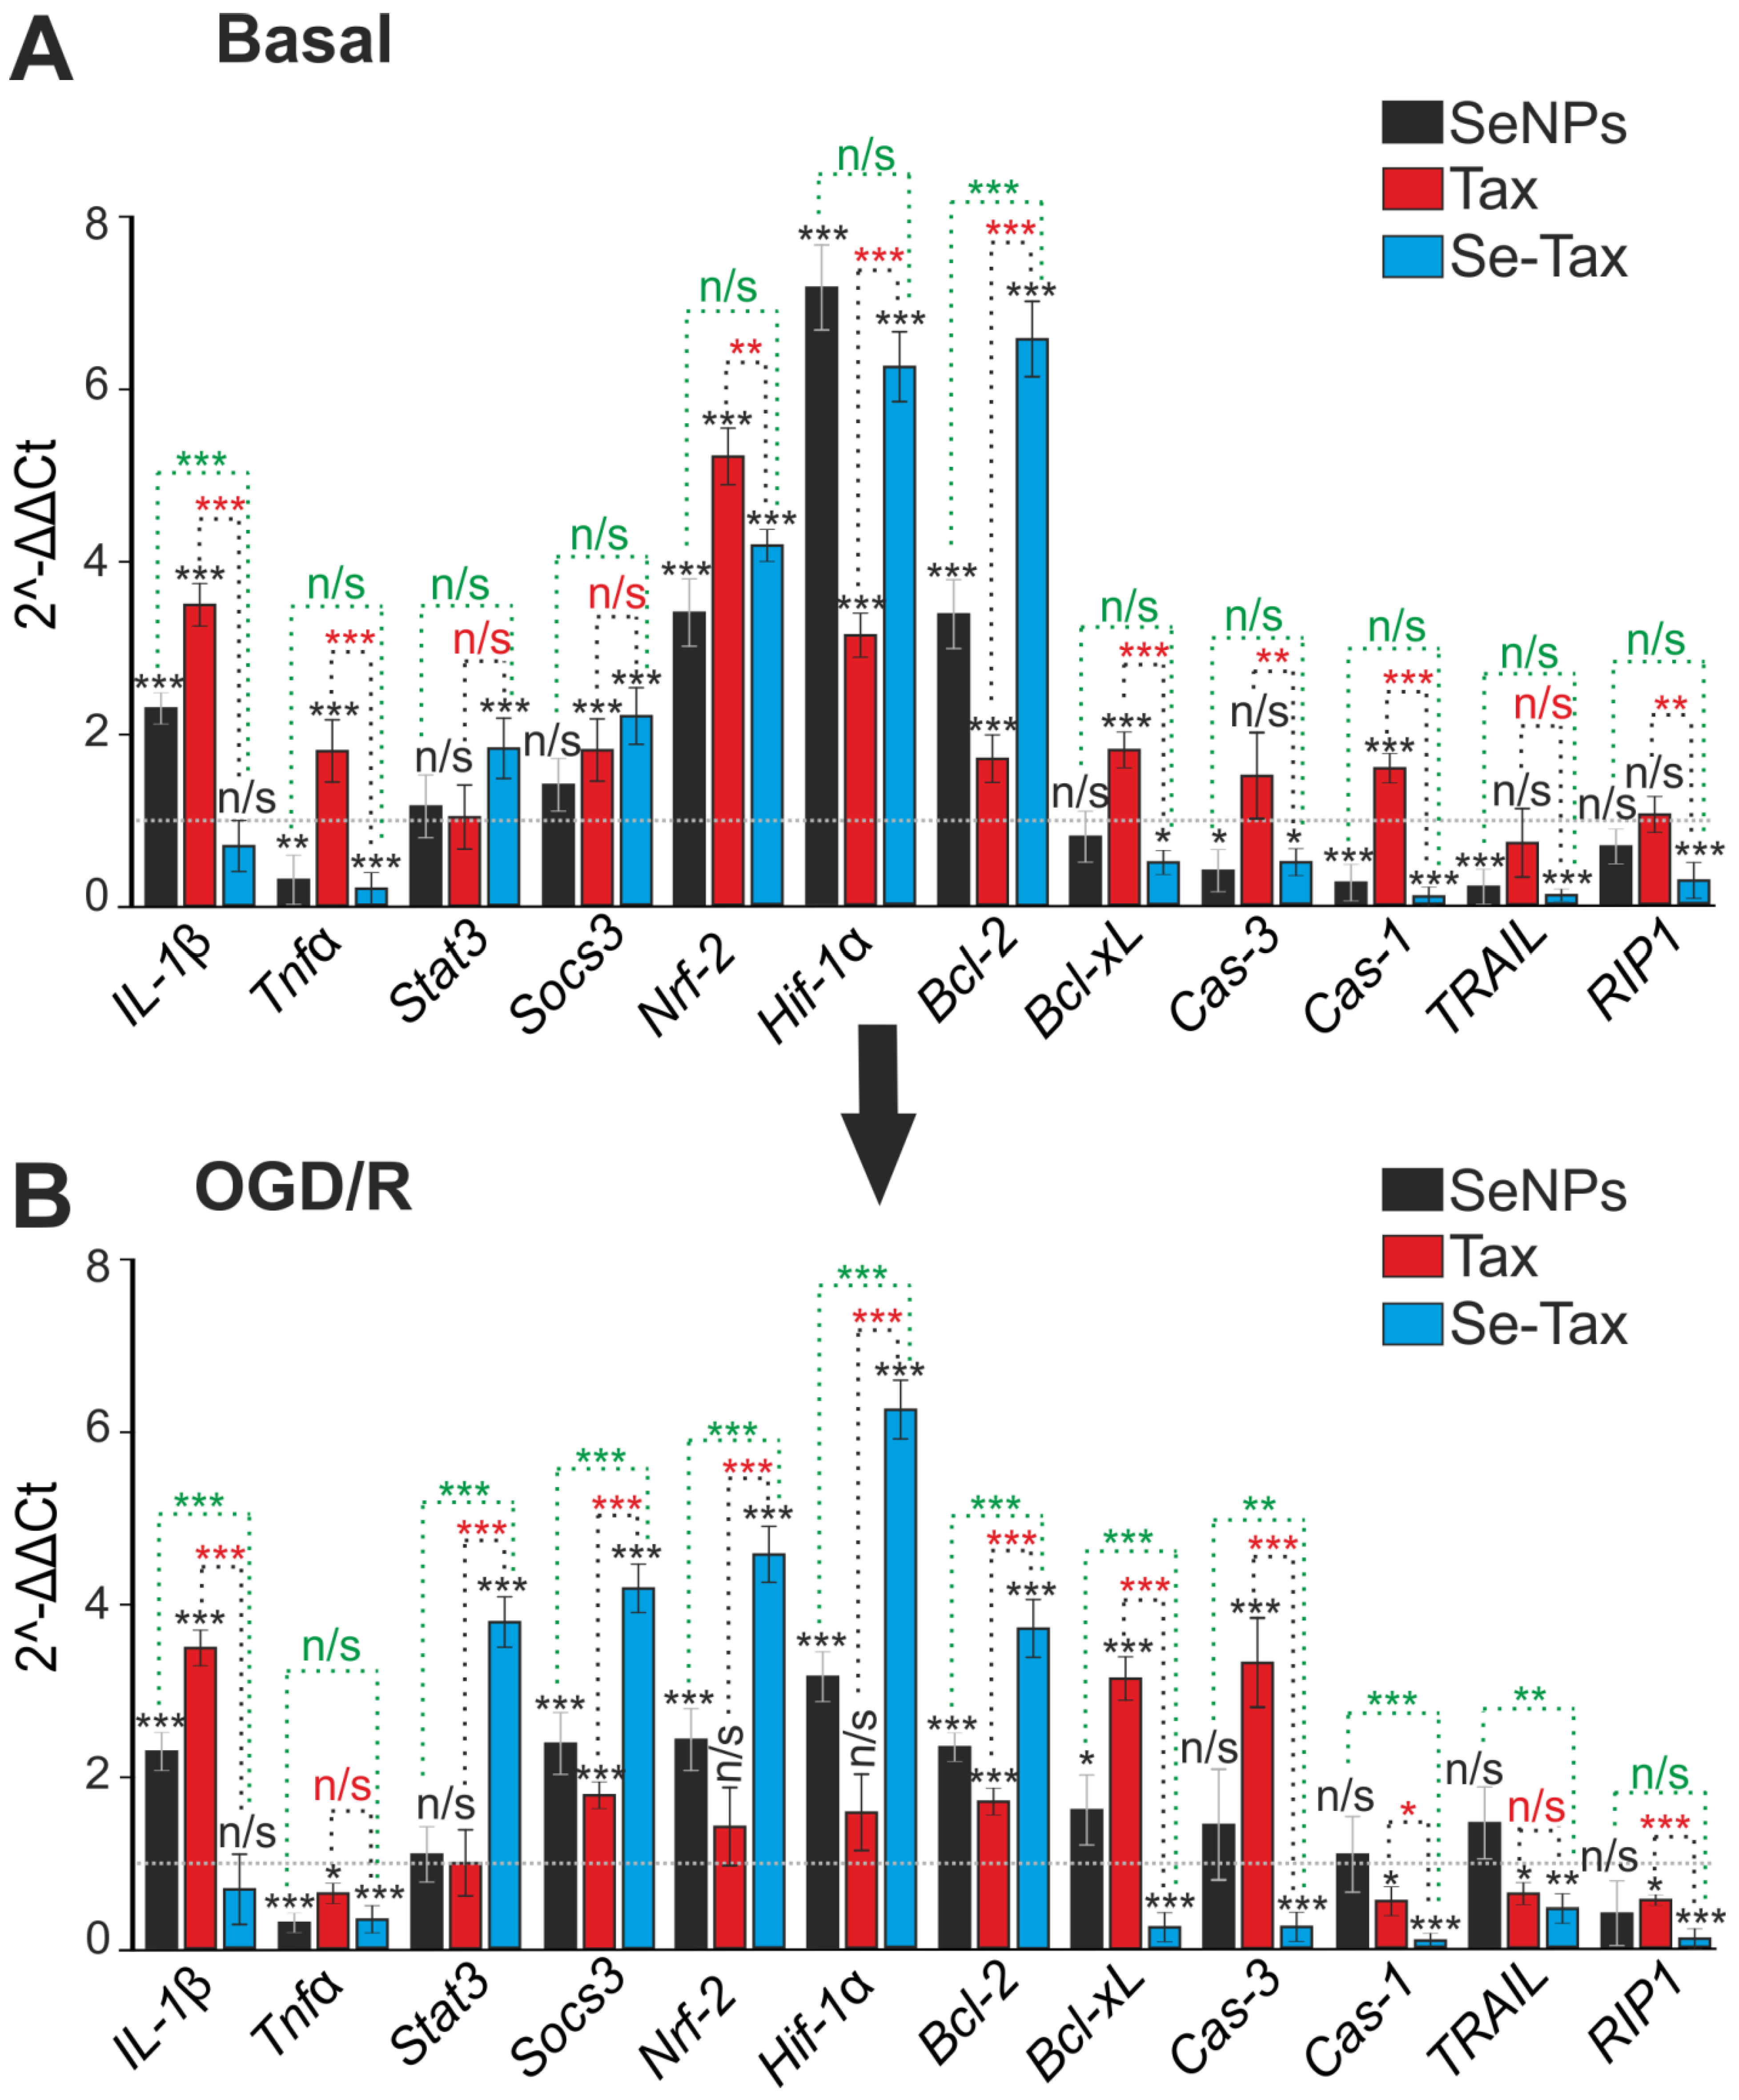
3.4. The Cytoprotective Effect of SeNPs and Se–TAX in Cerebral Cortex Cells during Ischemia/Reoxygenation Associated with Changes in Redox Status and Suppression of Apoptosis and Inflammation Pathways
4. Discussion
5. Conclusions
Supplementary Materials
Author Contributions
Funding
Institutional Review Board Statement
Informed Consent Statement
Data Availability Statement
Acknowledgments
Conflicts of Interest
References
- Yuan, X.; Fu, Z.; Ji, P.; Guo, L.; Al-Ghamdy, A.O.; Alkandiri, A.; Habotta, O.A.; Abdel Moneim, A.E.; Kassab, R.B. Selenium nanoparticles pre-treatment reverse behavioral, oxidative damage, neuronal loss and neurochemical alterations in pentylenetetrazole-induced epileptic seizures in mice. Int. J. Nanomed. 2020, 15, 6339–6353. [Google Scholar] [CrossRef] [PubMed]
- Kalogeris, T.; Baines, C.P.; Krenz, M.; Korthuis, R.J. Cell biology of ischemia/reperfusion injury. Int. Rev. Cell. Mol. Biol. 2012, 298, 229–317. [Google Scholar] [PubMed] [Green Version]
- Gaidin, S.G.; Turovskaya, M.V.; Gavrish, M.S.; Babaev, A.A.; Mal’tseva, V.N.; Blinova, E.V.; Turovsky, E.A. The selective BDNF overexpression in neurons protects neuroglial networks against OGD and glutamate-induced excitotoxicity. Int. J. Neurosci. 2020, 130, 363–383. [Google Scholar] [CrossRef] [PubMed]
- Lee, J.C.; Kim, J.; Park, J.K.; Chung, G.H.; Jang, Y.S. The antioxidant, rather than prooxidant, activities of quercetin on normal cells: Quercetin protects mouse thymocytes from glucose oxidase-mediated apoptosis. Exp. Cell Res. 2003, 291, 386–397. [Google Scholar] [CrossRef]
- Havsteen, B. Flavonoids, a class of natural products of high pharmacological potency. Biochem. Pharmacol. 1983, 32, 1141–1148. [Google Scholar] [CrossRef]
- Youdim, K.A.; Qaiser, M.Z.; Begley, D.J.; Rice-Evans, C.A.; Abbott, N.J. Flavonoid permeability across an in situ model of the blood-brain barrier. Free Radic. Biol. Med. 2004, 36, 592–604. [Google Scholar] [CrossRef]
- Magar, R.T.; Sohng, J.K. A review on structure, modifications and structure-activity relation of quercetin and its derivatives. J. Microbiol. Biotechnol. 2020, 30, 11–20. [Google Scholar] [CrossRef]
- Shubina, V.S.; Shatalin, Y.V. Antioxidant and iron-chelating properties of taxifolin and its condensation product with glyoxylicacid. J. Food Sci. Technol. 2017, 54, 1467–1475. [Google Scholar] [CrossRef] [Green Version]
- Li, X.; Xie, H.; Jiang, Q.; Wei, G.; Lin, L.; Li, C.; Ou, X.; Yang, L.; Xie, Y.; Fu, Z.; et al. The mechanism of (+) taxifolin’s protective antioxidant effect for •OH-treated bone marrow-derived mesenchymal stem cells. Cell. Mol. Biol. Lett. 2017, 22, 31. [Google Scholar] [CrossRef] [Green Version]
- Turovskaya, M.V.; Gaidin, S.G.; Mal’tseva, V.N.; Zinchenko, V.P.; Turovsky, E.A. Taxifolin protects neurons against ischemic injury in vitro via the activation of antioxidant systems and signal transduction pathways of GABAergic neurons. Mol. Cell. Neurosci. 2019, 96, 10–24. [Google Scholar] [CrossRef]
- Rangel-Ordóñez, L.; Nöldner, M.; Schubert-Zsilavecz, M.; Wurglics, M. Plasma levels and distribution of flavonoids in rat brain after single and repeated doses of standardized Ginkgo biloba extract EGb 761®. Planta Med. 2010, 76, 1683–1690. [Google Scholar] [CrossRef] [PubMed] [Green Version]
- Stoffaneller, R.; Morse, N.L. A Review of dietary selenium intake and selenium status in Europe and the Middle East. Nutrients 2015, 7, 1494–1537. [Google Scholar] [CrossRef] [PubMed]
- Tutel’ian, V.A. Norms of physiological requirements in energy and nutrients in various groups of population in Russian Federation. Vopr. Pitan. 2009, 78, 4–15. [Google Scholar]
- Tretyak, L.N.; Gerasimov, E.M. Specificity of the effect of selenium on the human body and animals (in relation to the problem of creating selenium-containing foods). Bull. Orenbg. State Univ. 2007, 12, 136–145. [Google Scholar]
- Guo, C.H.; Hsia, S.; Shih, M.Y.; Hsieh, F.C.; Chen, P.C. Effects of selenium yeast on oxidative stress, growth inhibition, and apoptosis in human breast cancer cells. Int. J. Med. Sci. 2015, 12, 748–758. [Google Scholar] [CrossRef] [Green Version]
- Turovsky, E.A.; Varlamova, E.G. Mechanism of Ca2+-dependent pro-apoptotic action of selenium nanoparticles, mediated by activation of Cx43 hemichannels. Biology 2021, 10, 743. [Google Scholar] [CrossRef]
- Varlamova, E.G.; Goltyaev, M.V.; Turovsky, E.A. The Role of selenoproteins SELENOM and SELENOT in the regulation of apoptosis, ER stress, and calcium homeostasis in the A-172 human glioblastoma cell line. Biology 2022, 11, 811. [Google Scholar] [CrossRef]
- Varlamova, E.G.; Turovsky, E.A.; Babenko, V.A.; Plotnikov, E.Y. The mechanisms underlying the protective action of selenium nanoparticles against ischemia/reoxygenation are mediated by the activation of the Ca2+ signaling system of astrocytes and reactive astrogliosis. Int. J. Mol. Sci. 2021, 22, 12825. [Google Scholar] [CrossRef]
- Solovyev, N.D. Importance of selenium and selenoprotein for brain function: From antioxidant protection to neuronal signalling. J. Inorg. Biochem. 2015, 153, 1–12. [Google Scholar] [CrossRef]
- Shultz, S.R.; Wright, D.K.; Zheng, P.; Stuchbery, R.; Liu, S.J.; Sashindranath, M.; Medcalf, R.L.; Johnston, L.A.; Hovens, C.M.; Jones, N.C.; et al. Sodium selenate reduces hyper-phosphorylated tau and improves outcomes after traumatic brain injury. Brain 2015, 138, 1297–1313. [Google Scholar] [CrossRef] [Green Version]
- Li, C.; Sun, T.; Jiang, C. Recent advances in nanomedicines for the treatment of ischemic stroke. Acta. Pharm. Sin B 2021, 11, 1767–1788. [Google Scholar] [CrossRef] [PubMed]
- Varlamova, E.G.; Goltyaev, M.V.; Mal’tseva, V.N.; Turovsky, E.A.; Sarimov, R.M.; Simakin, A.V.; Gudkov, S.V. Mechanisms of the cytotoxic effect of selenium nanoparticles in different human cancer cell lines. Int. J. Mol. Sci. 2021, 22, 7798. [Google Scholar] [CrossRef] [PubMed]
- Lee, K.H.; Cha, M.; Lee, B.H. Neuroprotective effect of antioxidants in the brain. Int. J. Mol. Sci. 2020, 21, 7152. [Google Scholar] [CrossRef] [PubMed]
- Salim, S. Oxidative stress and the central nervous system. J. Pharmacol. Exp. Ther. 2017, 360, 201–205. [Google Scholar] [CrossRef] [PubMed] [Green Version]
- Zheng, S.; Li, X.; Zhang, Y.; Xie, Q.; Wong, Y.S.; Zheng, W.; Chen, T. PEG-nanolized ultrasmall selenium nanoparticles overcome drug resistance in hepatocellular carcinoma HepG2 cells through induction of mitochondria dysfunction. Int. J. Nanomed. 2012, 7, 3939–3949. [Google Scholar]
- Varlamova, E.G.; Goltyaev, M.V.; Simakin, A.V.; Gudkov, S.V.; Turovsky, E.A. Comparative analysis of the cytotoxic effect of a complex of selenium nanoparticles doped with sorafenib, “naked” selenium nanoparticles, and sorafenib on human hepatocyte carcinoma HepG2 cells. Int. J. Mol. Sci. 2022, 23, 6641. [Google Scholar] [CrossRef]
- Yue, D.; Zeng, C.; Okyere, S.K.; Chen, Z.; Hu, Y. Glycine nano-selenium prevents brain oxidative stress and neurobehavioral abnormalities caused by MPTP in rats. J. Trace Elem. Med. Biol. 2021, 64, 126680. [Google Scholar] [CrossRef]
- Cong, W.; Bai, R.; Li, Y.F.; Wang, L.; Chen, C. Selenium nanoparticles as an efficient nanomedicine for the therapy of Huntington’s disease. ACS Appl. Mater. Interfaces 2019, 11, 34725–34735. [Google Scholar] [CrossRef]
- Gao, F.; Zhao, J.; Liu, P.; Ji, D.; Zhang, L.; Zhang, M.; Li, Y.; Xiao, Y. Preparation and in vitro evaluation of multi-target-directed selenium-chondroitin sulfate nanoparticles in protecting against the Alzheimer’s disease. Int. J. Biol. Macromol. 2020, 142, 265–276. [Google Scholar] [CrossRef]
- Turovsky, E.A.; Mal’tseva, V.N.; Sarimov, R.M.; Simakin, A.V.; Gudkov, S.V.; Plotnikov, E.Y. Features of the cytoprotective effect of selenium nanoparticles on primary cortical neurons and astrocytes during oxygen-glucose deprivation and reoxygenation. Sci. Rep. 2022, 12, 1710. [Google Scholar] [CrossRef]
- Dora, M.F.; Taha, N.M.; Lebda, M.A.; Hashem, A.E.; Elfeky, M.S.; El-Sayed, Y.S.; Jaouni, S.A.; El-Far, A.H. Quercetin attenuates brain oxidative alterations induced by iron oxide nanoparticles in rats. Int. J. Mol. Sci. 2021, 22, 3829. [Google Scholar] [CrossRef] [PubMed]
- Bano, I.; Skalickova, S.; Arbab, S.; Urbankova, L.; Horky, P. Toxicological effects of nanoselenium in animals. J. Anim. Sci. Biotechnol. 2022, 13, 72. [Google Scholar] [CrossRef] [PubMed]
- Shahabadi, N.; Zendehcheshm, S.; Khademi, F. Selenium nanoparticles: Synthesis, in-vitro cytotoxicity, antioxidant activity and interaction studies with ct-DNA and HSA, HHb and Cyt c serum proteins. Biotechnol. Rep. 2021, 30, 00615. [Google Scholar] [CrossRef] [PubMed]
- Turovsky, E.A.; Varlamova, E.G.; Plotnikov, E.Y. Mechanisms underlying the protective effect of the peroxiredoxin-6 are mediated via the protection of astrocytes during ischemia/reoxygenation. Int. J. Mol. Sci. 2021, 22, 8805. [Google Scholar] [CrossRef] [PubMed]
- Zinchenko, V.P.; Turovskaya, M.V.; Teplov, I.Y.; Berezhnov, A.V.; Turovsky, E.A. The role of parvalbumin-containing interneurons in the regulation of spontaneous synchronous activity of brain neurons in culture. Biophysics 2016, 61, 85–93. [Google Scholar] [CrossRef]
- Turovsky, E.A.; Turovskaya, M.V.; Gaidin, S.G.; Zinchenko, V.P. Cytokine IL-10, activators of PI3-kinase, agonists of α-2 adrenoreceptor and antioxidants prevent ischemia-induced cell death in rat hippocampal cultures. Arch. Biochem. Biophys. 2017, 615, 35–43. [Google Scholar] [CrossRef]
- Schmid, I.; Uittenbogaart, C.; Jamieson, B.D. Live-cell assay for detection of apoptosis by dual-laser flow cytometry using Hoechst 33342 and 7-amino-actino-mycin D. Nat Protoc. 2007, 2, 187–190. [Google Scholar] [CrossRef]
- Hwang, S.L.; Yen, G.C. Modulation of Akt, JNK, and p38 activation is involved in citrus flavonoid-mediated cytoprotection of PC12 cells challenged by hydrogen peroxide. J. Agric. Food Chem. 2009, 57, 2576–2582. [Google Scholar] [CrossRef]
- Chai, X.Y.; Li, F.F.; Bai, C.C.; Xu, Z.R.; Shi, H.M.; Tu, P.F. Three new acylated glycosides from the stems of Casearia velutina and their protective effect against H2O2-induced impairment in PC12 cells. Planta Med. 2010, 76, 91–93. [Google Scholar] [CrossRef] [PubMed] [Green Version]
- Varlamova, E.G.; Gudkov, S.V.; Plotnikov, E.Y.; Turovsky, E.A. Size-dependent cytoprotective effects of selenium nanoparticles during oxygen-glucose deprivation in brain cortical cells. Int. J. Mol. Sci. 2022, 23, 7464. [Google Scholar] [CrossRef]
- Malik, S.S.; Masood, N.; Asif, M.; Ahmed, P.; Shah, Z.U.; Khanc, J.S. Expressional analysis of MLH1 and MSH2 in breast cancer. Curr. Probl. Cancer 2018, 18, 147. [Google Scholar] [CrossRef] [PubMed]
- Nie, Z.; Zhang, M.; Zheng, D.; Zhang, M.; Jia, H.; Zhang, X.; Yue, G.; Li, X.; Liu, P.; Zhang, Y.; et al. Enhanced antitumoral activity of quercetin against lung cancer cells using biodegradable poly(lactic acid)-based polymeric nanoparticles. J. Biomater. Tissue Eng. 2017, 7, 269. [Google Scholar] [CrossRef]
- Ghosh, A.; Sarkar, S.; Mandal, A.K.; Das, N. Neuroprotective role of nanoencapsulated quercetin in combating ischemia-reperfusion induced neuronal damage in young and aged rats. PLoS ONE 2013, 8, 57735. [Google Scholar] [CrossRef] [PubMed]
- Silva, T.A.; Gomes, J.H.; Bulhões, L.C.; Neto, R.M.; Júnior, I.D.; Moura, M.A.; Nascimento, T.G.; Grillo, L.A.; Dornelas, C.B. Therapeutic potential of quercetin based on nanotechnology: A review. Rev. Virtual Quim. 2019, 11, 1405–1416. [Google Scholar] [CrossRef]
- Guazelli, C.F.; Fattori, V.; Colombo, B.B.; Georgetti, S.R.; Vicentini, F.T.; Casagrande, R.; Baracat, M.M.; Verri, W.A., Jr. Quercetin-loaded microcapsules ameliorate experimental colitis in mice by antiinflammatory and antioxidant mechanisms. J. Nat. Prod. 2013, 76, 200. [Google Scholar] [CrossRef]
- El-Fattah, A.I.A.; Fatia, M.M.; Ali, Z.Y.; El-Garawany, A.E.A.; Mohamed, E.K. Enhanced therapeutic benefit of quercetin-loaded phytosome nanoparticles in ovariectomized rats. Chem.-Biol. Interact. 2017, 271, 30. [Google Scholar] [CrossRef]
- Abdullahi, W.; Tripathi, D.; Ronaldson, P.T. Blood-brain barrier dysfunction in ischemic stroke: Targeting tight junctions and transporters for vascular protection. Am. J. Physiol. Cell Physiol. 2018, 315, 343–356. [Google Scholar] [CrossRef]
- Jin, Z.; Ke, J.; Guo, P.; Wang, Y.; Wu, H. Quercetin improves blood-brain barrier dysfunction in rats with cerebral ischemia reperfusion via Wnt signaling pathway. Am. J. Transl. Res. 2019, 11, 4683–4695. [Google Scholar]
- Amani, H.; Habibey, R.; Shokri, F.; Hajmiresmail, S.J.; Akhavan, O.; Mashaghi, A.; Pazoki-Toroudi, H. Selenium nanoparticles for targeted stroke therapy through modulation of inflammatory and metabolic signaling. Sci. Rep. 2019, 9, 6044. [Google Scholar] [CrossRef] [Green Version]
- Wang, H.; He, Y.; Liu, L.; Tao, W.; Wang, G.; Sun, W.; Pei, X.; Xiao, Z.; Jin, Y.; Wang, M. Prooxidation and cytotoxicity of selenium nanoparticles at nonlethal level in Sprague-Dawley rats and buffalo rat liver cells. Oxid. Med. Cell. Longev. 2020, 2020, 7680276. [Google Scholar] [CrossRef]
- Kumar, A.; Kumar, S.P. Biogenic selenium nanoparticles for their therapeutic application. Asian. J. Pharm. Clin. Res. 2020, 13, 4–9. [Google Scholar]
- Jolly, J.; Rauf, M.A.; Ahmad, Z. Selenium nanoparticles: Small is the new big: Mini review. Open J. Chem. 2020, 6, 013–016. [Google Scholar]
- Zhai, X.; Zhang, C.; Zhao, G.; Stoll, S.; Ren, F.; Leng, X. Antioxidant capacities of the selenium nanoparticles stabilized by chitosan. J. Nanobiotechnol. 2017, 15, 4. [Google Scholar] [CrossRef] [PubMed] [Green Version]
- Batiha, G.E.; Beshbishy, A.M.; Ikram, M.; Mulla, Z.S.; El-Hack, M.E.A.; Taha, A.E.; Algammal, A.M.; Elewa, Y.H.A. The pharmacological activity, biochemical properties, and pharmacokinetics of the major natural polyphenolic flavonoid: Quercetin. Foods 2020, 9, 374. [Google Scholar] [CrossRef] [PubMed] [Green Version]
- Lozano, O.; Lázaro-Alfaro, A.; Silva-Platas, C.; Oropeza-Almazán, Y.; Torres-Quintanilla, A.; Bernal-Ramírez, J.; Alves-Figueiredo, H.; García-Rivas, G. Nanoencapsulated quercetin improves cardioprotection during hypoxia-reoxygenation injury through preservation of mitochondrial function. Oxid. Med. Cell Longev. 2019, 2019, 7683051. [Google Scholar] [CrossRef] [Green Version]
- Dall’Acqua, S.; Miolo, G.; Innocenti, G.; Caffieri, S. The photodegradation of quercetin: Relation to oxidation. Molecules 2012, 17, 8898–8907. [Google Scholar] [CrossRef]
- Chen, B.H.; Park, J.H.; Ahn, J.H.; Cho, J.H.; Kim, I.H.; Lee, J.C.; Won, M.H.; Lee, C.H.; Hwang, I.K.; Kim, J.D.; et al. Pretreated quercetin protects gerbil hippocampal CA1 pyramidal neurons from transient cerebral ischemic injury by increasing the expression of antioxidant enzymes. Neural Regen. Res. 2017, 12, 220–227. [Google Scholar]
- Yoshino, S.; Hara, A.; Sakakibara, H.; Kawabata, K.; Tokumura, A.; Ishisaka, A.; Kawai, Y.; Terao, J. Effect of quercetin and glucuronide metabolites on the monoamine oxidase-A reaction in mouse brain mitochondria. Nutrition 2011, 27, 847–852. [Google Scholar] [CrossRef]
- Kobori, M.; Takahashi, Y.; Akimoto, Y.; Sakurai, M.; Matsunaga, I.; Nishimuro, H.; Ippoushi, K.; Oike, H.; Ohnishi-Kameyama, M. Chronic high intake of quercetin reduces oxidative stress and induces expression of the antioxidant enzymes in the liver and visceral adipose tissues in mice. J. Funct. Foods 2015, 15, 551–560. [Google Scholar] [CrossRef]
- Ishige, K.; Schubert, D.; Sagara, Y. Flavonoids protect neuronal cells from oxidative stress by three distinct mechanisms. Free Radical Biol. Med. 2001, 30, 433–446. [Google Scholar] [CrossRef]
- Calvo-Rodriguez, M.; Hou, S.S.; Snyder, A.C.; Kharitonova, E.K.; Russ, A.N.; Das, S.; Fan, Z.; Muzikansky, A.; Garcia-Alloza, M.; Serrano-Pozo, A.; et al. Increased mitochondrial calcium levels associated with neuronal death in a mouse model of Alzheimer’s disease. Nat. Commun. 2020, 11, 2146. [Google Scholar] [CrossRef] [PubMed]
- Turovsky, E.A.; Turovskaya, M.V.; Dynnik, V.V. Deregulation of Ca2+-signaling systems in white adipocytes, manifested as the loss of rhythmic activity, underlies the development of multiple hormonal resistance at obesity and type 2 diabetes. Int. J. Mol. Sci. 2021, 22, 5109. [Google Scholar] [CrossRef] [PubMed]
- Hogg, D.W.; Pamenter, M.E.; Dukoff, D.J.; Buck, L.T. Decreases in mitochondrial reactive oxygen species initiate GABA(A) receptor-mediated electrical suppression in anoxia-tolerant turtle neurons. J. Physiol. 2015, 593, 2311–2326. [Google Scholar] [CrossRef] [PubMed] [Green Version]
- Khurana, A.; Tekula, S.; Saifi, M.A.; Venkatesh, P.; Godugu, C. Therapeutic applications of selenium nanoparticles. Biomed. Pharmacother. 2019, 111, 802–812. [Google Scholar] [CrossRef] [PubMed]
- Xie, X.; Feng, J.; Kang, Z.; Zhang, S.; Zhang, L.; Zhang, Y.; Li, X.; Tang, Y. Taxifolin protects RPE cells against oxidative stress-induced apoptosis. Mol. Vis. 2017, 23, 520–528. [Google Scholar]
- Guo, Z.; Jiang, H.; Xu, X.; Duan, W.; Mattson, M.P. Leptin-mediated cell survival signaling in hippocampal neurons mediated by JAK STAT3 and mitochondrial stabilization. J. Biol. Chem. 2008, 283, 1754–1763. [Google Scholar] [CrossRef] [Green Version]
- Tsujimoto, Y.; Shimizu, S. VDAC regulation by the Bcl-2 family proteins. Cell Death Differ. 2000, 7, 1174–1181. [Google Scholar] [CrossRef] [Green Version]
- Jang, J.-H.; Surh, Y.-J. Bcl-2 attenuation of oxidative cell death is associated with up-regulation of g-glutamyl cysteine ligase via constitutive NF-kB activation. J. Biol. Chem. 2004, 279, 38779–38786. [Google Scholar] [CrossRef]
- Lin, C.-F.; Chen, C.-L.; Chang, W.-T.; Jan, M.S.; Hsu, L.J.; Wu, R.H.; Fang, Y.T.; Tang, M.J.; Chang, W.C.; Lin, Y.S. Bcl-2 rescues ceramide- and etoposide-induced mitochondrial apoptosis through blockage of caspase-2 activation. J. Biol. Chem. 2005, 280, 23758–23765. [Google Scholar] [CrossRef] [Green Version]
- Khan, A.; Ali, T.; Rehman, S.U.; Khan, M.S.; Alam, S.I.; Ikram, M.; Muhammad, T.; Saeed, K.; Badshah, H.; Kim, M.O. Neuroprotective effect of quercetin against the detrimental effects of LPS in the adult mouse brain. Front. Pharmacol. 2018, 9, 1383. [Google Scholar] [CrossRef] [Green Version]
- Mehta, S.L.; Kumari, S.; Mendelev, N.; Li, P.A. Selenium preserves mitochondrial function, stimulates mitochondrial biogenesis, and reduces infarct volume after focal cerebral ischemia. BMC Neurosci. 2012, 13, 79. [Google Scholar] [CrossRef] [PubMed] [Green Version]
- Qi, Y.; Yi, P.; He, T.; Song, X.; Liu, Y.; Li, Q.; Zheng, J.; Song, R.; Liu, C.; Zhang, Z.; et al. Quercetin-loaded selenium nanoparticles inhibit amyloid-β aggregation and exhibit antioxidant activity. Colloids Surf. A Physicochem. Eng. Asp. 2020, 602, 125058. [Google Scholar] [CrossRef]
- Galho, A.R.; Cordeiro, M.F.; Ribeiro, S.A.; Marques, M.S.; Antunes, M.F.; Luz, D.C.; Hädrich, G.; Muccillo-Baisch, A.L.; Barros, D.M.; Lima, J.V.; et al. Protective role of free and quercetin-loaded nanoemulsion against damage induced by intracerebral haemorrhage in rats. Nanotechnology 2016, 27, 175101. [Google Scholar] [CrossRef] [PubMed]


Publisher’s Note: MDPI stays neutral with regard to jurisdictional claims in published maps and institutional affiliations. |
© 2022 by the authors. Licensee MDPI, Basel, Switzerland. This article is an open access article distributed under the terms and conditions of the Creative Commons Attribution (CC BY) license (https://creativecommons.org/licenses/by/4.0/).
Share and Cite
Varlamova, E.G.; Khabatova, V.V.; Gudkov, S.V.; Plotnikov, E.Y.; Turovsky, E.A. Cytoprotective Properties of a New Nanocomplex of Selenium with Taxifolin in the Cells of the Cerebral Cortex Exposed to Ischemia/Reoxygenation. Pharmaceutics 2022, 14, 2477. https://doi.org/10.3390/pharmaceutics14112477
Varlamova EG, Khabatova VV, Gudkov SV, Plotnikov EY, Turovsky EA. Cytoprotective Properties of a New Nanocomplex of Selenium with Taxifolin in the Cells of the Cerebral Cortex Exposed to Ischemia/Reoxygenation. Pharmaceutics. 2022; 14(11):2477. https://doi.org/10.3390/pharmaceutics14112477
Chicago/Turabian StyleVarlamova, Elena G., Venera V. Khabatova, Sergey V. Gudkov, Egor Y. Plotnikov, and Egor A. Turovsky. 2022. "Cytoprotective Properties of a New Nanocomplex of Selenium with Taxifolin in the Cells of the Cerebral Cortex Exposed to Ischemia/Reoxygenation" Pharmaceutics 14, no. 11: 2477. https://doi.org/10.3390/pharmaceutics14112477