
A Physiologically-Based Pharmacokinetic Model of Ruxolitinib and Posaconazole to Predict CYP3A4-Mediated Drug–Drug Interaction Frequently Observed in Graft versus Host Disease Patients
 ,
,
Abstract
: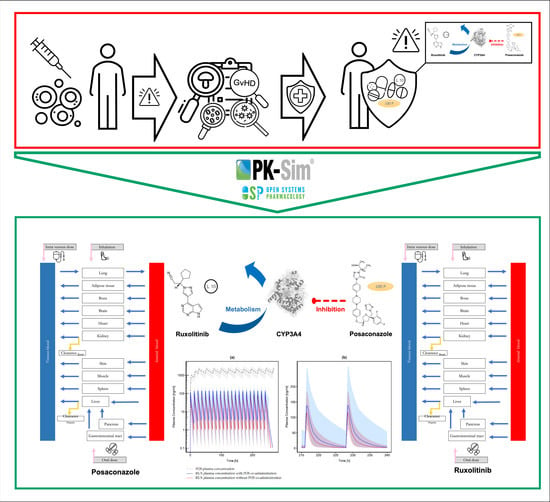
1. Introduction
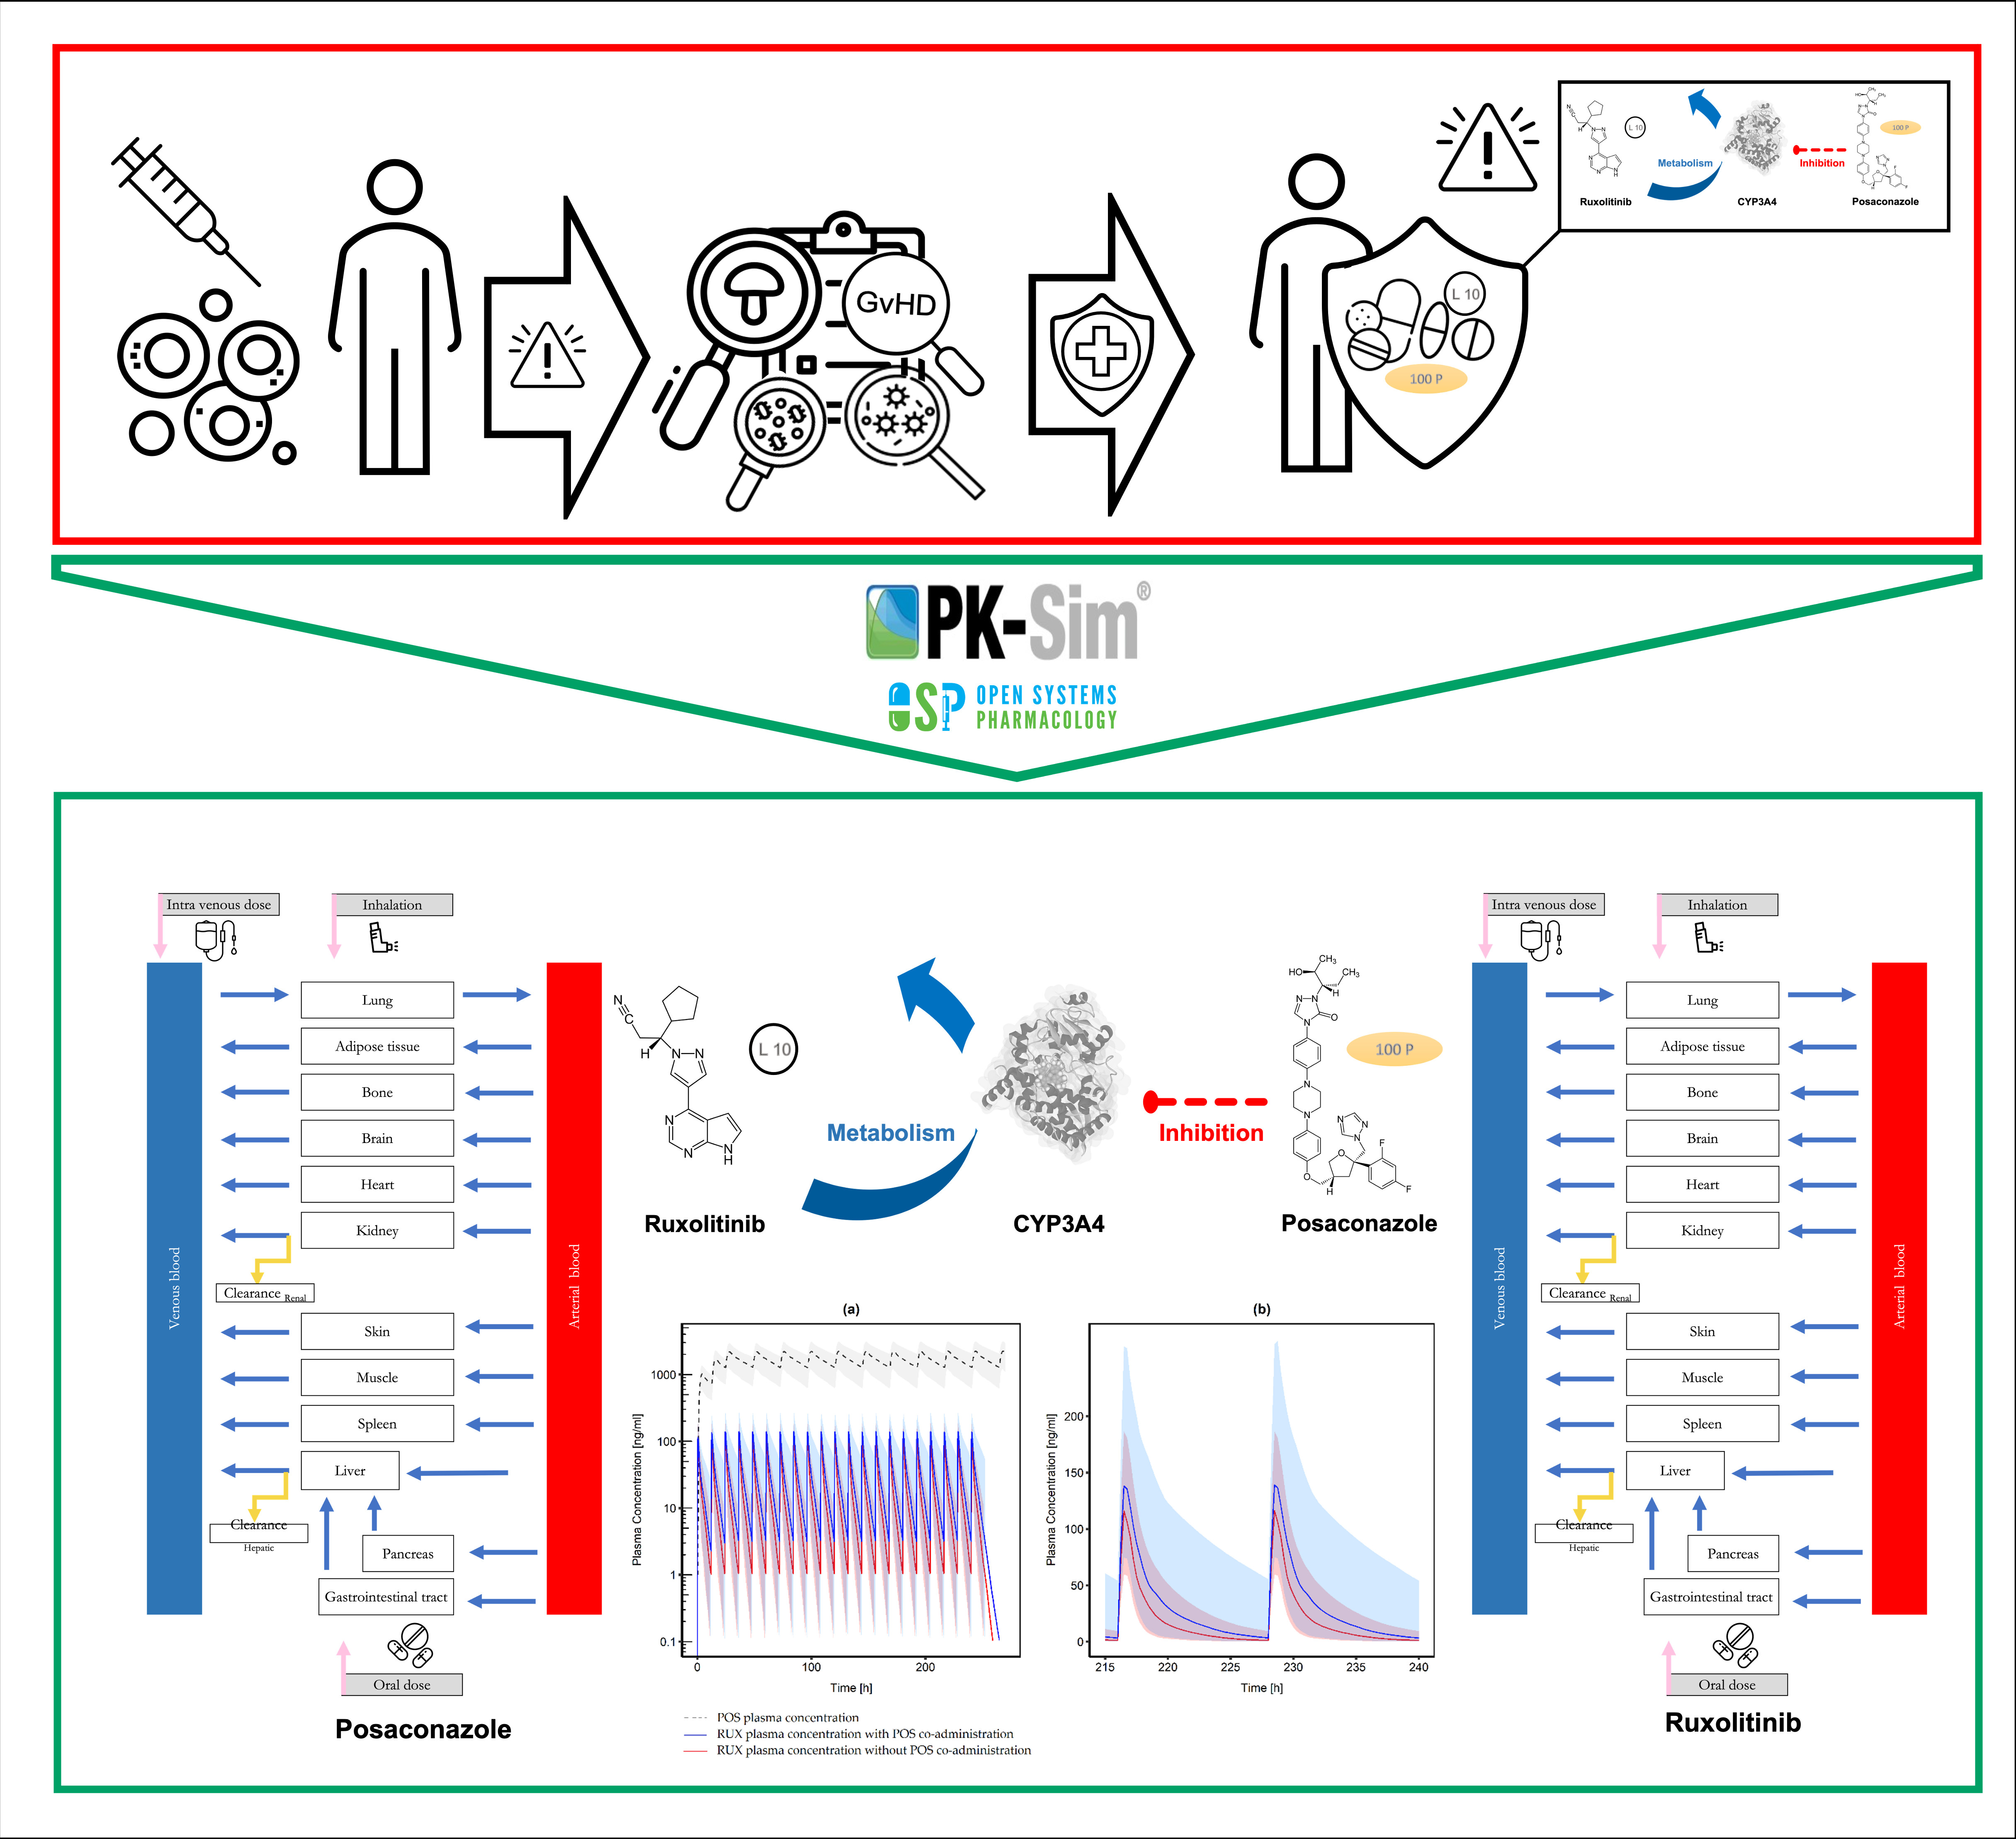
2. Materials and Methods
2.1. Software
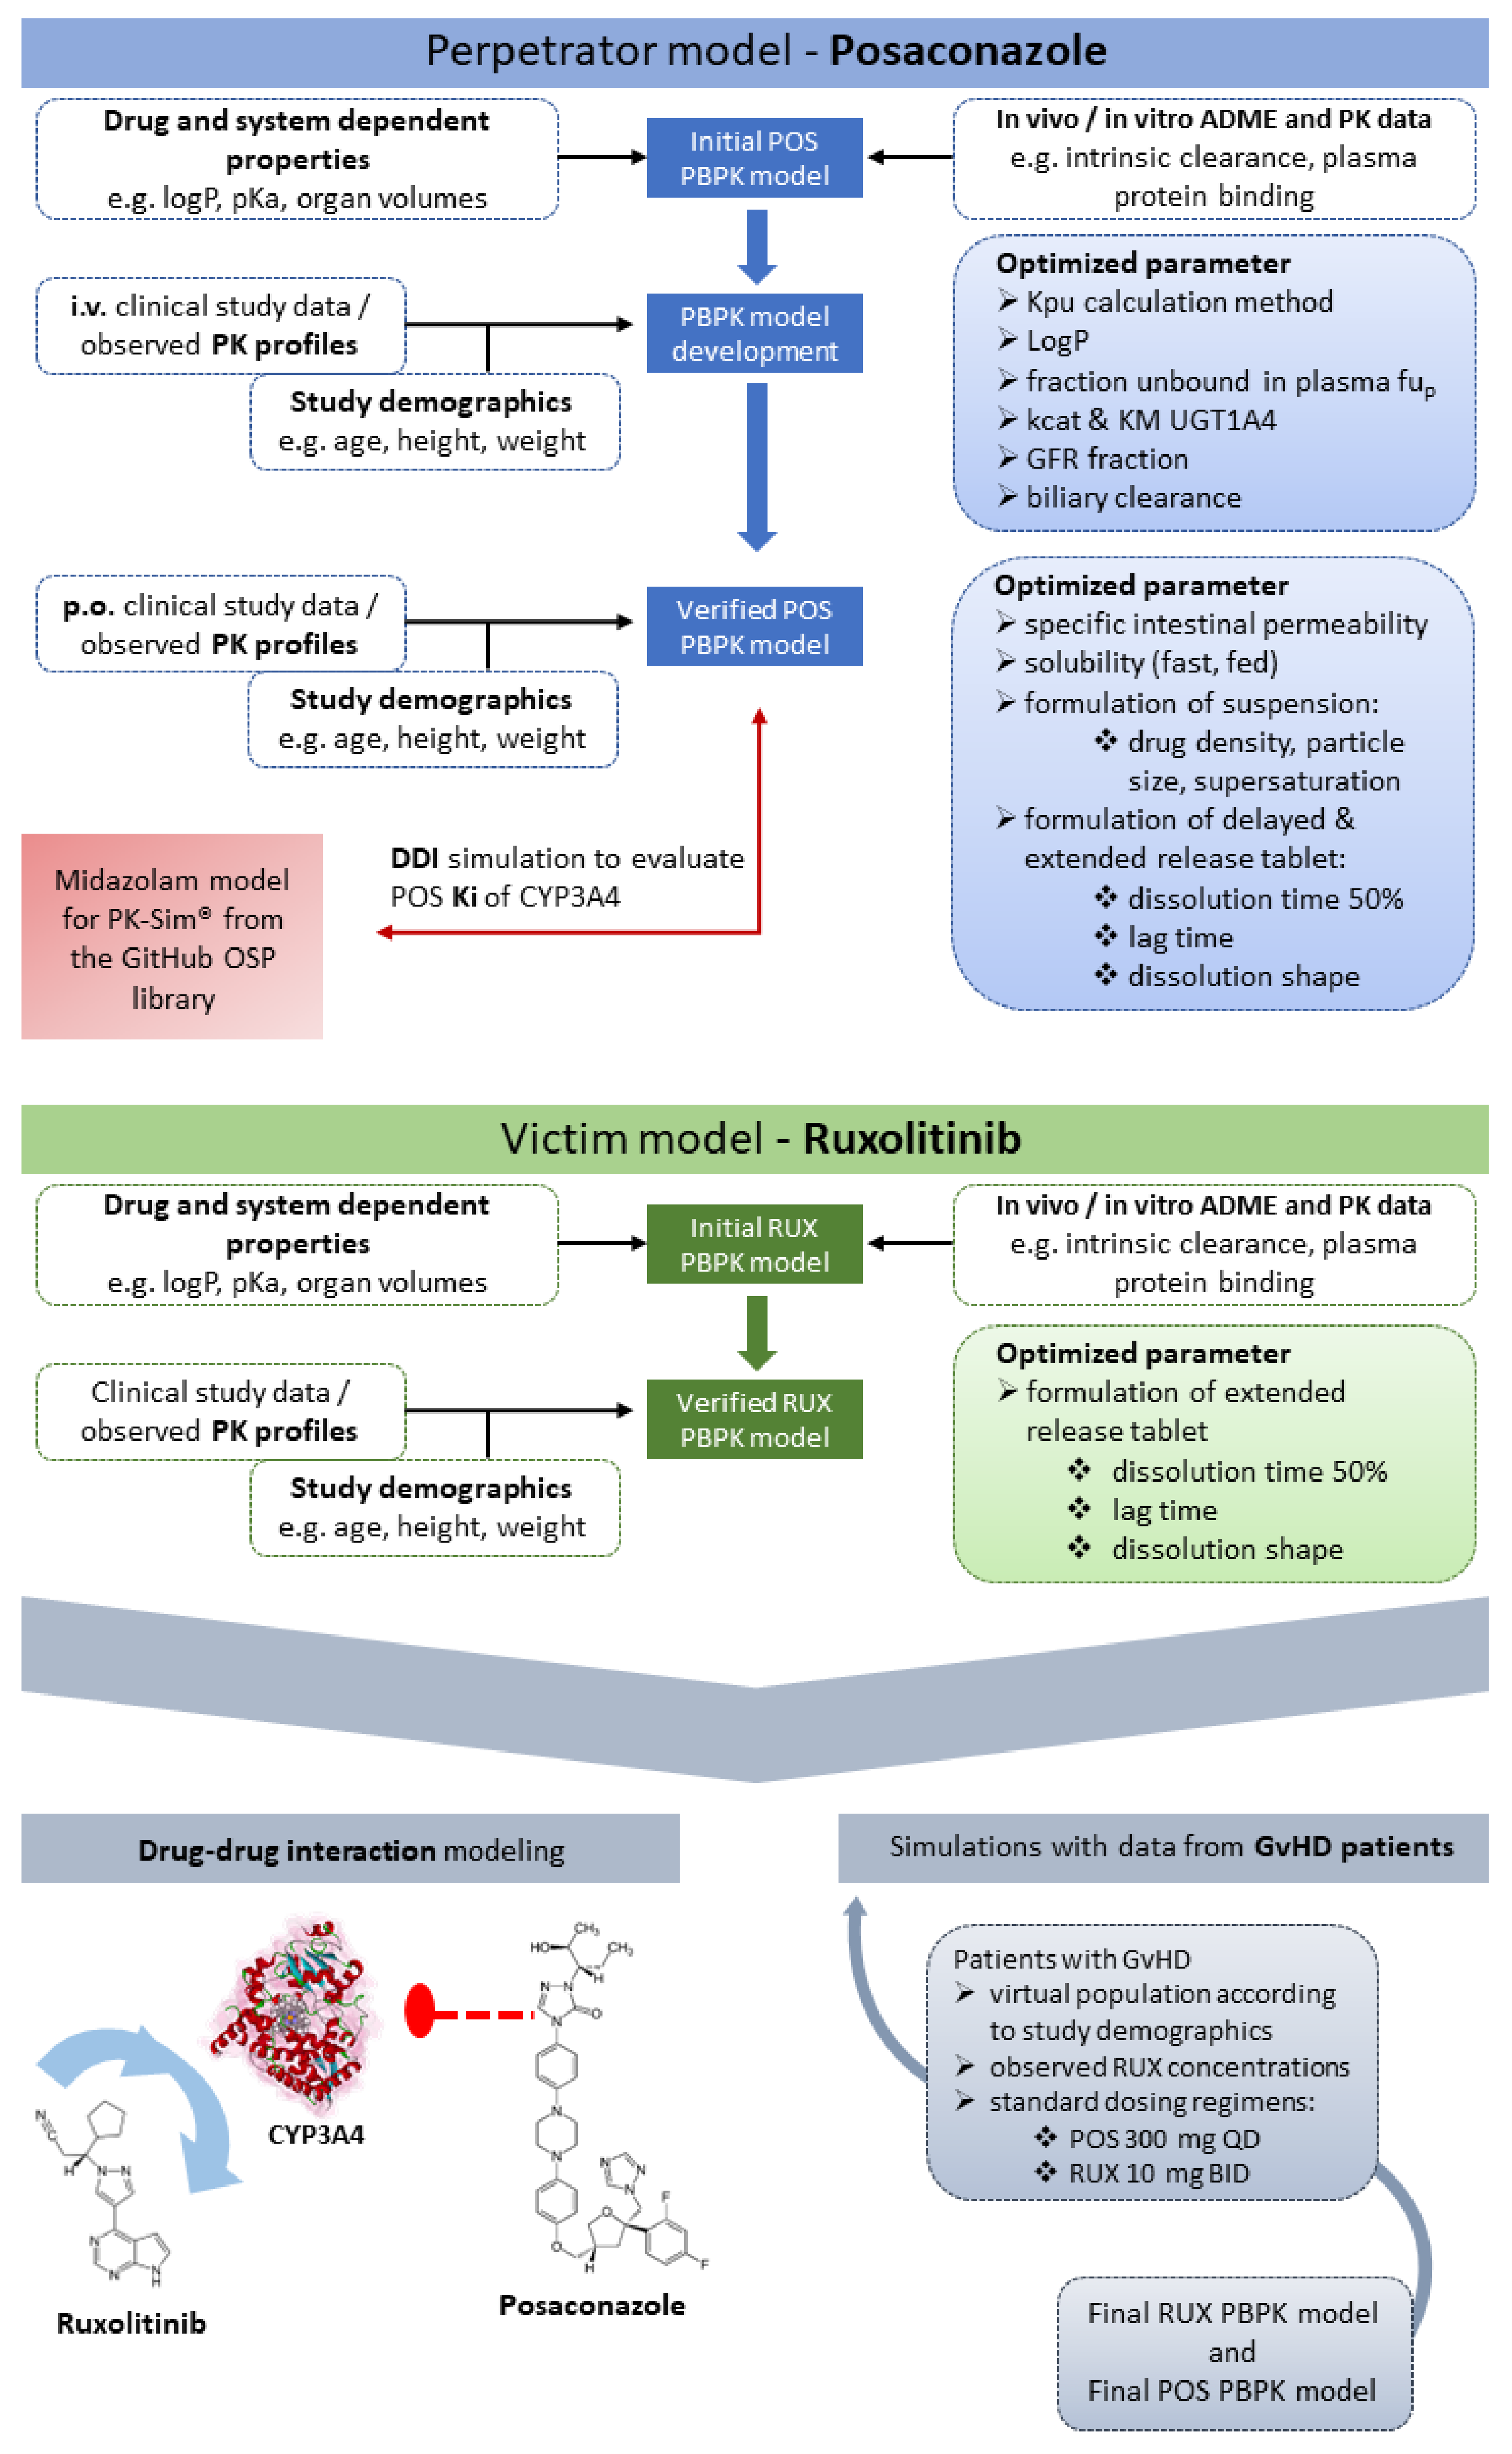
2.2. Posaconazole Model Development
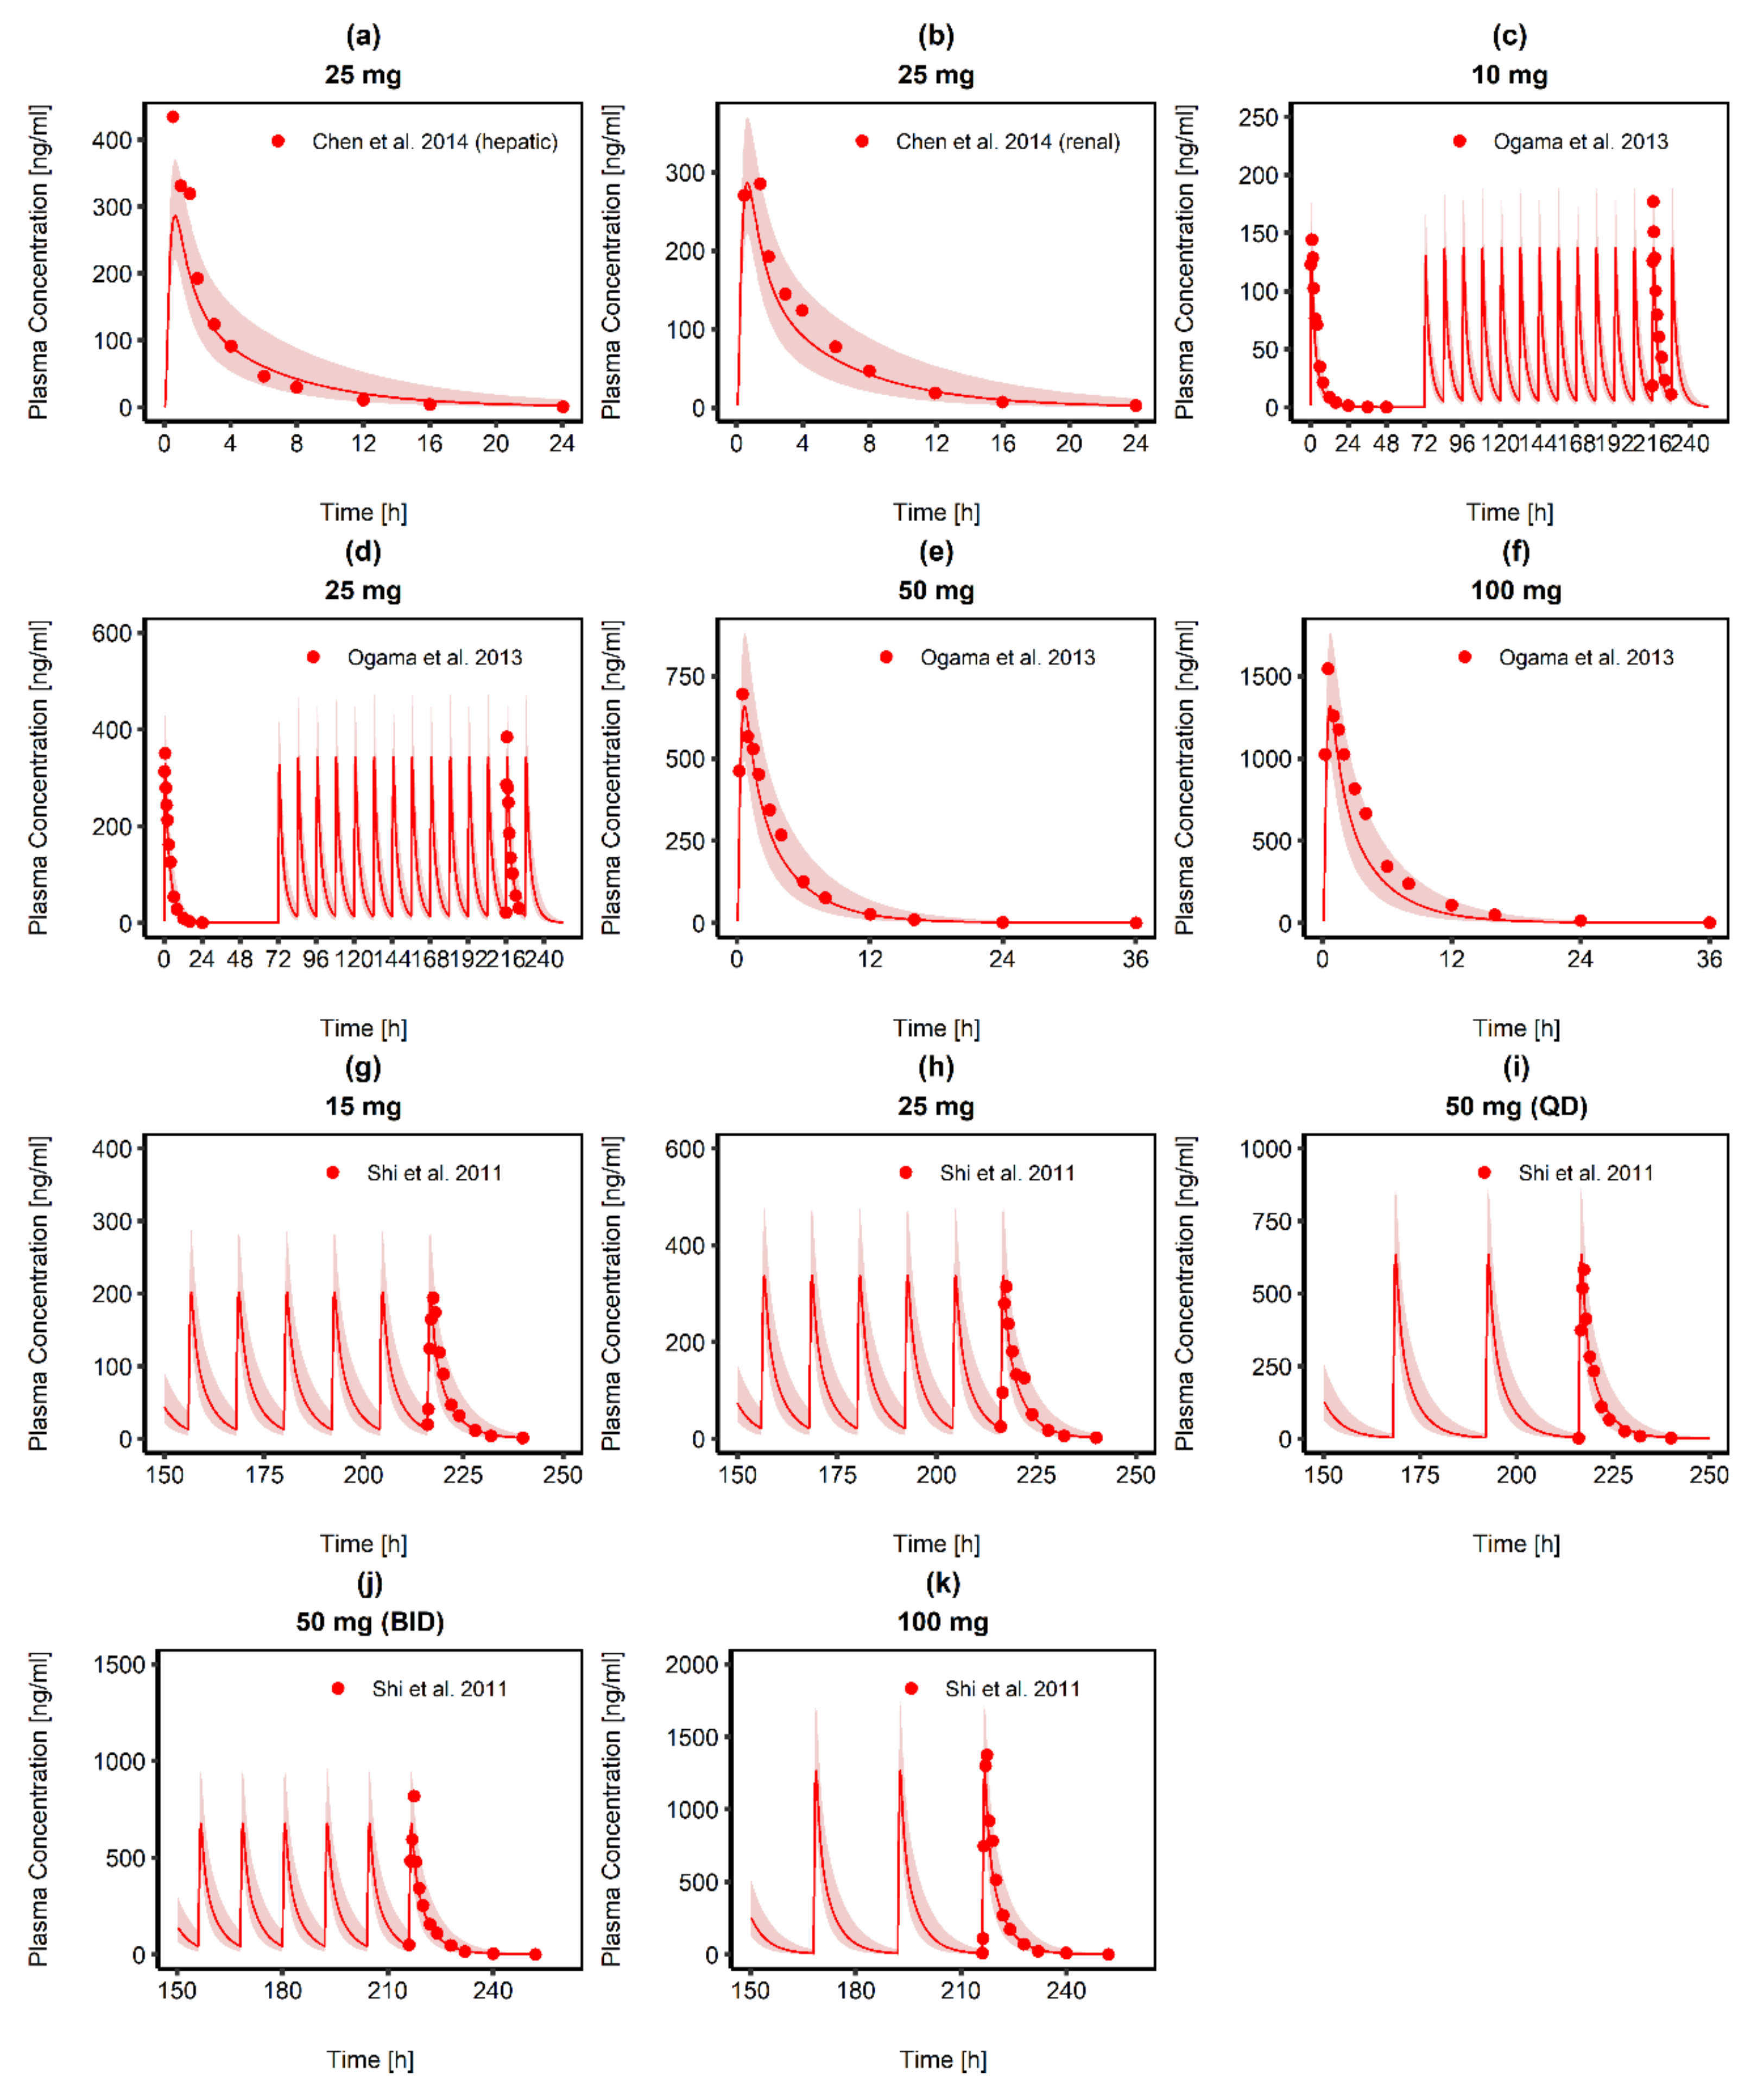
2.3. Ruxolitinib Model Development
2.4. Model Evaluation
2.5. Drug–Drug Interaction between Posaconazole and Midazolam
2.6. Simulations in Graft versus Host Disease Patients
3. Results
3.1. Posaconazole PBPK Model Building and Evaluation
3.2. Ruxolitinib PBPK Model Building and Evaluation
3.3. Drug–Drug Interaction Modeling
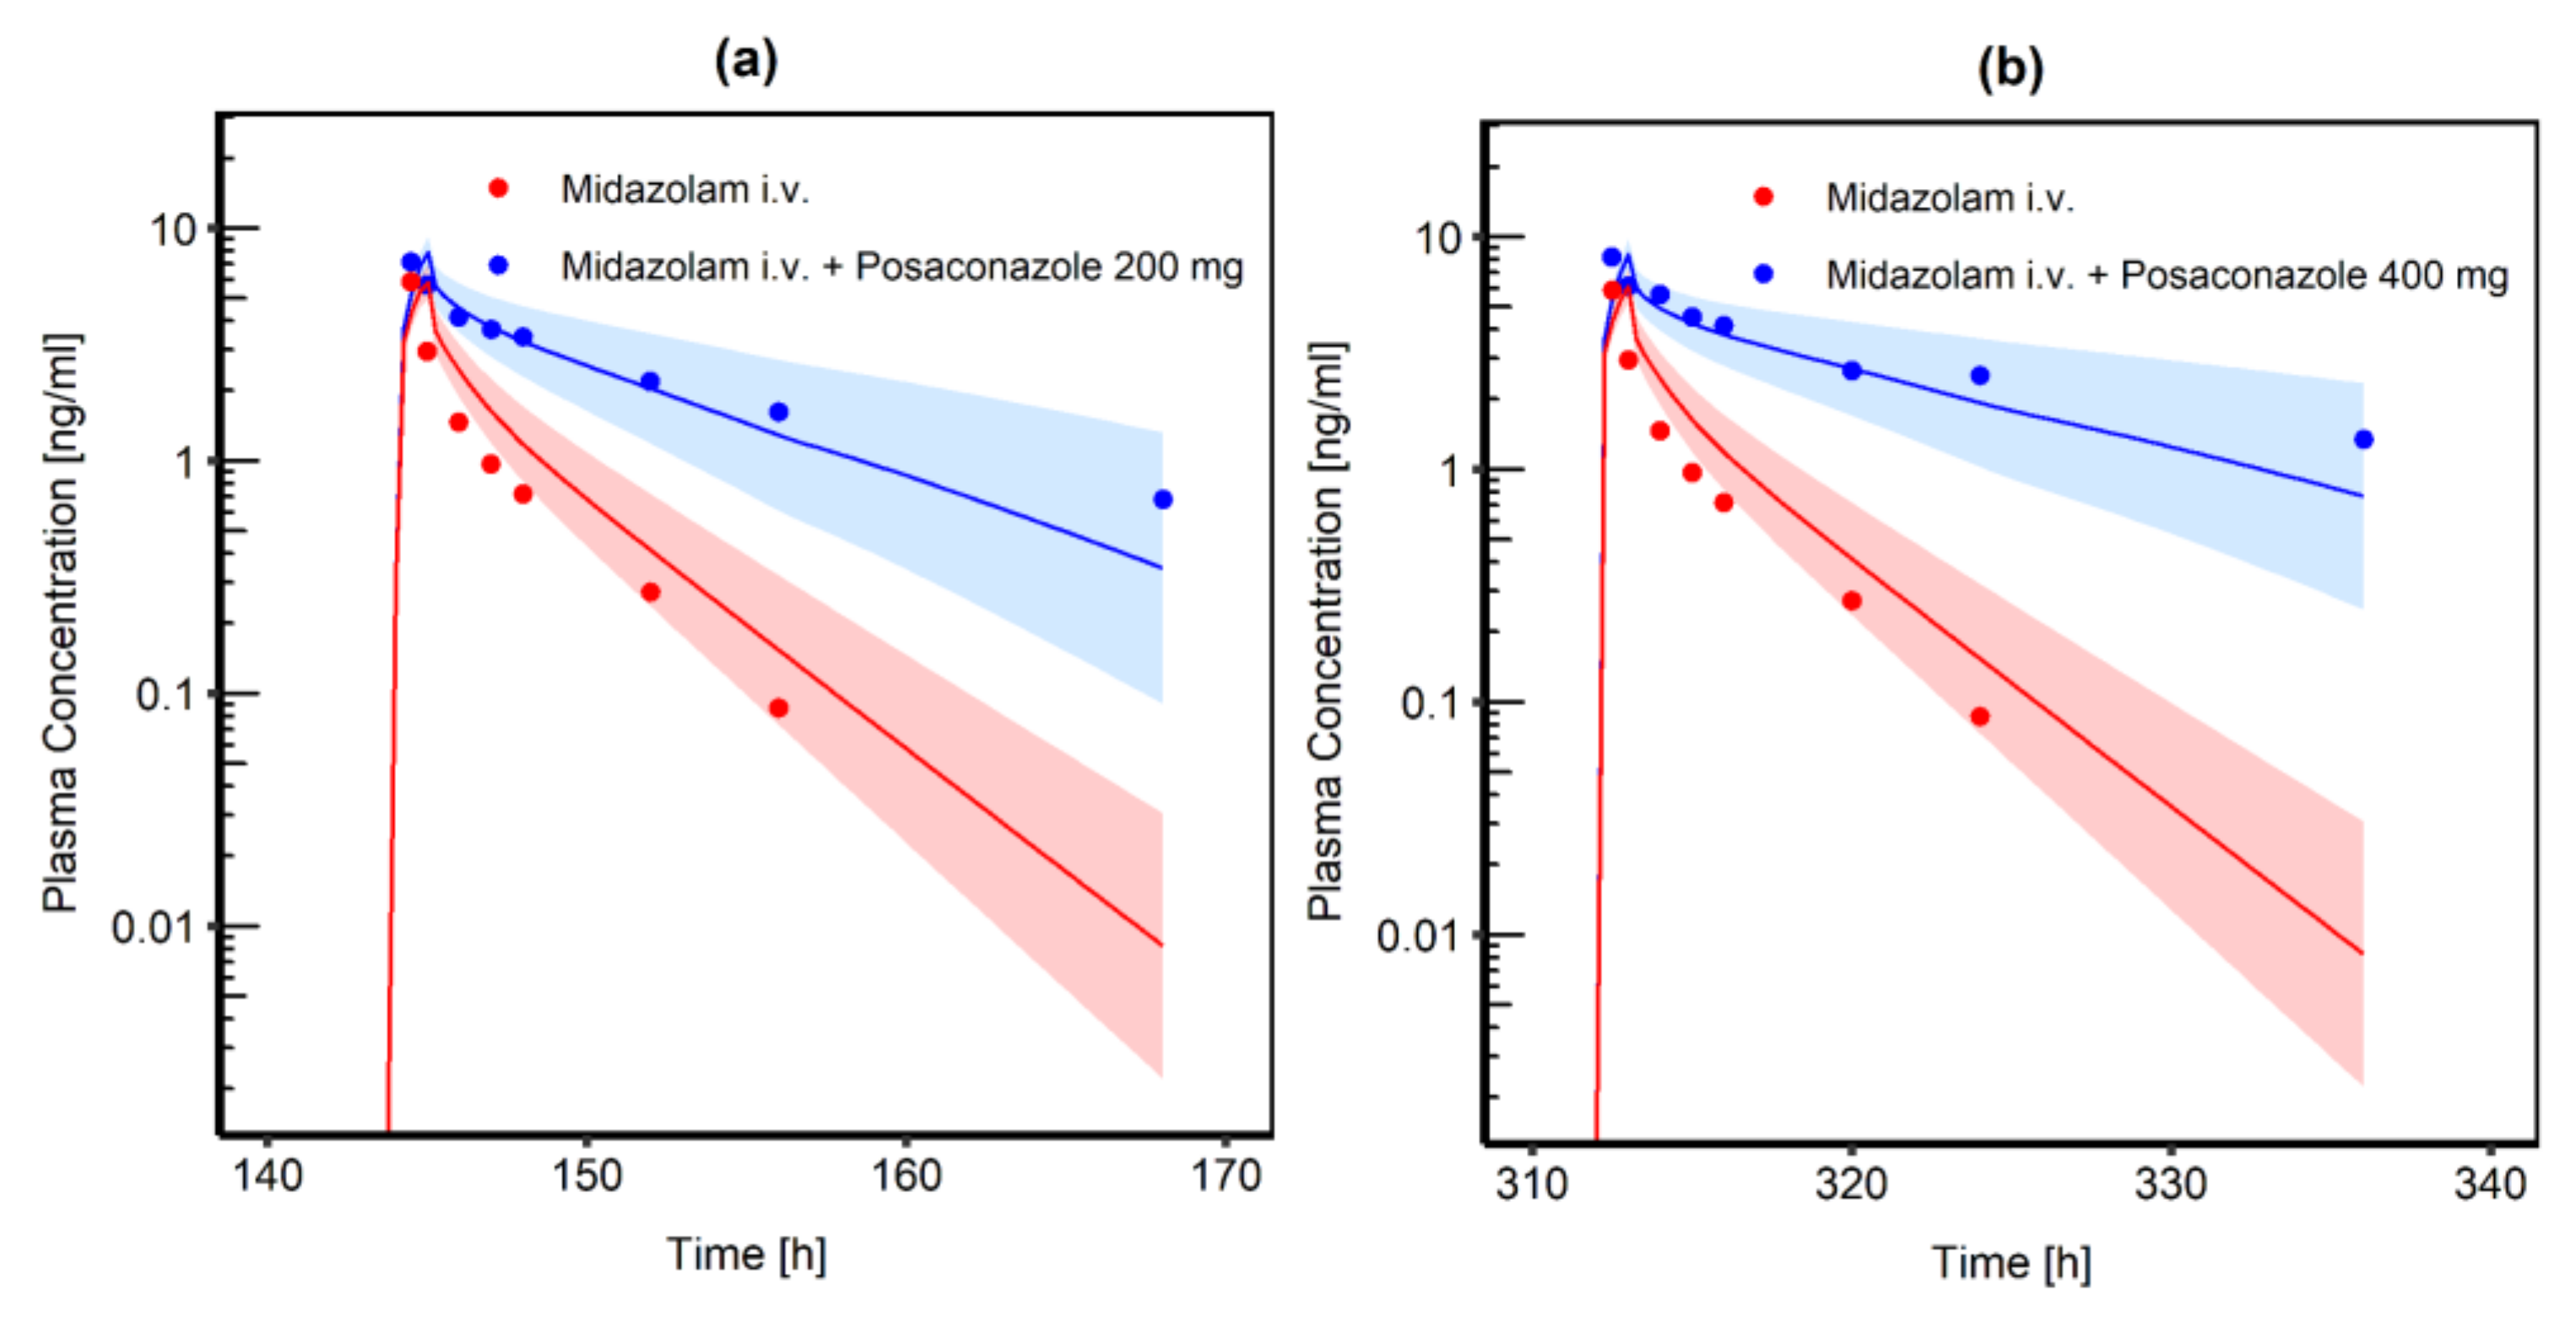
3.3.1. Posaconazole and Midazolam
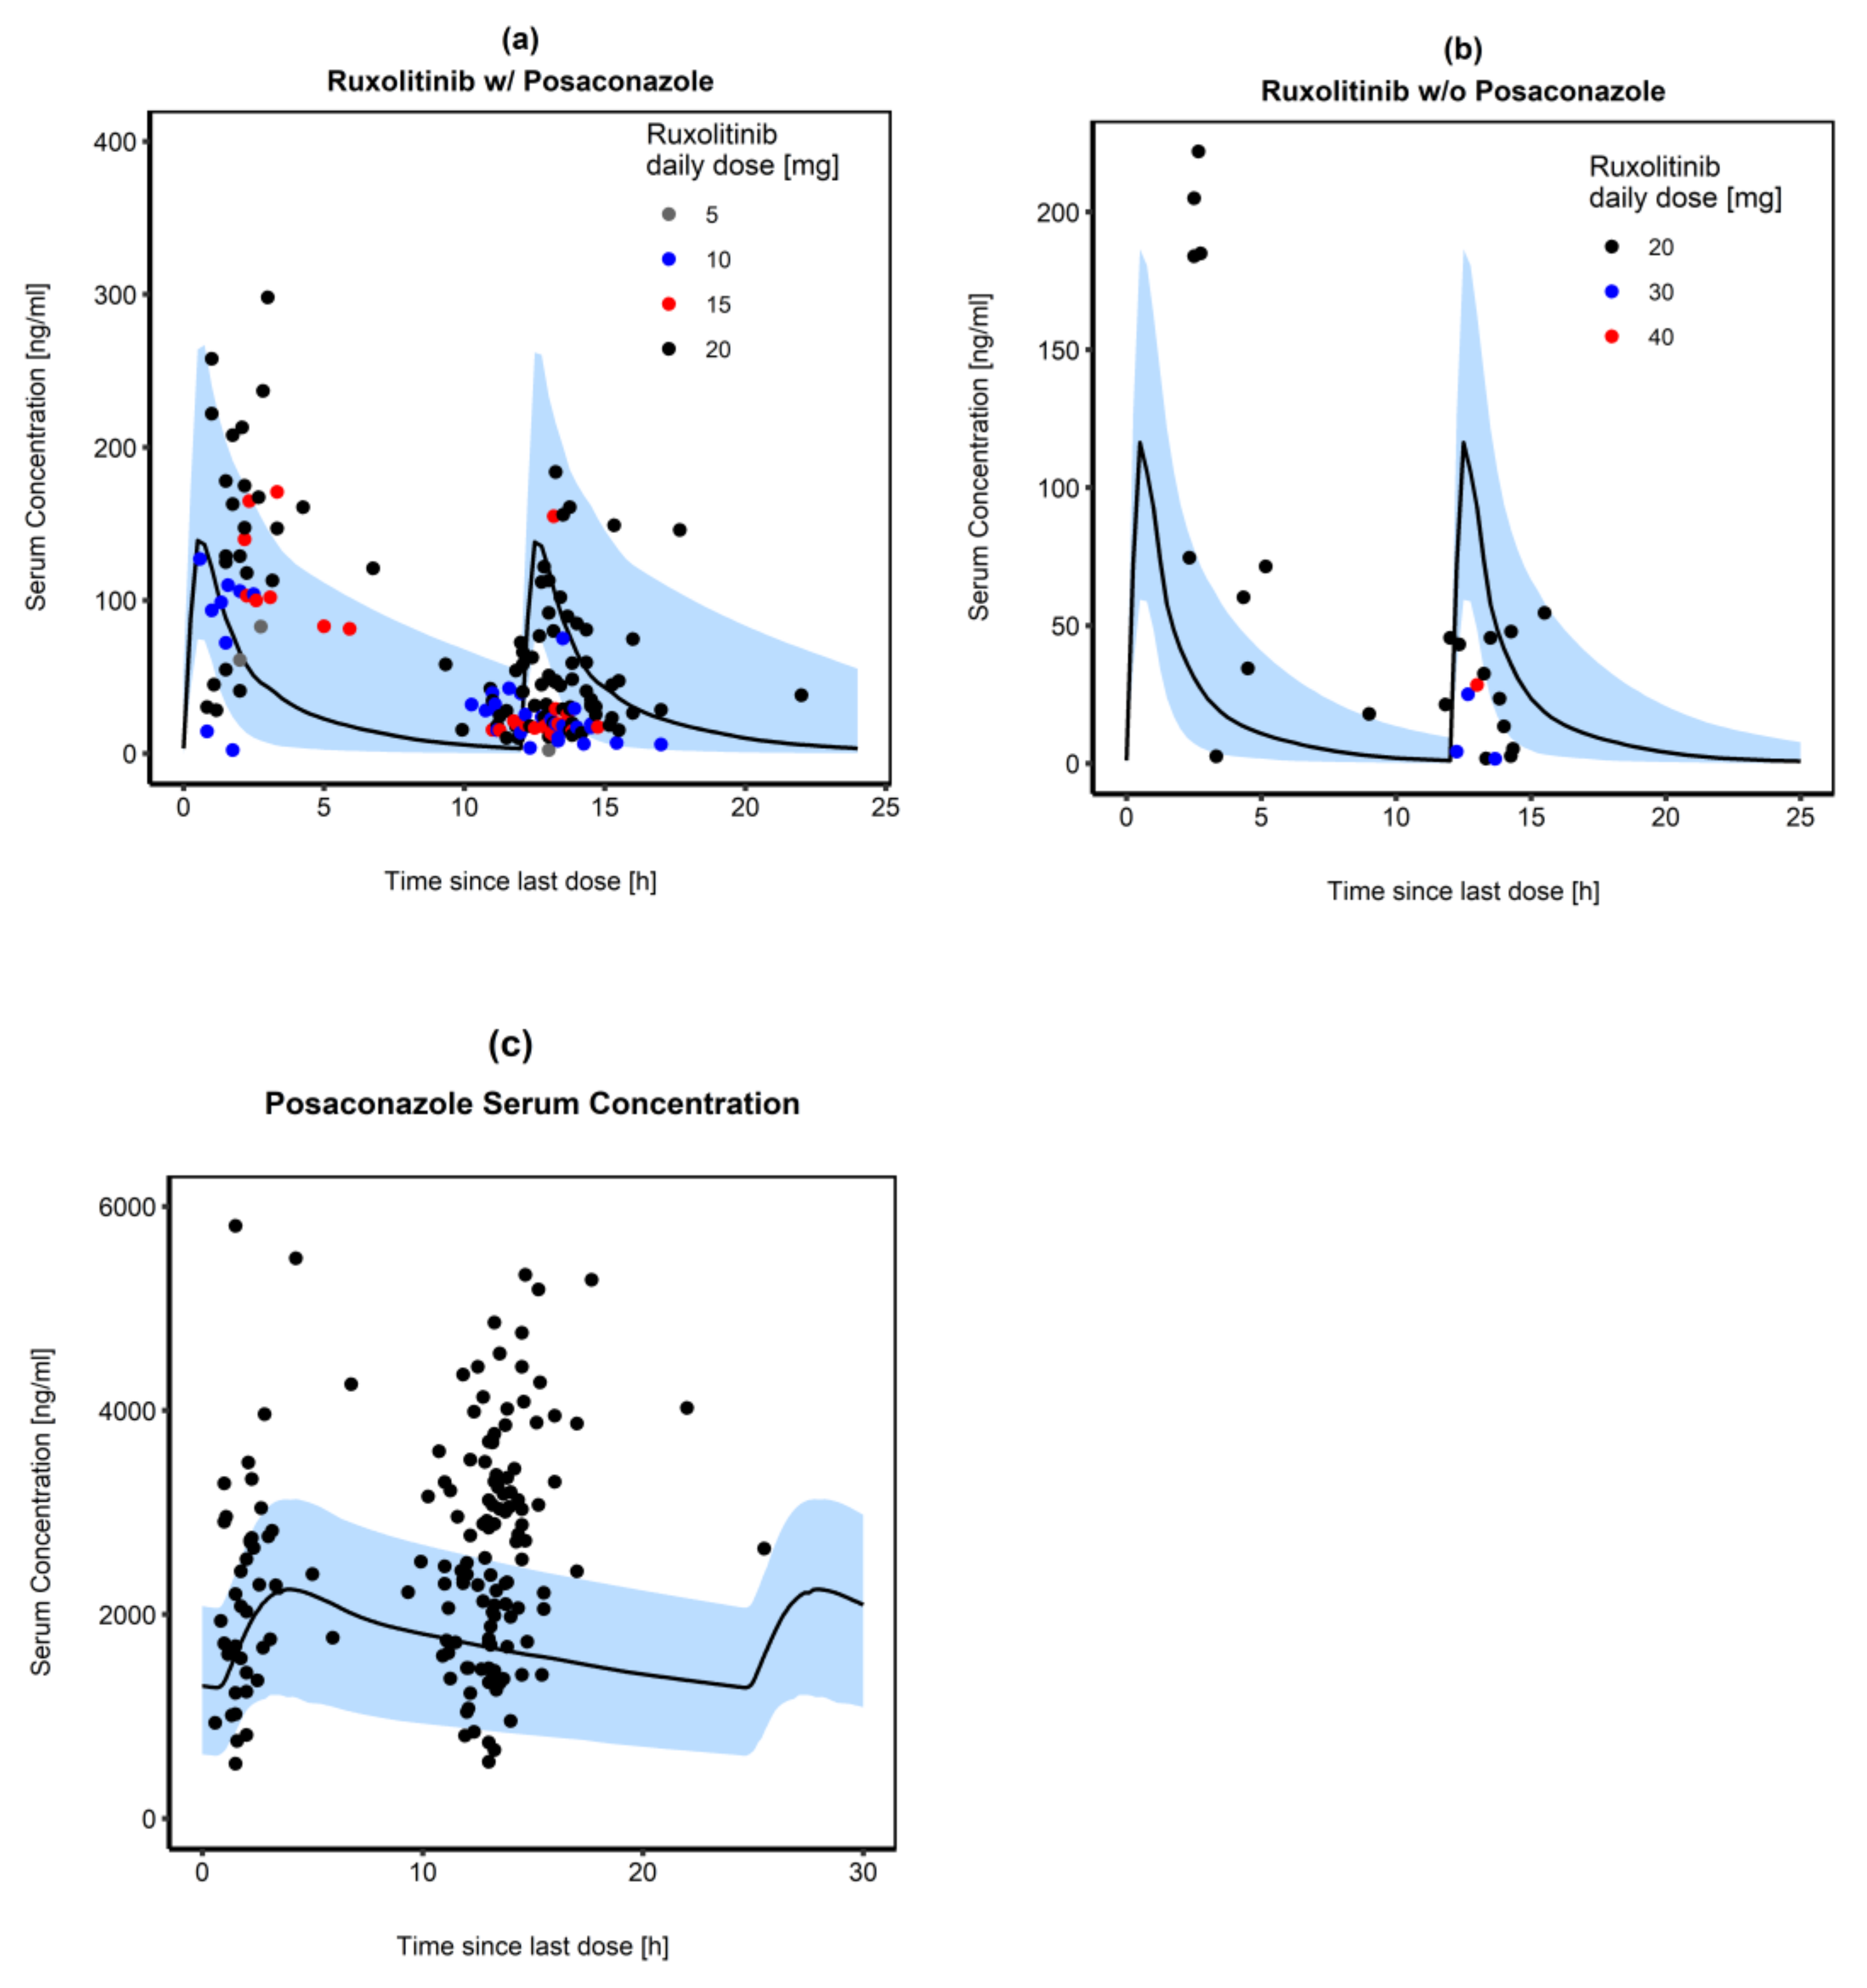
3.3.2. Posaconazole and Ruxolitinib
3.4. Simulation of Graft versus Host Disease Patients
4. Discussion
5. Conclusions
Supplementary Materials
Author Contributions
Funding
Institutional Review Board Statement
Informed Consent Statement
Data Availability Statement
Acknowledgments
Conflicts of Interest
References
- Jamil, M.O.; Mineishi, S. State-of-the-art acute and chronic GVHD treatment. Int. J. Hematol. 2015, 101, 452–466. [Google Scholar] [CrossRef] [Green Version]
- Jagasia, M.; Perales, M.-A.; Schroeder, M.A.; Ali, H.; Shah, N.N.; Chen, Y.-B.; Fazal, S.; Dawkins, F.W.; Arbushites, M.C.; Tian, C. Ruxolitinib for the treatment of steroid-refractory acute GVHD (REACH1): A multicenter, open-label phase 2 trial. Blood 2020, 135, 1739–1749. [Google Scholar] [CrossRef] [PubMed]
- Zeiser, R.; von Bubnoff, N.; Butler, J.; Mohty, M.; Niederwieser, D.; Or, R.; Szer, J.; Wagner, E.M.; Zuckerman, T.; Mahuzier, B. Ruxolitinib for glucocorticoid-refractory acute graft-versus-host disease. N. Engl. J. Med. 2020, 382, 1800–1810. [Google Scholar] [CrossRef]
- Zeiser, R.; Polverelli, N.; Ram, R.; Hashmi, S.K.; Chakraverty, R.; Middeke, J.M.; Musso, M.; Giebel, S.; Uzay, A.; Langmuir, P. Ruxolitinib for glucocorticoid-refractory chronic graft-versus-host disease. N. Engl. J. Med. 2021, 385, 228–238. [Google Scholar] [CrossRef]
- Zeiser, R.; Blazar, B.R. Acute graft-versus-host disease—Biologic process, prevention, and therapy. N. Engl. J. Med. 2017, 377, 2167–2179. [Google Scholar] [CrossRef] [PubMed]
- Martin, P.J.; Rizzo, J.D.; Wingard, J.R.; Ballen, K.; Curtin, P.T.; Cutler, C.; Litzow, M.R.; Nieto, Y.; Savani, B.N.; Schriber, J.R. First-and second-line systemic treatment of acute graft-versus-host disease: Recommendations of the American Society of Blood and Marrow Transplantation. Biol. Blood Marrow Transplant. 2012, 18, 1150–1163. [Google Scholar] [CrossRef] [PubMed] [Green Version]
- Bhatti, Z.; Shaukat, A.; Almyroudis, N.G.; Segal, B.H. Review of epidemiology, diagnosis, and treatment of invasive mould infections in allogeneic hematopoietic stem cell transplant recipients. Mycopathologia 2006, 162, 1–15. [Google Scholar] [CrossRef]
- Maertens, J.A.; Girmenia, C.; Brüggemann, R.J.; Duarte, R.F.; Kibbler, C.C.; Ljungman, P.; Racil, Z.; Ribaud, P.; Slavin, M.A.; Cornely, O.A. European guidelines for primary antifungal prophylaxis in adult haematology patients: Summary of the updated recommendations from the European Conference on Infections in Leukaemia. J. Antimicrob. Chemother. 2018, 73, 3221–3230. [Google Scholar] [CrossRef]
- Ullmann, A.J.; Lipton, J.H.; Vesole, D.H.; Chandrasekar, P.; Langston, A.; Tarantolo, S.R.; Greinix, H.; Morais de Azevedo, W.; Reddy, V.; Boparai, N.; et al. Posaconazole or fluconazole for prophylaxis in severe graft-versus-host disease. N. Engl. J. Med. 2007, 356, 335–347. [Google Scholar] [CrossRef]
- Chen, L.; Krekels, E.H.; Verweij, P.; Buil, J.B.; Knibbe, C.A.; Brüggemann, R.J. Pharmacokinetics and pharmacodynamics of posaconazole. Drugs 2020, 80, 671–695. [Google Scholar] [CrossRef]
- Czyrski, A.; Resztak, M.; Świderski, P.; Brylak, J.; Główka, F.K. The Overview on the Pharmacokinetic and Pharmacodynamic Interactions of Triazoles. Pharmaceutics 2021, 13, 1961. [Google Scholar] [CrossRef] [PubMed]
- Lipp, H.P. Clinical pharmacodynamics and pharmacokinetics of the antifungal extended-spectrum triazole posaconazole: An overview. Br. J. Clin. Pharmacol. 2010, 70, 471–480. [Google Scholar] [CrossRef] [PubMed] [Green Version]
- Reinwald, M.; Boch, T.; Hofmann, W.-K.; Buchheidt, D. Risk of infectious complications in hemato-oncological patients treated with kinase inhibitors. Biomark. Insights 2015, 10, BMI.S22430. [Google Scholar] [CrossRef] [PubMed]
- Mellinghoff, S.C.; Panse, J.; Alakel, N.; Behre, G.; Buchheidt, D.; Christopeit, M.; Hasenkamp, J.; Kiehl, M.; Koldehoff, M.; Krause, S.W. Primary prophylaxis of invasive fungal infections in patients with haematological malignancies: 2017 update of the recommendations of the Infectious Diseases Working Party (AGIHO) of the German Society for Haematology and Medical Oncology (DGHO). Ann. Hematol. 2018, 97, 197–207. [Google Scholar] [CrossRef] [PubMed] [Green Version]
- European Medicines Agency (EMA)-Assessment Report Jakavi (Ruxolitinib). Available online: https://www.ema.europa.eu/en/documents/assessment-report/jakavi-epar-public-assessment-report_en.pdf (accessed on 30 August 2022).
- U.S. Food and Drug Administration. Clinical Drug Interaction Studies—Cytochrome P450 Enzyme- and Transporter-Mediated Drug Interactions Guidance for Industry. 2020. Available online: https://www.fda.gov/regulatory-information/search-fda-guidance-documents/clinical-drug-interaction-studies-cytochrome-p450-enzyme-and-transporter-mediated-drug-interactions (accessed on 5 August 2022).
- European Medicines Agency. Jakavi Summary of Product Characteristics. Available online: https://www.ema.europa.eu/en/documents/product-information/jakavi-epar-product-information_en.pdf (accessed on 10 June 2022).
- U.S. Food and Drug Administration. The Use of Physiologically Based Pharmacokinetic Analyses—Biopharmaceutics Applications for Oral Drug Product Development, Manufacturing Changes, and Controls. 2020. Available online: https://www.fda.gov/regulatory-information/search-fda-guidance-documents/use-physiologically-based-pharmacokinetic-analyses-biopharmaceutics-applications-oral-drug-product (accessed on 5 August 2022).
- European Medicines Agency. Guideline on the Reporting of Physiologically Based Pharmacokinetic (PBPK) Modelling and Simulation. 2018. Available online: https://www.ema.europa.eu/en/reporting-physiologically-based-pharmacokinetic-pbpk-modelling-simulation (accessed on 28 August 2022).
- Grimstein, M.; Yang, Y.; Zhang, X.; Grillo, J.; Huang, S.-M.; Zineh, I.; Wang, Y. Physiologically based pharmacokinetic modeling in regulatory science: An update from the US Food and Drug Administration’s Office of Clinical Pharmacology. J. Pharm. Sci. 2019, 108, 21–25. [Google Scholar] [CrossRef] [Green Version]
- Wagner, C.; Pan, Y.; Hsu, V.; Grillo, J.A.; Zhang, L.; Reynolds, K.S.; Sinha, V.; Zhao, P. Predicting the effect of cytochrome P450 inhibitors on substrate drugs: Analysis of physiologically based pharmacokinetic modeling submissions to the US Food and Drug Administration. Clin. Pharmacokinet. 2015, 54, 117–127. [Google Scholar] [CrossRef]
- Darwich, A.; Ogungbenro, K.; Vinks, A.A.; Powell, J.R.; Reny, J.L.; Marsousi, N.; Daali, Y.; Fairman, D.; Cook, J.; Lesko, L.J. Why has model-informed precision dosing not yet become common clinical reality? Lessons from the past and a roadmap for the future. Clin. Pharmacol. Ther. 2017, 101, 646–656. [Google Scholar] [CrossRef]
- Luzon, E.; Blake, K.; Cole, S.; Nordmark, A.; Versantvoort, C.; Berglund, E.G. Physiologically based pharmacokinetic modeling in regulatory decision-making at the European Medicines Agency. Clin. Pharmacol. Ther. 2017, 102, 98–105. [Google Scholar] [CrossRef]
- Open Systems Pharmacology. PK-Sim®. Version 11.0. Available online: https://github.com/Open-Systems-Pharmacology/Suite/releases/tag/v11.0 (accessed on 1 May 2022).
- R Core Team. R: A Language and Environment for Statistical Computing; R Foundation for Statistical Computing: Vienna, Austria, 2017. [Google Scholar]
- Kersemaekers, W.M.; van Iersel, T.; Nassander, U.; O’Mara, E.; Waskin, H.; Caceres, M.; van Iersel, M.L. Pharmacokinetics and safety study of posaconazole intravenous solution administered peripherally to healthy subjects. Antimicrob. Agents Chemother. 2015, 59, 1246–1251. [Google Scholar] [CrossRef] [Green Version]
- Hens, B.; Pathak, S.M.; Mitra, A.; Patel, N.; Liu, B.; Patel, S.; Jamei, M.; Brouwers, J.; Augustijns, P.; Turner, D.B. In silico modeling approach for the evaluation of gastrointestinal dissolution, supersaturation, and precipitation of posaconazole. Mol. Pharm. 2017, 14, 4321–4333. [Google Scholar] [CrossRef]
- Hens, B.; Bolger, M.B. Application of a Dynamic Fluid and pH Model to Simulate Intraluminal and Systemic Concentrations of a Weak Base in GastroPlusTM. J. Pharm. Sci. 2019, 108, 305–315. [Google Scholar] [CrossRef] [PubMed] [Green Version]
- Ghosal, A.; Hapangama, N.; Yuan, Y.; Achanfuo-Yeboah, J.; Iannucci, R.; Chowdhury, S.; Alton, K.; Patrick, J.E.; Zbaida, S. Identification of human UDP-glucuronosyltransferase enzyme (s) responsible for the glucuronidation of posaconazole (Noxafil). Drug Metab. Dispos. 2004, 32, 267–271. [Google Scholar] [CrossRef] [PubMed]
- Li, H.; Wei, Y.; Zhang, S.; Xu, L.; Jiang, J.; Qiu, Y.; Mangin, E.; Zhao, X.M.; Xie, S. Pharmacokinetics and Safety of Posaconazole Administered by Intravenous Solution and Oral Tablet in Healthy Chinese Subjects and Effect of Food on Tablet Bioavailability. Clin. Drug. Investig. 2019, 39, 1109–1116. [Google Scholar] [CrossRef] [PubMed]
- Kersemaekers, W.M.; Dogterom, P.; Xu, J.; Marcantonio, E.E.; de Greef, R.; Waskin, H.; van Iersel, M.L. Effect of a high-fat meal on the pharmacokinetics of 300-milligram posaconazole in a solid oral tablet formulation. Antimicrob. Agents Chemother. 2015, 59, 3385–3389. [Google Scholar] [CrossRef] [PubMed] [Green Version]
- Krishna, G.; Ma, L.; Martinho, M.; O’Mara, E. Single-dose phase I study to evaluate the pharmacokinetics of posaconazole in new tablet and capsule formulations relative to oral suspension. Antimicrob. Agents Chemother. 2012, 56, 4196–4201. [Google Scholar] [CrossRef] [PubMed] [Green Version]
- Krishna, G.; Ma, L.; Martinho, M.; Preston, R.; O’Mara, E. A new solid oral tablet formulation of posaconazole: A randomized clinical trial to investigate rising single-and multiple-dose pharmacokinetics and safety in healthy volunteers. J. Antimicrob. Chemother. 2012, 67, 2725–2730. [Google Scholar] [CrossRef] [Green Version]
- Fallingborg, J. Intraluminal pH of the human gastrointestinal tract. Dan. Med. Bull. 1999, 46, 183–196. [Google Scholar]
- Ezzet, F.; Wexler, D.; Courtney, R.; Krishna, G.; Lim, J.; Laughlin, M. Oral bioavailability of posaconazole in fasted healthy subjects. Clin. Pharmacokinet. 2005, 44, 211–220. [Google Scholar] [CrossRef]
- Vuletić, L.; Herceg, M.; Ferderber, K.; Tunjić, I.; Rizea-Savu, S.; Duna, S.N.; Cetina-Čižmek, B.; Filipović-Grčić, J. Single-Dose Pharmacokinetic Properties and Relative Bioavailability of Different Formulations of Posaconazole Oral Suspension in Healthy Volunteers. Clin. Pharmacol. Drug Dev. 2019, 8, 827–836. [Google Scholar] [CrossRef]
- Courtney, R.; Wexler, D.; Radwanski, E.; Lim, J.; Laughlin, M. Effect of food on the relative bioavailability of two oral formulations of posaconazole in healthy adults. Br. J. Clin. Pharmacol. 2004, 57, 218–222. [Google Scholar] [CrossRef] [Green Version]
- Ogama, Y.; Mineyama, T.; Yamamoto, A.; Woo, M.; Shimada, N.; Amagasaki, T.; Natsume, K. A randomized dose-escalation study to assess the safety, tolerability, and pharmacokinetics of ruxolitinib (INC424) in healthy Japanese volunteers. Int. J. Hematol. 2013, 97, 351–359. [Google Scholar] [CrossRef]
- Chen, X.; Shi, J.G.; Emm, T.; Scherle, P.A.; McGee, R.F.; Lo, Y.; Landman, R.R.; Punwani, N.G.; Williams, W.V.; Yeleswaram, S. Pharmacokinetics and pharmacodynamics of orally administered ruxolitinib (INCB018424 phosphate) in renal and hepatic impairment patients. Clin. Pharmacol. Drug Dev. 2014, 3, 34–42. [Google Scholar] [CrossRef]
- Shi, J.G.; Chen, X.; McGee, R.F.; Landman, R.R.; Emm, T.; Lo, Y.; Scherle, P.A.; Punwani, N.G.; Williams, W.V.; Yeleswaram, S. The pharmacokinetics, pharmacodynamics, and safety of orally dosed INCB018424 phosphate in healthy volunteers. J. Clin. Pharmacol. 2011, 51, 1644–1654. [Google Scholar] [CrossRef]
- U.S. Food and Drug Administration. Physiologically Based Pharmacokinetic Analyses—Format and Content—Guidance for Industry. 2018. Available online: https://www.fda.gov/regulatory-information/search-fda-guidance-documents/physiologically-based-pharmacokinetic-analyses-format-and-content-guidance-industry (accessed on 28 August 2022).
- Edginton, A.N.; Schmitt, W.; Willmann, S. Development and evaluation of a generic physiologically based pharmacokinetic model for children. Clin. Pharmacokinet. 2006, 45, 1013–1034. [Google Scholar] [CrossRef]
- Frechen, S.; Hanke, N.; Solodenko, J.; Dallmann, A. Midazolam-Model. Available online: https://github.com/Open-Systems-Pharmacology/Midazolam-Model (accessed on 20 May 2021).
- Krishna, G.; Moton, A.; Ma, L.; Savant, I.; Martinho, M.; Seiberling, M.; McLeod, J. Effects of oral posaconazole on the pharmacokinetic properties of oral and intravenous midazolam: A phase I, randomized, open-label, crossover study in healthy volunteers. Clin. Ther. 2009, 31, 286–298. [Google Scholar] [CrossRef]
- Aghai, F.; Zimmermann, S.; Kurlbaum, M.; Jung, P.; Pelzer, T.; Klinker, H.; Isberner, N.; Scherf-Clavel, O. Development and validation of a sensitive liquid chromatography tandem mass spectrometry assay for the simultaneous determination of ten kinase inhibitors in human serum and plasma. Anal. Bioanal. Chem. 2021, 413, 599–612. [Google Scholar] [CrossRef]
- Kahle, K.; Langmann, P.; Schirmer, D.; Lenker, U.; Keller, D.; Helle, A.; Klinker, H.; Heinz, W.J. Simultaneous determination of voriconazole and posaconazole concentrations in human plasma by high-performance liquid chromatography. Antimicrob. Agents Chemother. 2009, 53, 3140–3142. [Google Scholar] [CrossRef] [Green Version]
- Thelen, K.; Coboeken, K.; Willmann, S.; Dressman, J.B.; Lippert, J. Evolution of a detailed physiological model to simulate the gastrointestinal transit and absorption process in humans, part II: Extension to describe performance of solid dosage forms. J. Pharm. Sci. 2012, 101, 1267–1280. [Google Scholar] [CrossRef]
- Thelen, K.; Coboeken, K.; Willmann, S.; Burghaus, R.; Dressman, J.B.; Lippert, J. Evolution of a detailed physiological model to simulate the gastrointestinal transit and absorption process in humans, part 1: Oral solutions. J. Pharm. Sci. 2011, 100, 5324–5345. [Google Scholar] [CrossRef]
- Rodgers, T.; Leahy, D.; Rowland, M. Physiologically based pharmacokinetic modeling 1: Predicting the tissue distribution of moderate-to-strong bases. J. Pharm. Sci. 2005, 94, 1259–1276. [Google Scholar] [CrossRef]
- Rodgers, T.; Rowland, M. Physiologically based pharmacokinetic modelling 2: Predicting the tissue distribution of acids, very weak bases, neutrals and zwitterions. J. Pharm. Sci. 2006, 95, 1238–1257. [Google Scholar] [CrossRef]
- Umehara, K.; Huth, F.; Jin, Y.; Schiller, H.; Aslanis, V.; Heimbach, T.; He, H. Drug-drug interaction (DDI) assessments of ruxolitinib, a dual substrate of CYP3A4 and CYP2C9, using a verified physiologically based pharmacokinetic (PBPK) model to support regulatory submissions. Drug Metab. Pers. Ther. 2019, 34. [Google Scholar] [CrossRef]
- Wexler, D.; Courtney, R.; Richards, W.; Banfield, C.; Lim, J.; Laughlin, M. Effect of posaconazole on cytochrome P450 enzymes: A randomized, open-label, two-way crossover study. Eur. J. Pharm. Sci. 2004, 21, 645–653. [Google Scholar] [CrossRef]
- Isberner, N.; Kraus, S.; Grigoleit, G.U.; Aghai, F.; Kurlbaum, M.; Zimmermann, S.; Klinker, H.; Scherf-Clavel, O. Ruxolitinib exposure in patients with acute and chronic graft versus host disease in routine clinical practice—A prospective single-center trial. Cancer Chemother. Pharmacol. 2021, 88, 973–983. [Google Scholar] [CrossRef]
- Bhatnagar, S.; Mukherjee, D.; Salem, A.H.; Miles, D.; Menon, R.M.; Gibbs, J.P. Dose adjustment of venetoclax when co-administered with posaconazole: Clinical drug-drug interaction predictions using a PBPK approach. Cancer Chemother. Pharmcol. 2021, 87, 465–474. [Google Scholar] [CrossRef]
- Hens, B.; Talattof, A.; Paixao, P.; Bermejo, M.; Tsume, Y.; Lobenberg, R.; Amidon, G.L. Measuring the Impact of Gastrointestinal Variables on the Systemic Outcome of Two Suspensions of Posaconazole by a PBPK Model. AAPS J. 2018, 20, 57. [Google Scholar] [CrossRef]
- Cristofoletti, R.; Patel, N.; Dressman, J.B. Assessment of Bioequivalence of Weak Base Formulations Under Various Dosing Conditions Using Physiologically Based Pharmacokinetic Simulations in Virtual Populations. Case Examples: Ketoconazole and Posaconazole. J. Pharm. Sci. 2017, 106, 560–569. [Google Scholar] [CrossRef]
- Cristofoletti, R.; Patel, N.; Dressman, J.B. Differences in Food Effects for 2 Weak Bases With Similar BCS Drug-Related Properties: What Is Happening in the Intestinal Lumen? J. Pharm. Sci. 2016, 105, 2712–2722. [Google Scholar] [CrossRef] [Green Version]
- Chen, K.F.; Chan, L.N.; Lin, Y.S. PBPK modeling of CYP3A and P-gp substrates to predict drug-drug interactions in patients undergoing Roux-en-Y gastric bypass surgery. J. Pharm. Pharm. 2020, 47, 493–512. [Google Scholar] [CrossRef]
- Cleary, Y.; Gertz, M.; Morcos, P.N.; Yu, L.; Youdim, K.; Phipps, A.; Fowler, S.; Parrott, N. Model-Based Assessments of CYP-Mediated Drug–Drug Interaction Risk of Alectinib: Physiologically Based Pharmacokinetic Modeling Supported Clinical Development. Clin. Pharmacol. Ther. 2018, 104, 505–514. [Google Scholar] [CrossRef]
- Aslanis, V.; Umehara, K.; Huth, F.; Ouatas, T.; Bharathy, S.; Butler, A.A.; Zhou, W.; Gadbaw, B. Multiple administrations of fluconazole increase plasma exposure to ruxolitinib in healthy adult subjects. Cancer Chemother. Pharmacol. 2019, 84, 749–757. [Google Scholar] [CrossRef] [PubMed]
- Shi, J.G.; Fraczkiewicz, G.; Williams, W.V.; Yeleswaram, S. Predicting drug-drug interactions involving multiple mechanisms using physiologically based pharmacokinetic modeling: A case study with ruxolitinib. Clin. Pharmacol. Ther. 2015, 97, 177–185. [Google Scholar] [CrossRef] [PubMed]
- Chen, X.; Liu, X.; Wang, P.; Yeleswaram, S. Population Pharmacokinetics of Ruxolitinib in Patients with aGVHD Who Had an Inadequate Response to Corticosteroids. Blood 2019, 134, 4534. [Google Scholar] [CrossRef]
- Hansmann, S.; Darwich, A.; Margolskee, A.; Aarons, L.; Dressman, J. Forecasting oral absorption across biopharmaceutics classification system classes with physiologically based pharmacokinetic models. J. Pharm. Pharmacol. 2016, 68, 1501–1515. [Google Scholar] [CrossRef] [PubMed]
- Cornely, O.A.; Duarte, R.F.; Haider, S.; Chandrasekar, P.; Helfgott, D.; Jimenez, J.L.; Candoni, A.; Raad, I.; Laverdiere, M.; Langston, A.; et al. Phase 3 pharmacokinetics and safety study of a posaconazole tablet formulation in patients at risk for invasive fungal disease. J. Antimicrob. Chemother. 2016, 71, 1747. [Google Scholar] [CrossRef] [Green Version]
- European Medicines Agency. Noxafil Summary of Product Characteristics. Available online: https://www.ema.europa.eu/en/documents/product-information/noxafil-epar-product-information_en.pdf (accessed on 13 September 2022).
- Gubbins, P.O.; Krishna, G.; Sansone-Parsons, A.; Penzak, S.R.; Dong, L.; Martinho, M.; Anaissie, E.J. Pharmacokinetics and safety of oral posaconazole in neutropenic stem cell transplant recipients. Antimicrob. Agents Chemother. 2006, 50, 1993–1999. [Google Scholar] [CrossRef] [Green Version]
- Walravens, J.; Brouwers, J.; Spriet, I.; Tack, J.; Annaert, P.; Augustijns, P. Effect of pH and comedication on gastrointestinal absorption of posaconazole: Monitoring of intraluminal and plasma drug concentrations. Clin. Pharmacokinet. 2011, 50, 725–734. [Google Scholar] [CrossRef]
- Bermejo, M.; Hens, B.; Dickens, J.; Mudie, D.; Paixao, P.; Tsume, Y.; Shedden, K.; Amidon, G.L. A Mechanistic Physiologically-Based Biopharmaceutics Modeling (PBBM) Approach to Assess the In Vivo Performance of an Orally Administered Drug Product: From IVIVC to IVIVP. Pharmaceutics 2020, 12, 74. [Google Scholar] [CrossRef] [Green Version]
- Prieto Garcia, L.; Lundahl, A.; Ahlström, C.; Vildhede, A.; Lennernäs, H.; Sjögren, E. Does the choice of applied physiologically-based pharmacokinetics platform matter? A case study on simvastatin disposition and drug-drug interaction. CPT Pharmacomet. Syst. Pharmacol. 2022, 11, 1194–1209. [Google Scholar] [CrossRef]
- Jamei, M.; Turner, D.; Yang, J.; Neuhoff, S.; Polak, S.; Rostami-Hodjegan, A.; Tucker, G. Population-based mechanistic prediction of oral drug absorption. AAPS J. 2009, 11, 225–237. [Google Scholar] [CrossRef]


| POS | MDZ 0.4 mg i.v. SD | MDZ 2.0 mg Oral SD | ||
|---|---|---|---|---|
| DDI Ratio | Cmax | AUClast | Cmax | AUClast |
| 200 mg oral SUS | 1.42 a 1.30 b | 3.38 a 4.42 b | 2.74 a 2.20 b | 5.54 a 4.99 b |
| 400 mg oral SUS | 1.41 a 1.68 b | 4.43 a 6.23 b | 3.02 a 2.33 b | 6.95 a 5.26 b |
Publisher’s Note: MDPI stays neutral with regard to jurisdictional claims in published maps and institutional affiliations. |
© 2022 by the authors. Licensee MDPI, Basel, Switzerland. This article is an open access article distributed under the terms and conditions of the Creative Commons Attribution (CC BY) license (https://creativecommons.org/licenses/by/4.0/).
Share and Cite
Gerner, B.; Aghai-Trommeschlaeger, F.; Kraus, S.; Grigoleit, G.U.; Zimmermann, S.; Kurlbaum, M.; Klinker, H.; Isberner, N.; Scherf-Clavel, O. A Physiologically-Based Pharmacokinetic Model of Ruxolitinib and Posaconazole to Predict CYP3A4-Mediated Drug–Drug Interaction Frequently Observed in Graft versus Host Disease Patients. Pharmaceutics 2022, 14, 2556. https://doi.org/10.3390/pharmaceutics14122556
Gerner B, Aghai-Trommeschlaeger F, Kraus S, Grigoleit GU, Zimmermann S, Kurlbaum M, Klinker H, Isberner N, Scherf-Clavel O. A Physiologically-Based Pharmacokinetic Model of Ruxolitinib and Posaconazole to Predict CYP3A4-Mediated Drug–Drug Interaction Frequently Observed in Graft versus Host Disease Patients. Pharmaceutics. 2022; 14(12):2556. https://doi.org/10.3390/pharmaceutics14122556
Chicago/Turabian StyleGerner, Bettina, Fatemeh Aghai-Trommeschlaeger, Sabrina Kraus, Götz Ulrich Grigoleit, Sebastian Zimmermann, Max Kurlbaum, Hartwig Klinker, Nora Isberner, and Oliver Scherf-Clavel. 2022. "A Physiologically-Based Pharmacokinetic Model of Ruxolitinib and Posaconazole to Predict CYP3A4-Mediated Drug–Drug Interaction Frequently Observed in Graft versus Host Disease Patients" Pharmaceutics 14, no. 12: 2556. https://doi.org/10.3390/pharmaceutics14122556