Article

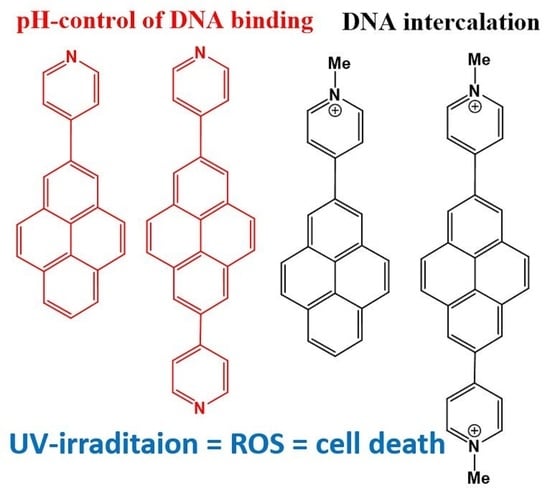
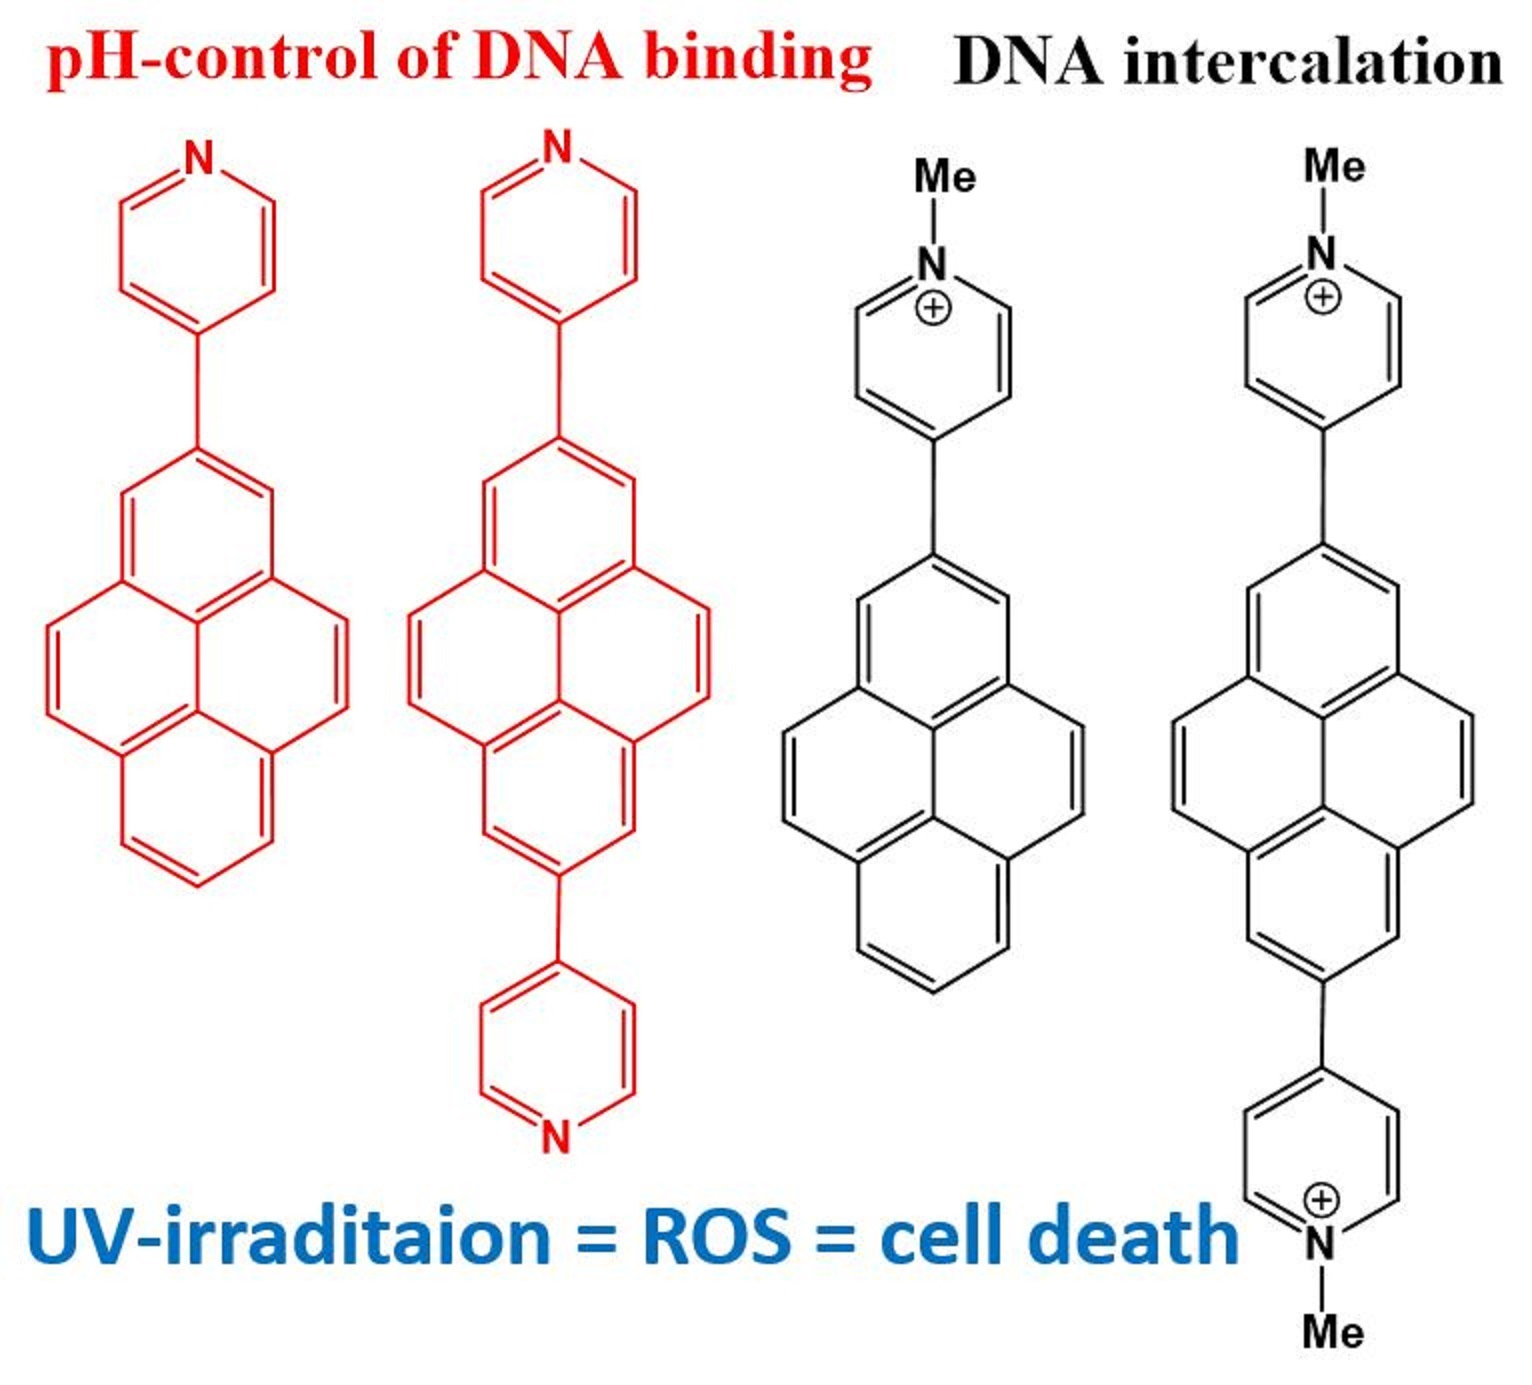
Para-N-Methylpyridinium Pyrenes: Impact of Positive Charge on ds-DNA/RNA and Protein Recognition, Photo-Induced Bioactivity, and Intracellular Localisation

1
Division of Organic Chemistry and Biochemistry, Ruđer Bošković Institute, Bijenička Cesta 54, 10000 Zagreb, Croatia
2
Division of Molecular Biology, Ruđer Bošković Institute, Bijenička Cesta 54, 10000 Zagreb, Croatia
3
Department of Chemistry, College of Engineering and Technology, SRM Institute of Science and Technology, Kattankulathur 603203, Tamil Nadu, India
4
Institut für Anorganische Chemie, Julius-Maximilians-Universität Würzburg, Am Hubland, 97074 Würzburg, Germany
5
Division of Molecular Medicine, Ruđer Bošković Institute, Bijenička Cesta 54, 10000 Zagreb, Croatia
6
Institut für Anorganische und Analytische Chemie, Justus-Liebig-Universität Gießen, Heinrich-Buff-Ring 17, 35392 Gießen, Germany
*
Authors to whom correspondence should be addressed.
These authors contributed equally to this work.
Pharmaceutics 2022, 14(11), 2499; https://doi.org/10.3390/pharmaceutics14112499
Submission received: 20 October 2022 / Revised: 10 November 2022 / Accepted: 12 November 2022 / Published: 17 November 2022
(This article belongs to the Special Issue Advances in Phototherapy and Sonodynamic Therapy)

Abstract

:
The 2- and 2,7- substituted para-N-methylpyridinium pyrene cations show high-affinity intercalation into ds-DNAs, whereas their non-methylated analogues interacted with ds-DNA/RNA only in the protonated form (at pH 5), but not at physiological conditions (pH 7). The fluorescence from non-methylated analogues was strongly dependent on the protonation of the pyridines; consequently, they act as fluorescence ratiometric probes for simultaneous detection of both ds-DNA and BSA at pH 5, relying on the ratio between intensities at 420 nm (BSA specific) and 520 nm (DNA specific), whereby exclusively ds-DNA sensing could be switched-off by adjustment to pH 7. Only methylated, permanently charged pyrenes show photoinduced cleavage of circular DNA, attributed to pyrene-mediated irradiation-induced production of singlet oxygen. Consequently, the moderate toxicity of these cations against human cell lines is strongly increased upon irradiation. Detailed studies revealed increased total ROS production in cells treated by the compounds studied, accompanied by cell swelling and augmentation of cellular complexity. The most photo-active 2-para-N-methylpyridinium pyrene showed significant localization at mitochondria, its photo-bioactivity likely due to mitochondrial DNA damage. Other derivatives were mostly non-selectively distributed between various cytoplasmic organelles, thus being less photoactive.

Graphical Abstract

1. Introduction

Photodynamic therapy (PDT) is a treatment capable of inducing cell and tissue death by oxidative stress through light-induced activation of a nontoxic photosensitizer. The photosensitizer (PS) transfers energy from light to molecular oxygen, consequently generating, around the immediate PS location, various reactive oxygen species (ROS) [1]. Therefore, the biological responses to the photosensitizer are activated only in the particular areas of tissue that have been exposed to light [2], offering highly selective therapeutic targeting of well-defined and accessible malignant or potentially malignant conditions [2]. However, most photosensitizing (PS) agents are of high molecular weight, which hampers their administration to patients and results in long retention in blood, causing photodermatosis [3]. There are a few examples of low molecular weight PS agents, and we recently reported small molecules in PDT applications with some advantages regarding bioavailability and biolocalisation [4].
In this regard, condensed aromatics of low molecular weight, such as pyrene, with its favourable photosensitizability, could be efficient photosensitizers [5]. Although pyrenes are generally considered potentially carcinogenic, their substituted derivatives may serve as anticancer agents and chemotherapeutics [6,7]. For example, pyrene analogues caused increased ROS production in 3T3 fibroblast cells and HT29 colon cancer cells treated with (E)-pyrene oxime esters [8], while pyrene-induced cytotoxicity due to increased oxidative stress, i.e., ROS production, was observed in human HepG2 cells [9]. The fluorescence of pyrene derivatives allowed their application as fluorescent probes for various biomacromolecules, e.g., nucleic acids [10,11]. Some pyrene derivatives intercalate into DNA/RNA [12,13]; however, intercalative binding has limited biomedical selectivity and, therefore, some interesting applications of those pyrene derivatives rely on their interactions with DNA or RNA grooves [14,15] or use pyrene’s ability to form fluorescent excimers [16,17,18,19]. Thus, pyrene derivatives have already proven to be quite useful for diagnostic and sensing applications [20,21,22,23].
However, regarding PDT applications, one of the main disadvantages of most pyrene analogues is their non-favourable excitation wavelength (350–400 nm), far too short for efficient PDT due to limits to tissue permeability. Thus, for efficient tissue penetration, essential for PDT treatment, wavelengths > 600 nm are required [24]. However, recent developments in two-photon-absorption (TPA) allow the application of doubled excitation wavelengths for the efficient excitation of photosensitisers [25,26], thus allowing biomedical applicability even for pyrene analogues [27,28].
Since we developed the iridium-catalysed direct C-H borylation of pyrene at the 2-, and 2,7-positions as an efficient and selective route to this otherwise difficult-to-obtain substitution pattern [29,30], we have been exploring the synthesis, electronic, and optical properties, and various applications of 2-, and 2,7-substituted pyrenes [31,32,33,34,35,36,37,38,39,40,41,42,43,44], including a series of pyridyl-pyrenes [45].
Recently, we reported the mono- and bis-(N-methylpyridinium)-pyrenes 1M and 2M (Scheme 1) and analogous neutral compounds 1 and 2 [45], which have several properties highly applicable for PDT purposes [46]. For example, neutral compounds 1 and 2 revealed strongly bathochromically shifted absorption bands (375–475 nm), while preliminary studies showed that cationic 1M and 2M interact strongly with ct-DNA, the binding affinity depending on the number of positive charges.
These properties of 1M and 2M prompted us to study in detail their interactions with several of the most common ds-DNA or ds-RNA secondary structures, differing in steric and electronic properties of their binding sites for small molecules ( Supplementary Information Table S1). Even more intriguingly, our preliminary studies showed that neutral compounds 1 and 2 could be protonated (pKa ca. 5), and our previous studies of phenanthridine analogues [47] showed that only the protonated form (at pH 5) binds to ds-DNA and is biologically active. Such a pH-dependent property is the operational mode of several anticancer drugs, which thus accumulate in more acidic cancerous tissues [48,49,50,51]. Furthermore, we assessed the biological effects of these pyrene analogues (Scheme 1) on human cells in vitro by means of cytotoxicity, intracellular localization, and induction of ROS production in human cells, with and without light irradiation. As UV light irradiation increased the cell toxicity of the pyrene analogues, with the effect being the most pronounced for 1M, our additional studies suggested that the particularly increased cell toxicity of 1M upon UV irradiation can be attributed to increased production of ROS inside mitochondria and consequent DNA damage. Data presented here provide valuable information on the potential mechanisms involved in the cytotoxicity induced by mono- and bis-(N-methylpyridinium)-pyrenes, suggesting 1M as a potential photosensitizer for photodynamic therapy.

2. Materials and Methods

The synthesis and detailed spectrophotometric characterisation of compounds 1, 2, 1M, and 2M were reported previously [46].

Study of Interactions with ds-DNA and ds-RNA

Experiments were conducted in an aqueous buffer solution (pH = 7.0 or pH= 5.0, I = 0.05 M, sodium cacodylate buffer). For the UV-Vis spectra were used Varian Cary 100 Bio spectrometer, for fluorescence spectra we used the Varian Cary Eclipse fluorimeter and for CD spectra we used the JASCO J815 spectropolarimeter, all conducted at 25.0 °C using appropriate quartz cuvettes (path length: 1 cm).
Polynucleotides were purchased as noted: poly dAdT-poly dAdT, poly dGdC-poly dGdC, poly A-poly U (ds-RNA), (Sigma-Aldrich, Schnelldorf, Germany), calf thymus (ct)-DNA (Sigma-Aldrich, Schnelldorf, Germany) and dissolved in sodium cacodylate buffer, I = 0.05 M, pH = 7.0. The ct-DNA was sonicated and filtered through a 0.45 µm filter to obtain mostly short (ca. 100 base pairs) rod-like B-helical DNA fragments. The concentration of DNA or RNA was determined spectroscopically as the c(nucleobase) using producer-provided molar extinction coefficients.
Circular dichroism (CD) spectra were collected with a scanning speed of 200 nm/min and with three accumulations averaging. A buffer background was subtracted from each spectrum. CD experiments were performed by titrating the compound stock solution into the polynucleotide solution (c = 2 × 10⁻⁵ M).
Thermal denaturation of ds-DNA, ds-RNA and their complexes with studied compounds was performed [52] by monitoring the absorption change at 260 nm as a function of temperature. Tm values are the midpoints of the transition curves determined from the maximum of the first derivative and checked graphically by the tangent method. The ∆Tm values were calculated by subtracting the Tm of the free nucleic acid from the Tm of the complex. Every ∆Tm value here reported was the average of at least two measurements. The error in ∆Tm is ± 0.5 °C.
Cells. Commercially available from American Type Culture Collection (ATCC), human epithelial lung adenocarcinoma A549 (ATCC® CCL-185™) and human normal lung fibroblast WI-38 (ATCC® CCL-75™) were grown according to supplier’s conditions, namely in Dulbecco Modified Eagle’s Medium (DMEM, Sigma Aldrich, St. Louis, MO, USA) supplemented with 10% of fetal bovine serum (FBS, Sigma Aldrich, USA). Cells were incubated in the cell incubator (Thermo Fischer Scientific, Waltham, MA, USA) at 37 °C and 5% CO2 in a humidified atmosphere.
Cell viability assay. In order to obtain a 10 mM stock solution chemical compounds (2M, 1, and 1M) were sterilely diluted in an appropriate volume of dimethyl sulfoxide solution (DMSO, Gram-Mol, Zagreb, Croatia). Solutions were kept in the dark and stored at 4 °C. The cytotoxic effects of each compound were assayed on A549 and WI-38 cells. Working solutions, prepared by diluting DMSO stock solutions in DMEM, taking care that DMSO content does not exceed 0.1%, and tested by MTT test [53]. Briefly, cells were seeded in 96-well tissue culture plates and 24 h later treated with 2M, 1, or 1M in the concentration range of 10–0.1 μM. Cells treated with the same dilutions of DMSO represented the control, while cells treated only with DMEM (10% FBS) represented the negative control. After 72 h, the media was removed, MTT solution was added into each well, and the plate was incubated (37 °C, 5% CO2) for 3 h. The resulting MTT-formazan products were dissolved using DMSO, and their absorbance at 600 nm was measured using a microplate reader.
For determining the effect of UV exposure, cells were seeded on two plates and treated with working solutions of the respective compounds as previously described. Plates were incubated (37 °C, 5% CO2) for 90 min, allowing the compounds to enter the cells. Then, one plate was exposed to UV light (Luzchem reactor, 350 nm, 8 lamps, in total 8 W, dose 50.6 mWm−2; ~18 cm lamp to cell-plate) for 5 min, 3 days in a row at the same time each day, while the other plate was left in the cell incubator in the dark and served as a control.
Live cell imaging by confocal microscopy.
For the live imaging A549 cells were seeded in Ibidi imaging cell chambers (Ibidi®, Gräfelfing, Germany) and the next day treated with a 10 μM solution of the respective compound. Cells were left in the cell incubator for 90 min to allow the compound to enter the cells. After incubation, the medium was replaced with 500 μL of fresh medium. The influence of the compounds on A549 cells before and after photoactivation (exc = 405 nm, em = 450–550 nm) was visualised using a Leica SP8 X confocal microscope (Leica Microsystems, Wetzlar, Germany).
To analyse localisation at mitochondria after incubation with the respective compounds, cells were rinsed and incubated with a 100 nM MitoTracker Deep Red solution (Invitrogen, Molecular Probes, Waltham, MA, USA). MitoTracker dye was added to cells for 20 min at 37 °C, after which the medium was replaced with 500 μL of fresh DMEM and cells were immediately observed with a Leica SP8 X confocal microscope and the degree of colocalisation was assessed via the Pearson correlation coefficient, r.
Immunofluorescence. A549 cells were seeded on coverslips in 24-well tissue culture plates (3 × 10⁴ cells/well), which were incubated in FBS for 2 h (37 °C, 5% CO2) prior to seeding; 48 h later, the cells were treated with the respective compound for 90 min (37 °C, 5% CO2), allowing the compound to enter to cells. After the treatment, cells were washed with PBS and incubated in 2% paraformaldehyde in PBS for 12 min at RT and 0.5% Triton X-100/PBS for 2 min. After fixation and permeabilisation, samples were washed with PBS, blocked with 3% bovine serum albumin in PBS for 30 min at RT and incubated with primary antibodies specific for EEA1 (#2411, Cell Signaling, Danvers, MA, SAD), LAMP1 (ab24170, Abcam, Cambridge, UK) or GM130 (#1248, Cell Signaling, Danvers, MA, SAD) respectively, in 5% BSA in PBS for 1 h, at RT. Samples were subsequently washed with PBS and then incubated with the appropriate Alexa Fluor-conjugated secondary antibody in 5% BSA in PBS for 1 h, at RT and in the dark. Coverslips were mounted in mounting medium (Fluoromount G, Southern Biotech, Birmingham, AL, USA). Confocal microscopy analyses were performed using the Leica TCS SP8 X microscope with a 63x objective. Images were processed with the Leica Application Suite X (LAS X, Leica, Wetzlar, Germany) software platform. Colocalisation was assessed by the Pearson coefficient. Analysis was conducted using ImageJ software and the appropriate JACoP plugin [30].
Detection of total ROS. For detecting total ROS, A549 cells were seeded in 12-well tissue culture plates and 24 h after were treated with a 10 μM working solution of the respective compound and incubated for 90 min (37 °C, 5% CO2), allowing the compound to enter to cells. The same dilution of DMSO served as a control, while H2O2 (0.002%) was used as a positive control. One plate was irradiated with UV light (350 nm) for 5 min, and was analysed immediately after UV exposure. The plate that was not irradiated with UV light served as the control, and was incubated in the cell incubator (37°C, 5% CO2) during the whole experiment. Subsequently, cells were washed with PBS, trypsinised, resuspended with cold PBS supplemented with 10% FBS and centrifuged for 5 min (RT, 1100 g). Cell pellets were resuspended and washed again, but this time with cold PBS supplemented with 1% FBS and centrifuged for 5 min (RT, 1100 g). After the second washing, cell pellets were resuspended in 5 μM 2′,7′–dichloro-fluorescin diacetate (H2DCFDA, Sigma, USA) which is converted to dichlorofluorescein (DCF) in contact with ROS. Unstained cells were resuspended in PBS supplemented with 1% FBS. Cells were then analysed by flow cytometry using FACSCalibur (BD Biosciences, San Jose, CA, USA).
For measuring mitochondrial ROS, A549 cells were treated with 1 μM of the respective compound and incubated for 90 min (37 °C, 5% CO2), allowing the compound to enter to cells. Mitochondrial superoxide production was assessed with MitoSOX Red reagent (Thermo Fisher Scientific, Waltham, MA). The cells were washed with PBS and trypsinized, and then kept on ice unless otherwise specified. Cells were distributed into small tubes (3 × 10⁵ cells per tube) and resuspended in 5 µM MitoSOX solution prepared in PBS. The cells were incubated on a thermomixer for 30 min at 37 °C, with shaking (300 rpm), in the dark, followed by two washes with PBS. Then, cells dyed with MitoSOX were re-suspended in 400 µL of PBS and distributed into black 96-well plates, 120 µL per well (in triplicate). A Tecan Infinite 200 fluorescence microplate reader with 485/520 and 520/590 nm excitation/emission wavelengths was used to measure MitoSOX fluorescence.
Plasmid electrophoresis. For assessing the photoinduced DNA nuclease activity of compounds 2M, 1 and 1M, 1 μg of pUC19 plasmid DNA (2686 pb) was incubated with a 100 μM solution of the respective compound, and exposed to UV light (using a xenon arc lamp, Oriel, Stratford, CT, USA) for 15 and 45 s. After the treatment plasmid samples were run on 0.5% agarose gel, and stained with Midori Green DNA binding dye (Nippon Genetics, Düren, Germany). Non-irradiated samples containing compounds and plasmid DNA served as a control for assessing the photoinduced nuclease activity of the compound. Plasmid without the compound was irradiated with UV light under the same conditions to determine whether UV light itself induces changes in plasmid DNA forms (linear and supercoiled form). After gel electrophoresis, plasmid DNA forms were visualised on a UVITEC Imager (Cleaver Scientific, Rugby, UK).
Statistical analysis. Each experiment was repeated at least three times unless otherwise noted. The data were analysed by the unpaired Student’s t-test and expressed as means ± standard deviation (SD). Data were considered statistically significant at a p-value < 0.05.

3. Results

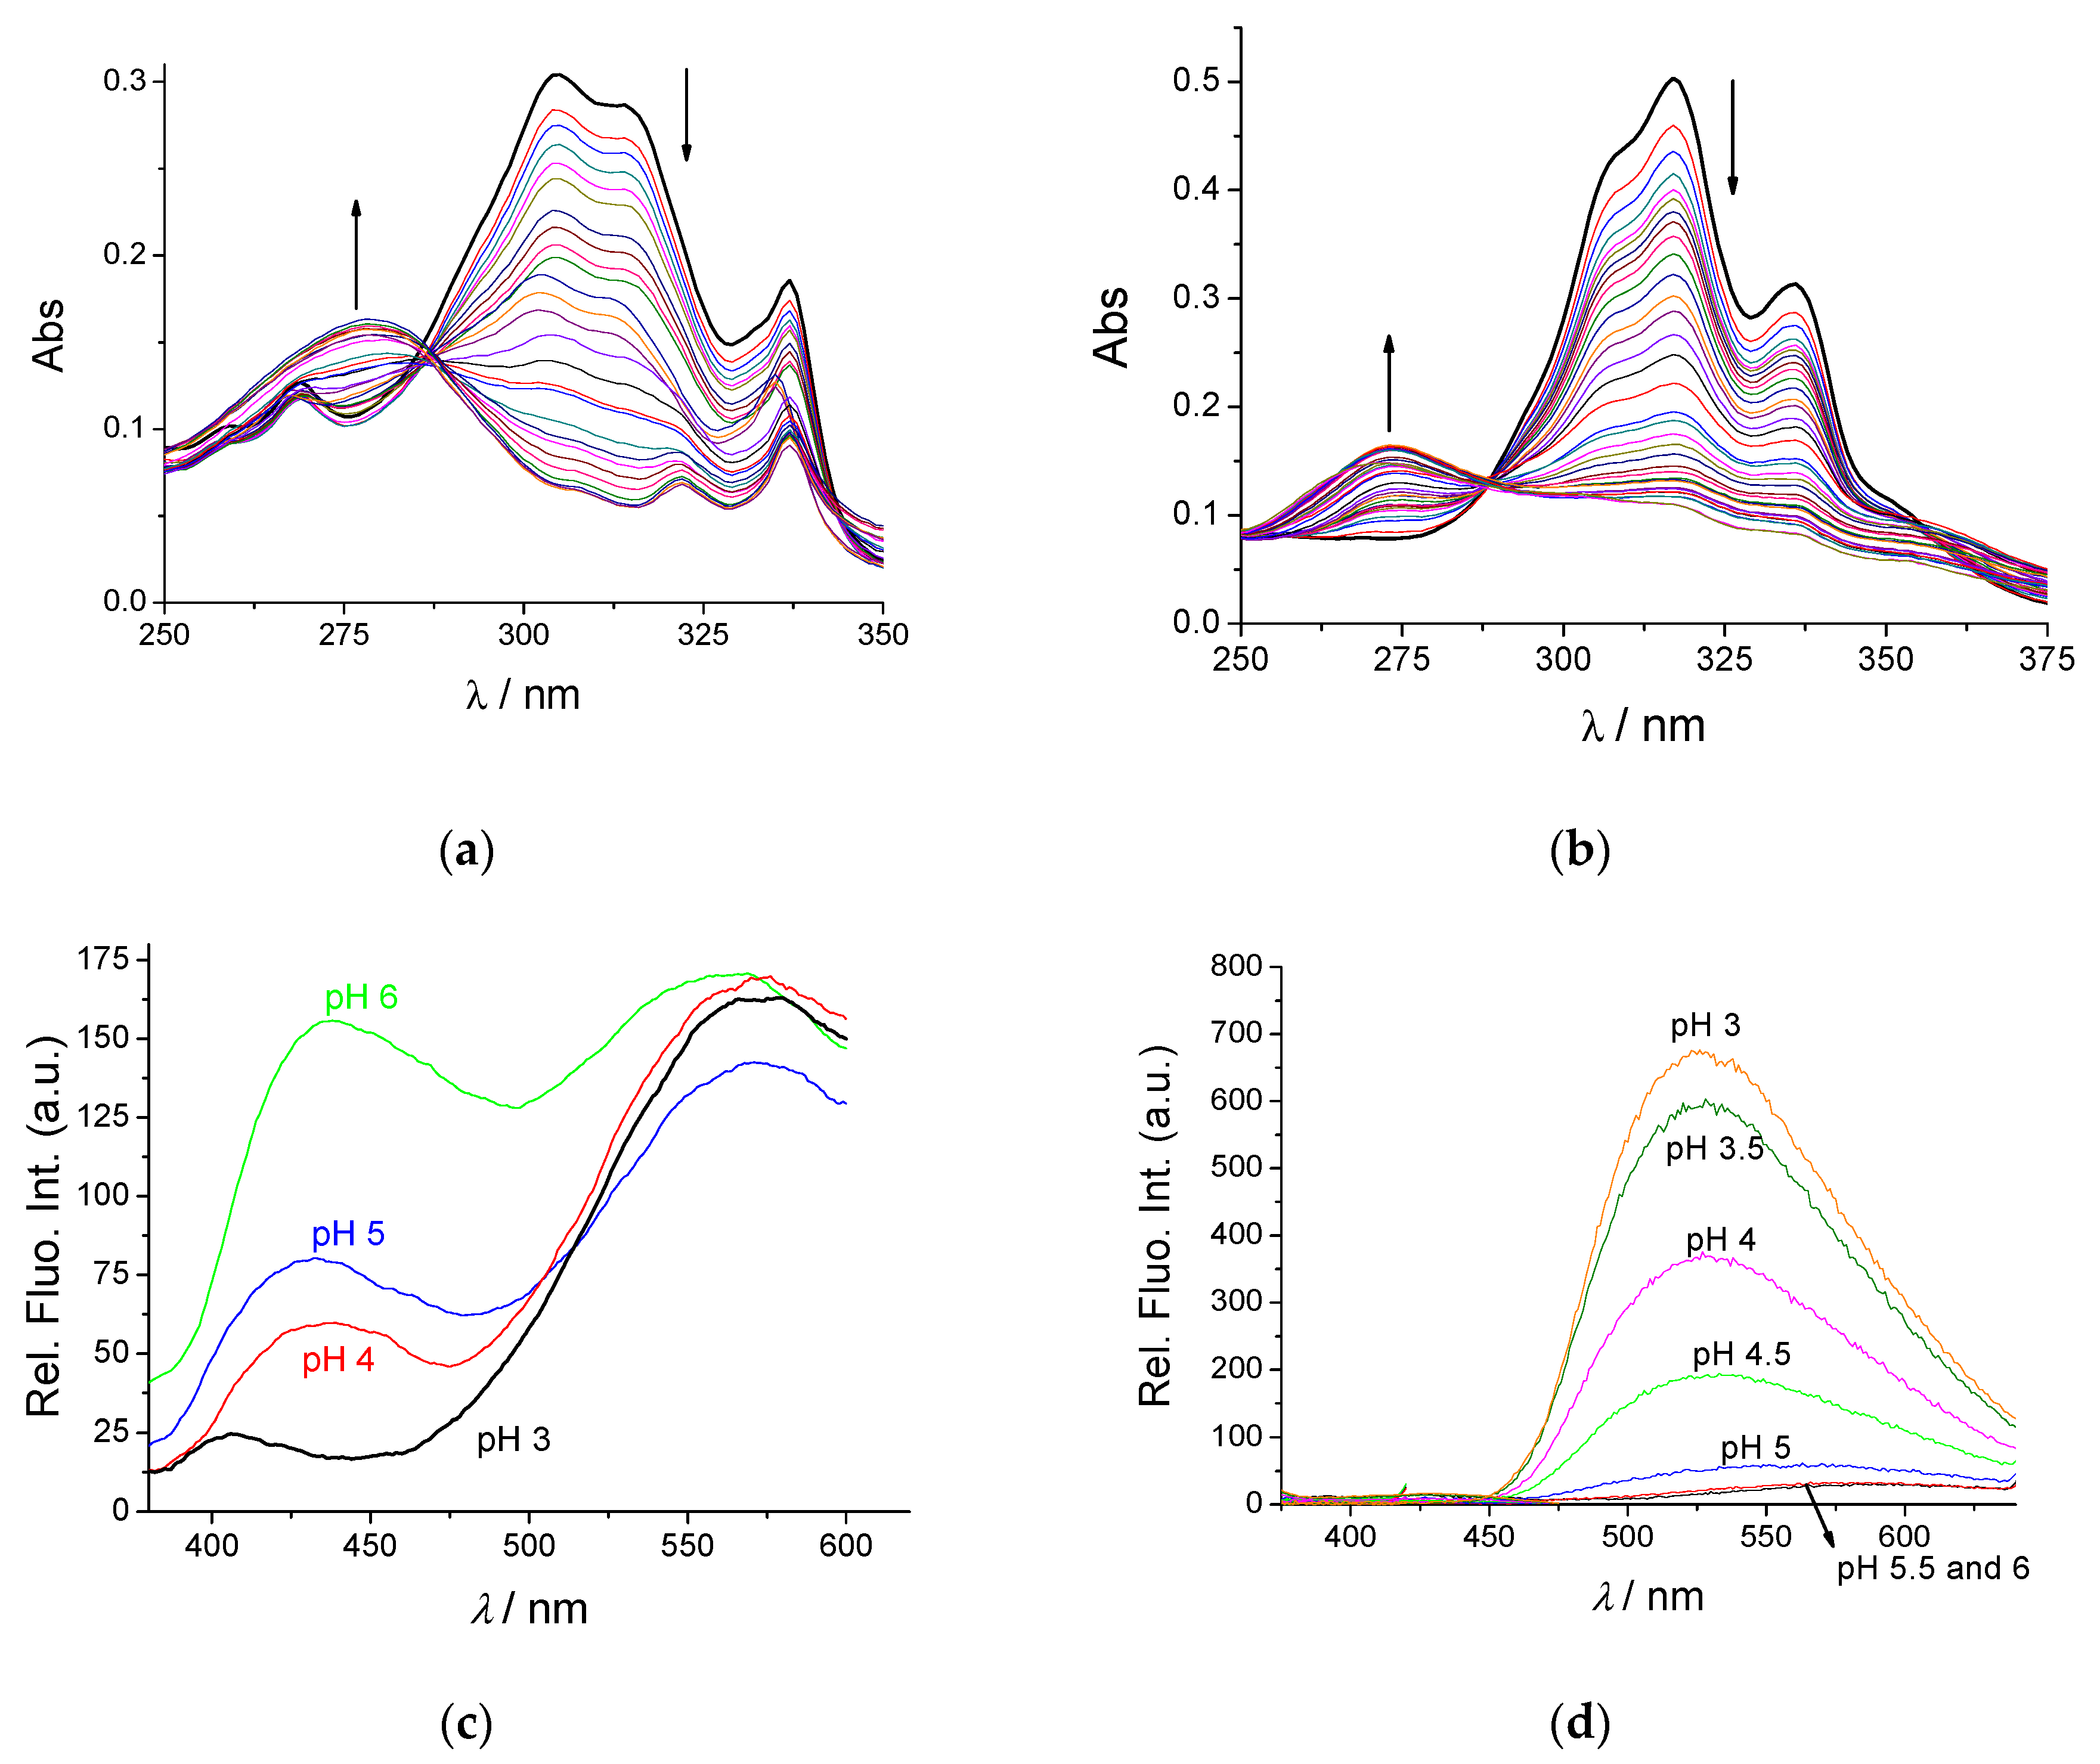
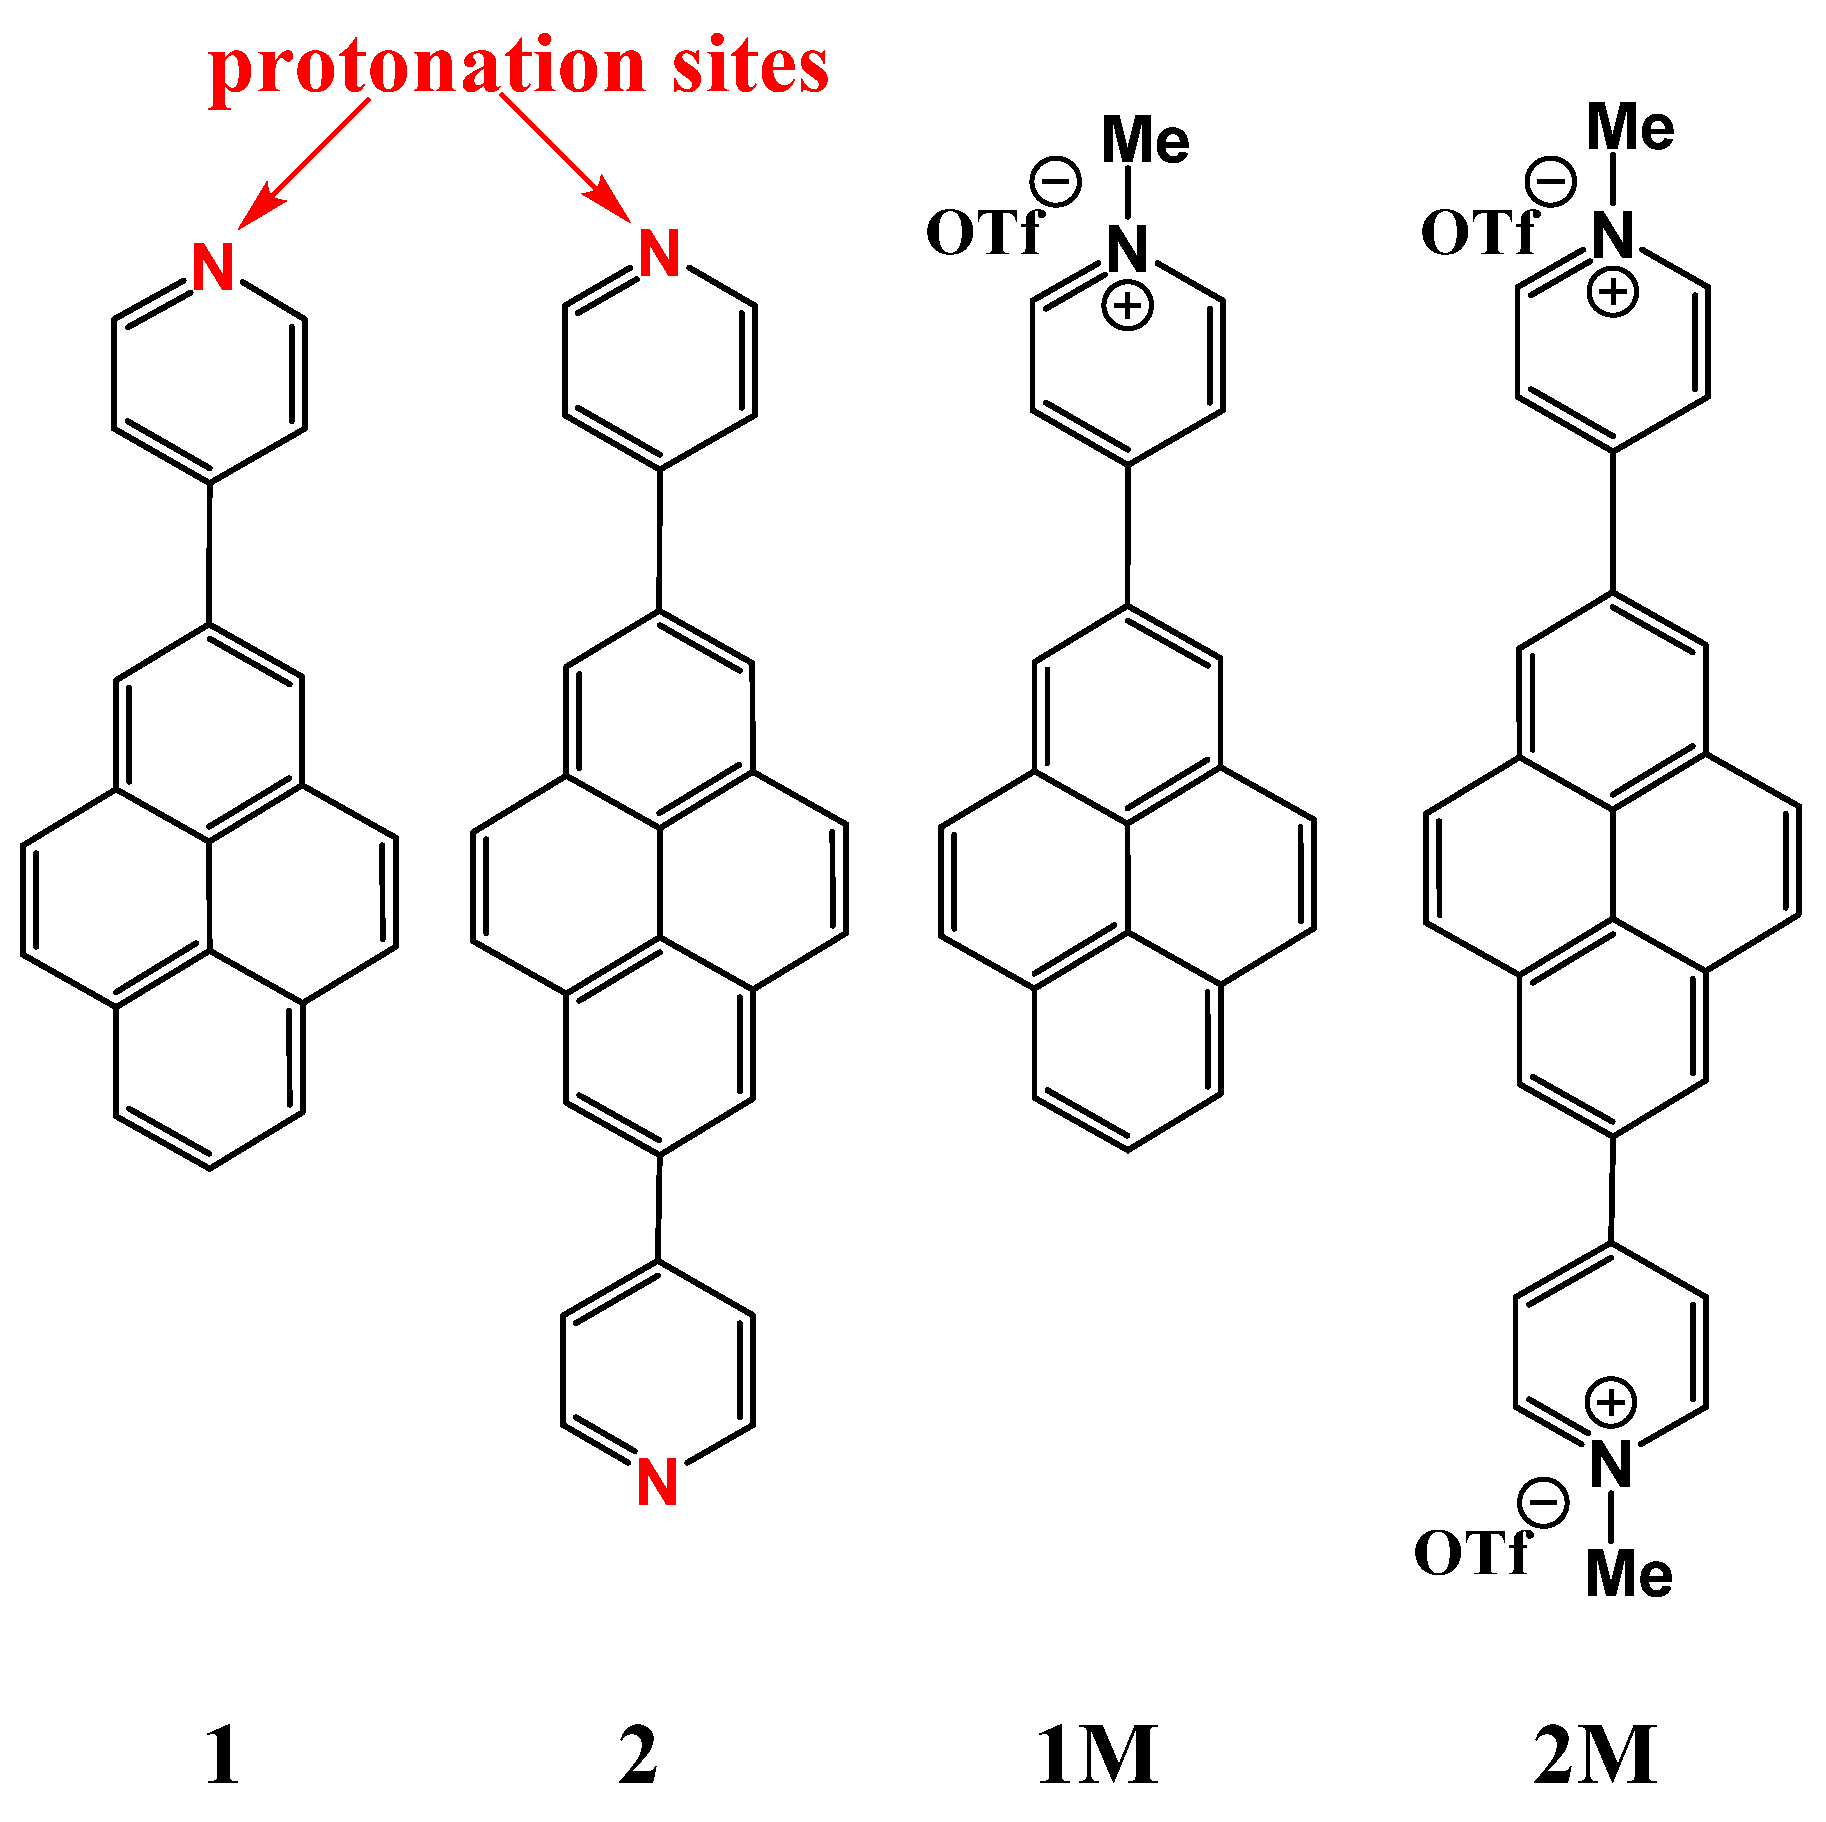
3.1. Protonation Properties of Neutral Analogues 1 and 2

Neutral analogues 1 and 2 are poorly soluble in water; therefore, we dissolved them at acidic conditions (0.001 M HCl in miliQ water), at c = 2.0 × 10⁻⁵ M and subsequently added copious amounts of NaOH solution, simultaneously measuring the pH and collecting UV/vis spectra (Figure 1a,b). Analysis of the results obtained (Supplementary Information, Figures S1 and S2) yielded a pKa~5 for the mono-protonated derivative 1 and colloidisation was observed for 2 in the process of adding NaOH, allowing only an estimation of a pKa < 4.
We also studied the emission from neutral 1 and 2 in water at various pH values (Figure 1c,d and Supplementary Information, Figure S3). Comparison of the results with those previously obtained for 1M and 2M as well as 1 and 2 (in MeCN) [46], revealed that the emission from 1 in its completely protonated form (pH 3) is characterised by a single emission maximum at 560 nm, agreeing with emission spectra of 1M, whereas in the process of partial deprotonation of 1 (pH >4) a new emission maximum appeared at ca. 400–430 nm, agreeing nicely with the emission of 1 in MeCN) [46]. Analogously, the emission from fully protonated 2 (pH 3) agreed with the emission from 2M; however, deprotonation of 2 (pH > 4) only decreased the emission at 540 nm, but showed no emission at 400–450 nm (as observed for 2 in MeCN [46]).
A pH of 5 is still biologically relevant for more acidic cancerous tissues and pH-controlled DNA binding [47,48,49,50,51]; thus, in further experiments, we studied the interactions of cationic 1M and 2M at pH 7 and neutral 1, 2 at pH 5 (at which 1 or 2 are at least partially protonated and could have electrostatic interactions with DNA/RNA).

3.2. Non-Covalent Interactions of 1, 2, 1M and 2M with Various ds-DNA, ds-RNA, and BSA

Preliminary screening conducted at pH 7 revealed strong interactions of permanently charged 1M and 2M with ct-DNA, [46] while neutral 1 or 2 did not show any interaction (data not shown). Thus, we tested 1, 2 in detail only at pH 5, at which they showed measurable interactions with DNA/RNA.

3.2.1. Thermal Denaturation of ds-DNA/RNA

Thermally-induced dissociation of the ds-polynucleotides occurs at a well-defined temperature (Tm value), thus being used for the characterisation of various ds-DNA or ds-RNA-related processes. For example, noncovalent binding of small molecules to ds-polynucleotides usually increases the thermal stability of the ds-helices, and this increase (∆Tm value) can be correlated with the various binding modes; however, this requires confirmation by an independent method [52]. For example, most pyrene analogues, by intercalating into ds-DNA, cause stabilisation for ∆Tm > 5 °C due to aromatic stacking interactions with DNA base pairs, whereas the binding of pyrenes within the polynucleotide groove, usually driven by hydrophobic effects, should have a negligible stabilising outcome [14].
Thus, we performed thermal denaturation experiments with several DNAs or RNA, whereby added 1, 1M, or 2M generally stabilised the polynucleotides against denaturation (Table 1).
The addition of 2M induced strong stabilisation of both ct-DNA and poly dAdT-poly dAdT (Table 1) indicating 2M intercalation between base pairs, typical for pyrenes due to their planar structure. For ratios r = 0.2–0.3, there is no significant difference in polynucleotide stabilisation, suggesting saturation of the binding sites at the ratio r = 0.2. The stabilisation of ds-RNA, upon the addition of 2M, was weaker than with ds-DNA. The addition of 1M caused moderate and similar stabilisation of ds-DNA and ds-RNA, while non-methylated analogues 1 and 2 weakly stabilised ds-DNA only at pH 5, at which they are partially protonated, thus stressing the importance of positive charge for interaction with ds-DNA.

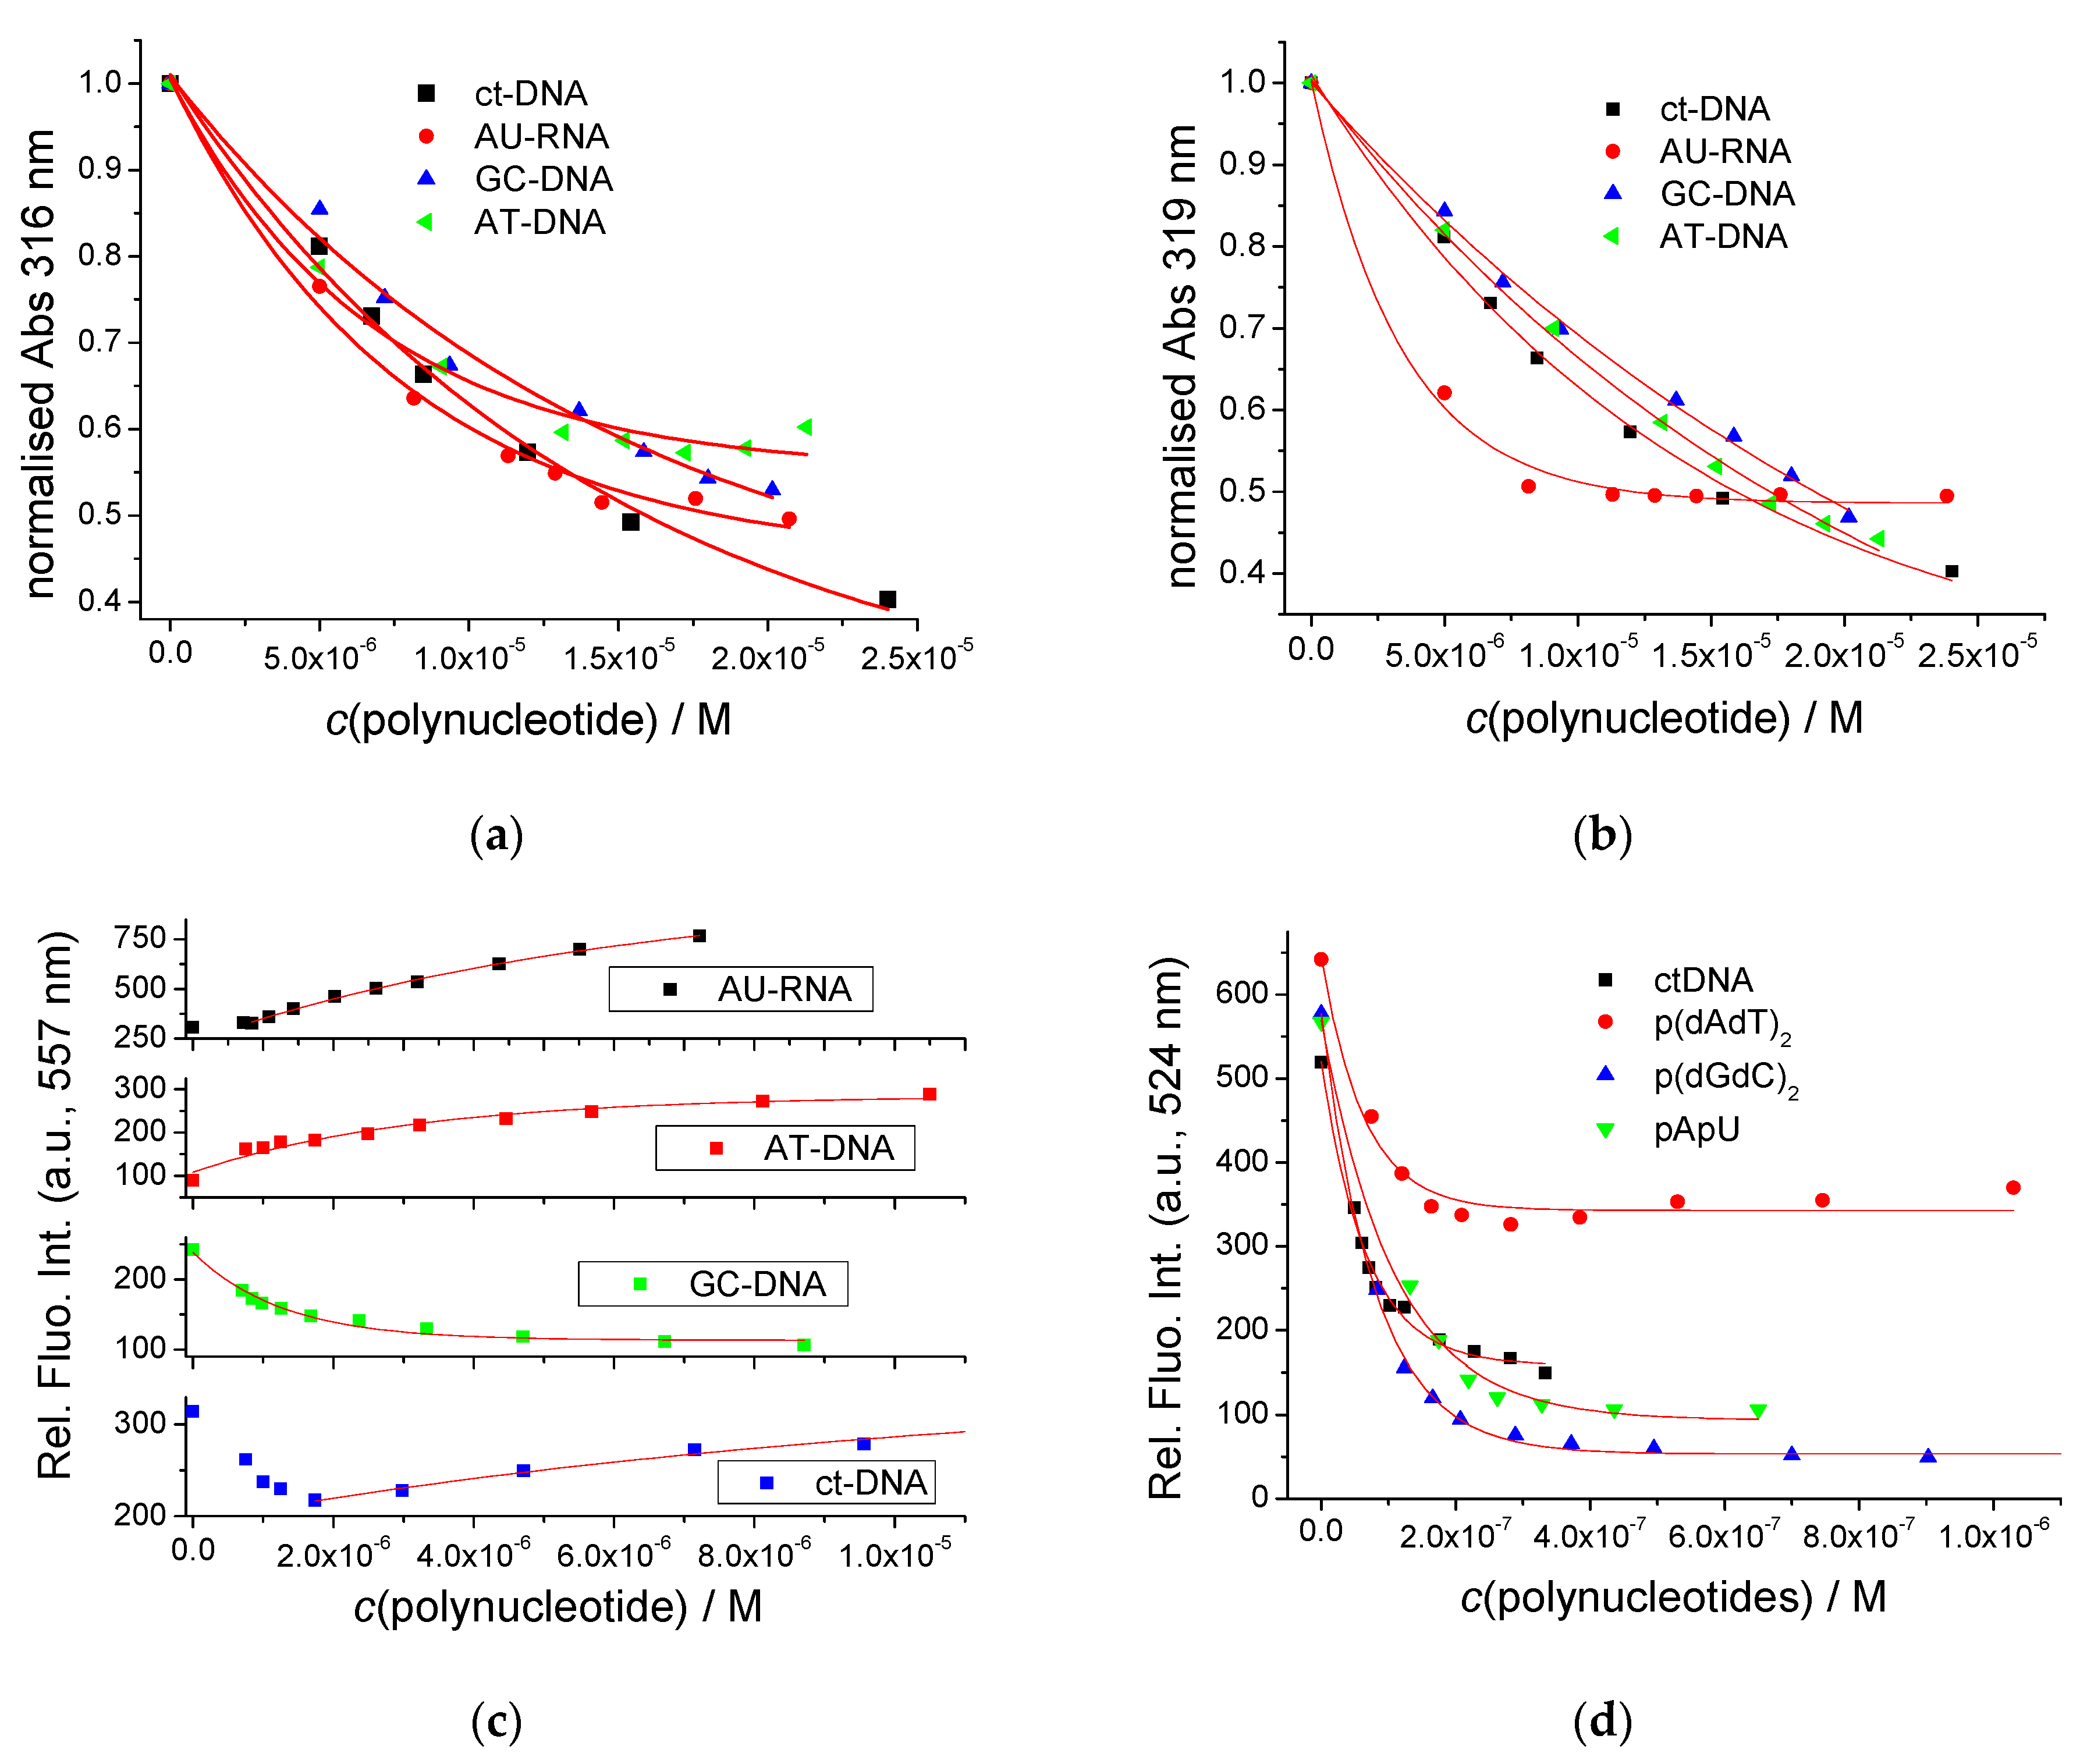
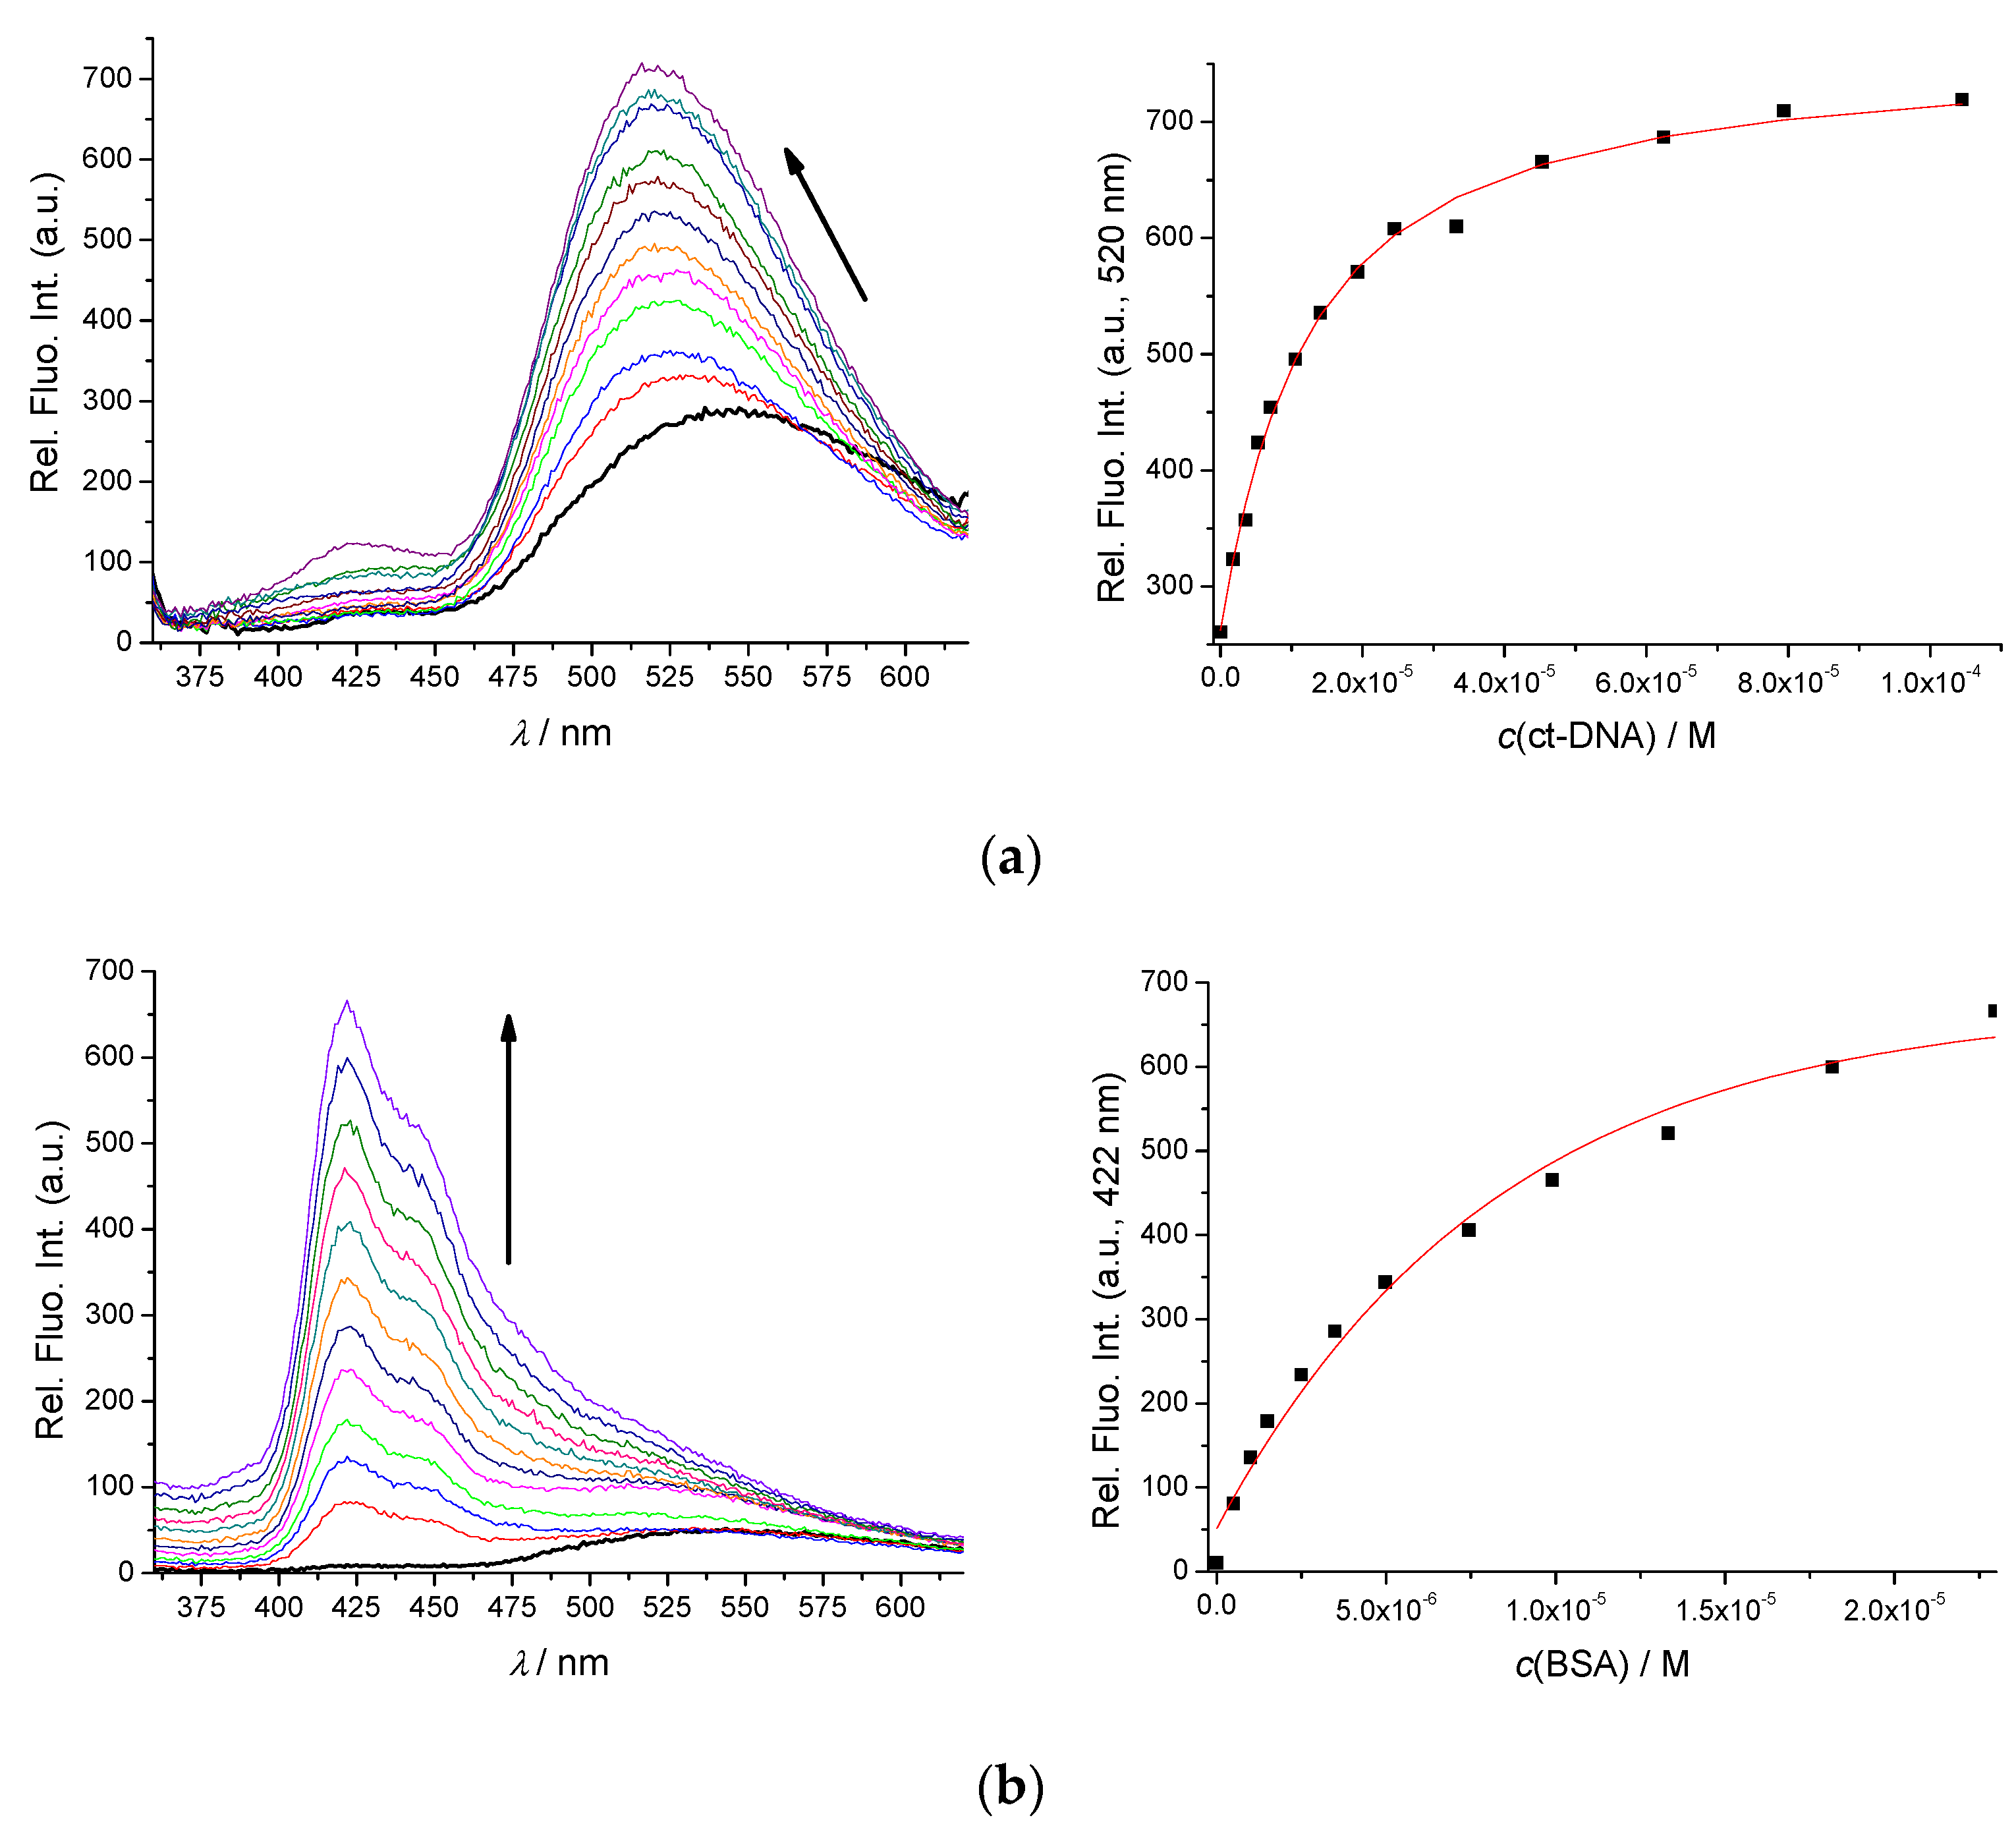
3.2.2. Spectrophotometric Titrations of Pyrene Analogues with DNA, RNA, BSA

As the pyrene analogues studied are strong chromophores and fluorophores, we examined their interactions with DNA/RNA and bovine serum albumin (BSA) by monitoring changes in their UV/vis absorption and fluorescence spectra.
In general, the addition of any ds-DNA or ds-RNA to 1M or 2M resulted in a strong hypochromic and bathochromic effect in 1M or 2M UV/vis spectra (Figure 2a,b; Supplementary Information Figures S4–S11), characteristic of the strong engagement of the pyrene chromophore in aromatic stacking interactions [20]. Mono-methylated 1M UV/vis changes showed no selectivity towards any of the polynucleotides studied (Figure 2a), while bis-methylated 2M shows an increased affinity towards AU-RNA in comparison to all ds-DNAs (Figure 2b). However, it should be stressed that, for some UV/vis titrations, a deviation from the isosbestic point was observed at an excess of the dye over c(DNA/RNA binding sites), which suggests aggregation of the dye along polynucleotide, which would influence the value of binding constant.
At concentrations necessary for accurate UV/vis titrations (c = 5 × 10⁻⁶ M), non-methylated 1 or 2 precipitated upon DNA/RNA addition.
Fortunately, strong emission from the compounds studied allowed fluorimetric titrations to be performed at much lower concentrations of the dyes (c = 5 × 10⁻⁸ M), thus preventing precipitation of non-methylated 1 or 2, and allowing for the collection of numerous data points at excess of DNA/RNA binding sites over c(dye). The addition of DNA/RNA resulted in strong emission changes of 1M or 2M; however, mono-methylated 1M showed an emission increase only for AT-DNA and AU-RNA (Figure 2c), while GC-DNA quenched its emission. Such base-pair-dependent emission selectivity was observed for some 4,9-diazapyrenium compounds [54] and proflavine [55], attributed to the difference in the redox potential of nucleobases. Intriguingly, mixed sequence ct-DNA caused emission quenching of 1M at an excess of dye over ct-DNA (r > 0.1), and such quenching could be attributed to aggregation of 1M along DNA, while at an excess of ct-DNA over dye (r << 0.1), emission increased. The emission of 2M was indiscriminately quenched by all ds-DNA/RNA (Figure 2d).
As the pharmacokinetic properties of small molecules often depend on a binding affinity toward transport proteins (such as serum albumin), we performed fluorimetric titrations with BSA. The emission of both 1M and 2M (Supplementary Information, Figures S15 and S16), was strongly quenched, with compound 2M showing a lower affinity in comparison to ds-DNA/RNA, while the affinity of 1M was similar to that towards ds-DNA/RNA (Table 2).
Upon the addition of ct-DNA at pH 7, the fluorescence of non-methylated compounds 1 and 2 changed only negligibly, whereas, at pH 5, the emission of both compounds strongly increased (Figure 3a, Supplementary Information Figure S12). Most intriguingly, at both pH 7 and pH 5, fluorescence from 1 and 2 strongly increased upon the addition of BSA, accompanied by more than a 100 nm hypsochromically shifted emission maximum (Figure 3b, Supplementary Information Figures S13 and S14).
Comparison of the results obtained (Figure 3) with previous studies of 2 and its protonated analogue 2H [46] revealed strong similarities between the emission spectrum of the 2/DNA complex and the emission spectrum of protonated 2H, as well as between the 2/BSA complex and the non-protonated form of 2. The analogous similarity was observed for 1.
Thus, 1 and 2 bind to ds-DNA only in their protonated forms (and therefore interact only at pH 5), at variance to BSA, which has highly hydrophobic binding sites to which only neutral 1 and 2 are bound similarly at both pH 5 and pH 7.
Processing of fluorimetric titrations by means of the Scatchard equation [56,57] yielded binding constants (Table 2). Bis-methylated 2M revealed a much higher affinity toward all DNA/RNA in comparison to 1M, agreeing well with higher thermal stabilisation (Table 1). Non-methylated 2, due to only partial protonation at pH 5, showed a much lower affinity than 2M. Affinities of 1 and 2 toward BSA were the same at both pH values, supporting the conclusion that neutral forms of 1 and 2 were bound.
Thus, 1 and 2 can be considered as ratiometric probes for the simultaneous detection of both ds-DNA and BSA at pH 5, relying on the ratio between the intensities at 420 nm (BSA specific) and 520 nm (DNA specific), respectively. Even more useful is the possibility to switch-off ds-DNA sensing by adjustment to pH 7, at which only BSA would yield a measurable emission change.

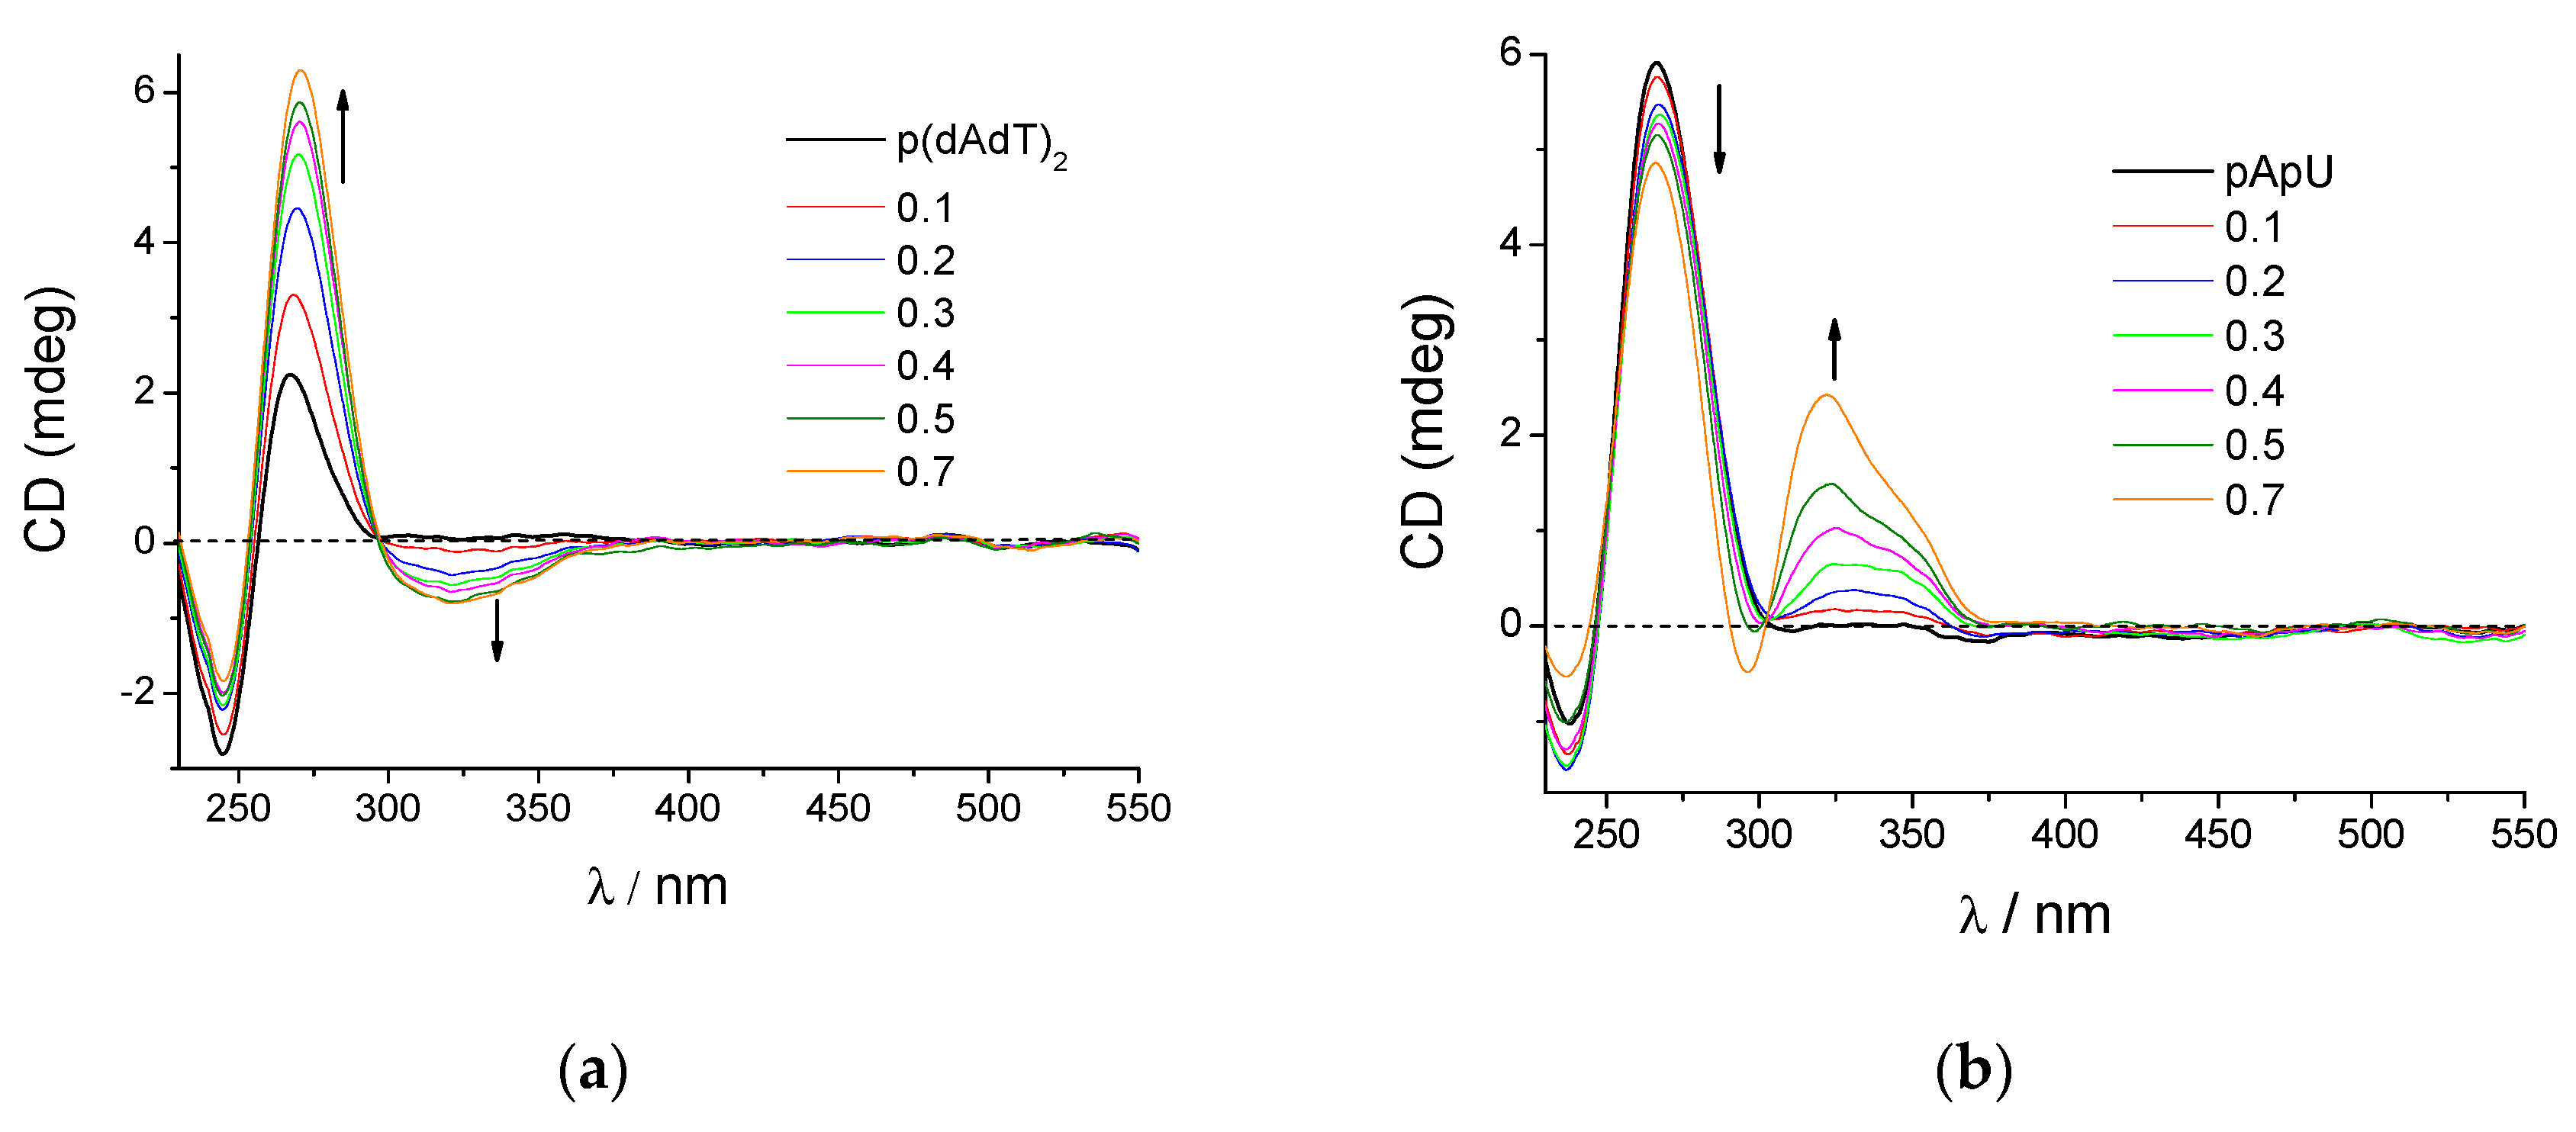
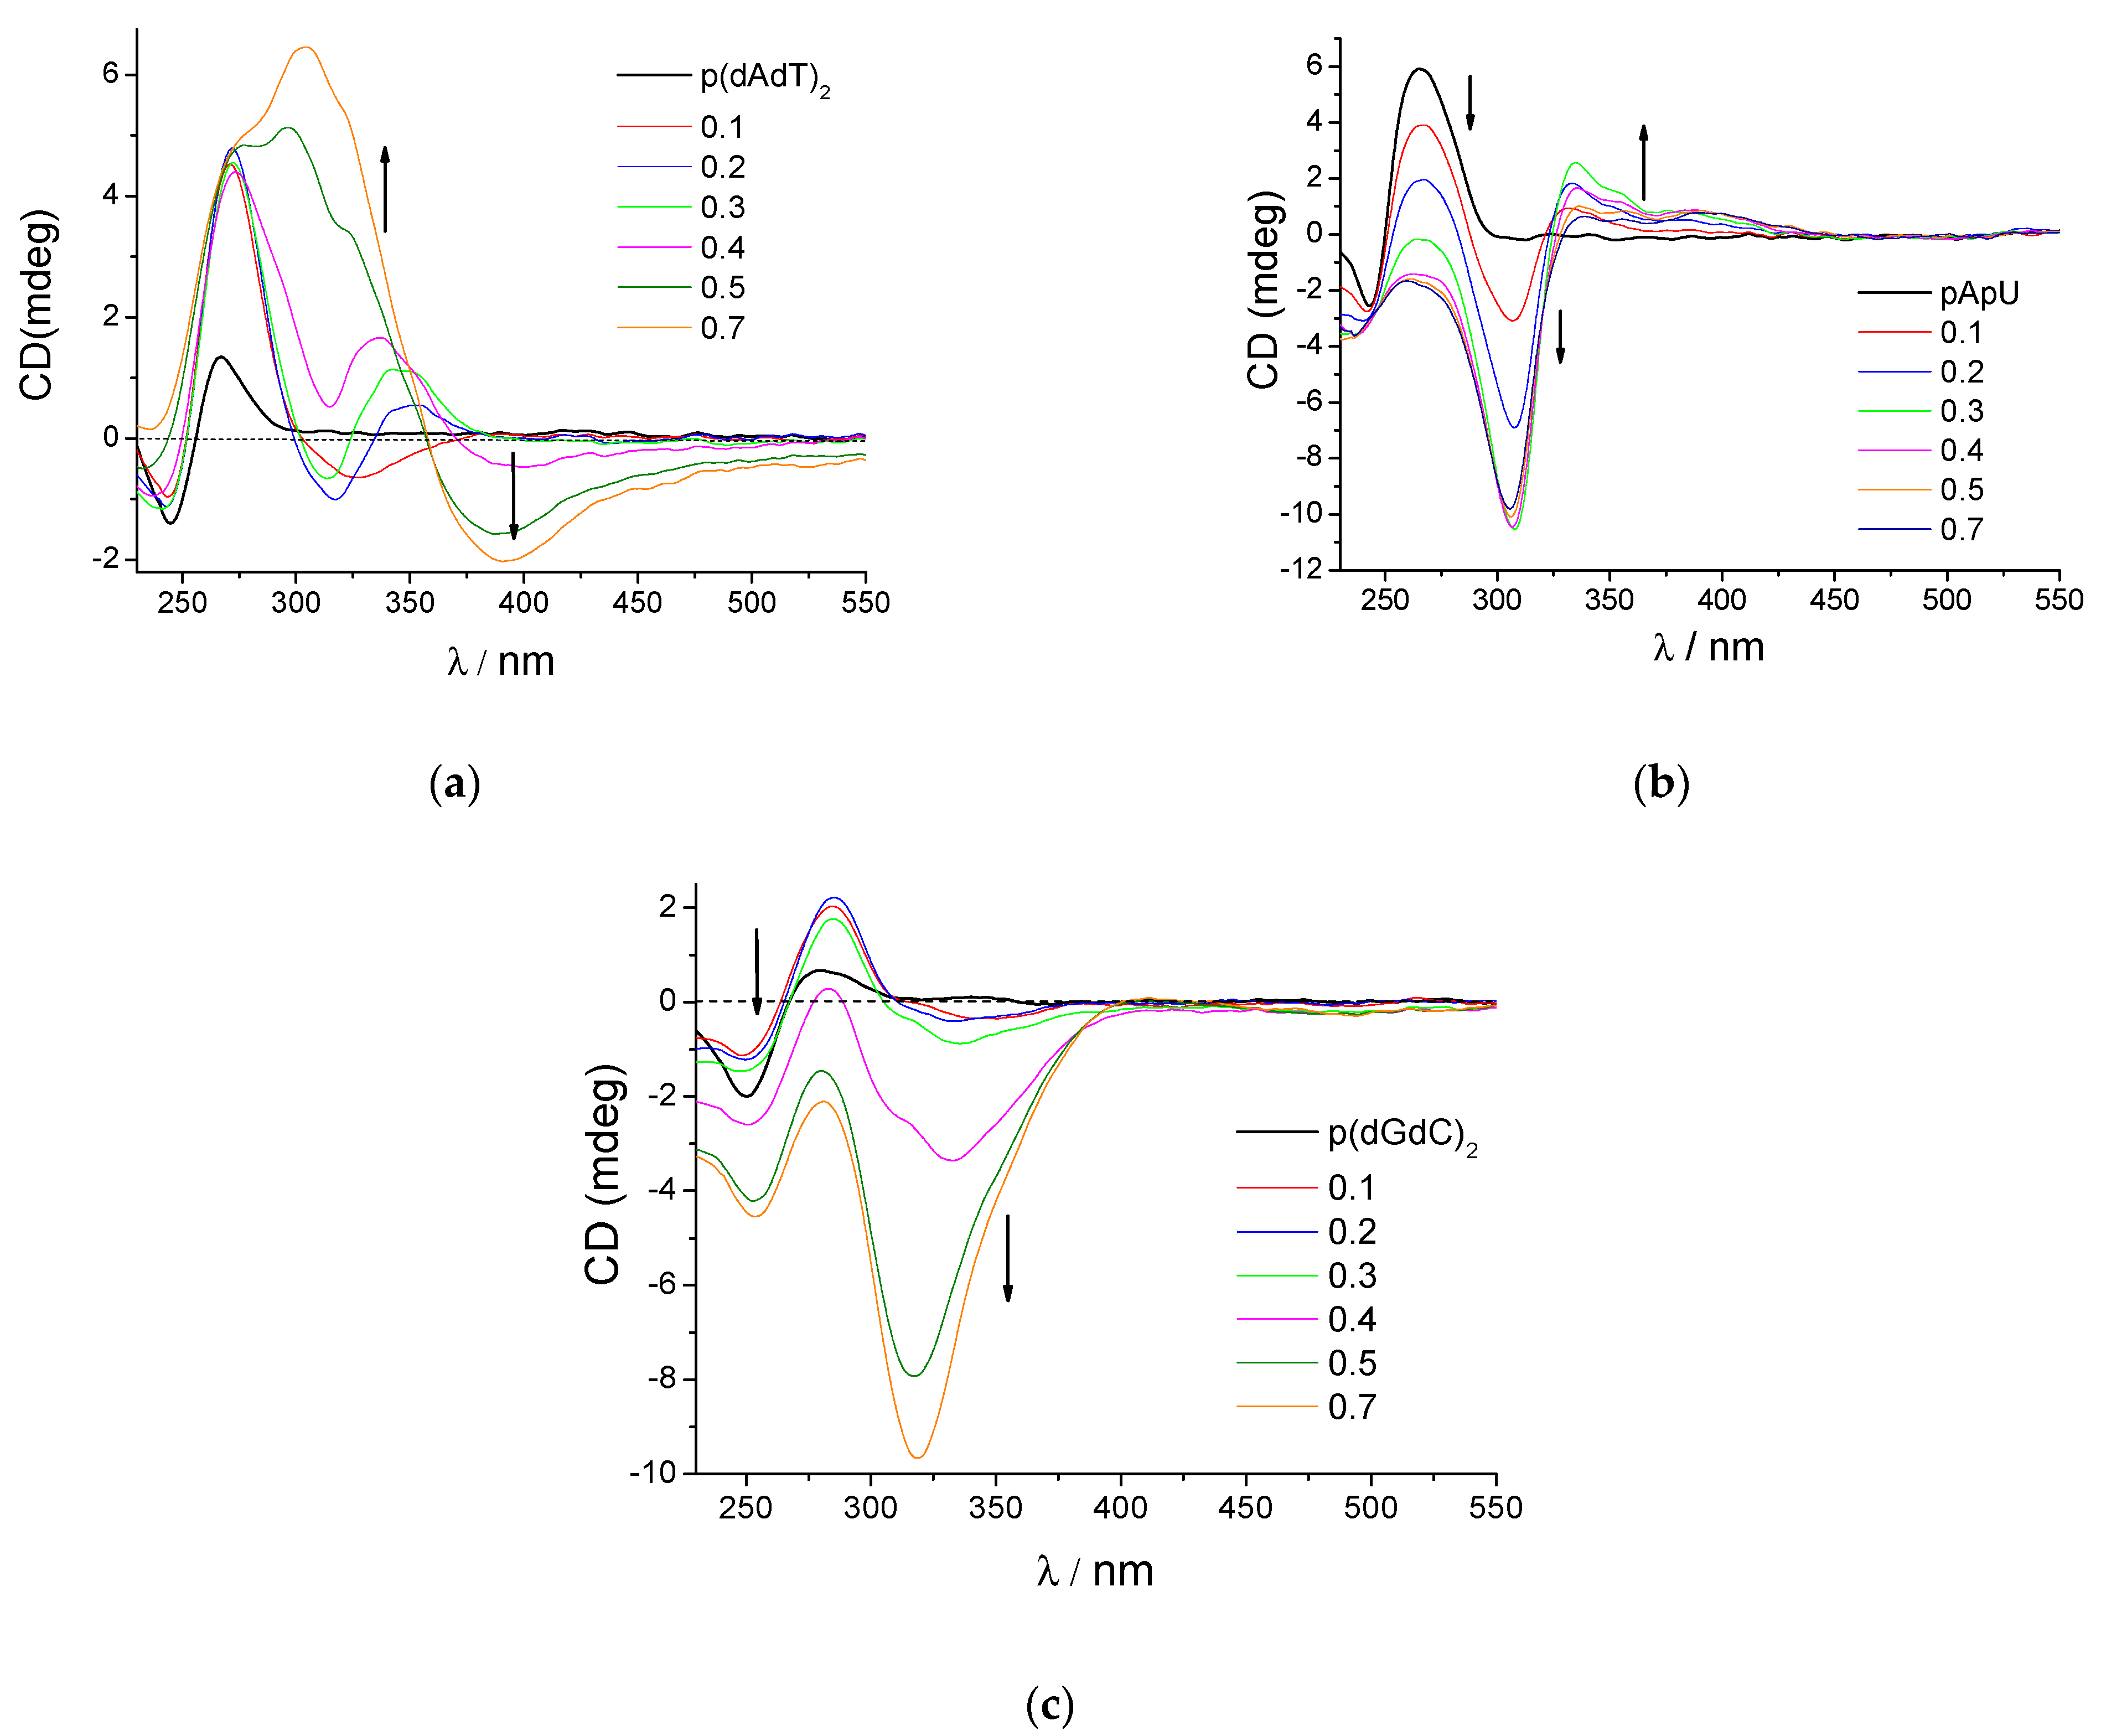
3.2.3. Circular Dichroism (CD) Experiments

The circular dichroism (CD) spectropolarimetrycan give additional information about the structural properties of the small molecule/polynucleotide complexes. For instance, achiral small molecules, such as 1, 2, 1M or 2M, can acquire an induced CD spectrum (ICD) upon binding to polynucleotides, directly dependent on a dominant mode of interaction [58,59].
The addition of both 1M and 2M induced pronounced changes in the CD spectra of ds-DNAs and ds-RNA (Figure 4 and Figure 5), which were strongly dependent on the secondary structure of the ds-polynucleotide (Supplementary Information, Table S1) and on the ratio r = [compound]/[polynucleotide].
For AT-DNA, at a low ratio (r ≤ 0.1), weak negative ICD bands at λ = 300−350 nm were observed for 1M and 2M, indicative of intercalation between base pairs [56,57], which agrees well with the bathochromic and hypochromic changes in UV/vis titrations, high binding constants, and pronounced thermal denaturation stabilisation. The monomethylated 1M/AT-DNA complex was characterised by an isoelliptic point at 297 nm (Figure 4a), supporting the formation of only one dominant type of complex. In contrast, further additions of 2M (r > 0.2) resulted in a strong negative ICD pattern, suggesting aggregation of pyrene molecules along ds-DNA [59].
The effect of 1M or 2M addition to AU-RNA was substantially different regarding the ICD band range at λ = 300−400 nm; at all ratios r, 1M caused a systematic increase of the positive ICD band with isoelliptic point at 300 nm (Figure 4b), which is characteristic of RNA major groove binding of a single molecule [59], while the addition of 2M resulted in very strong bisignate ICD bands with coupled negative-positive ICD bands in 280–400 nm range (Figure 5b) ascribed to the formation of pyrene-dimers or higher aggregates within the RNA major groove [59].
At an excess of GC-DNA over 2M (Figure 5c, ratio r < 0.2), a weak negative ICD band at 310-340 nm appeared, typical of intercalative binding [58,59]. However, only 2M induced an exceptionally strong negative ICD band at an excess of 2M over GC-DNA (Figure 5c, r > 0.3), its minimum changing with each addition of 2M, which could be attributed to the aggregation of pyrene-units in the strongly chiral structure.
CD spectra of ds-DNA changed only slightly upon the addition of non-methylated 1 or 2 at pH 5 (Supplementary Information, Figure S24), and no measurable ICD bands were observed, suggesting binding within the minor groove of DNA.

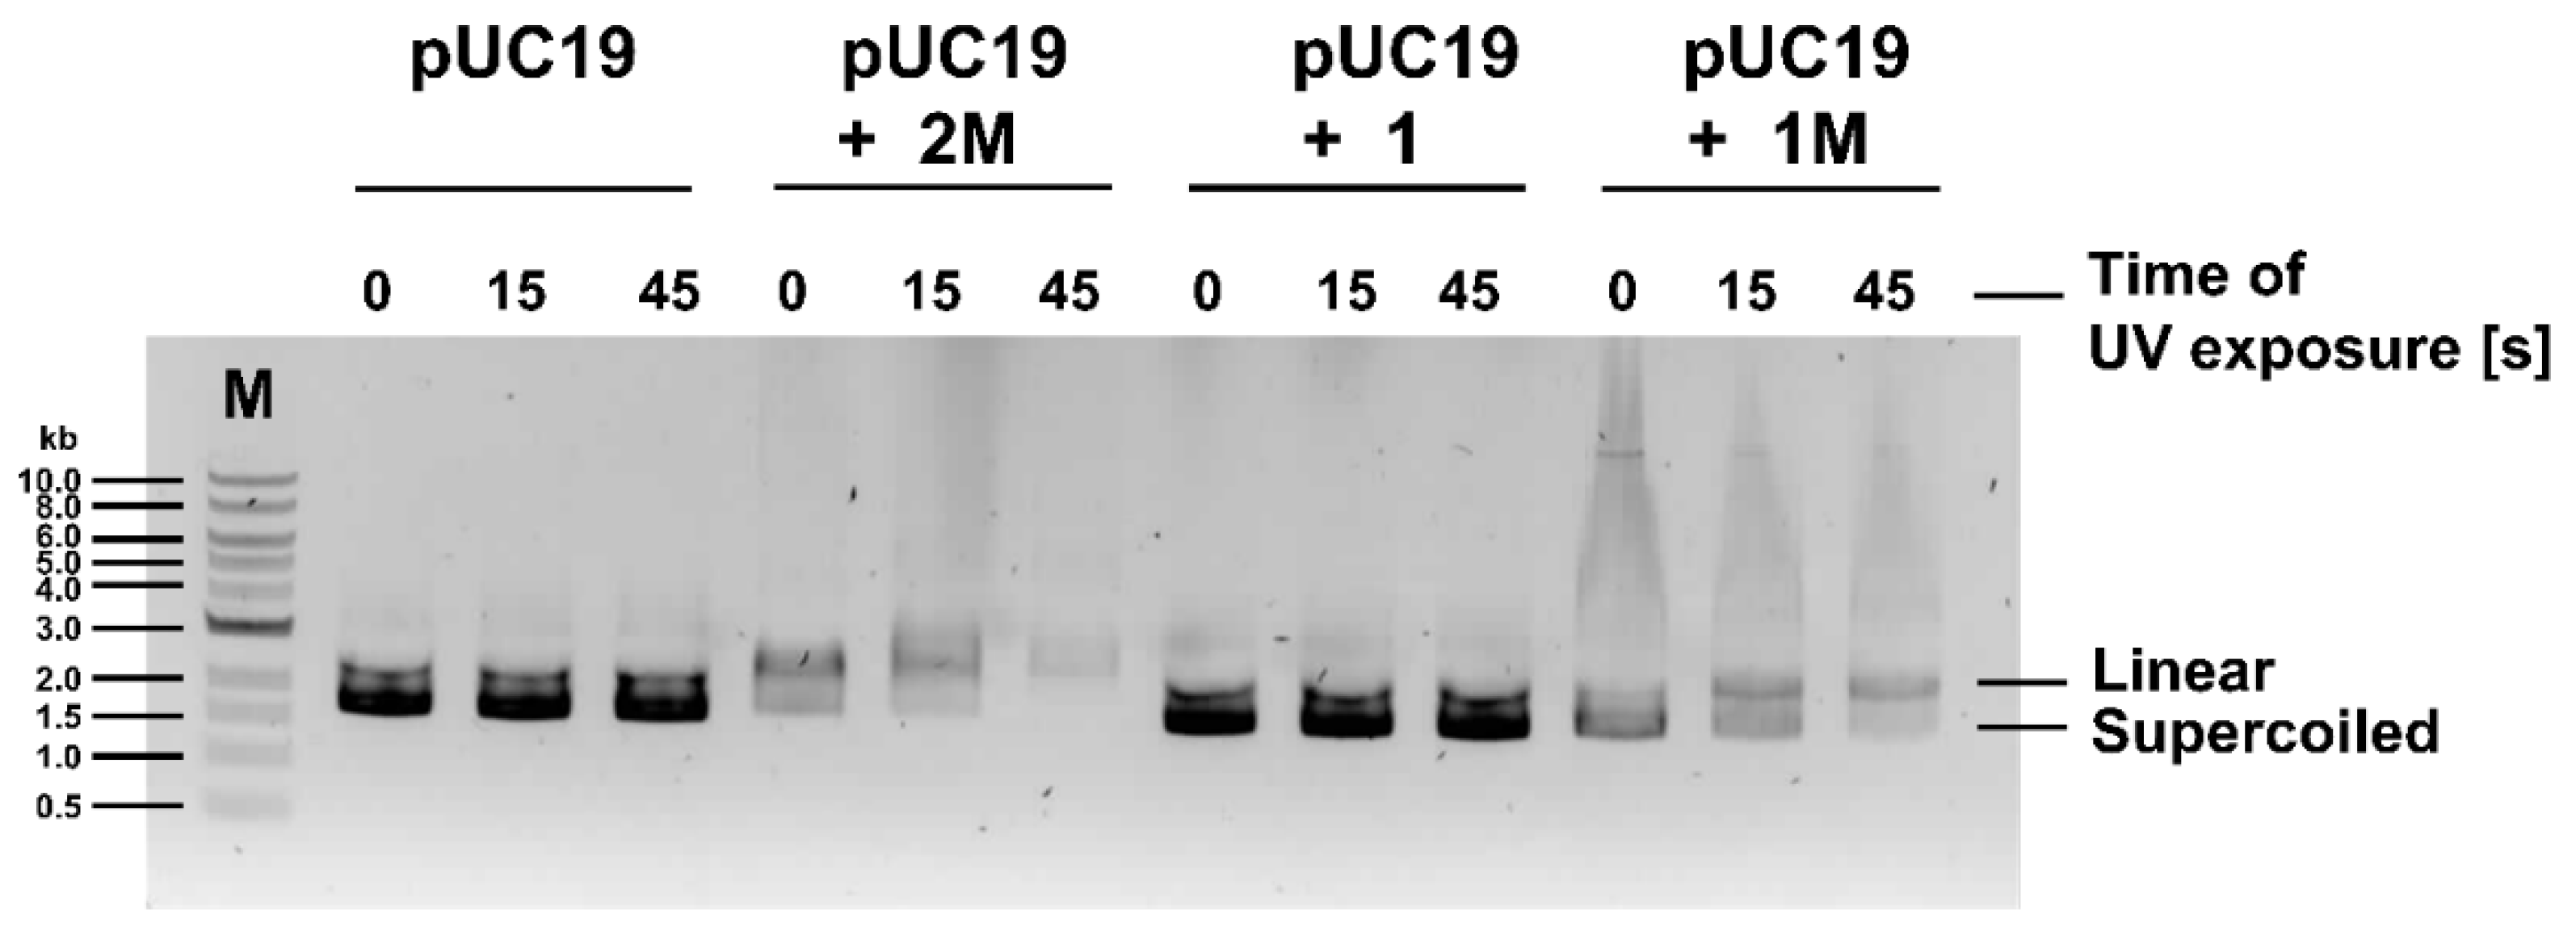
3.2.4. 2M and 1M Induce Plasmid DNA Cleavage

Due to its photophysical properties, allowing the photo-induced generation of singlet oxygen [46], as well as strong binding to ds-DNA, (vide supra) the pyrenes studied, can cause DNA cleavage upon UV irradiation [20]. In order to determine whether 2M, 1, and 1M possess DNA photo cleavage properties, we assessed plasmid DNA cleavage in the presence of 2M, 1, and 1M with or without UV irradiation (Figure 6).
As shown in Figure 6, both 2M and 1M exhibited strong photo-induced nuclease activity. Furthermore, dicationic 2M caused the unwinding of supercoiled DNA even without UV irradiation, which is in line with its capacity to intercalate into DNA, while monocationic 1M induced linearisation of plasmid DNA only after UV exposure. Compound 1M also caused nicking of the plasmid DNA, which was more pronounced under non-irradiated conditions. Non-DNA-intercalating neutral 1 did not show any influence on DNA plasmid forms, likely because compound 1 is not protonated at pH 7 and does not bind to DNA. As UV irradiation had no influence on the DNA plasmid forms itself, it is evident that linearisation of plasmid DNA was induced solely by the photo-activated compounds 2M and 1M.

4. Biological Activity of 1, 2, 1M, and 2M

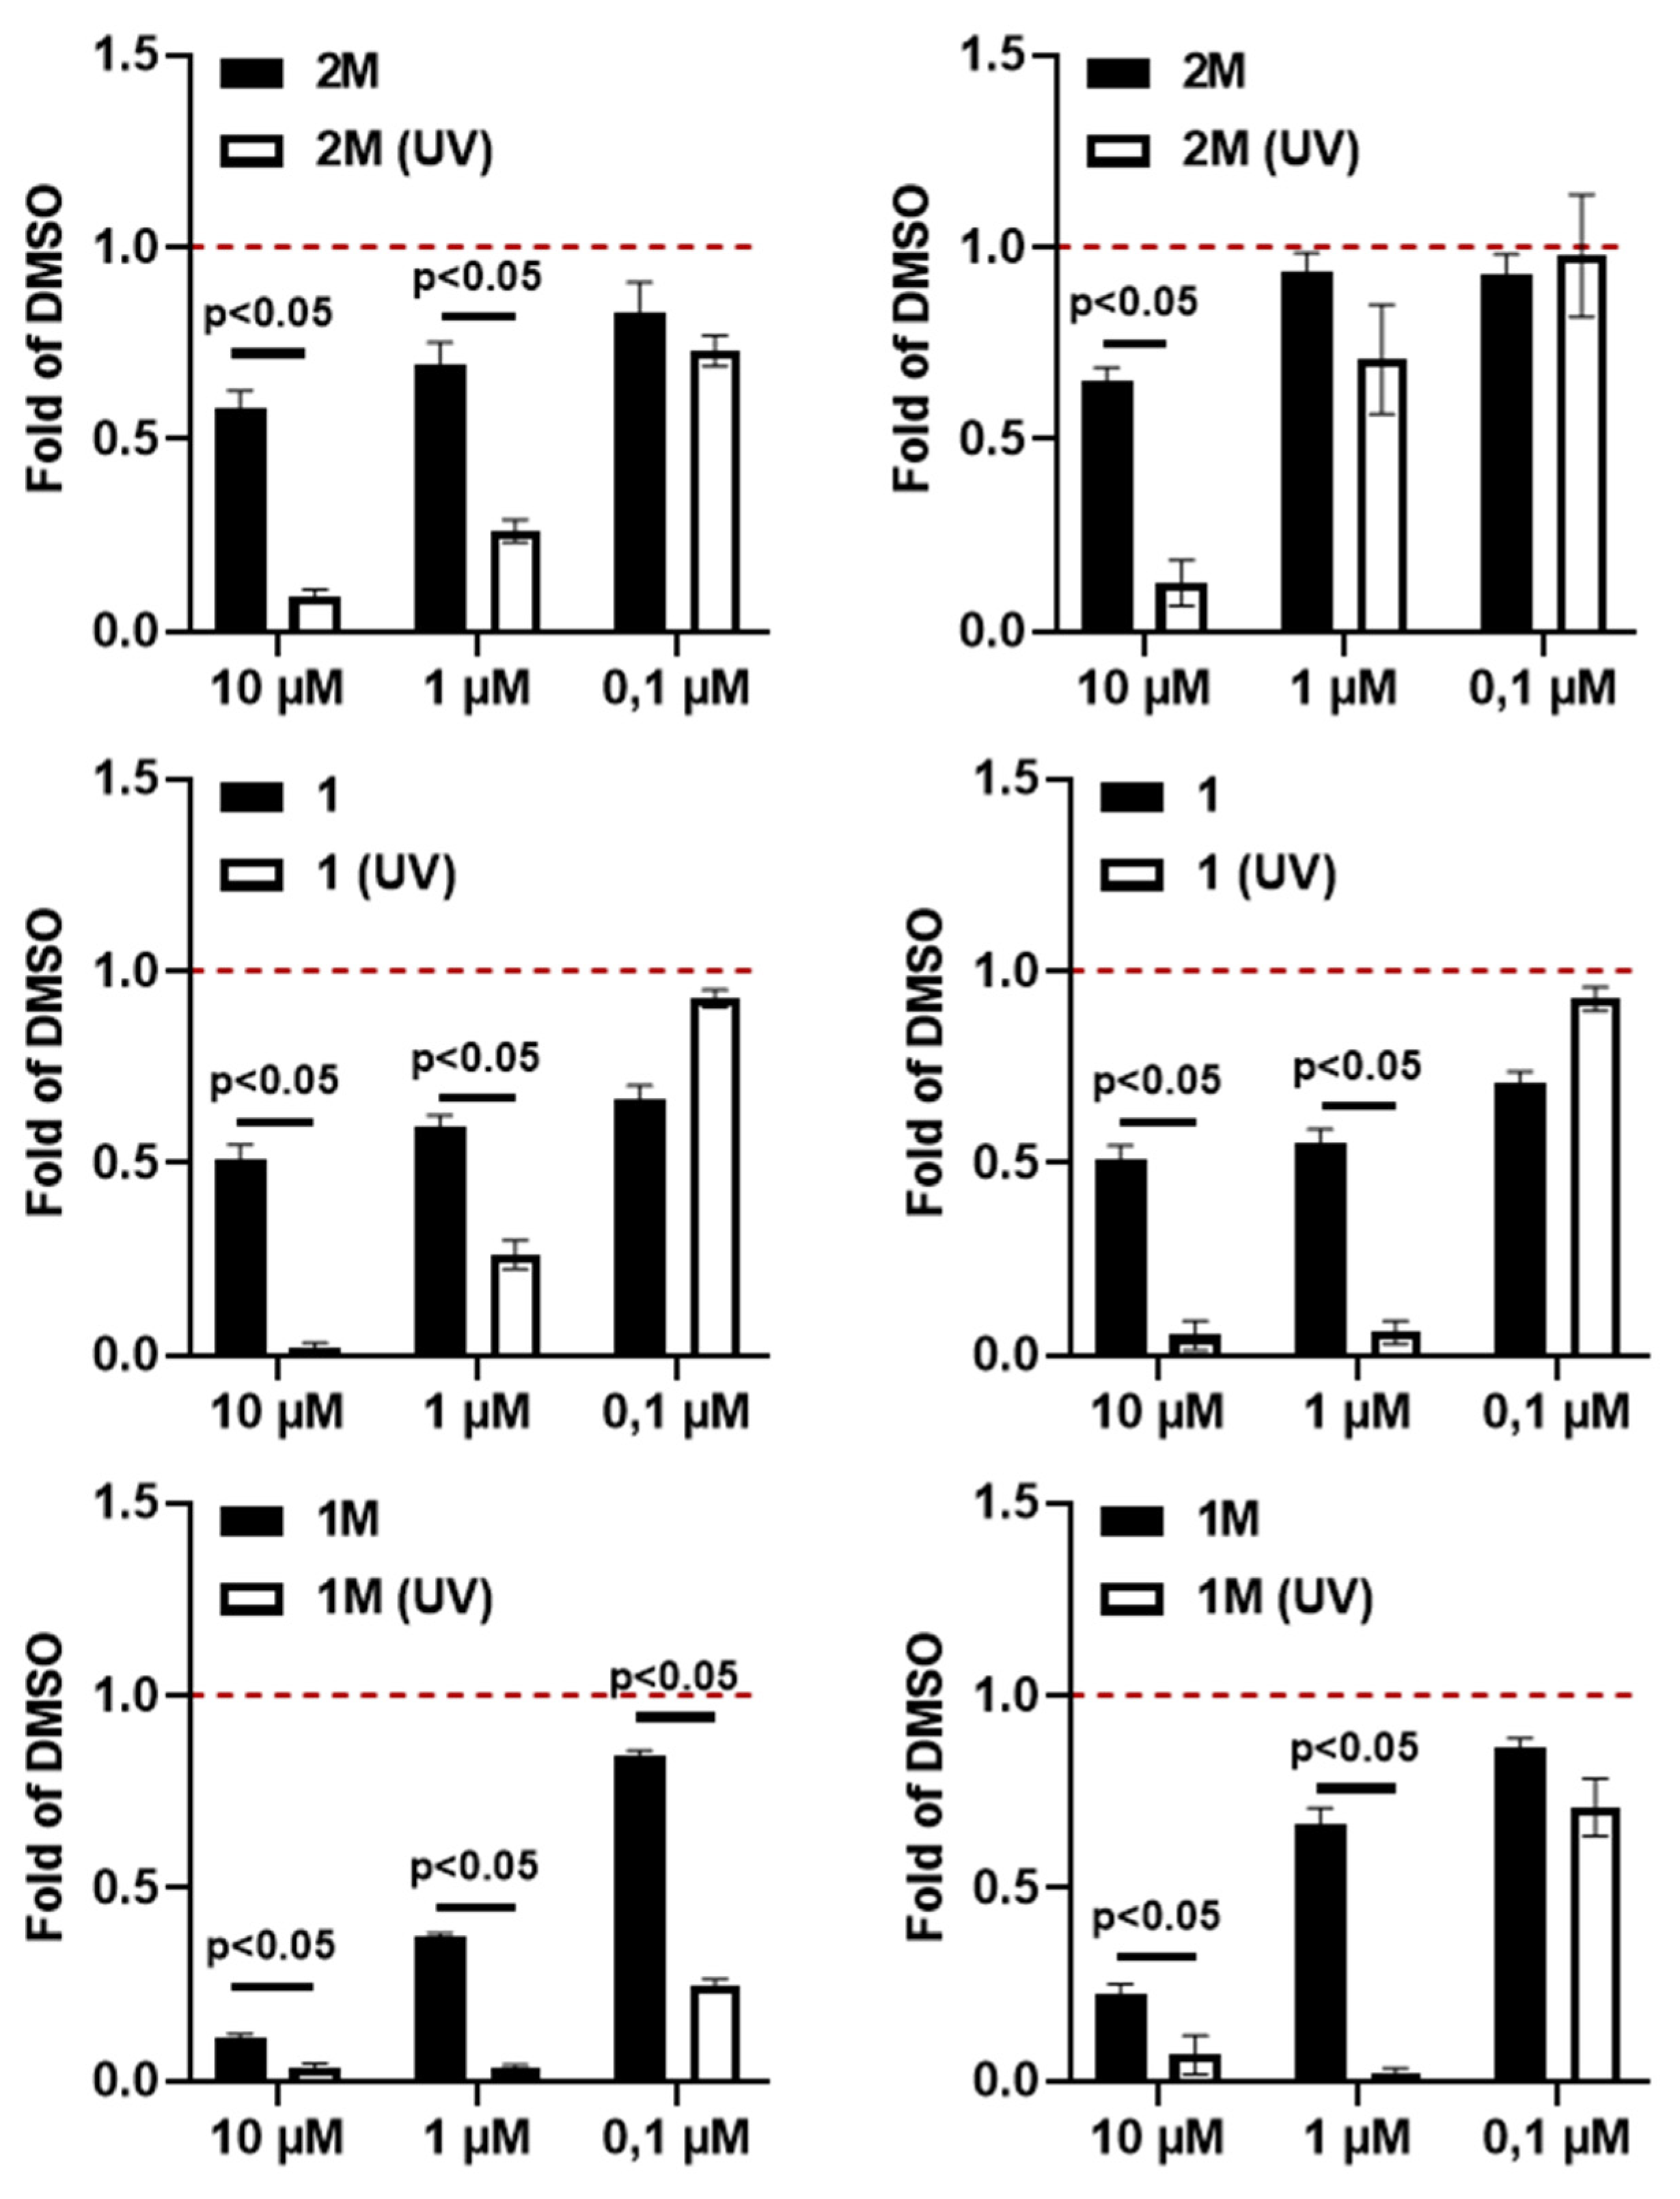
4.1. UV Light Irradiation Increases the Cell Toxicity of 2M, 1 or 1M

The cytotoxic effect of 2M, 1, and 1M on human lung carcinoma (A549) and normal lung (WI-38) cell lines were treated with different concentrations of 2M, 1, and 1M (10 μM, 1 μM and 0.1 μM) and cell survival was assessed by the MTT assay (Figure 7).
All three compounds, 2M, 1, and 1M, at 10 μM and 1 μM concentrations caused considerable cytotoxic effects in the A549 cell line. Under the same conditions, the WI-38 cell line was somewhat more resilient, particularly to cationic 1M and 2M. The cytotoxic effect of 2M, 1, and 1M was further increased by exposing treated cells to UV light. A significant decrease in cell survival was observed at higher concentrations of the compounds (10 µM and 1 µM) under UV light irradiation, the effect being more pronounced in tumour A549 cells compared to the normal WI-38 cell line. In addition, for the A549 cell line, a comparison of the IC50 values obtained for 2M and 1 revealed four times lower toxicity (8 µM vs. 2 µM) under non-irradiated conditions compared to the UV-irradiated experiment, while for 1M difference was even larger, UV-irradiation causing 15-times stronger IC50 values (1.5 µM vs. 0.1 µM). For the normal WI-38 cell line treated with our compounds, the effect of UV irradiation was similar to that observed for the A549 cell line. Thus, 1M exhibits the strongest photo-induced cytotoxicity, quite significant even at 0.1 µM concentrations, and comparable to many established antitumour drugs (e.g., doxorubicin). Compound 2 showed no cytotoxic effect (Supplementary Information, Figure S25) but, due to its low solubility, it was not included in further biological characterisation. Due to its lower pKa and tendency to precipitate, we did not study the biological action of compound 2 further.

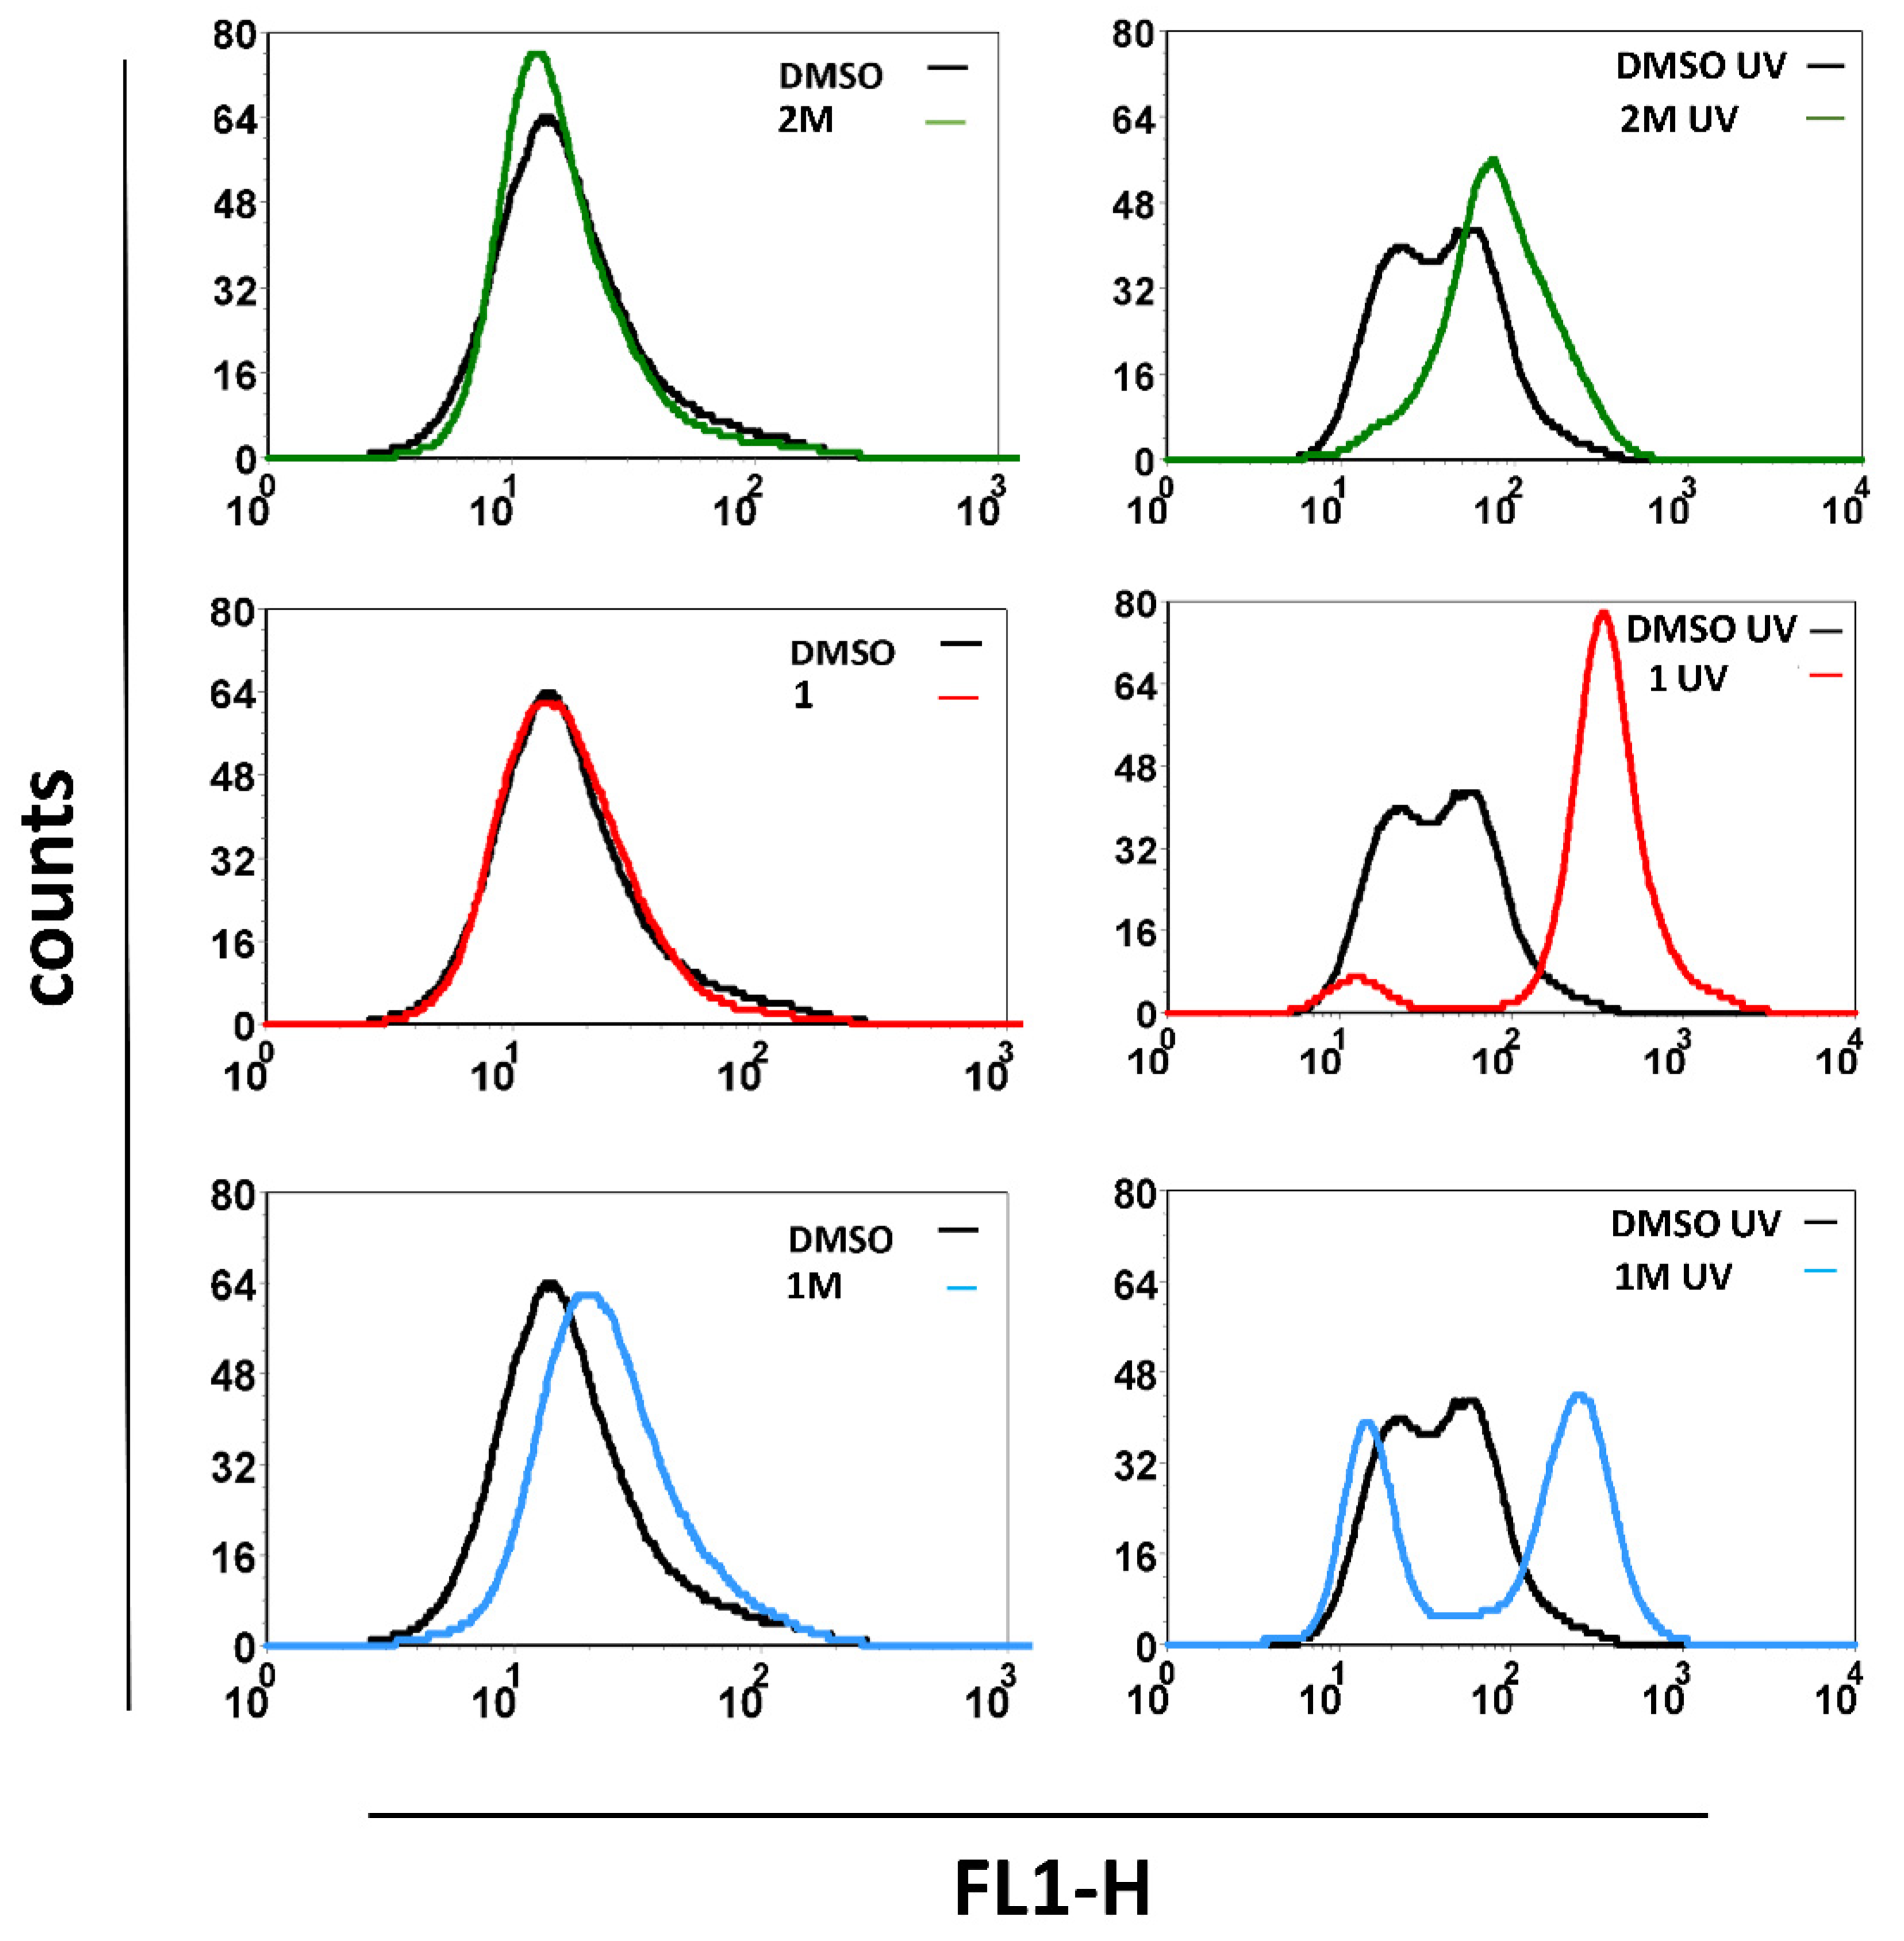
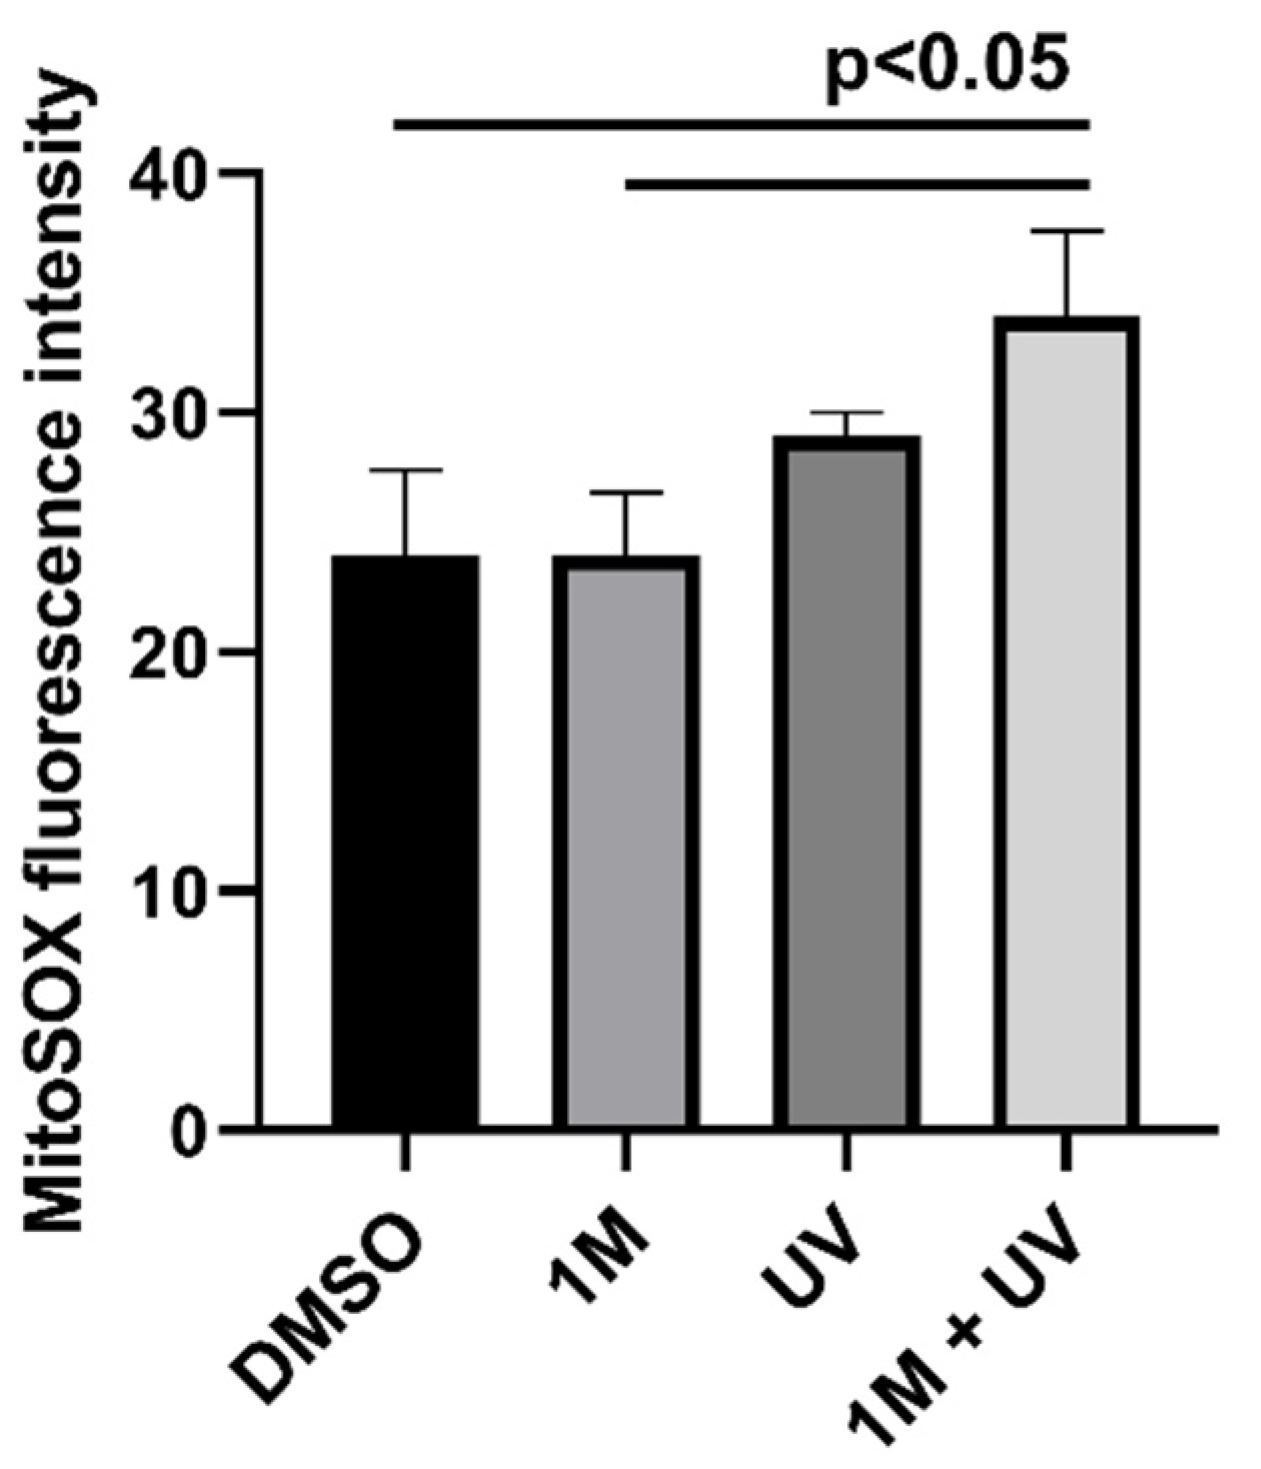
4.2. UV Light Irradiation Increases ROS Production in Cells Exposed to 2M, 1, or 1M

Exposing human cells to pyrenes may result in increased production of reactive oxygen species (ROS) [6]. We, therefore, assessed the generation of ROS in A549 cells treated with 10 µM 2M, 1, or 1M, under UV irradiation, while control experiments were kept in dark. As shown in Figure 8, treating cells with 1M alone already induced the production of intracellular ROS.
The observed increase in ROS production was moderate, but distinctive. UV light irradiation of A549 cells treated with 2M, 1, and 1M caused an immediate and strong increase in ROS production. A certain percentage of cells treated with 1M disintegrated after UV exposure (see video experiment on a confocal microscope, Supplementary Information), and thus could not be stained by the DCF dye.

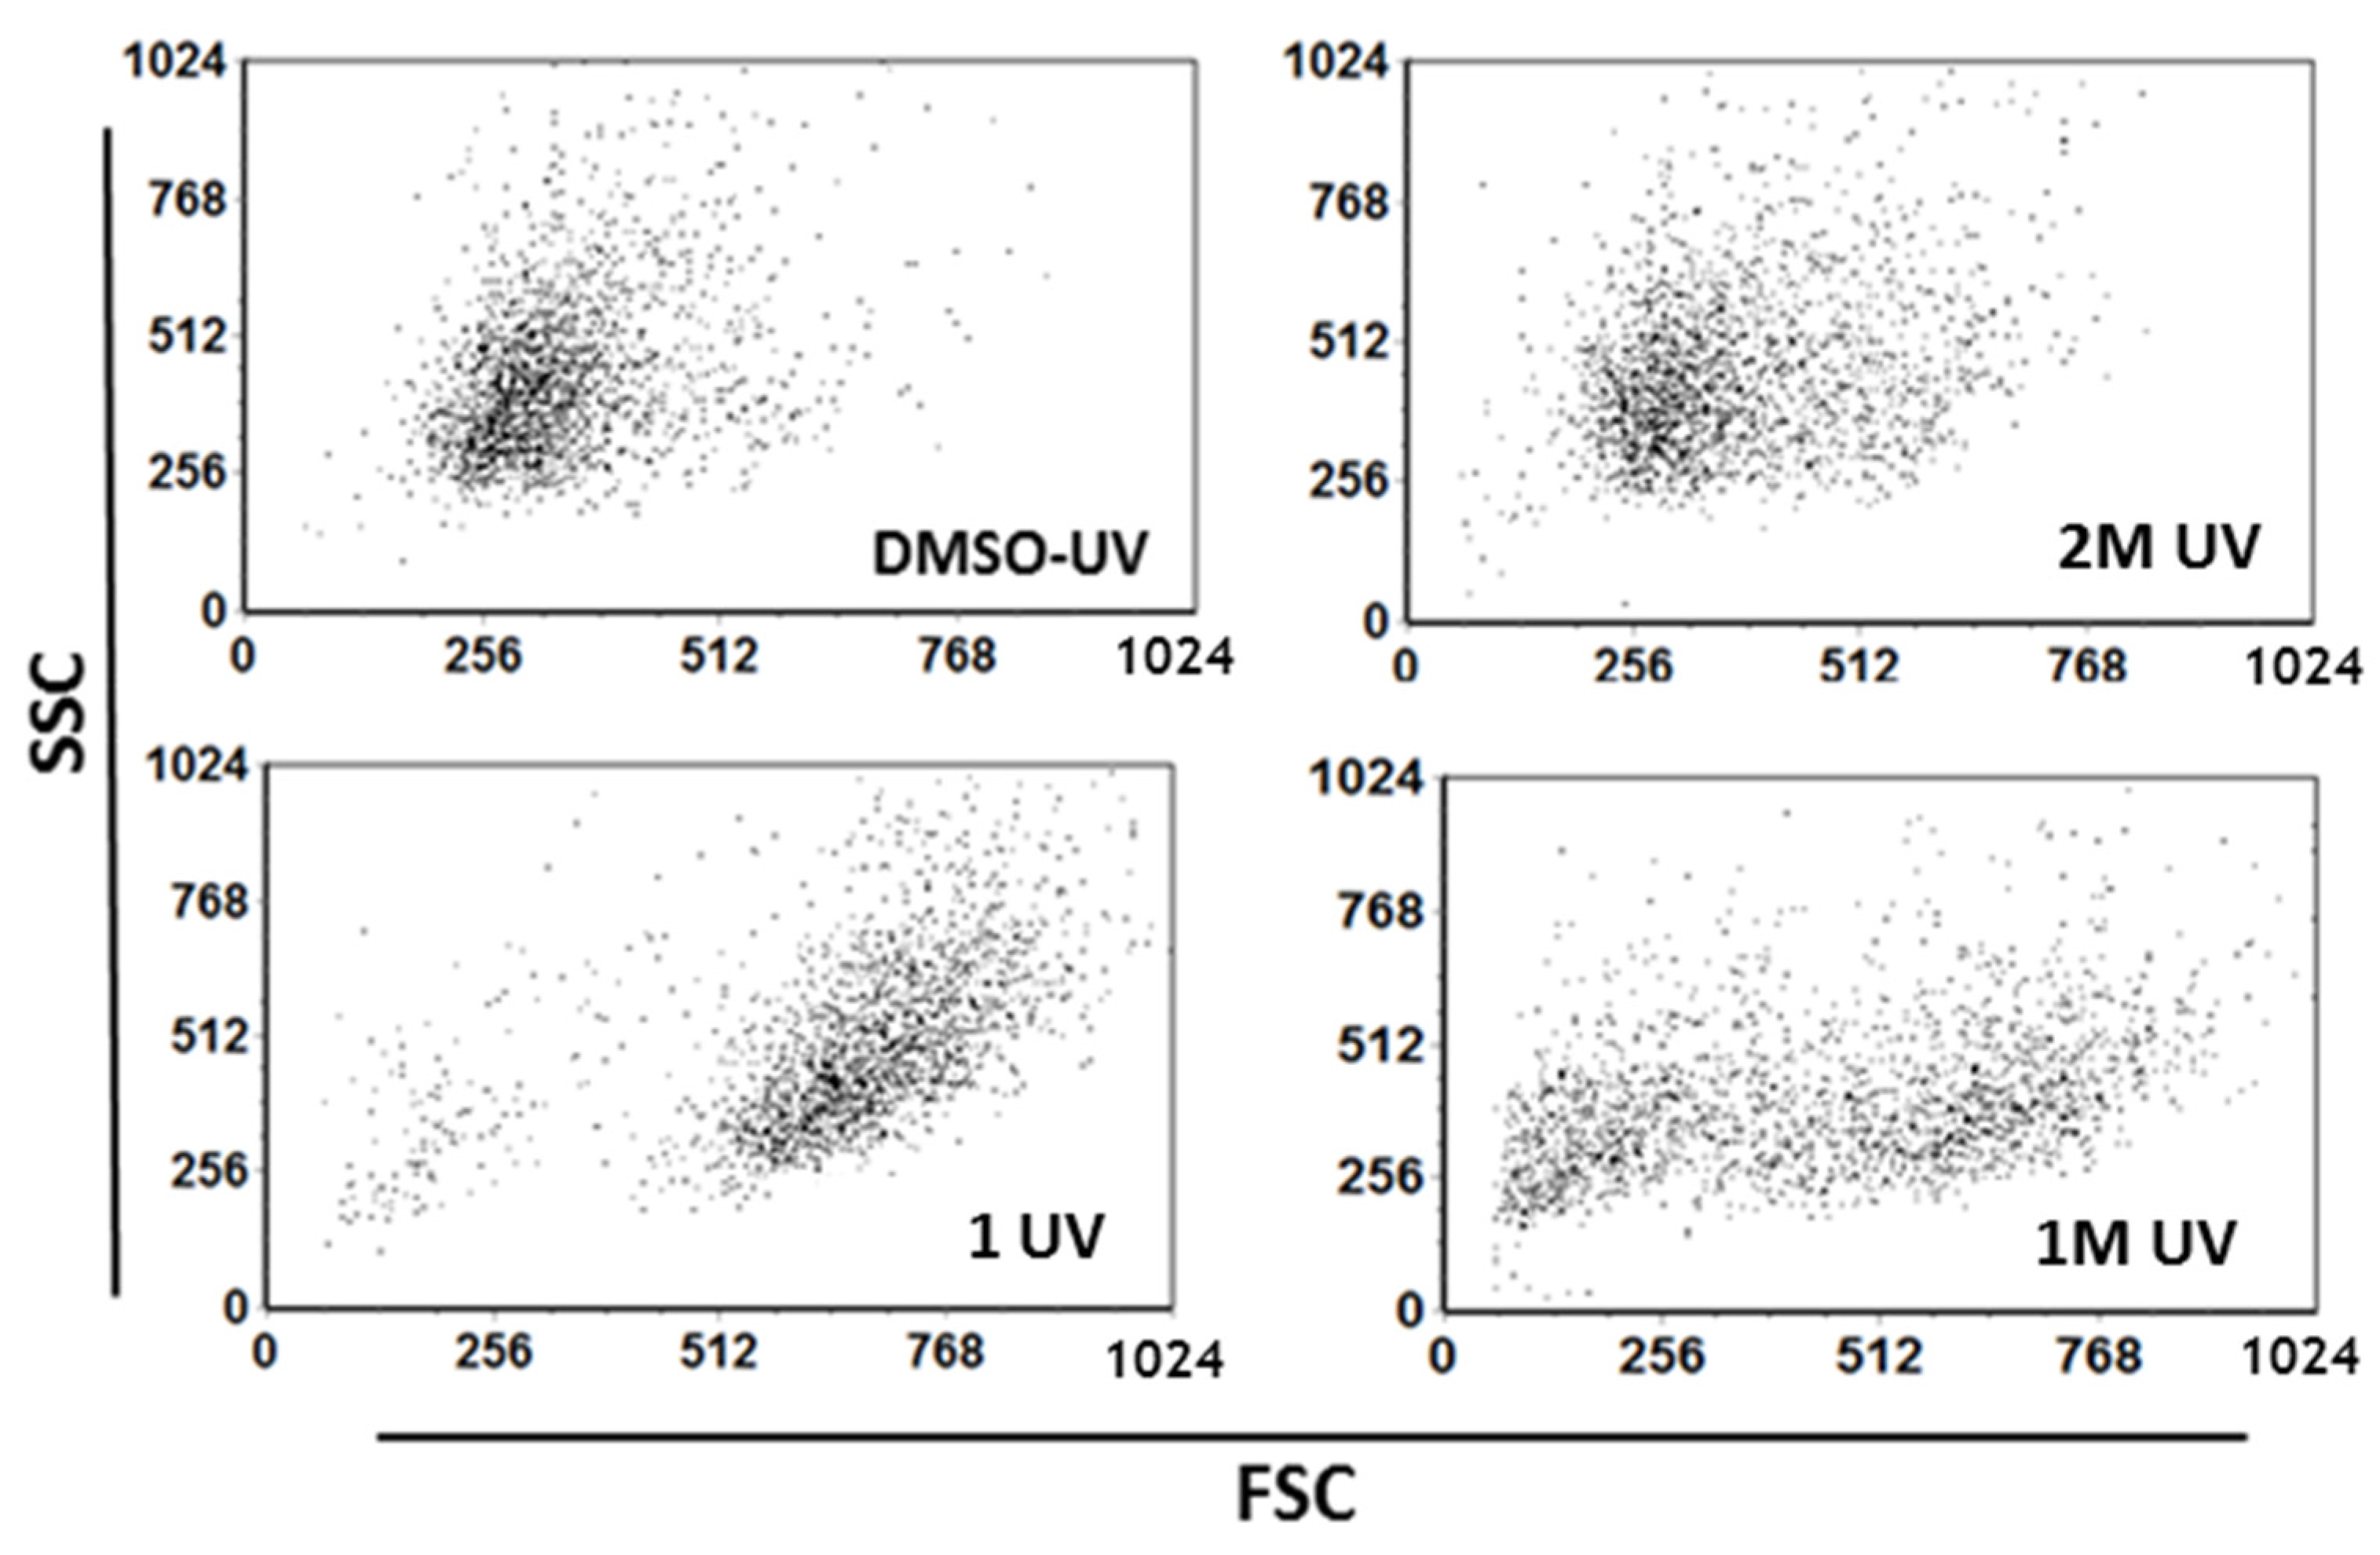
4.3. UV Light Irradiation Increases Cell Size of 2M, 1 or 1M Treated A549 Cells

When observed on a confocal microscope, irradiated at 350 nm by a diode light source, 2M- and 1M-treated A549 cells exhibited swelling and even blebbing morphology (Figure 9), under continuous irradiation, already appearing within the first minute (see video experiment on a confocal microscope, Supplementary Information). In the control experiment, non-treated cells did not show any changes upon irradiation.
To corroborate further the observed phenomena, we determined morphology changes in 2M-, 1-, and 1M-treated A549 cells after exposing them to UV light. Morphology changes were determined by flow cytometry, which allows the assessment of cell size (FSC) and complexity (SSC). UV irradiation caused an increase in cell size in 2M-, 1-, and 1M-treated A549 cells as evidenced by an increase in FSC value (Figure 10). This increase was the most pronounced in cells treated with 1 and 1M. Such morphological changes observed upon ROS production are consistent with the blebbing changes observed by confocal microscopy (see video experiment on a confocal microscope, Supplementary Information) and suggest strong singlet oxygen production induced by irradiation.

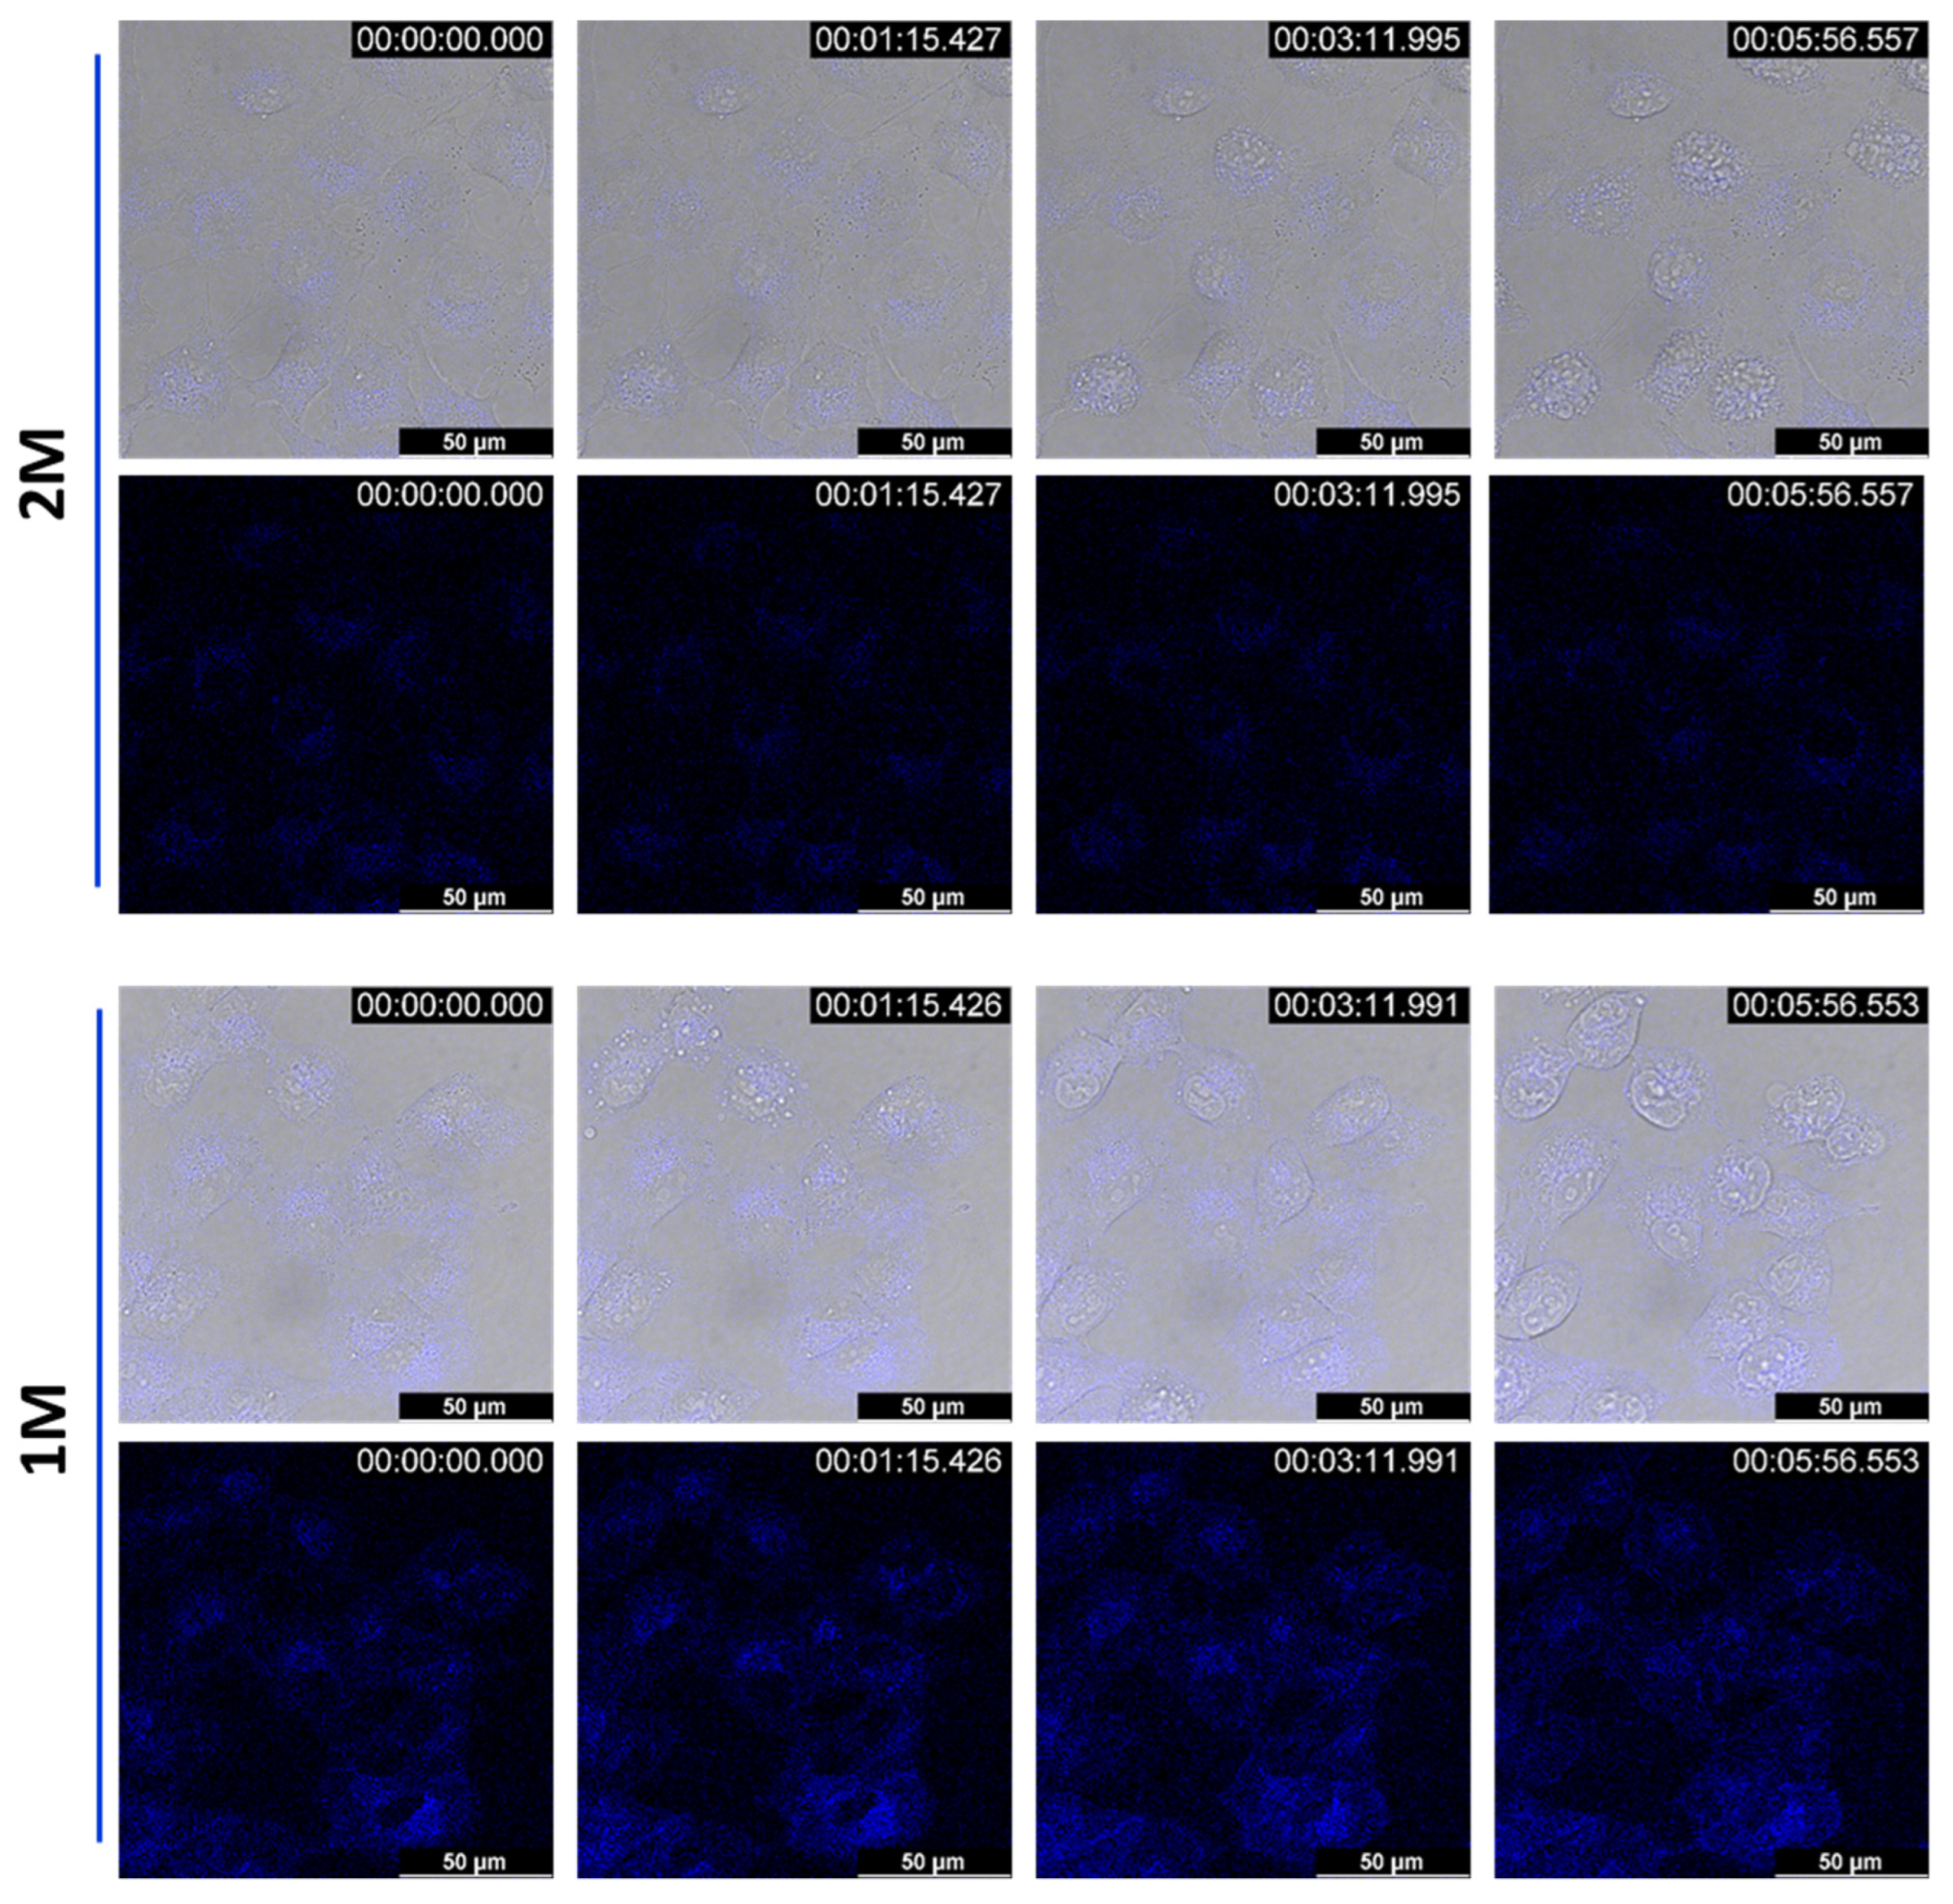
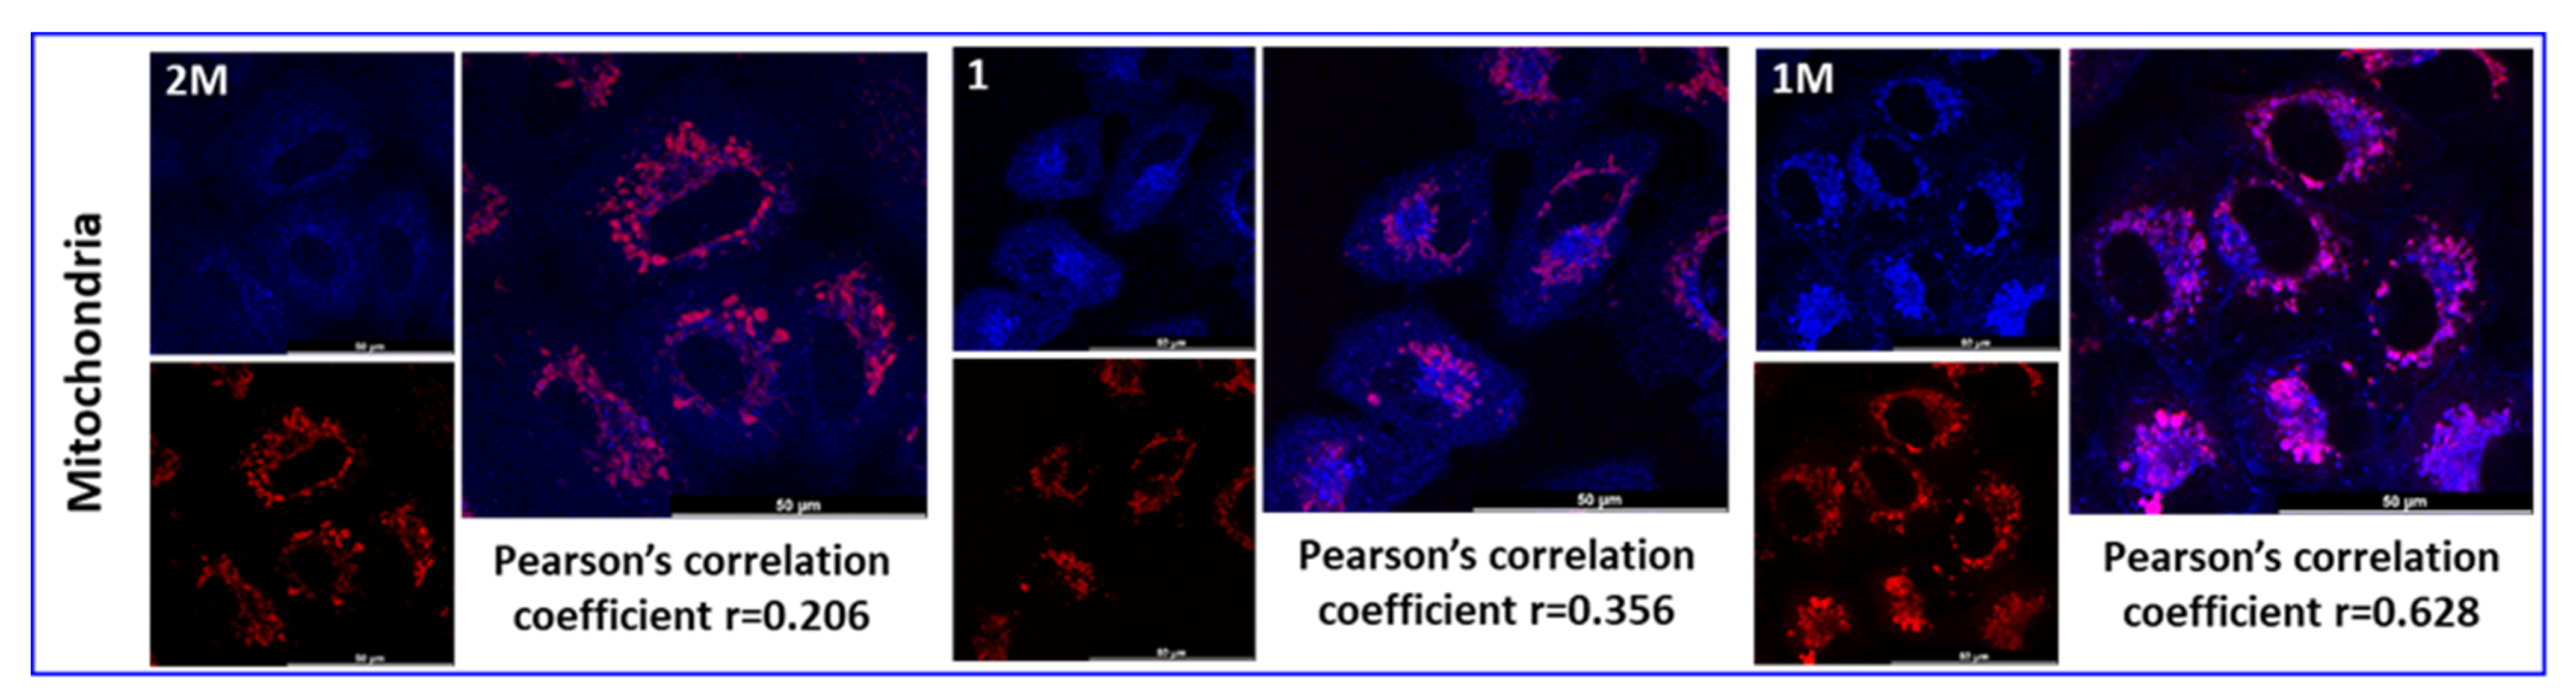
4.4. Intracellular Localisation of Compounds

To investigate intracellular localisation of 2M, 1, and 1M we performed co-localisation experiments with stains specific for various cytoplasmic organelles, namely mitochondria, lysosome, and Golgi apparatus (Figure 11).
Based on 2M, 1, and 1M intracellular trafficking observed by live cell imaging, it was obvious that the compounds tested do not follow the pattern of early endosomes (Figure 7); however, we were not able to deduce whether some of them localise in lysosomes or Golgi. Thus, we treated cells with 2M, 1, and 1M, fixed them with PFA and did colocalisation studies with LAMP1 as a marker for lysosomes and Gm130 as a marker for Golgi. All three compounds tested 2M, 1, and 1M, show a modest degree of localisation in lysosomes (Pearson’s coefficients of 0.404, 0.468 and 0.46 respectively) (Figure 11A). Likewise, 2M, 1, and 1M do not colocalise with Golgi (Pearson’s coefficients of 0.165, 0.294 and 0.27, respectively) (Figure 11B).
For assessing the colocalisation of 2M, 1, and 1M with mitochondria, we used Mito Tracker Deep Red. As shown in Figure 12, 1M shows significant colocalisation at mitochondria (Pearson’s coefficient of 0.628), while 2M and 1 do not localize at mitochondria (Pearson’s coefficients of 0.206 and 0.356, respectively).
In conclusion, the compounds studied very efficiently enter living cells; however, none of them specifically accumulates at one intracellular organelle, and their intracellular distributions differ. Contrary to what would be expected from the observed strong DNA interactions (vide supra), the compounds do not bind to the cell nucleus. However, the monocation 1M significantly accumulates in mitochondria, suggesting eventual interactions with mitoDNA. Dication 2M and neutral compound 1 are non-selectively distributed over several different cellular organelles.

4.5. 1M in Combination with UV Light Irradiation Acts on Mitochondria Causing Their Dysfunction by Increasing Their ROS Levels

As we saw that 1M shows significant localisation at mitochondria, and having in mind its binding to DNA, as well as strong induction of total ROS production, we next investigated whether 1M can cause mitochondrial damage. Therefore, we determined the production of mitochondrial ROS (mtROS) by quantification of MitoSOX Red intensities.
We observed statistically significant differences in the production of mtROS between the groups studied, while combined treatment with 1M and UV irradiation significantly increased mtROS levels compared to DMSO and 1M alone (Figure 13). Our results strongly suggest that the combination of 1M and UV light irradiation significantly and specifically increases mtROS levels, thus indicating that the combination of 1M and UV may cause specific impairment of mitochondrial function by increasing mtROS levels.

5. Conclusions

In this study, we assessed in detail the interactions of previously synthesised, permanently positively charged compounds 1M and 2M, and their non-methylated analogues 1 and 2, with important biological targets: DNA, RNA, and BSA. Permanently charged 1M and 2M showed high-affinity intercalation into ds-DNAs, accompanied by aggregation at an excess of dye over DNA/RNA.
The fluorescence from non-methylated compounds 1 and 2 was strongly dependent on the protonation of the pyridines and, as a result, they behave as fluorescence ratiometric probes for simultaneous detection of both ds-DNA and BSA at pH 5, relying on the ratio between intensities at 420 nm (BSA specific) and 520 nm (DNA specific). Even more useful was the possibility to switch-off ds-DNA sensing by adjustment to pH 7, at which only BSA yields a measurable emission change.
Due to the absence of DNA affinity at neutral pH, non-methylated compounds 1 and 2 did not cleave plasmid DNA upon irradiation, in contrast to the very efficient photoinduced DNA cleavage by permanently charged 1M and 2M. This photoinduced cleavage could be attributed to pyrene-mediated irradiation-induced production of singlet oxygen, which would cleave the DNA backbone close to the DNA-binding site of pyrene.
Further experiments in vitro on A549 and WI-38 cell lines revealed moderate cytotoxicities of 2M, 1, and 1M, which increase strongly upon light irradiation. This effect is most pronounced for 1M, yielding measurable photo-induced activity at submicromolar concentrations. Detailed experiments showed that light irradiation increased total ROS production in cells treated with 2M, 1, or 1M, while 1M induced ROS production even without UV irradiation. Besides ROS production, UV irradiation of 1- and 1M-treated cells also caused significant changes in cell size and morphology, namely cell swelling and augmentation of cellular complexity, all of which are markers for ROS-induced cellular damage.
The intracellular localisation of 2M, 1, and 1M was very compound-dependent. The biologically most potent compound, 1M, showed significant localisation at mitochondria, which led us to suspect that increased cell death observed in cells treated with this compound could be due to mitochondrial damage. Indeed, as we measured the production of mitochondrial ROS in UV-irradiated 1M-treated cells, this showed that 1M, in combination with UV light irradiation, specifically acts on mitochondria causing their dysfunction by increasing mitochondrial ROS levels. As 1M induced plasmid DNA cleavage upon irradiation, we believe that increased mitochondrial ROS production could be caused by increased mitochondrial DNA damage. Namely, increased mitochondrial ROS production has been reported in human airway epithelial cells exposed to benzo(a)pyrene [60]. Similarly, exposure to benzo(a)pyrene has been shown to cause mitochondrial dysfunction and injury to neural cells [61].
Thus, compounds studied, owing to their fluorescence and bio-bioactivity, could be considered promising lead compounds for two-photon-excited theranostic applications [62].

Supplementary Materials

The following supporting information can be downloaded at: https://www.mdpi.com/article/10.3390/pharmaceutics14112499/s1, Figure S1: (a) Dependence of the UV/Vis spectrum of 1 (c = 2.0 × 10⁻⁵ M) on pH; (b,c) Dependence of the UV/Vis spectrum on pH at selected maxima. The pKa is 5; Figure S2: (a) Dependence of the UV/Vis spectrum of 2 (c = 2.0 × 10⁻⁵ M) on pH; (b) Dependence of the UV/Vis spectrum on pH at 318 m. The pKa is < 4; Figure S3: (a) Dependence of the fluorescence spectrum of 1 (c = 1.0 × 10⁻⁶ M; λexc = 340 nm) on pH; (b) Dependence of the fluorescence spectrum of 2 (c = 1.0 × 10⁻⁶ M; λexc = 332 nm) on pH; (c) Dependence of the UV/Vis spectrum on pH at 527 nm. The pKa is < 4; Figure S4: (a) Changes in the UV/vis spectrum of 1M (c = 5.0 × 10⁻⁶ M) upon titration with ctDNA; (b) Dependence of the absorbance of 1M at λmax = 319 nm on c(ct-DNA), at pH 7.0, sodium cacodylate buffer, I = 0.05 M; Figure S5: (a) Changes in the UV/vis spectrum of 1M (c = 5.0 × 10⁻⁶ M) upon titration with p(dAdT)2; (b) Dependence of the absorbance of 1M at λmax = 316 nm on c(p(dAdT)2), at pH 7.0, sodium cacodylate buffer, I = 0.05 M; Figure S6: (a) Changes in the UV/vis spectrum of 1M (c = 5.0 × 10⁻⁶ M) upon titration with p(dGdC)2; (b) Dependence of the absorbance of 1M at λmax = 316 nm on c(p(dGdC)2), at pH 7.0, sodium cacodylate buffer, I = 0.05 M; Figure S7: (a) Changes in the UV/vis spectrum of 1M (c = 5.0 × 10⁻⁶ M) upon titration with pApU; (b) Dependence of the absorbance of 1M at λmax = 316 nm on c(pApU), at pH 7.0, sodium cacodylate buffer, I = 0.05 M; Figure S8: (a) Changes in the UV/vis spectrum of 2M (c = 5.0 × 10⁻⁶ M) upon titration with ct-DNA; (b) Dependence of the absorbance of 2M at λmax = 319 nm on c(ctDNA), at pH 7.0, sodium cacodylate buffer, I = 0.05 M; Figure S9: (a) Changes in the UV/vis spectrum of 2M (c = 5.0 × 10⁻⁶ M) upon titration with p(dAdT)2; (b) Dependence of the absorbance of 2M at λmax = 319 nm on c(p(dAdT)2), at pH 7.0, sodium cacodylate buffer, I = 0.05 M; Figure S10: (a) Changes in the UV/vis spectrum of 2M (c = 5.0 × 10⁻⁶ M) upon titration with p(dGdC)2; (b) Dependence of the absorbance of 2M at λmax = 319 nm on c(p(dGdC)2), at pH 7.0, sodium cacodylate buffer, I = 0.05 M; Figure S11: (a) Changes in the UV/VIS spectrum of 2M (c = 5.0 × 10⁻⁶ M) upon titration with pApU; (b) Dependence of the absorbance of 2M at λmax = 319 nm on c(pApU), at pH 7.0, sodium cacodylate buffer, I = 0.05 M; Figure S12: (a) Changes in the fluorescence spectrum of 1 (c = 5.0 × 10⁻⁷ M) upon titration with ct-DNA at λexc = 340 nm; (b) Dependence of the intensity of the emission of 1 at λmax = 540 nm on c(ct-DNA), at pH 5.0, sodium cacodylate buffer, I = 0.05 M; Figure S13: Changes in the fluorescence spectrum of 1 (c = 5.0 × 10⁻⁷ M) upon titration with BSA at λexc = 340 nm; sodium cacodylate buffer, I = 0.05 M: (a) pH 7.0 (b) pH 5.0; Figure S14: (a) Changes in the fluorescence spectrum of 2 (c = 5.0 × 10⁻⁷ M) upon titration with BSA at λexc = 319 nm; (b) Dependence of the intensity of the emission of 2 at λmax = 418 nm on c(BSA), at pH 7.0, sodium cacodylate buffer, I = 0.05 M; Figure S15: (a) Changes in the fluorescence spectrum of 1M (c = 5.0 × 10⁻⁷ M, λexc = 336 nm) upon titration with BSA; (b) Dependence of the intensity of the emission of 1M at λmax = 476 nm on c(BSA), at pH 7.0, sodium cacodylate buffer, I = 0.05 M; Figure S16: (a) Changes in the fluorescence spectrum of 2M (c = 5.0 × 10⁻⁷ M, λexc = 336 nm) upon titration with BSA; (b) Dependence of the intensity of the emission of 2M at λmax = 526 nm on c(BSA), at pH 7.0, sodium cacodylate buffer, I = 0.05 M; Figure S17: (a) Melting curve of ctDNA upon addition r = 0.2 and r = 0.3 ([compound/[polynucleotide]) of 1M at pH 7.0 (buffer sodium cacodylate, I = 0.05 M), b) first derivative of the absorbance vs. temperature; Figure S18: (a) Melting curve of p(dAdT)2 upon addition r = 0.2 and r = 0.3 ([compound]/[polynucleotide]) of 1M at pH 7.0 (buffer sodium cacodylate, I = 0.05 M), (b) first derivative of the absorbance vs. temperature; Figure S19: (a) Melting curve of pApU upon addition r = 0.2 and r = 0.3 ([compound]/[polynucleotide]) of 1M at pH 7.0 (buffer sodium cacodylate, I = 0.05 M), (b) first derivative of the absorbance vs. temperature; Figure S20: (a) Melting curve of ctDNA upon addition r = 0.2 and r = 0.3 ([compound]/[polynucleotide]) of 2M at pH 7.0 (buffer sodium cacodylate, I = 0.05 M), (b) first derivative of the absorbance vs. temperature; Figure S21: (a) Melting curve of p(dAdT)2 upon addition r = 0.2 and r = 0.3 ([compound]/[polynucleotide]) of 2M at pH 7.0 (buffer sodium cacodylate, I = 0.05 M), (b) first derivative of the absorbance vs. temperature; Figure S22: (a) Melting curve of pApU upon addition r = 0.2 and r = 0.3 ([compound]/[polynucleotide]) of 2M at pH 7.0 (buffer sodium cacodylate, I = 0.05 M), (b) first derivative of the absorbance vs. temperature; Figure S23: CD titration of poly dGdC - poly dGdC (c = 2 × 10⁻⁵ M) with 1M at molar ratios r = [compound]/[polynucleotide] (pH 7.0, buffer sodium cacodylate, I = 0.05 M); Figure S24: CD titration of ct-DNA, (c = 2 × 10⁻⁵ M) with (a) 1 (b) 2, at molar ratios r[compound]/[DNA] = 0.1–0.3. Done at pH 5.0, buffer sodium cacodylate, I = 0.05 M; Figure S25: Cell survival of A549 cells exposed to compound 2. Data from 4 replicates are presented as mean ± SD, relative to the control samples. Control samples are cells treated with DMSO at the same concentration as the tested compound. Representative data from three independent experiments, which yielded similar results, are shown; Table S1: Groove widths and depths for selected nucleic acid conformations. References [63,64] are cited in the Supplementary Materials.

Author Contributions

Investigation, M.K., I.P. (Isabela Pehar), K.B., G.K.K., I.I.P., M.P.; methodology, data curation, S.S. and K.M.-B.; conceptualization, validation, writing—review and editing, T.B.M.; conceptualization, validation, data curation, supervision, funding acquisition, D.M.; conceptualization, supervision, funding acquisition, writing—original draft preparation, I.P. (Ivo Piantanida) All authors have read and agreed to the published version of the manuscript.

Funding

The financial support of the Croatian Science Foundation projects IP-2018-01-5475 and HRZZ-IP-2019-04-6048 and the Julius-Maximilians-Universität Würzburg are gratefully acknowledged.

Institutional Review Board Statement

Not applicable.

Informed Consent Statement

Not applicable.

Data Availability Statement

Not applicable.

Conflicts of Interest

The funders had no role in the design of the study; in the collection, analyses, or interpretation of data; in the writing of the manuscript; or in the decision to publish the results.

References

  1. Aerssens, D.; Cadoni, E.; Tack, L.; Madder, A. Photosensitized Singlet Oxygen (1O2) Toolbox for Bio-Organic Applications: Tailoring 1O2 Generation for DNA and Protein Labelling, Targeting and Biosensing. Molecules 2022, 27, 778. [Google Scholar] [CrossRef] [PubMed]
  2. Dolmans, D.E.; Fukumura, D.; Jain, R.K. Photodynamic therapy for cancer. Nat. Rev. Cancer 2003, 3, 380–387. [Google Scholar] [CrossRef] [PubMed]
  3. Danielson, B.G. Structure, chemistry, and pharmacokinetics of intravenous iron agents. J. Am. Soc. Nephrol. 2004, 15, S93–S98. [Google Scholar] [PubMed]
  4. Chisholm, D.R.; Lamb, R.; Pallett, T.; Affleck, V.; Holden, C.; Marrison, J.; O’Toole, P.; Ashton, P.D.; Newling, K.; Steffen, A.; et al. Photoactivated cell-killing involving a low molecular weight, donor-acceptor diphenylacetylene. Chem. Sci. 2019, 10, 4673–4683. [Google Scholar] [CrossRef] [PubMed] [Green Version]
  5. Abrahamse, H.; Hamblin, M.R. New photosensitizers for photodynamic therapy. Biochem. J. 2016, 473, 347–364. [Google Scholar] [CrossRef] [PubMed] [Green Version]
  6. Banik, B.K.; Becker, F.F. Synthesis, electrophilic substitution and structure-activity relationship studies of polycyclic aromatic compounds towards the development of anticancer agents. Curr. Med. Chem. 2001, 8, 1513–1533. [Google Scholar] [CrossRef]
  7. Kanamori, T.; Matsuyama, A.; Naito, H.; Tsuga, Y.; Ozako, Y.; Ogura, S.; Okazaki, S.; Yuasa, H. Water-Soluble Glucosyl Pyrene Photosensitizers: An Intramolecularly Synthesized 2-C-Glucoside and an O-Glucoside. J. Org. Chem. 2018, 83, 13765–13775. [Google Scholar] [CrossRef]
  8. Chowdhury, N.; Dutta, S.; Dasgupta, S.; Singh, N.D.P.; Baidya, M.; Ghosh, S.K. Synthesis, photophysical, photochemical, DNA cleavage/binding and cytotoxic properties of pyrene oxime ester conjugates. Photochem. Photobiol. Sci. 2012, 11, 1239–1250. [Google Scholar] [CrossRef]
  9. Ma, J.-K.; Fathy, W.; Eldin, S.; Rizk El-Ghareeb, W.; Elhelaly, A.E.; Khedr, M.H.E.; Li, X.; Huang, X.-C. Effects of Pyrene on Human Liver HepG2 Cells: Cytotoxicity, Oxidative Stress and Transcriptomic Changes in Xenobiotic Metabolizing Enzymes and Inflammatory Markers with Protection Trial Using Lycopene. BioMed Res. Int. 2019, 2019, 7604851. [Google Scholar] [CrossRef] [Green Version]
  10. Østergaard, M.E.; Hrdlicka, P.J. Pyrene-functionalized oligonucleotides and locked nucleic acids (LNAs): Tools for fundamental research, diagnostics, and nanotechnology. Chem. Soc. Rev. 2011, 40, 5771–5788. [Google Scholar] [CrossRef]
  11. Wu, C.; Wang, C.; Yan, L.; Yang, C.J. Pyrene excimer nucleic acid probes for bimolecule signaling. J. Biomed. Nanotechnol. 2009, 5, 495–504. [Google Scholar] [CrossRef] [PubMed]
  12. Christensen, U.B.; Pedersen, E.B. Intercalating nucleic acids containing insertions of 1-O-(1-pyrenylmethyl)glycerol: Stabilisation of dsDNA and discrimination of DNA over RNA. Nucleic Acids Res. 2002, 30, 4918–4925. [Google Scholar] [CrossRef] [PubMed]
  13. Filichev, V.V.; Pedersen, E.B. Intercalating nucleic acids (INAs) with insertion of N-(pyren-1-ylmethyl)-(3R,4R)-4-(hydroxymethyl)pyrrolidin-3-ol. DNA (RNA) duplex and DNA three-way junction stabilities. Org. Biomol. Chem. 2003, 1, 100–103. [Google Scholar] [CrossRef] [PubMed]
  14. Gröger, K.; Baretić, D.; Piantanida, I.; Marjanović, M.; Kralj, M.; Grabar, M.; Tomić, S.; Schmuck, C. Guanidiniocarbonyl-pyrrole-aryl conjugates as nucleic acid sensors: Switch of binding mode and spectroscopic responses by introducing additional binding sites into the linker. Org. Biomol. Chem. 2011, 9, 198–209. [Google Scholar] [CrossRef]
  15. Astakhova, I.V.; Malakhov, A.D.; Stepanova, I.A.; Ustinov, A.V.; Bondarev, S.L.; Paramonov, A.S.; Korshun, V.A. 1-Phenylethynylpyrene (1-PEPy) as refined excimer forming alternative to pyrene: Case of DNA major groove excimer. Bioconj. Chem. 2007, 18, 1972–1980. [Google Scholar] [CrossRef] [PubMed]
  16. Hernandez-Folgado, L.; Schmuck, C.; Tomić, S.; Piantanida, I. A novel pyrene-guanidiniocarbonyl-pyrrole cation efficiently differentiates between ds-DNA and ds-RNA by two independent, sensitive spectroscopic methods. Bioorg. Med. Chem. Lett. 2008, 18, 2977–2981. [Google Scholar] [CrossRef]
  17. Hernandez-Folgado, L.; Baretić, D.; Piantanida, I.; Marjanović, M.; Kralj, M.; Rehm, T.; Schmuck, C. Guanidiniocarbonylpyrrole-Aryl Derivatives: Structure Tuning for Spectrophotometric Recognition of Specific DNA and RNA Sequences and for Antiproliferative Activity. Chem. Eur. J. 2010, 16, 3036–3056. [Google Scholar] [CrossRef] [Green Version]
  18. Wu, J.; Zou, Y.; Li, C.; Sicking, W.; Piantanida, I.; Yi, T.; Schmuck, C. A Molecular Peptide Beacon for the Ratiometric Sensing of Nucleic Acids. J. Am. Chem. Soc. 2012, 134, 1958–1961. [Google Scholar] [CrossRef]
  19. Ma, F.; Liu, W.-J.; Qianyi, Z.; Zhang, C.-Y. Sensitive detection of microRNAs by duplex specific nuclease-assisted target recycling and pyrene excimer switching. Chem. Commun. 2017, 53, 10596–10599. [Google Scholar] [CrossRef]
  20. Lakowicz, J.R. Principles of Fluorescence Spectroscopy, 3rd ed.; Springer: Boston MA, USA, 2006. [Google Scholar]
  21. Ayyavoo, K.; Velusamy, P. Pyrene based materials as fluorescent probes in chemical and biological fields. New J. Chem. 2021, 45, 10997–11017. [Google Scholar] [CrossRef]
  22. Wanninger-Weiß, C.; Wagenknecht, H.-A. Synthesis of 5-(2-Pyrenyl)-2′-deoxyuridine as a DNA Modification for Electron-Transfer Studies: The Critical Role of the Position of the Chromophore Attachment. Eur. J. Org. Chem. 2008, 2008, 64–71. [Google Scholar] [CrossRef]
  23. Mayer-Enthart, E.; Wagenknecht, H.-A. Structure-Sensitive and Self-Assembled Helical Pyrene Array Based on DNA Architecture. Angew. Chem. Int. Ed. 2006, 45, 3372–3375. [Google Scholar] [CrossRef] [PubMed]
  24. Wu, W.T.; Shao, X.D.; Zhao, J.Z.; Wu, M.B. Controllable Photodynamic Therapy Implemented by Regulating Singlet Oxygen Efficiency. Adv. Sci. 2017, 4, 1700113. [Google Scholar] [CrossRef] [PubMed]
  25. Bolze, F.; Jenni, S.; Sour, A.; Heitz, V. Molecular photosensitisers for two-photon photodynamic therapy. Chem. Commun. 2017, 30, 12857–12877. [Google Scholar] [CrossRef]
  26. Rumi, M.; Perry, J.W. Two-photon absorption: An overview of measurements and principles. Adv. Opt. Photonics 2010, 2, 451–518. [Google Scholar] [CrossRef]
  27. Yang, Y.; Wang, L.; Cao, H.Q.; Li, Q.; Li, Y.; Han, M.J.; Wang, H.; Li, J.B. Photodynamic Therapy with Liposomes Encapsulating Photosensitizers with Aggregation-Induced Emission. Nano Lett. 2019, 19, 1821–1826. [Google Scholar] [CrossRef]
  28. Sun, B.B.; Wang, L.; Li, Q.; He, P.P.; Liu, H.L.; Wang, H.; Yang, Y.; Li, J.B. Bis(pyrene)-Doped Cationic Dipeptide Nanoparticles for Two-Photon-Activated Photodynamic Therapy. Biomacromolecules 2017, 18, 3506–3513. [Google Scholar] [CrossRef]
  29. Zhang, Y.; Tan, L.; Shia, J.; Ji, L. Iridium-catalysed borylation of pyrene—A powerful route to novel optoelectronic materials. New J. Chem. 2021, 45, 14869–14878. [Google Scholar] [CrossRef]
  30. Coventry, D.N.; Batsanov, A.S.; Goeta, A.E.; Howard, J.A.; Marder, T.B.; Perutz, R.N. Selective Ir-Catalysed Borylation of Polycyclic Aromatic Hydrocarbons: Structures of Naphthalene-2,6-bis(boronate), Pyrene-2,7-bis(boronate) and Perylene-2,5,8,11-tetra(boronate) Esters. Chem. Commun. 2005, 41, 2172–2174. [Google Scholar] [CrossRef]
  31. Crawford, A.G.; Dwyer, A.D.; Liu, Z.; Steffen, A.; Beeby, A.; P˚alsson, L.-O.; Tozer, D.J.; Marder, T.B. Experimental and Theoretical Studies of the Photophysical Properties of 2- and 2,7-Functionalized Pyrene Derivatives. J. Am. Chem. Soc. 2011, 133, 13349–13362. [Google Scholar] [CrossRef]
  32. Crawford, A.G.; Liu, Z.; Mkhalid, I.A.I.; Thibault, M.-H.; Schwarz, N.; Alcaraz, G.; Steffen, A.; Collings, J.C.; Batsanov, A.S.; Howard, J.A.K.; et al. Synthesis of 2- and 2,7-Functionalized Pyrene Derivatives: An Application of Selective C–H Borylation. Chem. Eur. J. 2012, 18, 5022–5035. [Google Scholar] [CrossRef] [PubMed]
  33. Edkins, R.M.; Fucke, K.; Peach, M.J.G.; Crawford, A.G.; Marder, T.B.; Beeby, A. Synthesis, Structures and Comparison of the Photophysical Properties of Cyclometalated Iridium Complexes Containing the Isomeric 1- and 2-(2′-pyridyl)pyrene Ligands. Inorg. Chem. 2013, 52, 9842–9898. [Google Scholar] [CrossRef] [PubMed]
  34. Ji, L.; Edkins, R.M.; Lorbach, A.; Krummenacher, I.; Brückner, C.; Eichhorn, A.; Braunschweig, H.; Engels, B.; Low, P.J.; Marder, T.B. Electron Delocalization in Reduced Forms of 2-(BMes2)pyrene and 2,7-Bis(BMes2)pyrene. J. Am. Chem. Soc. 2015, 137, 6750–6753. [Google Scholar] [CrossRef]
  35. Ji, L.; Lorbach, A.; Edkins, R.M.; Marder, T.B. Synthesis and Photophysics of a 2,7-Disubstituted Donor-Acceptor Pyrene Derivative: An Example of the Application of Sequential Ir-Catalzyed C-H Borylation and Substitution Chemistry. J. Org. Chem. 2015, 80, 5658–5665. [Google Scholar] [CrossRef] [PubMed]
  36. Ji, L.; Fucke, K.; Bose, S.K.; Marder, T.B. Iridium-Catalyzed Borylation of Pyrene: Irreversibility and the Influence of Ligand on Selectivity. J. Org. Chem. 2015, 80, 661–665. [Google Scholar] [CrossRef] [PubMed] [Green Version]
  37. Merz, J.; Fink, J.; Friedrich, A.; Krummenacher, I.; Al Mamari, H.H.; Lorenzen, S.; Haehnel, M.; Eichhorn, A.; Moos, M.; Holzapfel, M.; et al. Pyrene MO Shuffle—Controlling Excited State and Redox Properties by Changing the Nature of the Frontier Orbitals. Chem. Eur. J. 2017, 23, 13164–13180. [Google Scholar] [CrossRef]
  38. Zahid, N.I.; Ji, L.; Khyasudeen, M.F.; Friedrich, A.; Hashim, R.; Marder, T.B.; Abou-Zied, O.K. Evidence of Increased Hydrophobicity and Dynamics inside the Tail Region of Glycolipid Self-Assemblies Using 2-n-Alkyl-Pyrene Derivatives to Probe Different Locations. Langmuir 2019, 35, 9584–9592. [Google Scholar] [CrossRef]
  39. Merz, J.; Dietz, M.; Vonhausen, Y.; Wöber, F.; Friedrich, A.; Sieh, D.; Krummenacher, I.; Braunschweig, H.; Moos, M.; Holzapfel, M.; et al. Synthesis, Photophysical and Electronic Properties of New Red to NIR Emitting Donor-Acceptor Pyrene Derivatives. Chem. Eur. J. 2020, 26, 438–453. [Google Scholar] [CrossRef] [PubMed]
  40. Merz, V.; Merz, J.; Kirchner, M.; Lenhart, J.; Marder, T.B.; Krueger, A. Pyrene-Based “Turn-Off” Probe with Broad Detection Range for Cu2+, Pb2+ and Hg2+ Ions. Chem. Eur. J. 2021, 27, 8118–8126. [Google Scholar] [CrossRef]
  41. Wawi, M.J.; Bijoux, A.; Inguimbert, N.; Mahler, C.; Wagner, S.; Marder, T.B.; Ribou, A.C. Peptide Vectors Carry Pyrene to Cell Organelles Allowing Real-time Quantification of Free Radicals in Mitochondria by Time-resolved Fluorescence Microscopy. ChemBioChem 2021, 22, 1676–1685. [Google Scholar] [CrossRef]
  42. Schmitt, H.-C.; Fischer, I.; Ji, L.; Merz, J.; Marder, T.B.; Hoche, J.; Röhr, M.I.S.; Mitric, R. Isolated 2-Hydroxypyrene and its Dimer: A Frequency- and Time-Resolved Spectroscopic Study. New J. Chem. 2021, 45, 14949–14956. [Google Scholar] [CrossRef]
  43. Wawi, M.J.; Mahler, C.; Inguimbert, N.; Marder, T.B.; Ribou, A.-C. A new mitochondrial probe combining pyrene and a triphenylphosphonium salt for cellular oxygen and free radical detection via fluorescence lifetime measurements. Free Radic. Res. 2022, 56, 258–272. [Google Scholar] [CrossRef] [PubMed]
  44. Ji, L.; Riese, S.; Schmiedel, A.; Holzapfel, M.; Fest, M.; Nitsch, J.; Churchod, B.F.E.; Friedrich, A.; Wu, L.; Al Mamari, H.A.; et al. Thermodynamic Equilibrium Between Locally Excited and Charge-Transfer States through Thermally Activated Charge Transfer in 1-(Pyrene-2′-yl)-o-carborane. Chem. Sci. 2022, 13, 5205–5219. [Google Scholar] [CrossRef] [PubMed]
  45. Lu, Q.; Kole, G.K.; Friedrich, A.; Muller-Buschbaum, K.; Liu, Z.; Yu, X.; Marder, T.B. Comparison Study of the Site-Effect on Regioisomeric Pyridyl Pyrene Conjugates: Synthesis, Structures, and Photophysical Properties. J. Org. Chem. 2020, 85, 4256–4266. [Google Scholar] [CrossRef]
  46. Kole, G.K.; Merz, J.; Amar, A.; Fontaine, B.; Boucekkine, A.; Nitsch, J.; Lorenzen, S.; Friedrich, A.; Krummenacher, I.; Košćak, M.; et al. 2- and 2,7-Substituted para-N-Methylpyridinium Pyrenes: Syntheses, Molecular and Electronic Structures, Photophysical, Electrochemical, and Spectroelectrochemical Properties and Binding to Double-Stranded (ds) DNA. Eur. J. Chem. 2021, 27, 2837–2853. [Google Scholar] [CrossRef]
  47. Malojčić, G.; Piantanida, I.; Marinić, M.; Zinić, M.; Marjanović, M.; Kralj, M.; Pavelić, K.; Schneider, H.-J. A novel bis-phenanthridine triamine with pH controlled binding to nucleotides and nucleic acids. Org. Biomol. Chem. 2005, 3, 4373–4381. [Google Scholar] [CrossRef]
  48. Manallack, D.T.; Prankerd, R.J.; Yuriev, E.; Oprea, T.I.; Chalmers, D.K. The significance of acid/base properties in drug discovery. Chem. Soc. Rev. 2013, 42, 485–496. [Google Scholar] [CrossRef] [Green Version]
  49. Wong, P.; Lee, C.; Tannock, I.F. Reduction of intracellular pH as a strategy to enhance the pH-dependent cytotoxic effects of melphalan for human breast cancer cells. Clin. Cancer Res. 2005, 11, 3553–3557. [Google Scholar] [CrossRef] [Green Version]
  50. Gillies, R.J.; Robey, I.; Gatenby, R.A. Causes and consequences of increased glucose metabolism of cancers. J. Nucl. Med. 2008, 49, 24s–42s. [Google Scholar] [CrossRef] [Green Version]
  51. Wojtkowiak, J.W.; Verduzco, D.; Schramm, K.J.; Gillies, R.J. Drug Resistance and Cellular Adaptation to Tumor Acidic pH Microenvironment. Mol. Pharm. 2011, 8, 2032–2038. [Google Scholar] [CrossRef]
  52. Mergny, J.-L.; Lacroix, L. Analysis of Thermal Melting Curves. Oligonucleotides 2003, 13, 515–537. [Google Scholar] [CrossRef] [PubMed]
  53. Bolte, S.; Cordelieres, F.P. A guided tour into subcellular colocalization analysis in light microscopy. J. Microsc. 2006, 224, 213–232. [Google Scholar] [CrossRef] [PubMed]
  54. Piantanida, I.; Palm, B.S.; Zinic, M.; Schneider, H.J. A new 4,9-diazapyrenium intercalator for single- and double-stranded nucleic acids: Distinct differences from related diazapyrenium compounds and ethidium bromide. J. Chem. Soc. Perk. Trans. 2 2001, 9, 1808–1816. [Google Scholar] [CrossRef]
  55. Georghiou, S. Interaction of acridine drugs with DNA and nucleotides. Photochem. Photobiol. 1977, 26, 59–68. [Google Scholar] [CrossRef]
  56. Scatchard, G. The attractions of proteins for small molecules and ions. Ann. N. Y. Acad. Sci. 1949, 51, 660–672. [Google Scholar] [CrossRef]
  57. McGhee, J.D.; Hippel, P.H.V. Theoretical Aspects of DNA-Protein Interactions—Cooperative and Non-Cooperative Binding of Large Ligands to a One-Dimensional Homogeneous Lattice. J. Mol. Biol. 1974, 86, 469–489. [Google Scholar] [CrossRef]
  58. Eriksson, M.; Nordén, B. Linear and Circular Dichroism of Drug-Nucleic Acid Complexes. Meth. Enzymol. 2001, 340, 68–98. [Google Scholar]
  59. Šmidlehner, T.; Piantanida, I.; Pescitelli, G. Polarization spectroscopy methods in the determination of interactions of small molecules with nucleic acids—Tutorial. Beil. J. Org. Chem. 2018, 14, 84–105. [Google Scholar] [CrossRef]
  60. Sun, Y.; Shi, Z.; Lin, Y.; Zhang, M.; Liu, J.; Zhu, L.; Chen, Q.; Bi, J.; Li, S.; Ni, Z.; et al. Benzo(a)pyrene induces MUC5AC expression through the AhR/mitochondrial ROS/ERK pathway in airway epithelial cells. Ecotoxicol. Environ. Saf. 2021, 210, 111857. [Google Scholar] [CrossRef]
  61. Kang, R.-R.; Sun, Q.; Chen, K.-G.; Cao, Q.-T.; Liu, C.; Liu, K.; Ma, Z.; Deng, Y.; Liu, W.; Xu, B. Resveratrol prevents benzo(a)pyrene-induced disruption of mitochondrial homeostasis via the AMPK signaling pathway in primary cultured neurons. Environ. Pollut. 2020, 261, 114207. [Google Scholar] [CrossRef]
  62. Mukherjee, S.; Das Sarma, J.; Shunmugam, R. pH-Sensitive Nanoaggregates for Site-Specific Drug-Delivery as Well as Cancer Cell Imaging. ACS Omega 2016, 1, 755–764. [Google Scholar] [CrossRef] [PubMed]
  63. Saenger, W. Principles of Nucleic Acid Structure; Springer: New York, NY, USA, 1983. [Google Scholar]
  64. Cantor, C.R.; Schimmel, P.R. Biophysical Chemistry. WH Freeman Co. 1980, 3, 1109–1181. [Google Scholar]
Scheme 1. Structures of the compounds studied herein; note a permanent positive charge of 1M and 2M and protonation sites of 1 and 2, allowing pH-control of positive charge.
Pharmaceutics 14 02499 sch001
Figure 1. (a) Dependence of the UV/vis spectrum on pH (c(1 or 2) = 2.0 × 10⁻⁵ M) of (a) 1 (pKa~5); (b) 2 (pKa < 4). Dependence of the fluorescence spectrum on pH (c(1 or 2) = 1.0 × 10⁻⁶ M) of (c) 1exc = 340 nm); (d) 2exc = 332 nm). Performed in water by adjusting pH to 3 with HCl and subsequent additions of NaOH solution, simultaneously measuring pH and collecting UV/vis spectra.
Pharmaceutics 14 02499 g001
Figure 2. Changes at UV/vis maxima of (a) 1M and (b) 2M (c (dye) = 5 × 10⁻⁶ M) upon addition of polynucleotides; the Y-axis was normalised to starting absorbance value of a free dye. Changes at fluorescence maxima of (c) 1M and (d) 2M (c (dye) = 5 × 10⁻⁸ M) upon addition of polynucleotides. All titrations were conducted at pH 7.0, sodium cacodylate buffer, I = 50 mM.
Pharmaceutics 14 02499 g002
Figure 3. Changes in the fluorescence spectrum of 2 (c = 5 × 10⁻⁷ M, λexc = 319 nm, pH 5.0, sodium cacodylate buffer, I = 0.05 M) upon titration with (a) ct-DNA; (b) BSA.
Pharmaceutics 14 02499 g003
Figure 4. CD titration of (a) poly dAdT-poly dAdT, (b) pApU (c = 2 × 10⁻⁵ M) with 1M at molar ratios r = [compound]/[polynucleotide] (pH 7.0, sodium cacodylate buffer, I = 0.05 M).
Pharmaceutics 14 02499 g004
Figure 5. CD titration of (a) p(dAdT)2, (b) poly A–poly U, (c) p(dGdC)2 (c = 2 × 10⁻⁵ M) with 2M at molar ratios r = [compound]/[polynucleotide] (pH 7.0, sodium cacodylate buffer, I = 0.05 M).
Pharmaceutics 14 02499 g005
Figure 6. Representative agarose gel of pUC19 plasmid DNA incubated with 2M, 1, or 1M, with or without exposure to UV light (15 or 45 s). M–GelPilot DNA Molecular Weight Marker 1kb. Representative data from two independent experiments that yielded similar results are shown.
Pharmaceutics 14 02499 g006
Figure 7. Cell toxicity of 1, 1M, and 2M in A549 and WI-38 cell lines, with or without exposure to UV light. Data are presented as a fold of control cell treated with an amount of DMSO corresponding to an added aliquot of dye DMSO stock solution (<0.1% DMSO in medium), with ± SD resulting from the four replicates. Representative data from two independent experiments which yielded similar results are shown, with good statistical significance values p < 0.05.
Pharmaceutics 14 02499 g007
Figure 8. The amount of ROS in A549 cells treated with 10 µM 2M, 1, or 1M, with or without UV light irradiation. Levels of ROS were assessed by measuring the fluorescence intensity of a DCF stain by flow cytometry. The black line represents control cells, i.e., cells treated with DMSO. Coloured lines represent cells treated with 2M, 1, or 1M, respectively. Representative data from two independent experiments are shown, both yielding similar results.
Pharmaceutics 14 02499 g008
Figure 9. Confocal time-lapse imaging of A549 cells treated with 2M or 1M (1 µM) and irradiated at maximum diode power at λexc = 350 nm, monitored by bright field and fluorescence (λem = 420–500 nm) during 6 min. Note severe blebbing in the cells and complete disintegration after only 3 min irradiation, while non-treated cells did not change.
Pharmaceutics 14 02499 g009
Figure 10. Exposing A549 cells treated with 10 µM 2M, 1, or 1M to UV light induces changes in cell morphology. Cell size (FSC) and complexity (SSC) were assessed by flow cytometry. Representative data from two independent experiments are shown, both yielding similar results.
Pharmaceutics 14 02499 g010
Figure 11. (A) Colocalisation of 2M, 1, and 1M (blue, λexc = 350 nm; λem = 420–500 nm) with LAMP1 (magenta) observed by confocal microscopy. Cells were treated with 10 µM of the respective compound for 90 min at 37 °C, fixed with PFA, and subsequently stained with anti LAMP1 antibody. (B) Colocalisation of 2M, 1, and 1M (blue) with GM130 (magenta) was observed by confocal microscopy. Cells were treated with 10 µM of the respective compound for 90 min at 37 °C, fixed with PFA, and subsequently stained with anti GM130 antibody. Colocalisation is assessed by the Pearson correlation coefficient. Analysis was conducted using ImageJ software and the appropriate JACoP plugin [53].
Pharmaceutics 14 02499 g011
Figure 12. Colocalisation of 2M, 1, and 1M (blue, λexc = 350 nm; λem = 420–500 nm) with MitoTracker® (Deep Red) observed by confocal microscopy. Cells were treated with 10 µM of the compound for 90 min at 37 °C and incubated with 100 nM MitoTracker® for 20 min at 37 °C. Collocalisation is assessed by Pearson’s coefficient. Analysis was conducted using ImageJ software and the appropriate JACoP plugin [53].
Pharmaceutics 14 02499 g012
Figure 13. A combination of 1µM 1M and UV light irradiation increases mtROS in A549 cells. The experiments were performed at least three times and representative data are shown. p < 0.05, 1M+UV irradiation vs. DMSO and 1M. Results are presented as mean ± SD.
Pharmaceutics 14 02499 g013
Table 1. Thermal denaturation experiments: ∆Tm-values a (°C) for different ratios b r of pyrene conjugates added to the polynucleotide. See Supplementary Information for additional data.
rct-DNAPoly dAdT-Poly dAdTpApU
1Md0.2c 283
0.3c 293
2Md0.2d >16314
0.3d >1633-
1e0.10--
0.32--
2e0.11.5--
a Error in ∆Tm-values ± 0.5 °C. b r = [compound]/[polynucleotide].c Published results [46]. d Conducted at pH 7.0, sodium cacodylate buffer, I = 50 mM. e Conducted at pH 5.0, sodium cacodylate buffer, I = 50 mM.
Table 2. Binding constants (a logKs) of 1, 2, 1M and 2M with ds-polynucleotides and BSA at pH = 7.0 or pH = 5.0, sodium cacodylate buffer, I = 0.05 M.
ct-DNABSAGC-DNAAU-RNAAT-DNA
1MpH 75.55.47.05.85.9
2MpH 78.86.99.18.57.1
1pH 7b5.5
5.5
---
pH 55.3
2pH 7b5.3
5.1
---
pH 55.7
a Processing of titration data by means of the Scatchard equation [56,57] gave values of ratio n[bound dye]/[polynucleotide] = 0.1 and 0.2. For easier comparison, all logKs values were re-calculated for fixed n = 0.2 or n = 0.3. Correlation coefficients were > 0.99 for all calculated Ks. b The changes were too small to allow an accurate calculation of the binding constant.
Publisher’s Note: MDPI stays neutral with regard to jurisdictional claims in published maps and institutional affiliations.

