

Determination of Metabolomics Profiling in BPA-Induced Impaired Metabolism
 ,
,  ,
,
Abstract
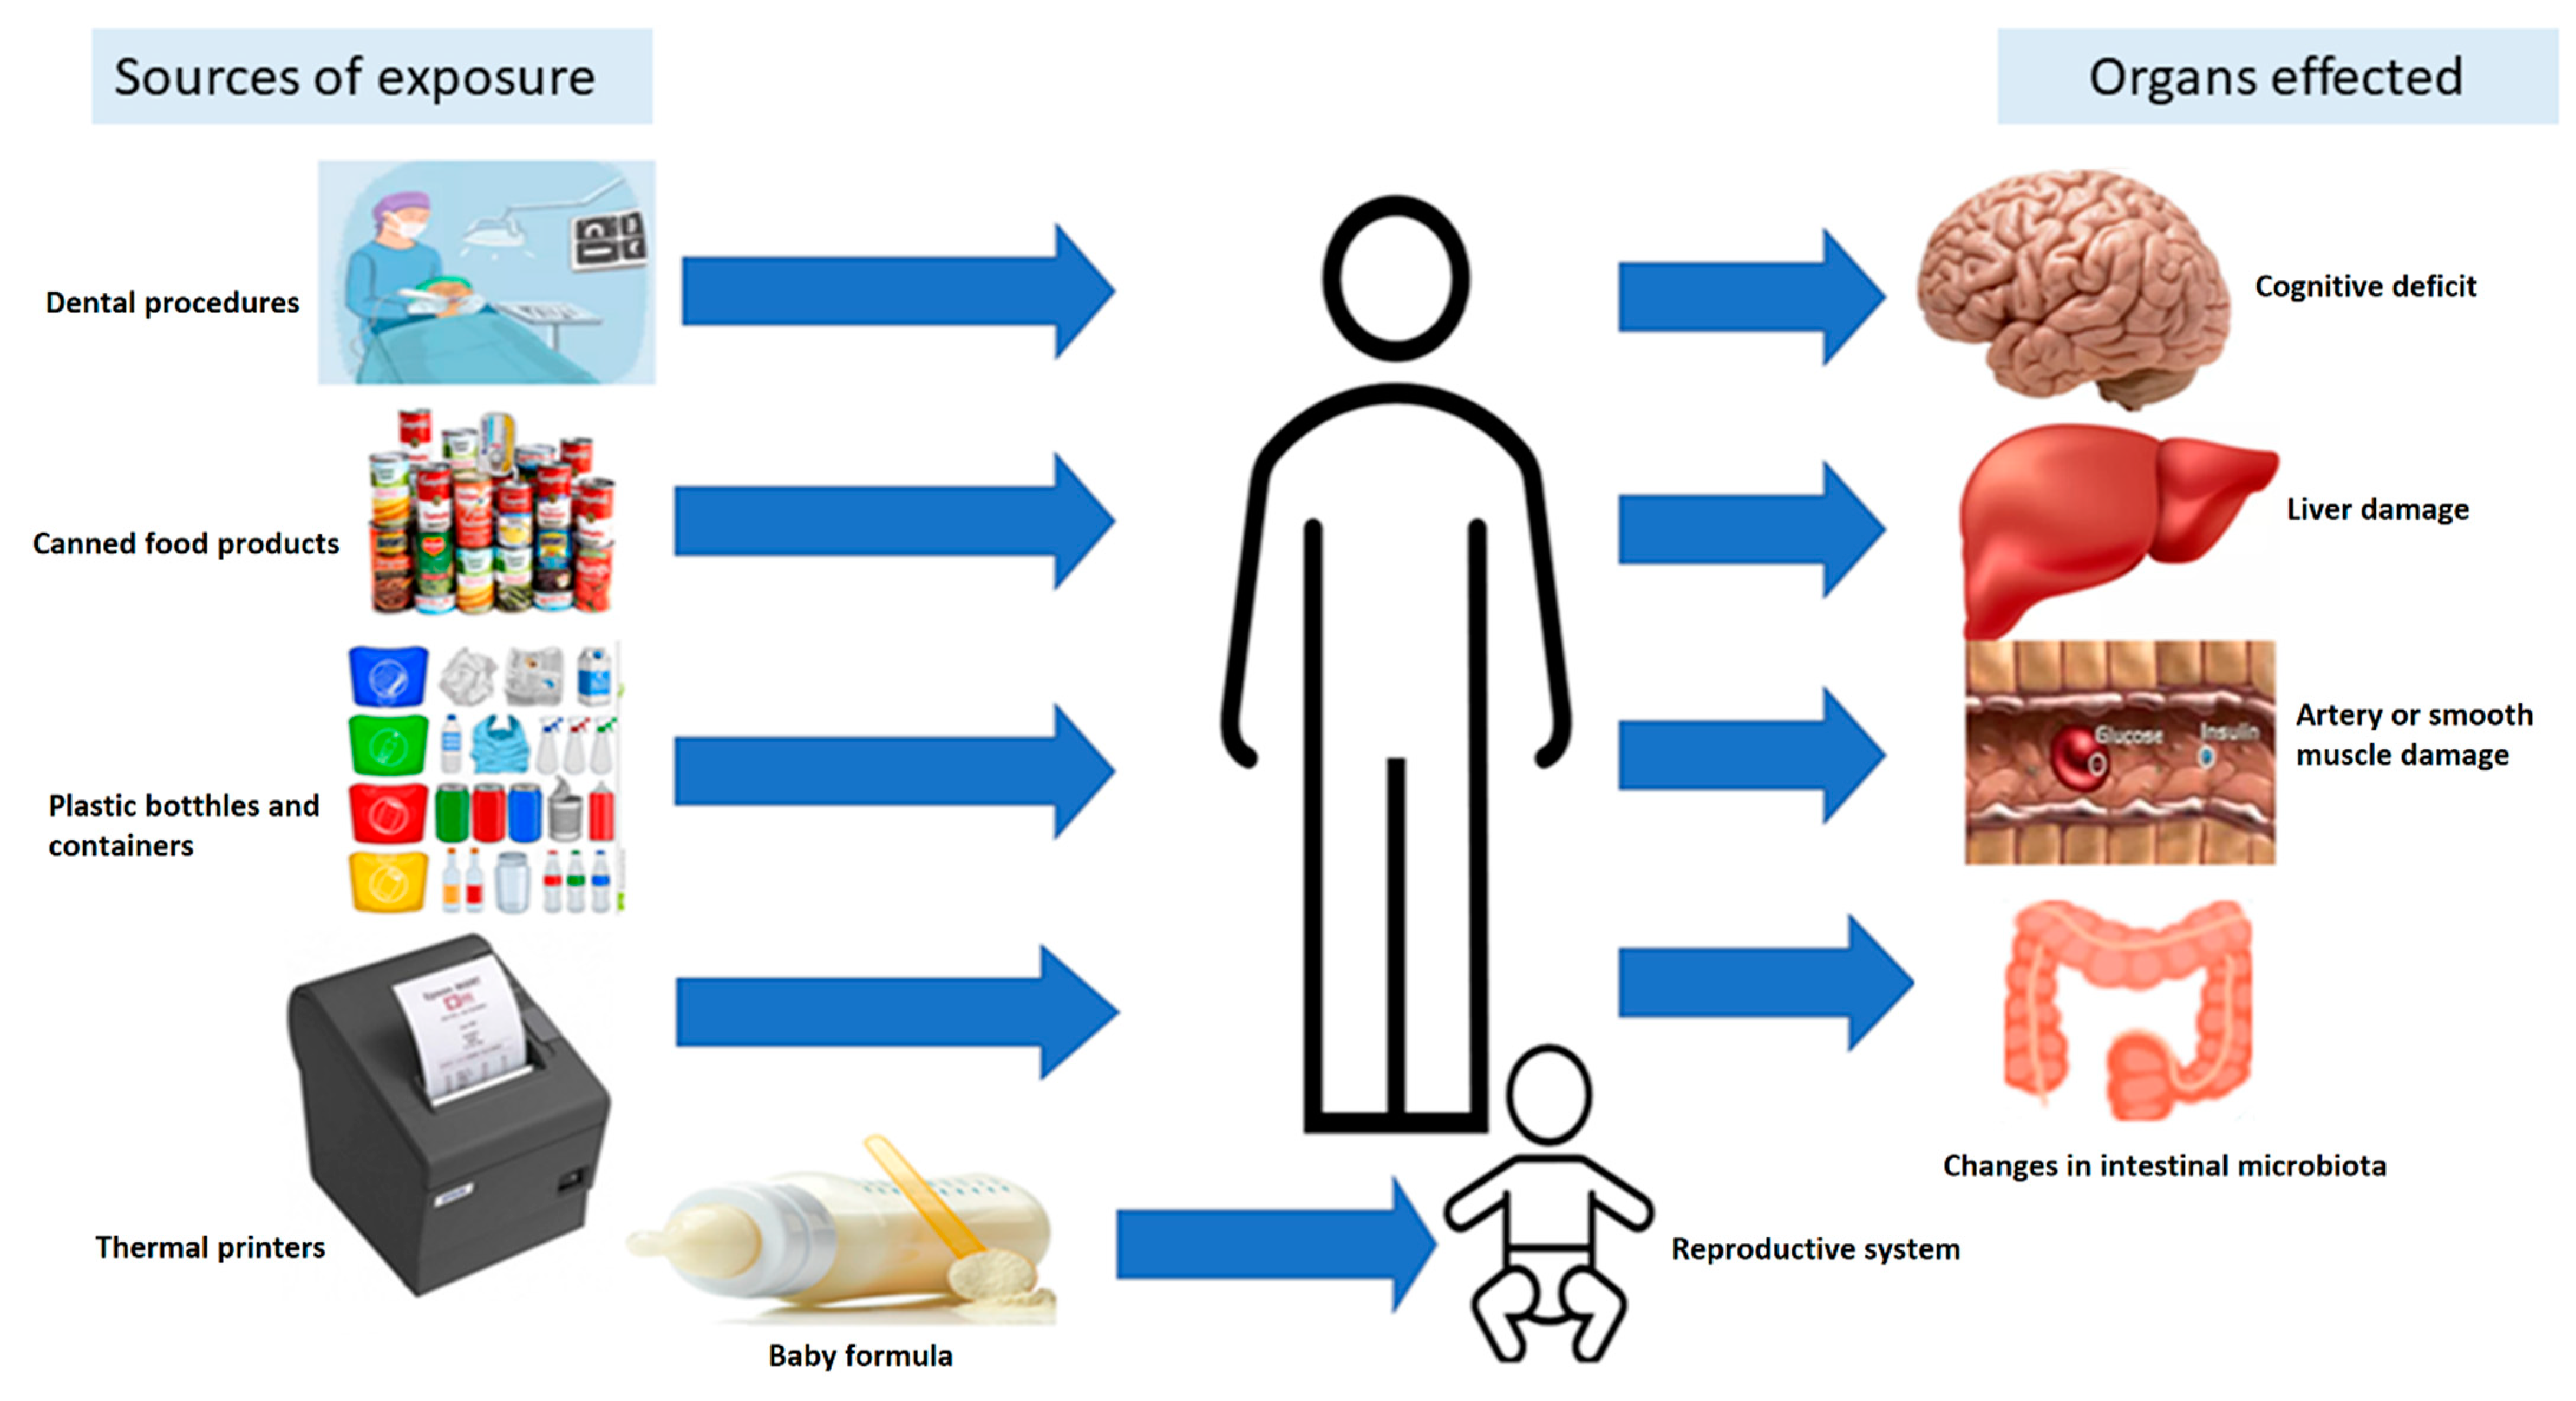
:1. Introduction
2. Materials and Methods
2.1. Preparation of BPA Solution
2.2. Preparation of Resveratrol Solution
2.3. Experimental Design
2.4. Dosing Schedule
2.5. Collection of Liver for Antioxidant Test and mRNA Expression of Genes
2.6. Estimation of Biomarkers of Oxidative Stress and Lipid Peroxidation
2.7. Gene Expression
2.8. Sample Preparation for the Analysis of Amino Acids
2.9. Sample Preparation for MS/MS Analysis
2.10. General Conditions for Sample Analysis by MS/MS
- Instrument: Linear Ion Trap Mass spectrometer model; LTQ XL (Thermo Electron Scientific, Waltham, MA, USA) equipped with electro spray ionization source [24].
- Solvent: Methanol.
- Mode of injection: Direct insertion method.
- Flow rate: 9.8 μL/min.
- Mode of ionization: Both negative and positive scan ion modes.
- Capillary voltage: 4.7 kV
- Capillary temperature: 278 °C
- Sheath gas flow rate: 17 units
- Auxiliary gas flow rate: 6 units
- Scanning mass range: 50–2000 m/z
- Fragmentation (MS/MS): Various peaks were selected for fragmentation, using collision-induced dissociation (CID) energy ranging from 20–30
- Software: Xcalibur 2.0.7
2.11. Statistical Analysis
3. Results
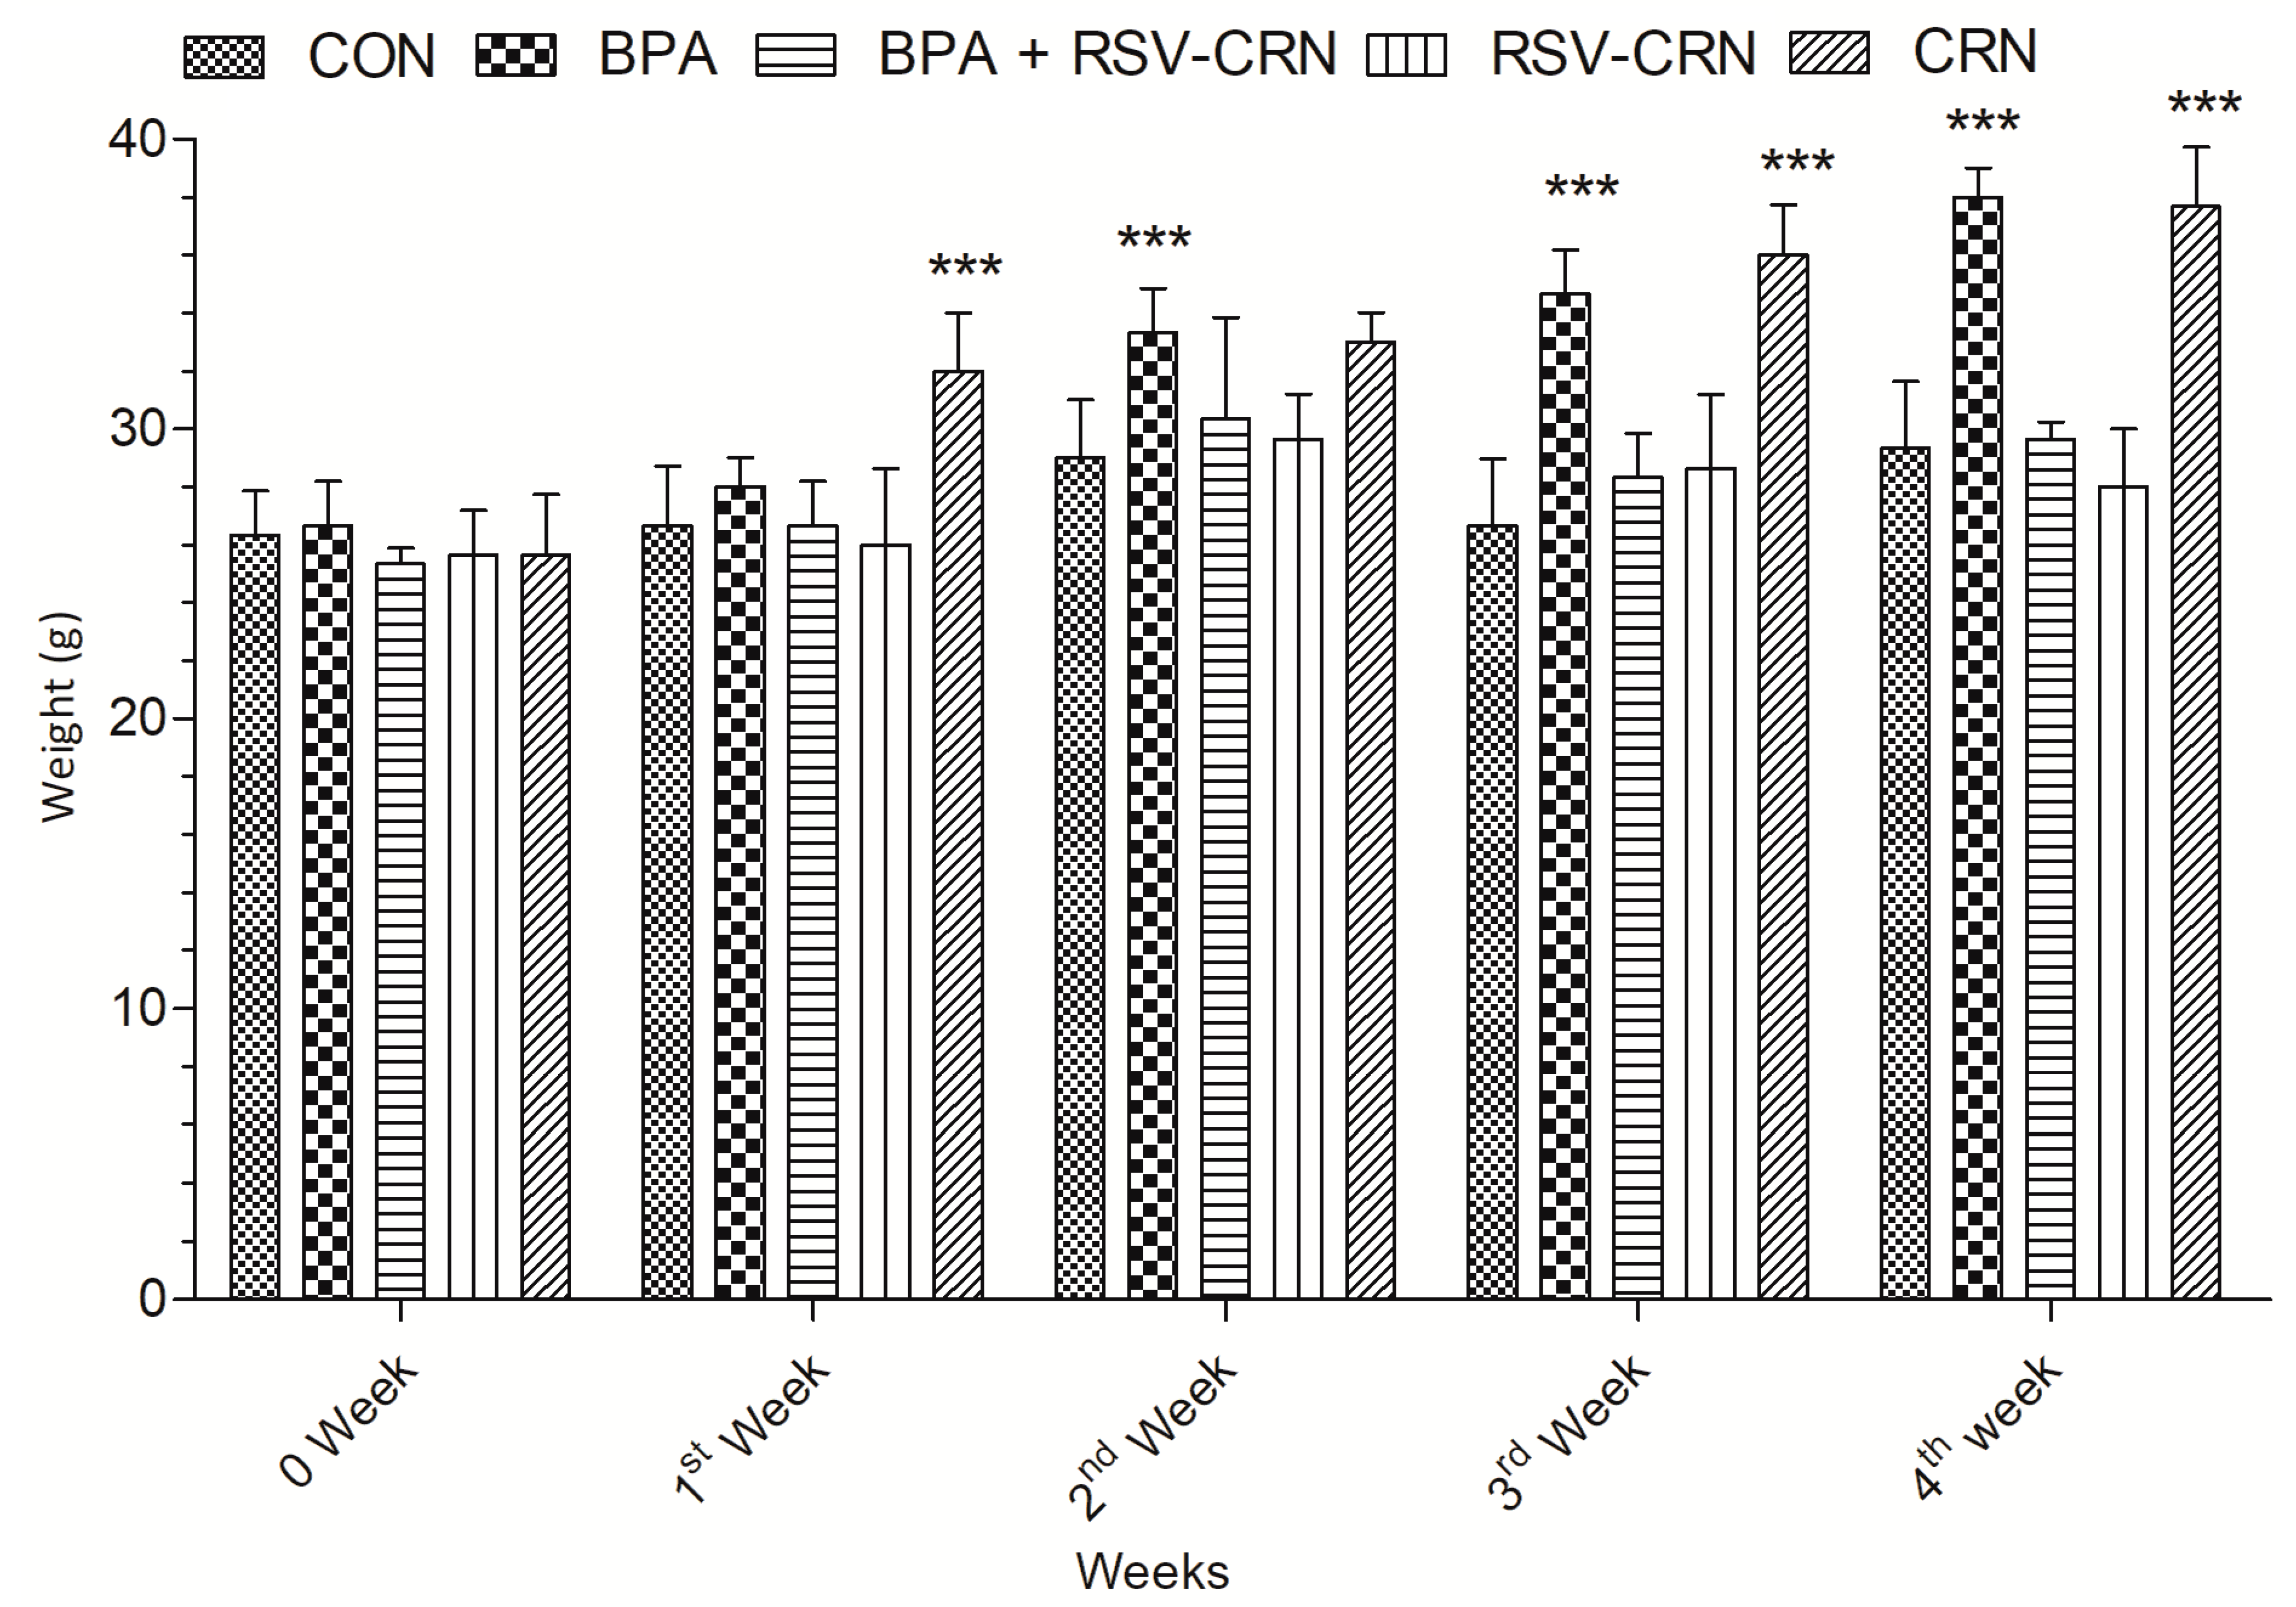
3.1. Effect on Body Weight
3.2. Determination of Lipid Peroxidation and Oxidative Stress Biomarkers
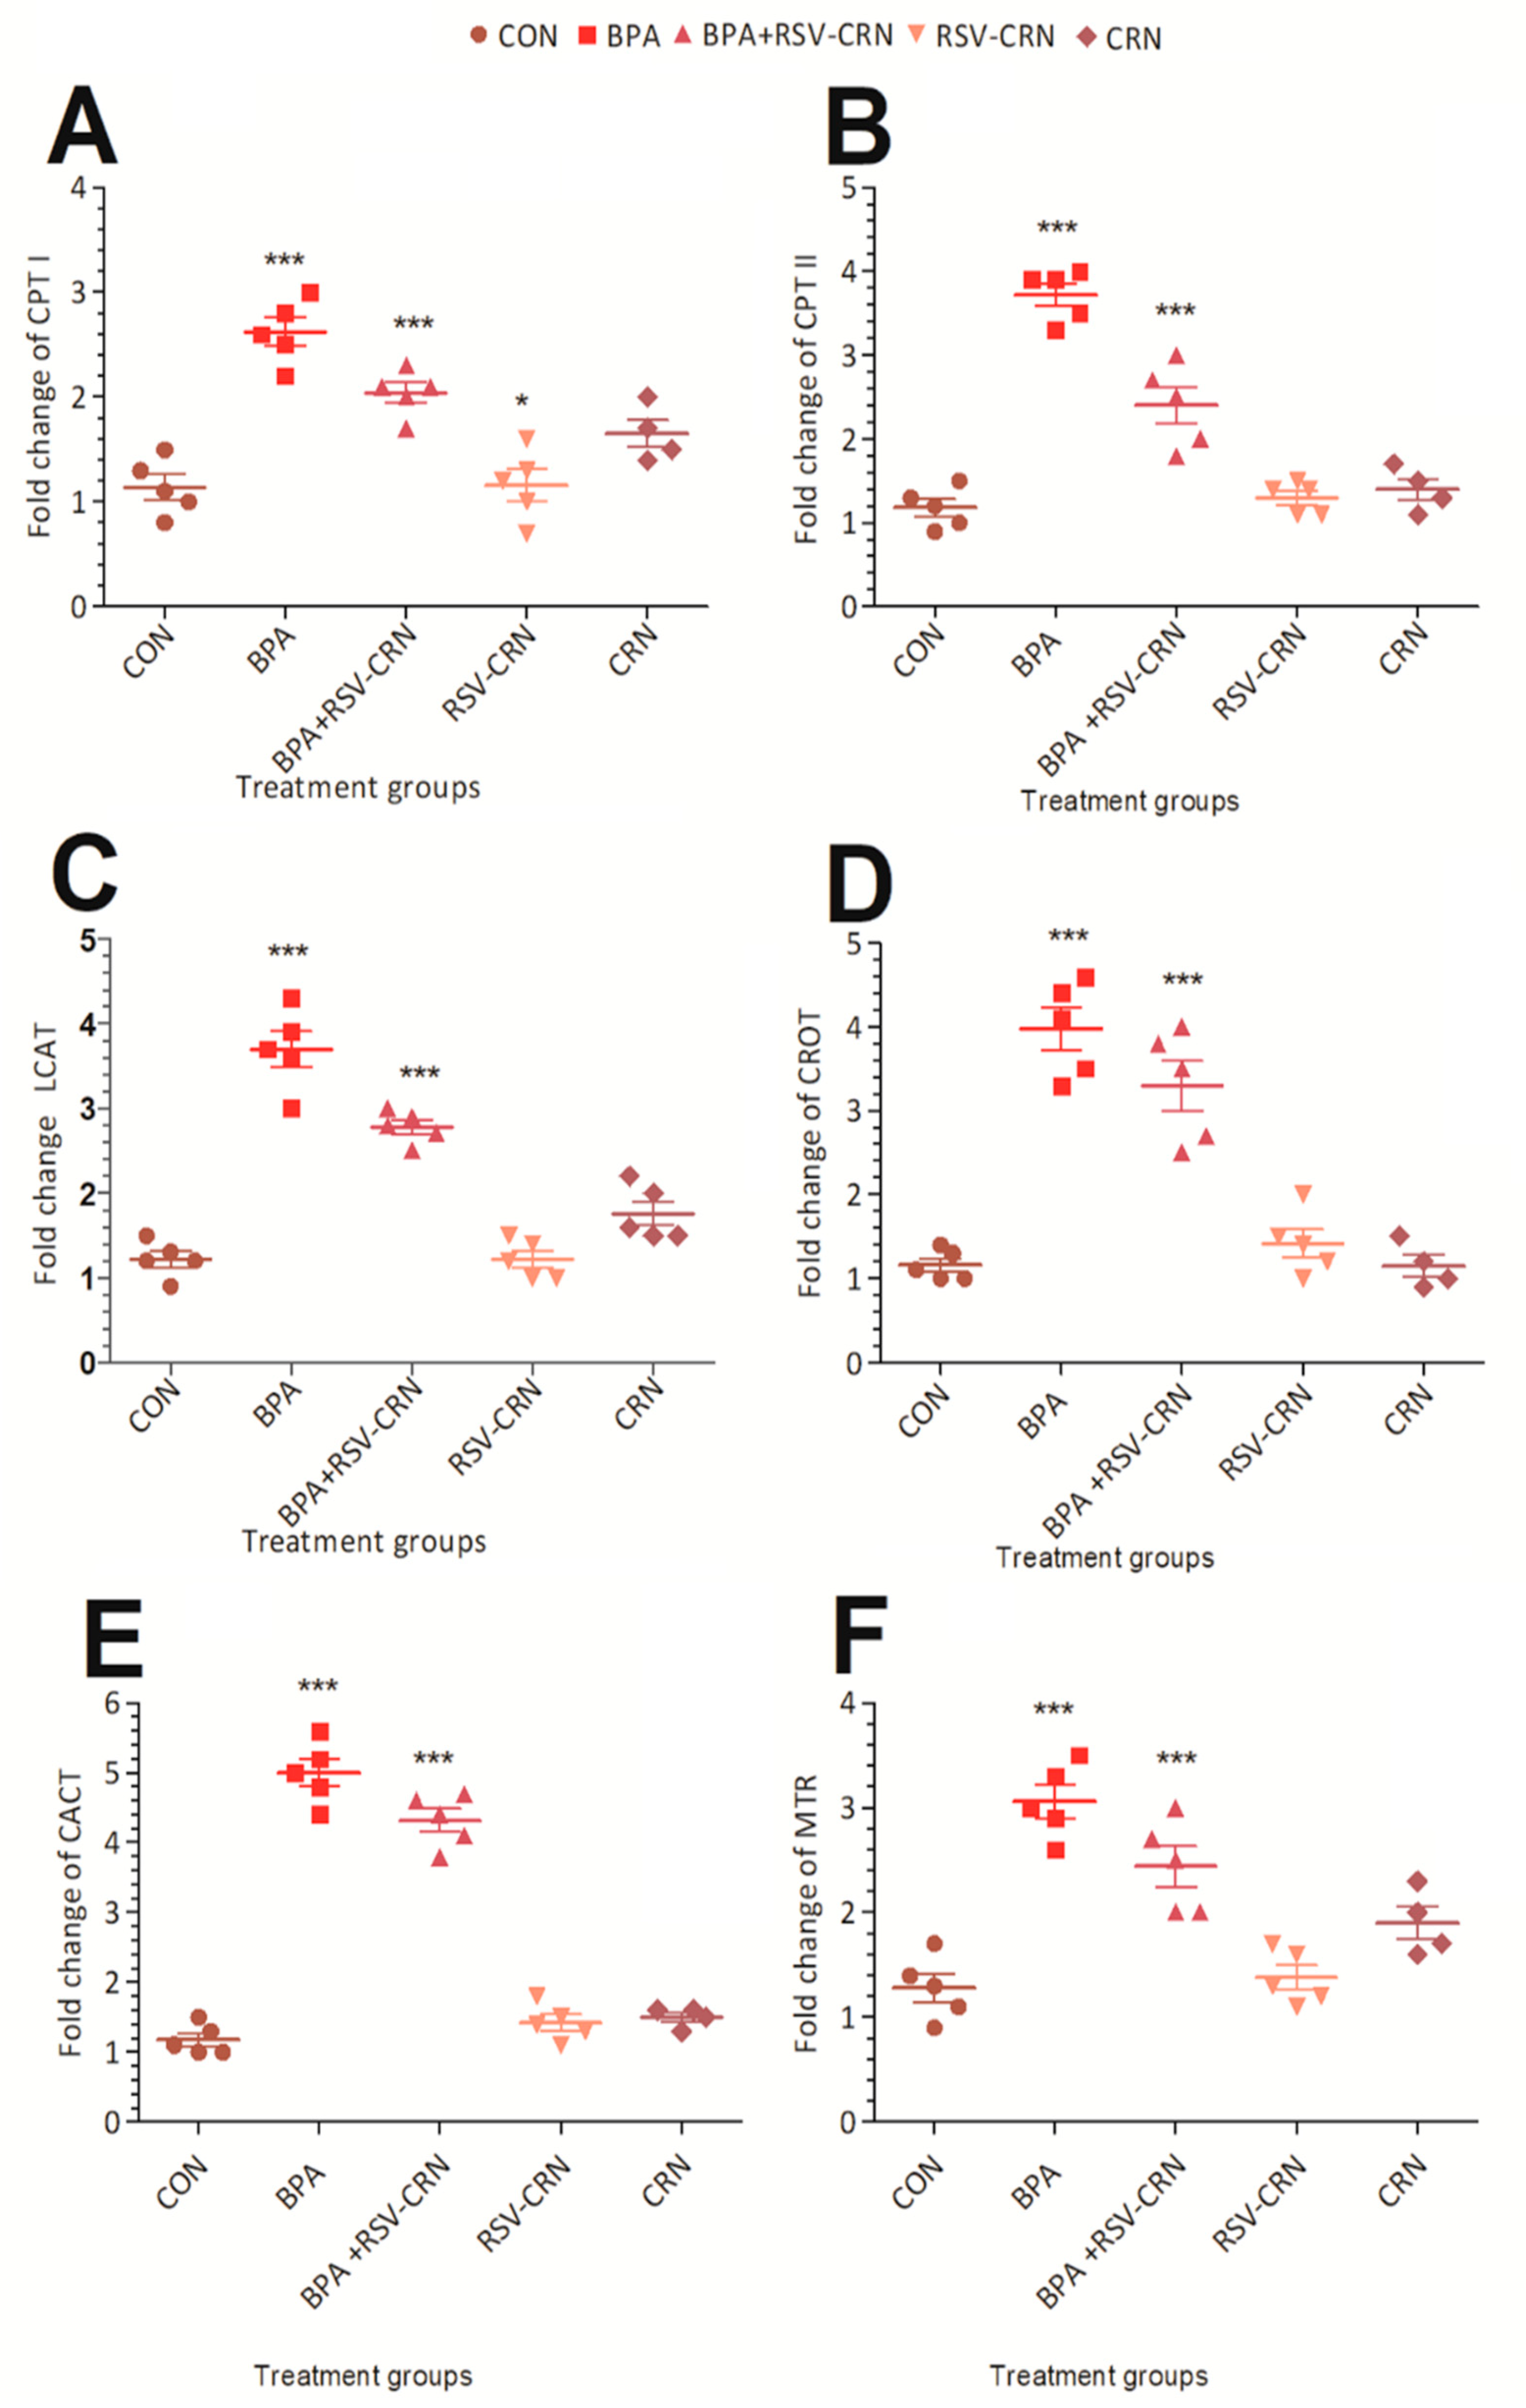
3.3. Effect of BPA on Gene Expression of Lipid Metabolism Related Genes
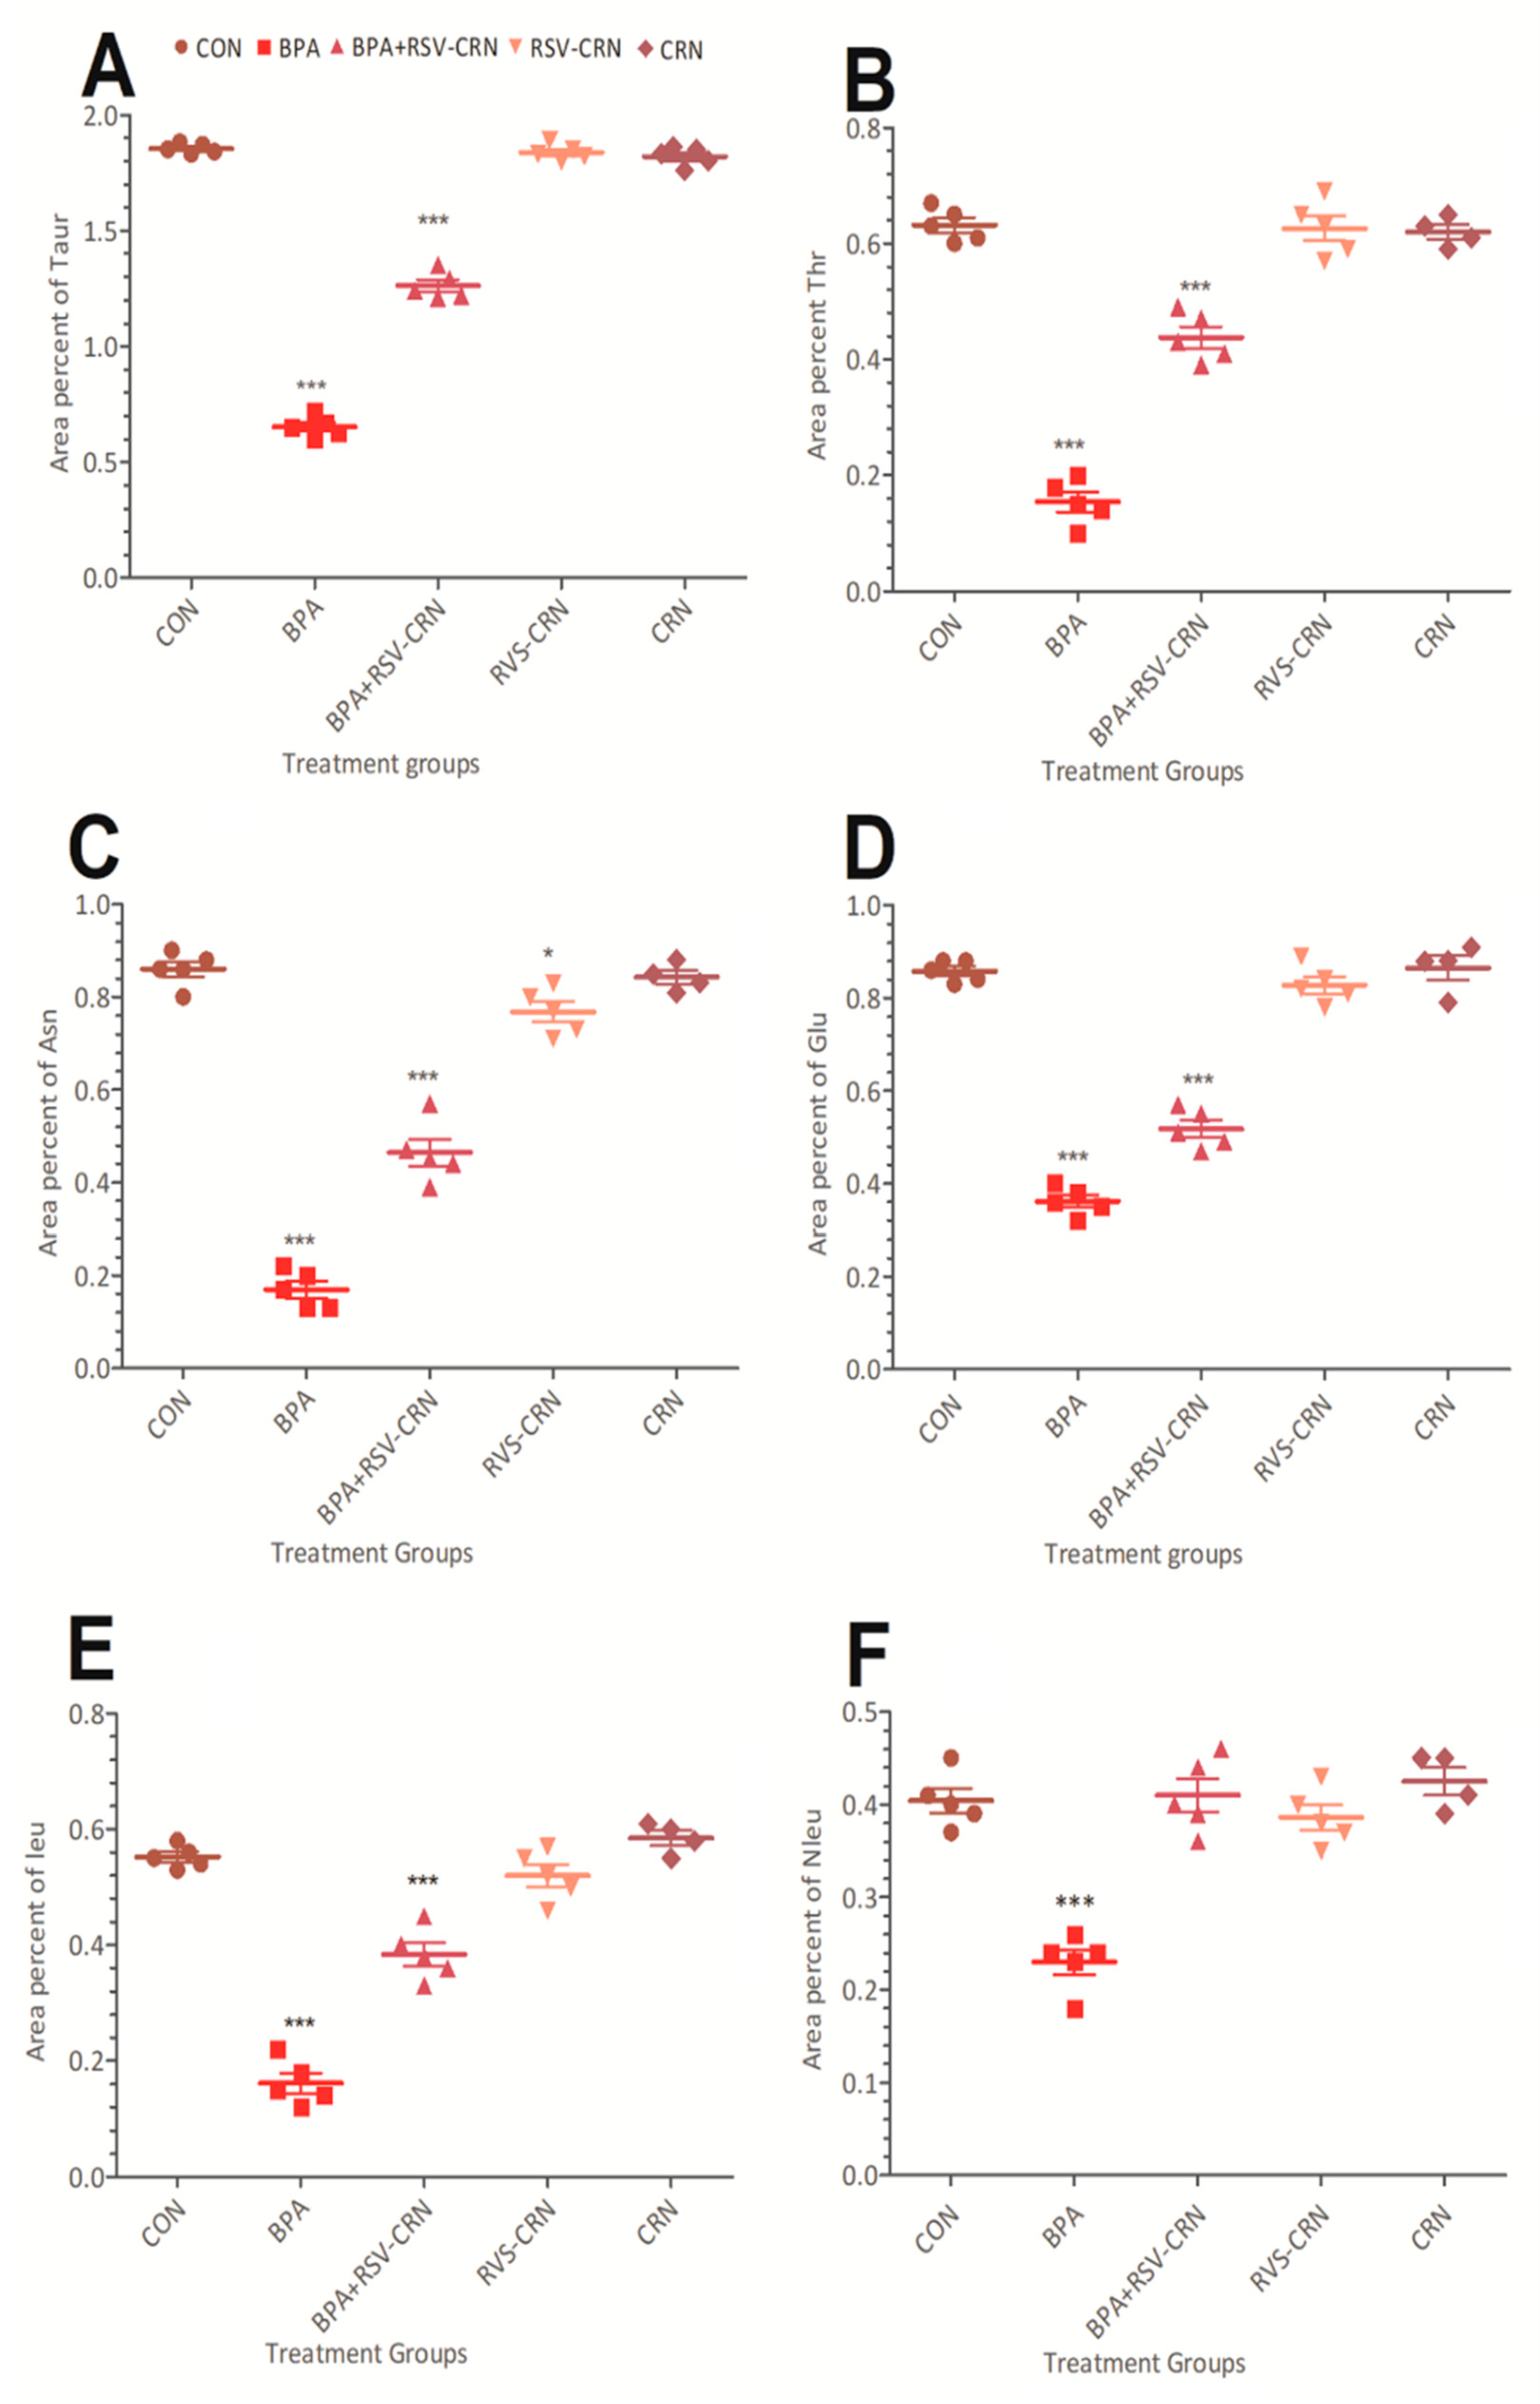
3.4. Detection and Quantification of Amino Acids
3.5. MS/MS Analysis
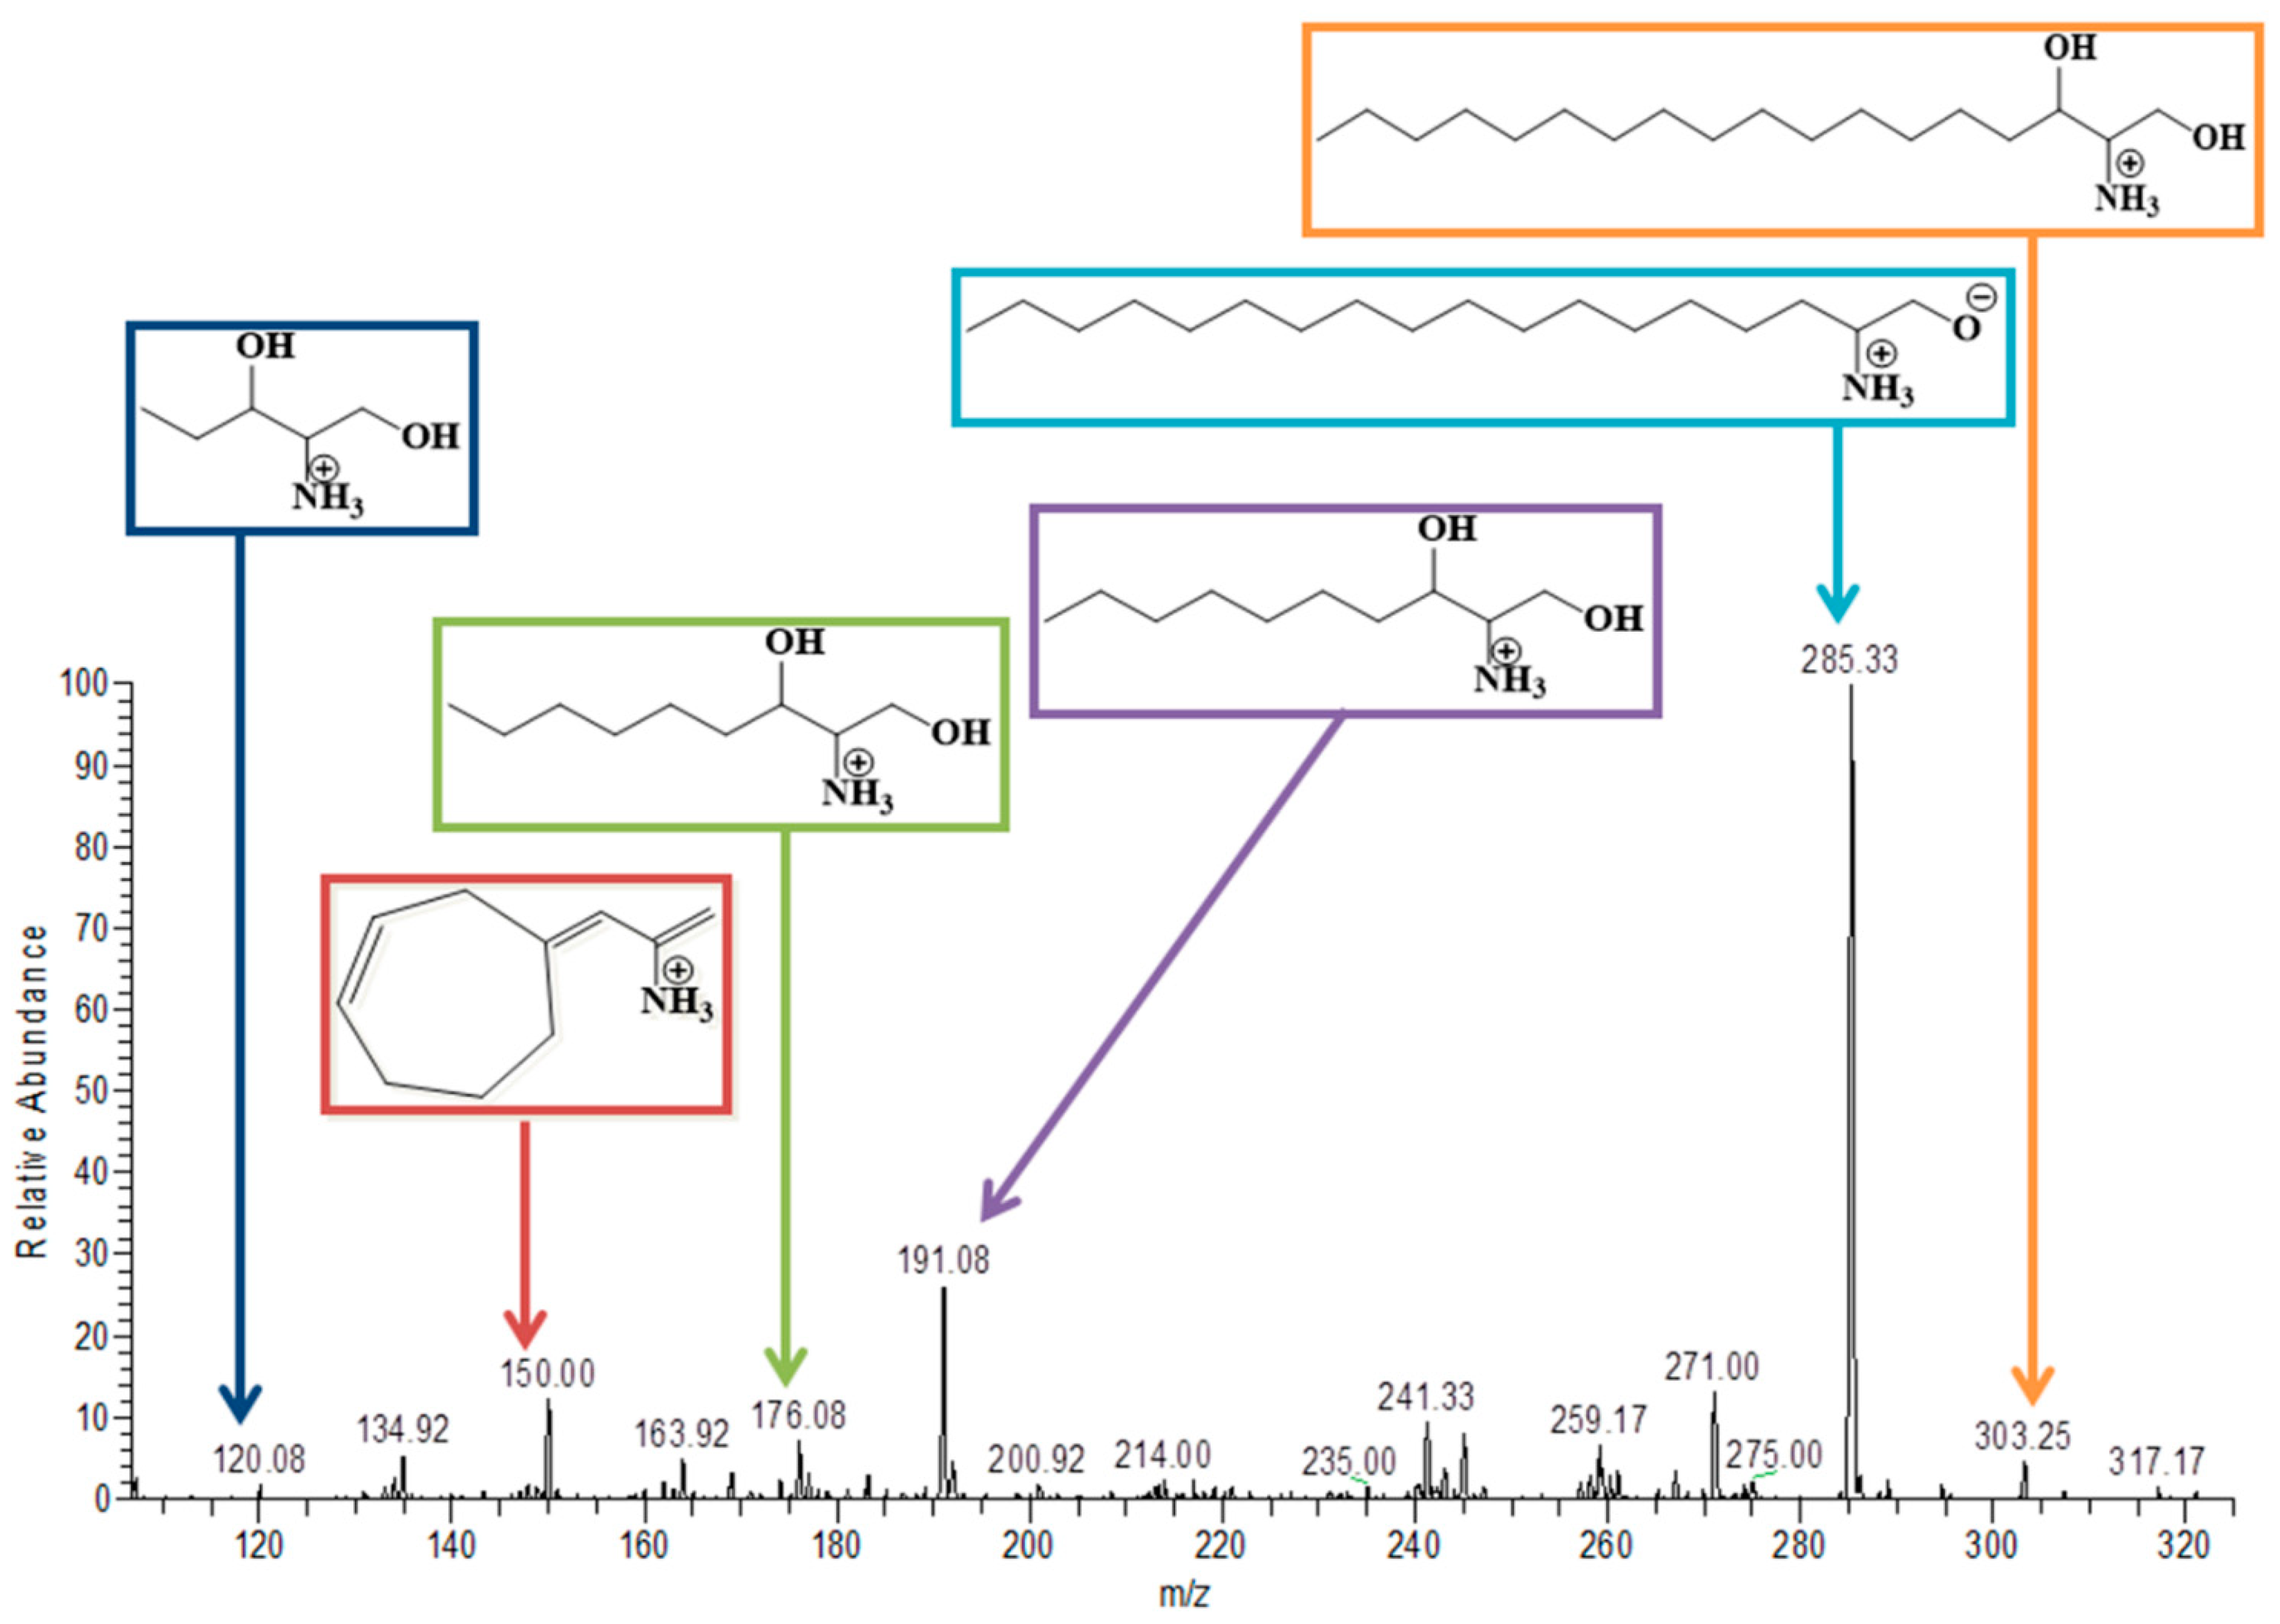
3.6. Sphinganine
3.7. Phytosphingosine
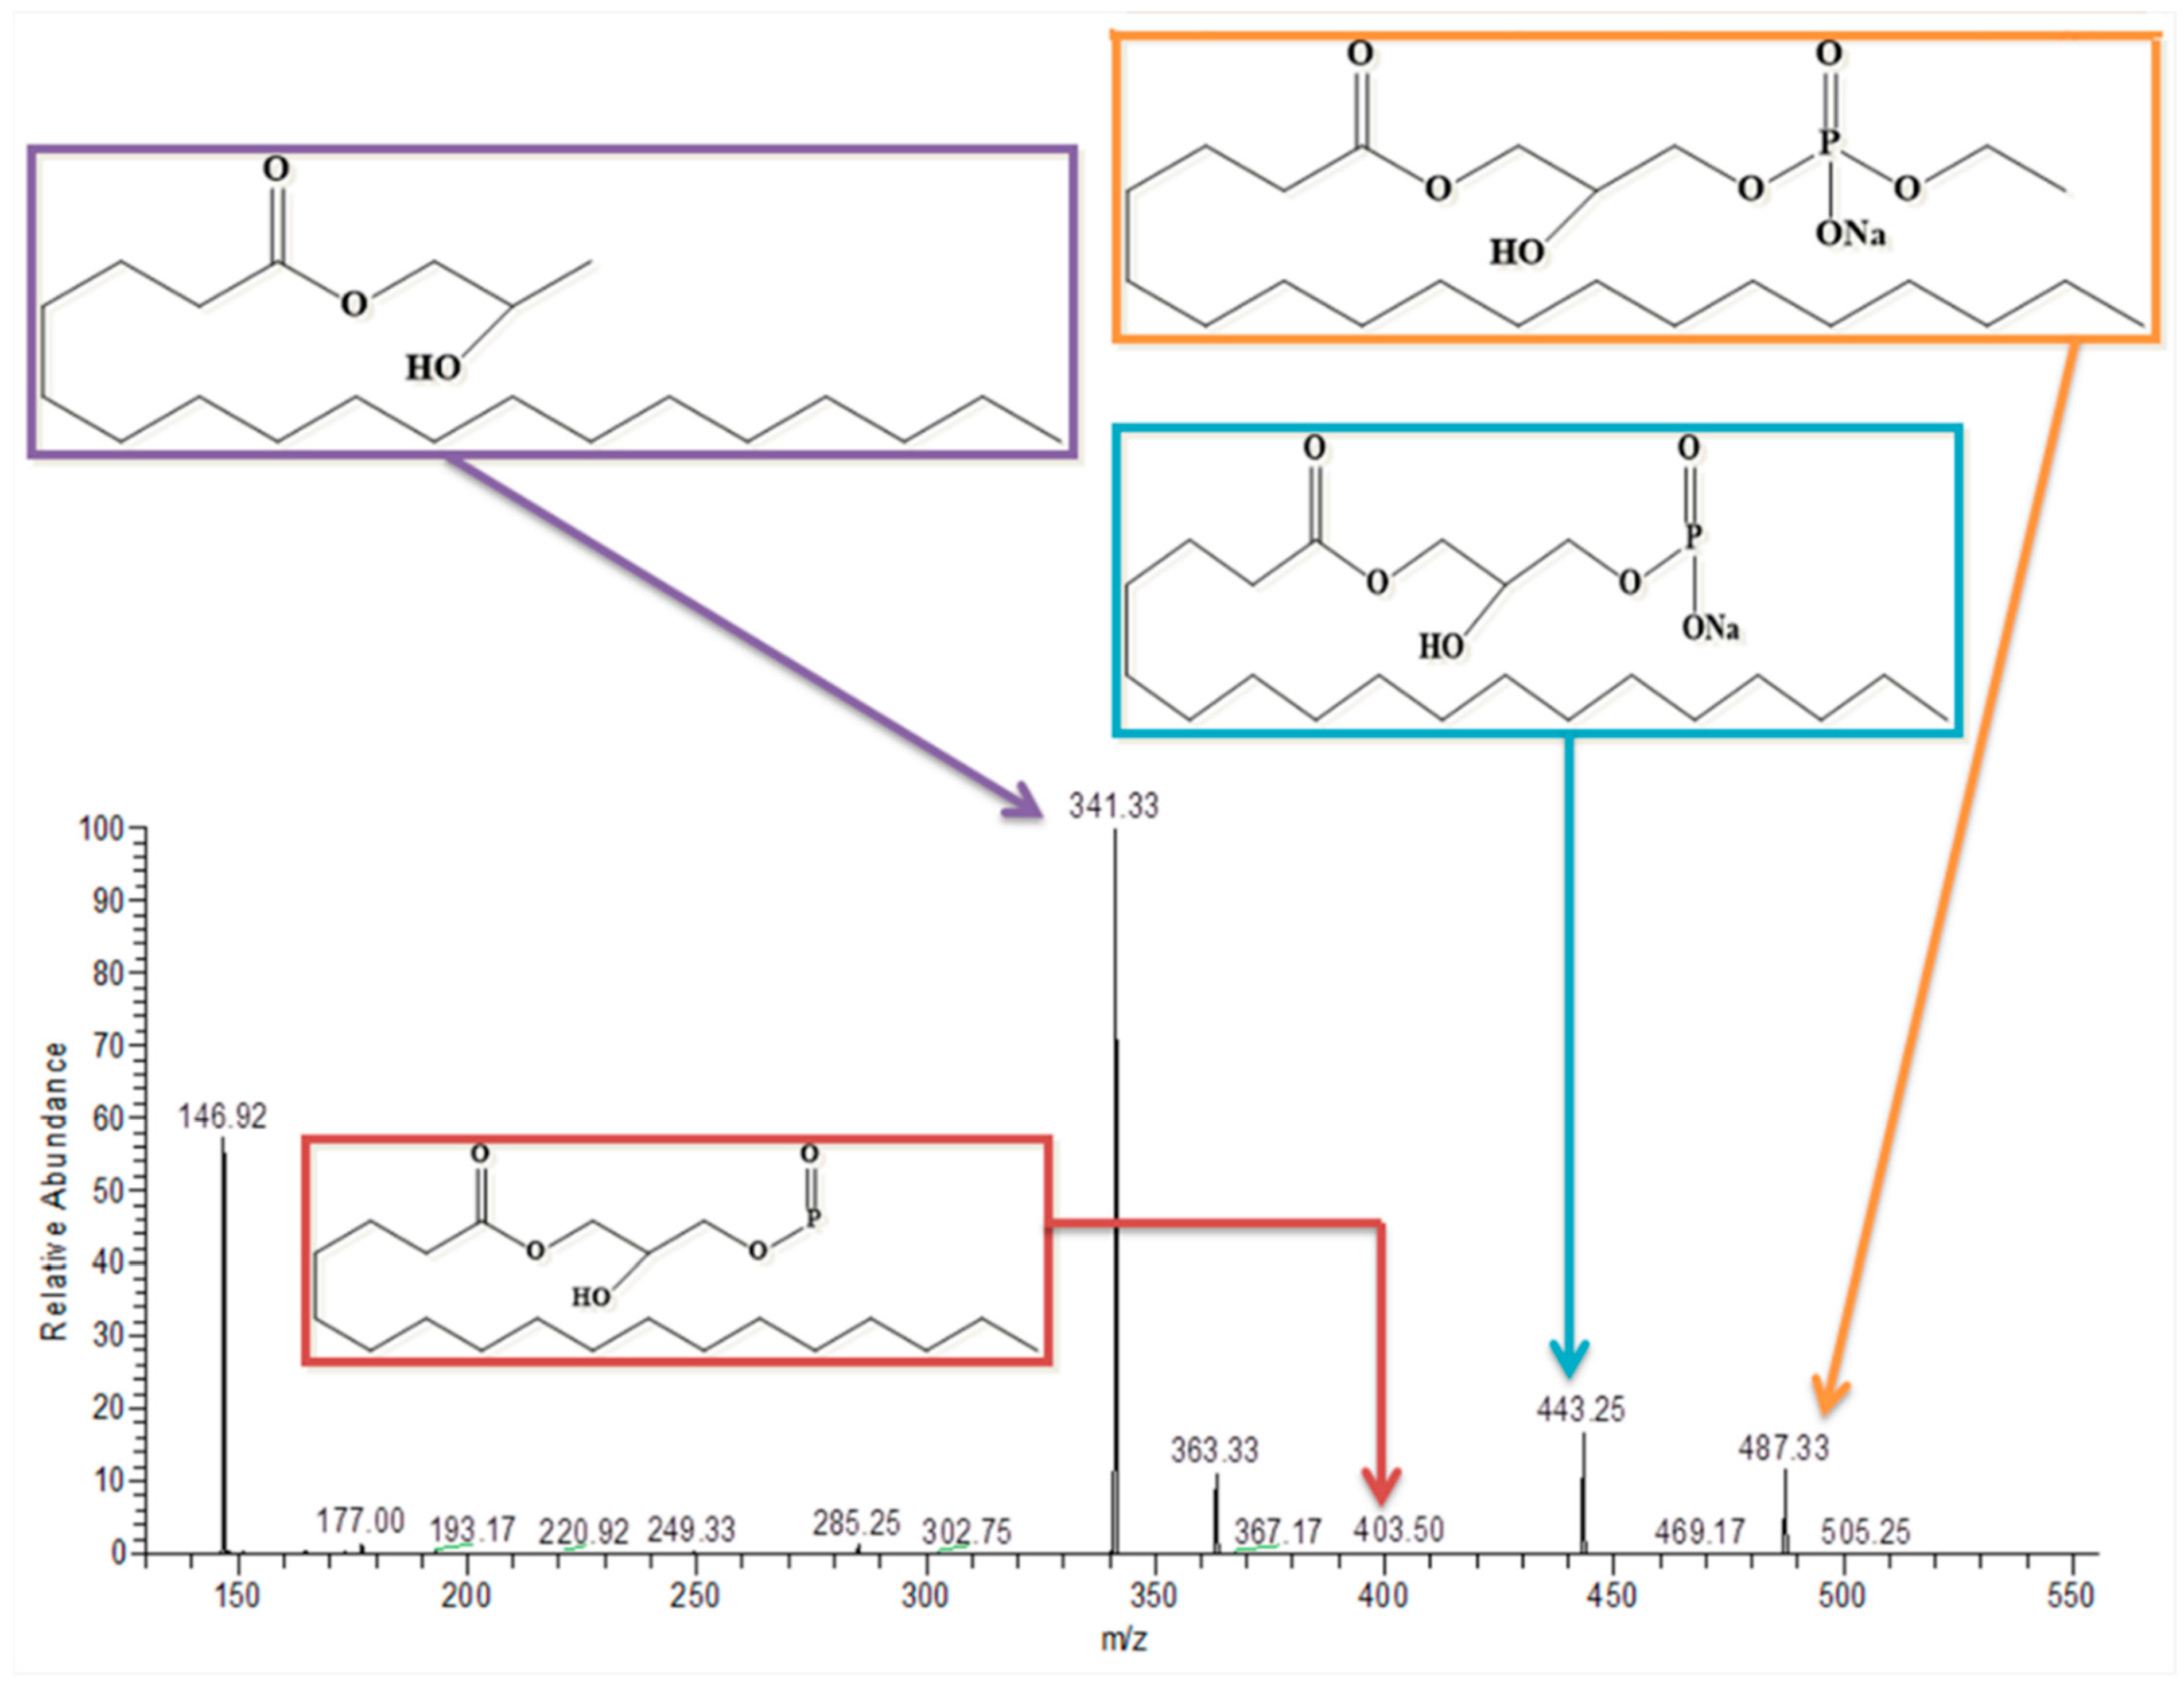
3.8. Lysophosphatidylcholine
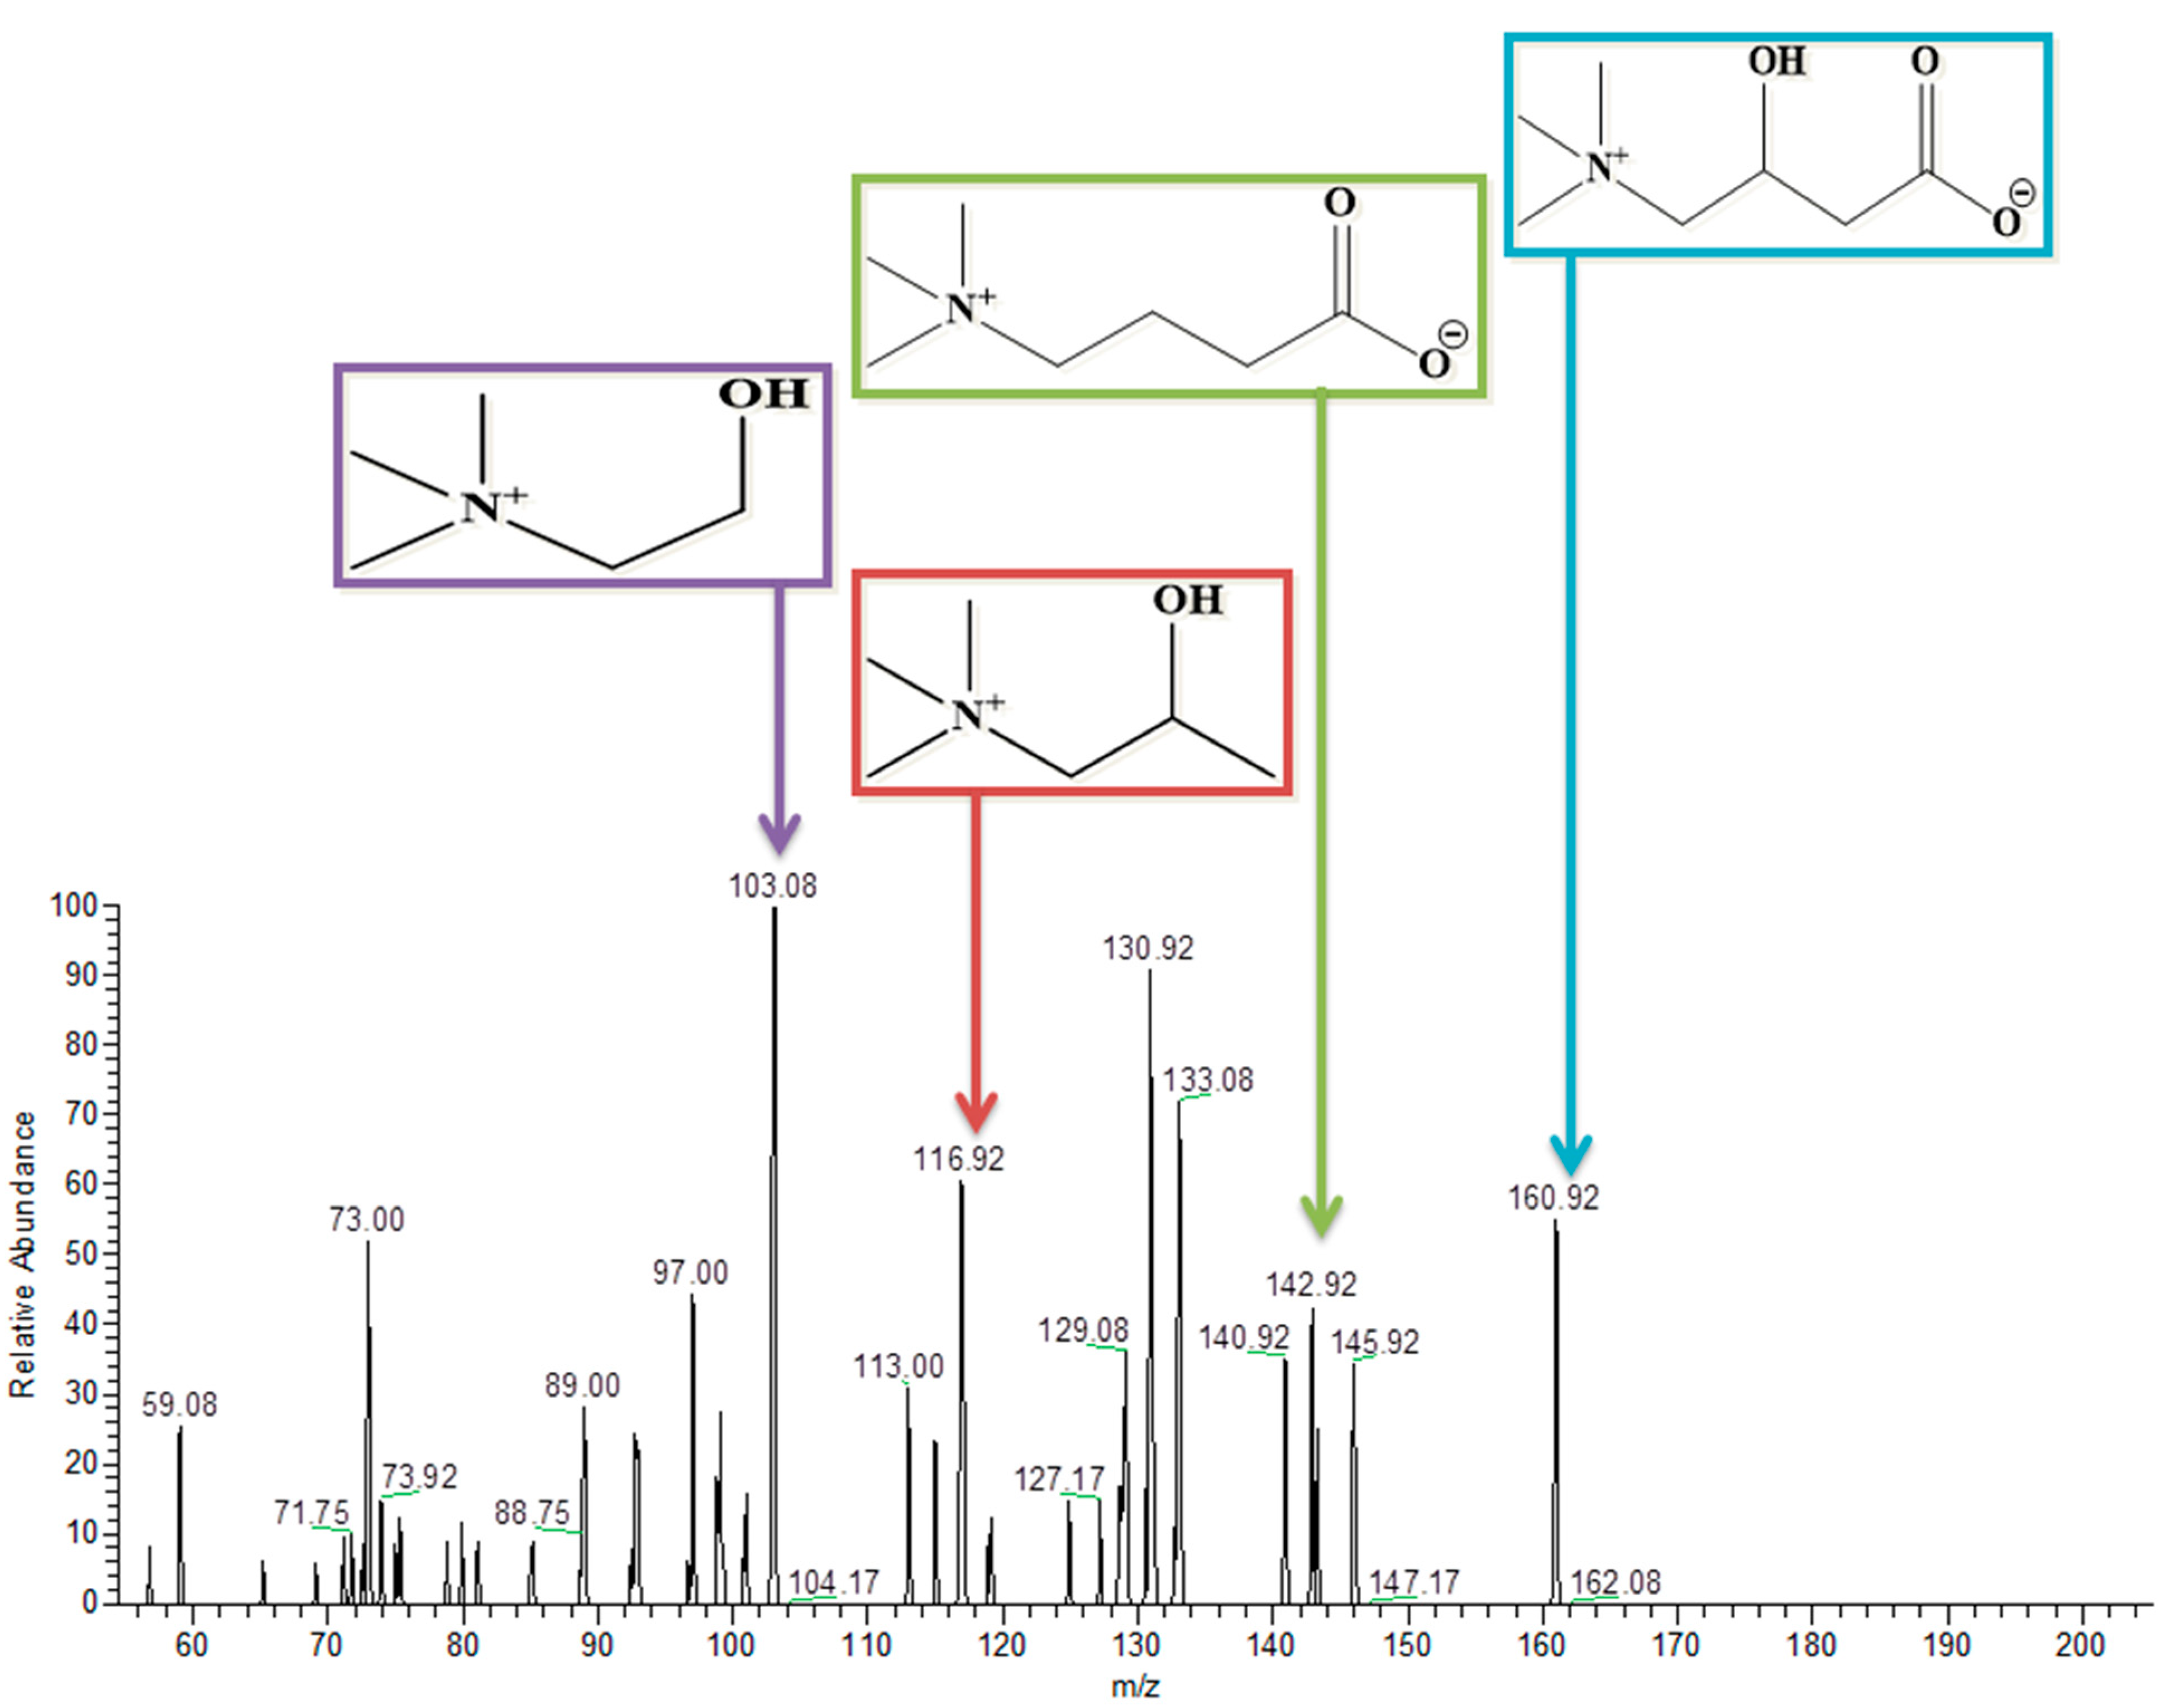
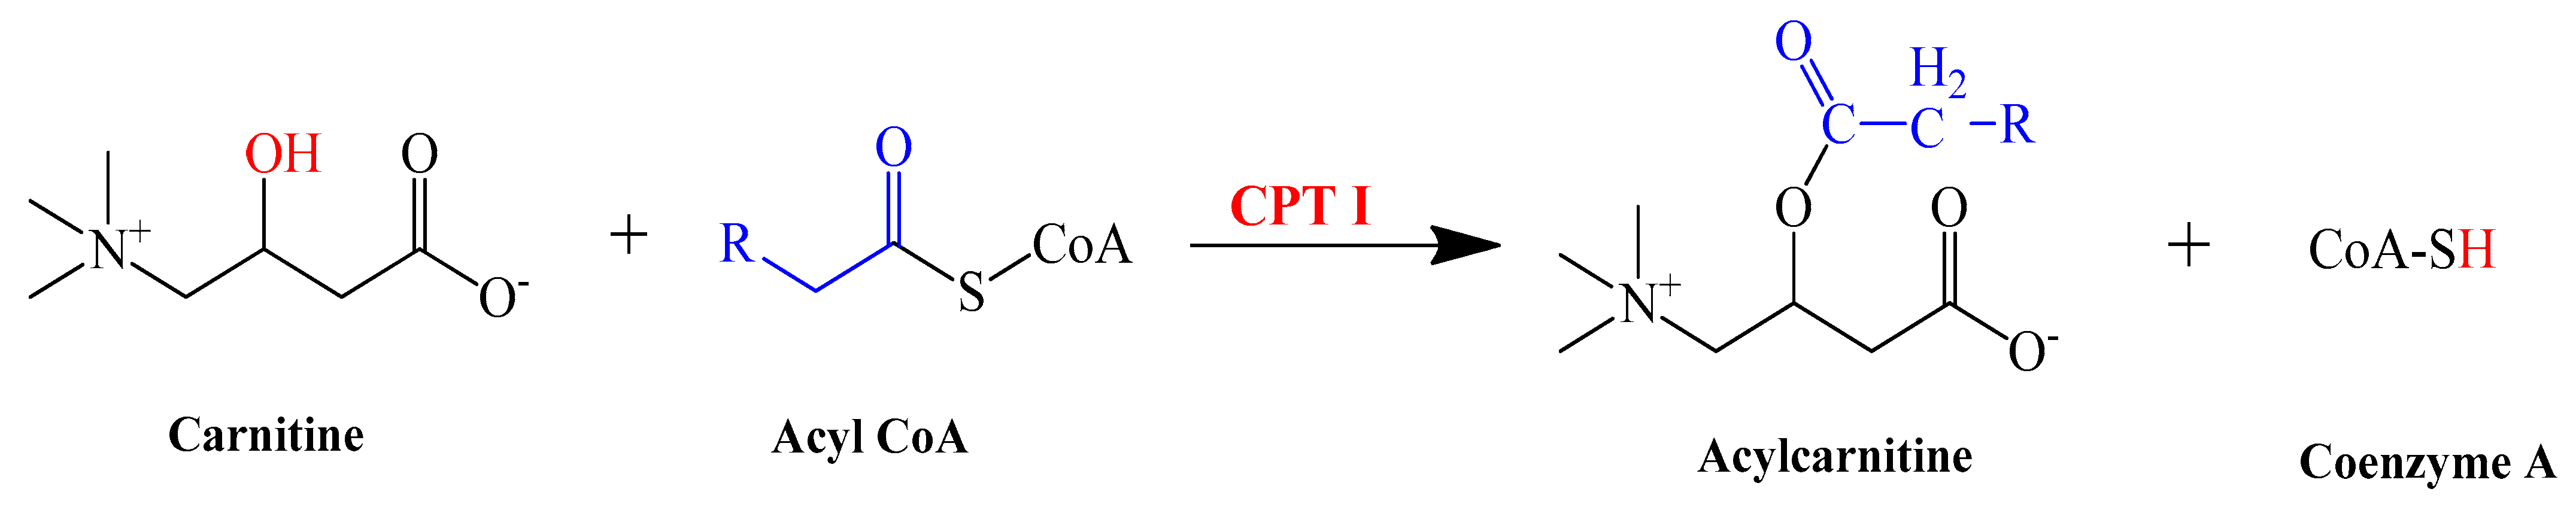
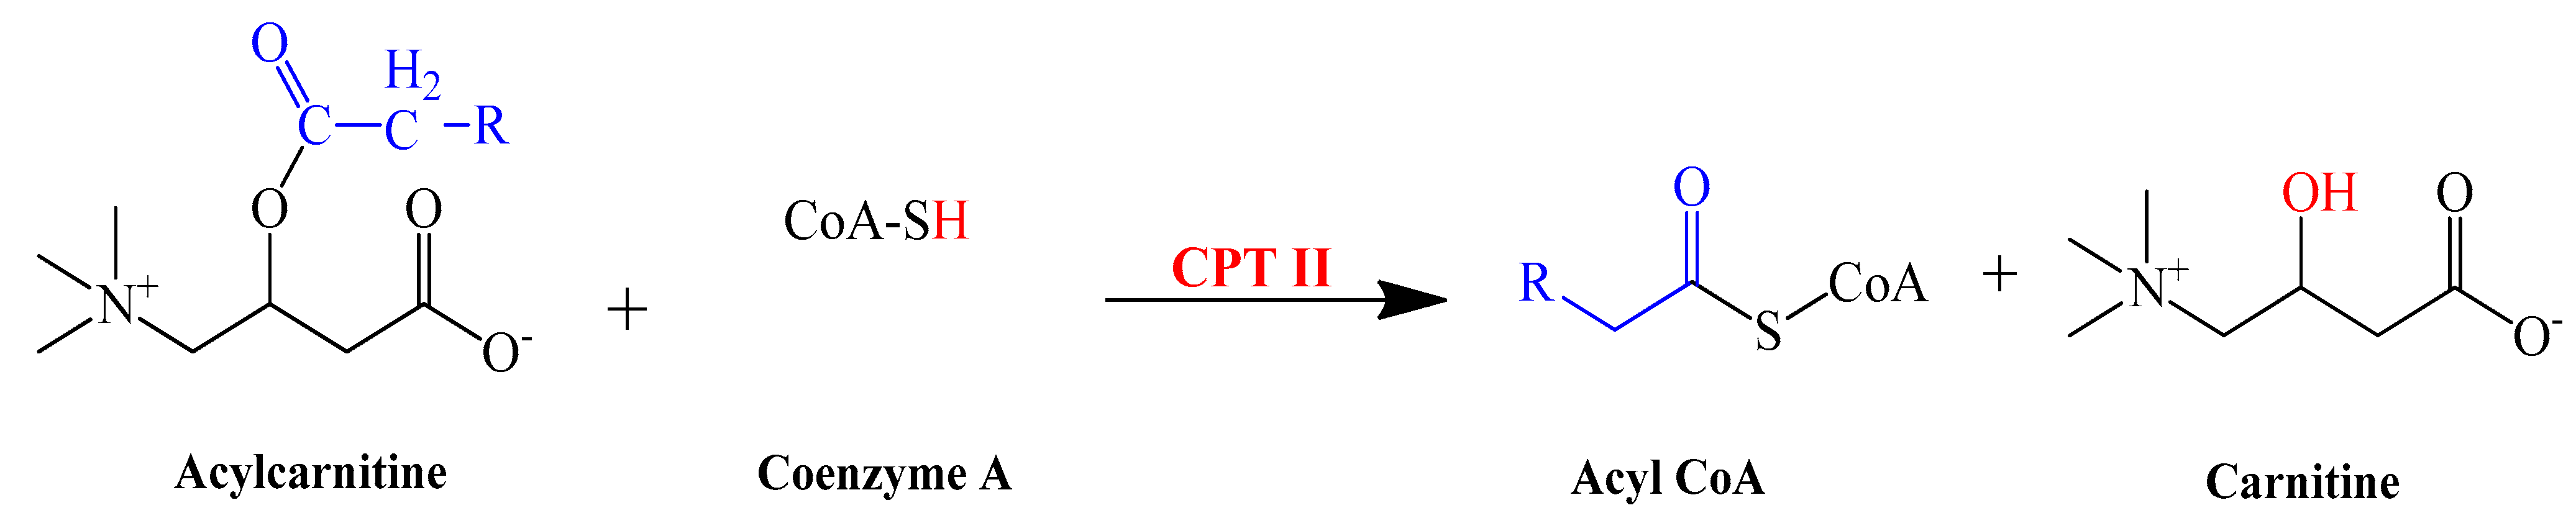
3.9. L-Carnitine
4. Discussion
5. Conclusions
6. Future Perspectives
Author Contributions
Funding
Institutional Review Board Statement
Informed Consent Statement
Data Availability Statement
Conflicts of Interest
References
- Akash, M.S.H.; Sabir, S.; Rehman, K. Bisphenol A-induced metabolic disorders: From exposure to mechanism of action. Environ. Toxicol. Pharmacol. 2020, 77, 103373. [Google Scholar] [CrossRef] [PubMed]
- Yin, F.; Huang, X.; Lin, X.; Chan, T.-F.; Lai, K.P.; Li, R. Analyzing the synergistic adverse effects of BPA and its substitute, BHPF, on ulcerative colitis through comparative metabolomics. Chemosphere 2021, 287, 132160. [Google Scholar] [CrossRef]
- Oldring, P.K.; Castle, L.; O’Mahony, C.; Dixon, J. Estimates of dietary exposure to bisphenol A (BPA) from light metal packaging using food consumption and packaging usage data: A refined deterministic approach and a fully probabilistic (FACET) approach. Food Addit. Contaminants. Part A Chem. Anal. Control. Expo. Risk Assess. 2014, 31, 466–489. [Google Scholar] [CrossRef] [PubMed] [Green Version]
- Akash, M.S.H.; Ejaz ul Haq, M.; Sharif, H.; Rehman, K. Bisphenol A and Neurological Disorders: From Exposure to Preventive Interventions. In Environmental Contaminants and Neurological Disorders; Akash, M.S.H., Rehman, K., Eds.; Springer International Publishing: Cham, Switzerland, 2021; pp. 185–200. [Google Scholar] [CrossRef]
- Irshad, K.; Rehman, K.; Sharif, H.; Tariq, M.; Murtaza, G.; Ibrahim, M.; Akash, M.S.H. Bisphenol A as an EDC in Metabolic Disorders. In Endocrine Disrupting Chemicals-Induced Metabolic Disorders and Treatment Strategies; Akash, M.S.H., Rehman, K., Hashmi, M.Z., Eds.; Springer International Publishing: Cham, Switzerland, 2021; pp. 251–263. [Google Scholar] [CrossRef]
- Vandenberg, L.N.; Gerona, R.R.; Kannan, K.; Taylor, J.A.; van Breemen, R.B.; Dickenson, C.A.; Liao, C.; Yuan, Y.; Newbold, R.R.; Padmanabhan, V.; et al. A round robin approach to the analysis of bisphenol A (BPA) in human blood samples. Environ. Health 2014, 13, 25. [Google Scholar] [CrossRef] [Green Version]
- Haq, M.E.U.; Akash, M.S.H.; Sabir, S.; Mahmood, M.H.; Rehman, K. Human exposure to bisphenol A through dietary sources and development of diabetes mellitus: A cross-sectional study in Pakistani population. Environ. Sci. Pollut. Res. Int. 2020, 27, 26262–26275. [Google Scholar] [CrossRef] [PubMed]
- Palanza, P.; Gioiosa, L.; vom Saal, F.S.; Parmigiani, S. Effects of developmental exposure to bisphenol A on brain and behavior in mice. Environ. Res. 2008, 108, 150–157. [Google Scholar] [CrossRef]
- Li, A.J.; Xue, J.; Lin, S.; Al-Malki, A.L.; Al-Ghamdi, M.A.; Kumosani, T.A.; Kannan, K. Urinary concentrations of environmental phenols and their association with type 2 diabetes in a population in Jeddah, Saudi Arabia. Environ. Res. 2018, 166, 544–552. [Google Scholar] [CrossRef]
- Lei, Y.; Fang, L.; Hamid Akash, M.S.; Liu, Z.; Shi, W.; Chen, S. Development and comparison of two competitive ELISAs for the detection of bisphenol A in human urine. Anal. Methods 2013, 5, 6106–6113. [Google Scholar] [CrossRef]
- Shelnutt, S.; Kind, J.; Allaben, W. Bisphenol A: Update on newly developed data and how they address NTP’s 2008 finding of “Some Concern”. Food Chem. Toxicol. 2013, 57, 284–295. [Google Scholar] [CrossRef] [Green Version]
- Tudurí, E.; Marroqui, L.; Dos Santos, R.S.; Quesada, I.; Fuentes, E.; Alonso-Magdalena, P. Timing of Exposure and Bisphenol-A: Implications for Diabetes Development. Front. Endocrinol. 2018, 9, 648. [Google Scholar] [CrossRef] [Green Version]
- Wang, X.; Mu, X.; Zhang, J.; Huang, Q.; Alamdar, A.; Tian, M.; Liu, L.; Shen, H. Serum metabolomics reveals that arsenic exposure disrupted lipid and amino acid metabolism in rats: A step forward in understanding chronic arsenic toxicity. Met. Integr. Biometal Sci. 2015, 7, 544–552. [Google Scholar] [CrossRef]
- Yaqoob, A.; Rehman, K.; Akash, M.S.H.; Alvi, M.; Shoaib, S.M. Biochemical profiling of metabolomics in heavy metal-intoxicated impaired metabolism and its amelioration using plant-based bioactive compound. Front. Mol. Biosci. 2022, 9, 1029729. [Google Scholar] [CrossRef] [PubMed]
- Ghazalpour, A.; Bennett, B.J.; Shih, D.; Che, N.; Orozco, L.; Pan, C.; Hagopian, R.; He, A.; Kayne, P.; Yang, W.P.; et al. Genetic regulation of mouse liver metabolite levels. Mol. Syst. Biol. 2014, 10, 730. [Google Scholar] [CrossRef] [PubMed]
- Shin, S.Y.; Fauman, E.B.; Petersen, A.K.; Krumsiek, J.; Santos, R.; Huang, J.; Arnold, M.; Erte, I.; Forgetta, V.; Yang, T.P.; et al. An atlas of genetic influences on human blood metabolites. Nat. Genet. 2014, 46, 543–550. [Google Scholar] [CrossRef] [PubMed] [Green Version]
- Chambers, J.C.; Zhang, W.; Sehmi, J.; Li, X.; Wass, M.N.; Van der Harst, P.; Holm, H.; Sanna, S.; Kavousi, M.; Baumeister, S.E.; et al. Genome-wide association study identifies loci influencing concentrations of liver enzymes in plasma. Nat. Genet. 2011, 43, 1131–1138. [Google Scholar] [CrossRef] [PubMed]
- Madsen, R.; Lundstedt, T.; Trygg, J. Chemometrics in metabolomics--a review in human disease diagnosis. Anal. Chim. Acta 2010, 659, 23–33. [Google Scholar] [CrossRef]
- Perng, W.; Aslibekyan, S. Find the Needle in the Haystack, Then Find It Again: Replication and Validation in the ‘Omics Era. Metabolites 2020, 10, 286. [Google Scholar] [CrossRef]
- Saleem, Z.; Rehman, K.; Hamid Akash, M.S. Role of Drug Delivery System in Improving the Bioavailability of Resveratrol. Curr. Pharm. Des. 2022, 28, 1632–1642. [Google Scholar] [CrossRef]
- Irshad, K.; Rehman, K.; Akash, M.S.H.; Hussain, I. Biochemical Investigation of Therapeutic Potential of Resveratrol Against Arsenic Intoxication. Dose-Response 2021, 19, 15593258211060941. [Google Scholar] [CrossRef]
- Rehman, K.; Saeed, K.; Munawar, S.M.; Akash, M.S.H. Resveratrol regulates hyperglycemia-induced modulations in experimental diabetic animal model. Biomed. Pharmacother. Biomed. Pharmacother. 2018, 102, 140–146. [Google Scholar] [CrossRef]
- Akash, M.S.H.; Sharif, H.; Rehman, K.; Rasheed, S.; Kamal, S. Biochemical Profiling of Arsenic Trioxide-Induced Impaired Carbohydrate Metabolism and its Therapeutic Intervention via Modulation of Metabolic Pathways. Pak. J. Zool. 2022, 54, 2835–2844. [Google Scholar] [CrossRef]
- Chu, K.S.; Hasan, W.; Rawal, S.; Walsh, M.D.; Enlow, E.M.; Luft, J.C.; Bridges, A.S.; Kuijer, J.L.; Napier, M.E.; Zamboni, W.C.; et al. Plasma, tumor and tissue pharmacokinetics of Docetaxel delivered via nanoparticles of different sizes and shapes in mice bearing SKOV-3 human ovarian carcinoma xenograft. Nanomedicine 2013, 9, 686–693. [Google Scholar] [CrossRef] [Green Version]
- Moon, M.K.; Kim, M.J.; Jung, I.K.; Koo, Y.D.; Ann, H.Y.; Lee, K.J.; Kim, S.H.; Yoon, Y.C.; Cho, B.-J.; Park, K.S.; et al. Bisphenol A impairs mitochondrial function in the liver at doses below the no observed adverse effect level. J. Korean Med. Sci. 2012, 27, 644–652. [Google Scholar] [CrossRef] [PubMed] [Green Version]
- Hassan, Z.K.; Elobeid, M.A.; Virk, P.; Omer, S.A.; ElAmin, M.; Daghestani, M.H.; AlOlayan, E.M. Bisphenol A Induces Hepatotoxicity through Oxidative Stress in Rat Model. Oxid. Med. Cell. Longev. 2012, 2012, 194829. [Google Scholar] [CrossRef] [PubMed] [Green Version]
- Cengiz, A.; Hale, K.; Aysun Bay, K.; Sacit, C.; Selma, A.; Murat, H.; Vedat, K.; Sezai, Y. Protective effect of resveratrol against oxidative stress in cholestasis. J. Surg. Res. 2005, 127, 112–117. [Google Scholar] [CrossRef]
- Pandey, K.B.; Rizvi, S.I. Protective effect of resveratrol on markers of oxidative stress in human erythrocytes subjected to in vitro oxidative insult. Phytother. Res. 2010, 24, S11–S14. [Google Scholar] [CrossRef]
- Çiğ, B.; Yildizhan, K. Resveratrol diminishes bisphenol A-induced oxidative stress through TRPM2 channel in the mouse kidney cortical collecting duct cells. J. Recept. Signal Transduct. Res. 2020, 40, 570–583. [Google Scholar] [CrossRef] [PubMed]
- Guan, Y.; Gao, J.; Zhang, Y.; Chen, S.; Yuan, C.; Wang, Z. Effects of bisphenol A on lipid metabolism in rare minnow Gobiocypris rarus. Comp. Biochem. Physiol. Part-C Toxicol. Pharmacol. 2016, 179, 144–149. [Google Scholar] [CrossRef] [PubMed]
- Wang, G.L.; Wang, J.; Douglas, G.; Browning, M.; Hahn, S.; Ganesh, J.; Cox, S.; Aleck, K.; Schmitt, E.S.; Zhang, W.; et al. Expanded molecular features of carnitine acyl-carnitine translocase (CACT) deficiency by comprehensive molecular analysis. Mol. Genet. Metab. 2011, 103, 349–357. [Google Scholar] [CrossRef] [PubMed]
- Joshi, P.R.; Zierz, S. Muscle carnitine palmitoyltransferase II (CPT II) deficiency: A conceptual approach. Molecules 2020, 25, 1784. [Google Scholar] [CrossRef] [Green Version]
- Elmetwally, M.A.; Halawa, A.A.; Tang, W.; Wu, G.; Bazer, F.W. Effects of Bisphenol A on expression of genes related to amino acid transporters, insulin- like growth factor, aquaporin and amino acid release by porcine trophectoderm cells. Reprod. Toxicol. 2020, 96, 241–248. [Google Scholar] [CrossRef] [PubMed]
- Haq, M.E.U.; Akash, M.S.H.; Rehman, K.; Mahmood, M.H. Chronic exposure of bisphenol A impairs carbohydrate and lipid metabolism by altering corresponding enzymatic and metabolic pathways. Environ. Toxicol. Pharmacol. 2020, 78, 103387. [Google Scholar] [CrossRef] [PubMed]
- Ekman, D.R.; Skelton, D.M.; Davis, J.M.; Villeneuve, D.L.; Cavallin, J.E.; Schroeder, A.; Jensen, K.M.; Ankley, G.T.; Collette, T.W. Metabolite profiling of fish skin mucus: A novel approach for minimally-invasive environmental exposure monitoring and surveillance. Environ. Sci. Technol. 2015, 49, 3091–3100. [Google Scholar] [CrossRef] [PubMed]


| Gene Name | Gene Symbol | Primer (5′–3′) | Target Size (bp) | |
|---|---|---|---|---|
| Beta-actin | ẞ-Actin | Forward | CCCATCTATGAGGGTTACGC | 150 |
| Reverse | TTTAATGTCACGCACGATTTC | |||
| Carnitinepalmitoyltrans- ferase I | CPT-I | Forward | ATCCACCATTCCACTCTGCT | 107 |
| Reverse | TGTGCCTGCTGTCCTTGATA | |||
| Carnitinepalmitoyltrans-ferase II | CPT-II | Forward | CTGTCCACCAGCACTCTGAA | 111 |
| Reverse | GCAACCTATCCAGTCATCGT | |||
| Lecithin–cholesterol acyltransferase | LCAT | Forward | CTCCTTCTGGCTCCTCAATG | 171 |
| Reverse | TCCTCTGTCTTTCGGTAGCAC | |||
| Carnitine O-octanoyltransferase | CROT | Forward | AGACGGAAGGGAGATGGAG | 168 |
| Reverse | AAGATGTGAAGGTAGATGCTGCT | |||
| Mitochondrial carnitine/acylcarnitine carrier protein | CACT | Forward | TTCTCCACTGCTGCTCCTG | 100 |
| Reverse | CCTGTCTGCTCCCATTCAG | |||
| 5-methyltetrahydrofolate-homocysteine methyltransferase | MTR | Forward | GGTTCGGTTGAAGAAGAGGA | 112 |
| Compound | M.F. | M.wt. | Polarity | Precursor Ion (m/z) | Product Ion (m/z) | BPA Group | BPA+RSV-CRN Group |
|---|---|---|---|---|---|---|---|
| Carnitine | C7H16NO3 | 162 | Negative | 160.75 | 142.9, 117 and 103.08 | ✓ | ✓ |
| Sphinganine | C18H39NO2 | 302 | Positive | 303 | 285, 190.3, 176.3, 150, 119.92 and 106. | ✓ | ✓ |
| Phytosphingosine | C18H39NO3 | 317 | Positive | 318 | 300 and 256 | ✓ | ✓ |
| Lysophosphatidylcholine | C26H54NO7P | 523 | Positive | 546 | 487, 341, 404, and 443 | ✓ | ✓ |
| Parameter | Bisphenol A | Bisphenol A + RSV | Corn Oil |
|---|---|---|---|
| Body weight | Increased | Decreased | Increased |
| Antioxidant enzymes | Decreased | Increased | Decreased |
| MDA level | Increased | Decreased | Increased |
| Amino acid levels | Decreased | Slightly Increased | Increased |
Publisher’s Note: MDPI stays neutral with regard to jurisdictional claims in published maps and institutional affiliations. |
© 2022 by the authors. Licensee MDPI, Basel, Switzerland. This article is an open access article distributed under the terms and conditions of the Creative Commons Attribution (CC BY) license (https://creativecommons.org/licenses/by/4.0/).
Share and Cite
Alvi, M.; Rehman, K.; Akash, M.S.H.; Yaqoob, A.; Shoaib, S.M. Determination of Metabolomics Profiling in BPA-Induced Impaired Metabolism. Pharmaceutics 2022, 14, 2496. https://doi.org/10.3390/pharmaceutics14112496
Alvi M, Rehman K, Akash MSH, Yaqoob A, Shoaib SM. Determination of Metabolomics Profiling in BPA-Induced Impaired Metabolism. Pharmaceutics. 2022; 14(11):2496. https://doi.org/10.3390/pharmaceutics14112496
Chicago/Turabian StyleAlvi, Maria, Kanwal Rehman, Muhammad Sajid Hamid Akash, Azka Yaqoob, and Syed Muhammad Shoaib. 2022. "Determination of Metabolomics Profiling in BPA-Induced Impaired Metabolism" Pharmaceutics 14, no. 11: 2496. https://doi.org/10.3390/pharmaceutics14112496