Article

Physiologically Based Pharmacokinetic (PBPK) Modeling for Predicting Brain Levels of Drug in Rat

by
Bárbara Sánchez-Dengra
,
Isabel Gonzalez-Alvarez
,
Marival Bermejo
* and
Marta Gonzalez-Alvarez
Engineering: Pharmacokinetics and Pharmaceutical Technology Area, Miguel Hernandez University, San Juan de Alicante, 03550 Alicante, Spain
*
Author to whom correspondence should be addressed.
Pharmaceutics 2021, 13(9), 1402; https://doi.org/10.3390/pharmaceutics13091402
Submission received: 2 July 2021 / Revised: 20 August 2021 / Accepted: 30 August 2021 / Published: 3 September 2021

Abstract

:
One of the main obstacles in neurological disease treatment is the presence of the blood–brain barrier. New predictive high-throughput screening tools are essential to avoid costly failures in the advanced phases of development and to contribute to the 3 Rs policy. The objective of this work was to jointly develop a new in vitro system coupled with a physiological-based pharmacokinetic (PBPK) model able to predict brain concentration levels of different drugs in rats. Data from in vitro tests with three different cells lines (MDCK, MDCK-MDR1 and hCMEC/D3) were used together with PK parameters and three scaling factors for adjusting the model predictions to the brain and plasma profiles of six model drugs. Later, preliminary quantitative structure–property relationships (QSPRs) were constructed between the scaling factors and the lipophilicity of drugs. The predictability of the model was evaluated by internal validation. It was concluded that the PBPK model, incorporating the barrier resistance to transport, the disposition within the brain and the drug–brain binding combined with MDCK data, provided the best predictions for passive diffusion and carrier-mediated transported drugs, while in the other cell lines, active transport influence can bias predictions.

Graphical Abstract

1. Introduction

The brain is the most important organ in living beings as it controls their vital functions: nutrition, interaction and reproduction. The importance of the brain means all the capillaries that supply it with oxygen and nutrients are composed of extremely tight endothelial cells surrounded by a thick layer of astrocytes and pericytes, all of this to prevent dangerous substances from reaching it. This group of protective and regulating cells is known as the blood–brain barrier (BBB).
Besides the physicochemical protection of the BBB, the brain is also protected by the cerebrospinal fluid (CSF), a constantly secreted liquid that helps to maintain the brain’s homeostasis for normal neurological function, acts as a cushion between the brain and the skull, and makes the central nervous system (CNS) apparently “lighter”, as it is floating in this liquid [1]. There are two different barriers that separate the CSF from the rest of the body—the blood–cerebrospinal fluid barrier (BCSFB), which is around the capillaries within brain ventricles, and the blood–arachnoid barrier, around the subarachnoid space [2,3].
The extra protection of the CNS hinders the development of new drugs for the treatment of neurological pathologies (glioblastoma, Alzheimer’s disease, depression, Parkinson’s disease or epilepsy, among others), as molecules experience difficulties in reaching their target. Because of this, the pharmaceutical industry has developed several strategies to bypass the BBB: chemical strategies, such as the development of prodrugs or chemical drug delivery systems (CDDS), physical strategies, such as the use of ultrasounds to temporarily open the tight junctions of the endothelial cells, or nanotechnological strategies, which include developing lipid-based, polymer-based or metal-based nanocarriers [4].
On the other hand, the use of reliable methods to evaluate whether a new candidate will reach the brain is as important as the development of new strategies to bypass the BBB. This type of method can include in silico, in vitro, in situ or in vivo tests; however, except for the in vivo tests that directly measure the brain concentration of a drug over time, the results obtained with the other methodologies have been considered controversial, as they do not sufficiently accurately reflect whether the drug will reach the brain and perform its action [5,6].
Frequently, researchers use the permeability clearance into the brain (Clin), or the influx permeability surface area product (PSin), which is the same, to define whether or not a drug will permeate the BBB, or at least to say if a new delivery system will improve on the action of a previous one [6]. Nevertheless, this parameter is not the only one that should be used to define the potential success of a drug in the treatment of a neurological pathology, because it gives a measurement of the rate of transport through the BBB; however, fast permeation does not mean fast action or a better performance, as concentrations in the brain are also influenced by (A) the binding of the drug to the tissue once it crosses the BBB, (B) the binding of the drug to the proteins in blood, and (C) the presence of efflux transporters that remove the drug from the brain [5]. According to Dagenais et al., the PSin of loperamide obtained by the in situ brain perfusion method was 98.6 ± 17.3 μL/min × g brain, while, the value of the same parameter, obtained by the same method, for morphine was 10.4 ± 3 μL/min × g brain; thus, loperamide is more permeable than morphine through the BBB, although morphine is much more active in the CNS. This gives a clear example of the lack of reliability of the influx clearance parameter when it is taken on its own [5,7].
When the efflux clearance (Clout) is taken into account as well as the unbound fractions of drug, then the other two neuropharmacokinetic (neuroPK) parameters can be defined too: the unbound plasma–brain partition coefficient (Kpuu,brain) and the apparent volume of distribution in the brain (Vu,brain) [5,8].
The Kpuu,brain is defined as the relationship between the concentration of free drug in plasma (Cu,p) and the concentration of free drug in the brain (Cu,b) at a steady state. It can be obtained according to Equation 1, in which the AUCu is the area under the unbound concentration versus time curve. This parameter includes the passive and active transport of the unbound drug through the BBB in both directions (influx and efflux); because of this, and considering that only the free fraction of the drug can cross the BBB, the Kpuu,brain is judged as a more informative parameter than the Kpbrain (also known as logBB), a previously described parameter that used total concentrations to evaluate the permeability through the BBB [5,9,10].
K p u u , b r a i n = A U C u , b r a i n A U C u , p l a s m a = C l i n C l o u t = P S i n P S o u t
The Vu,brain, meanwhile, reflects the distribution of the drug once it has crossed the BBB, and can be defined as a relationship between the total amount of drug present in the brain and the concentration of free drug in the brain (Cu,b). If the drug has a high affinity for brain tissue, its unbound fraction of drug in the brain (fu,brain) will decrease, and therefore, the Vu,brain will be greater, as shown in Equation (2), where VECF is the volume of extracellular fluid and VICF is the volume of intracellular fluid [11]. A higher Vu,brain can be translated into a longer half-life of the drug in the brain, independently of its transport through the BBB or its plasma concentration [5]. So, it is particularly helpful to know this parameter or the fu,brain when a new candidate for the treatment of a neurological disease is evaluated.
V u , b r a i n = V E C F + 1 f u , b r a i n · V I C F = 0.2 + 1 f u , b r a i n · 0.6           m L / g   b r a i n
Besides the different tests for obtaining the parameters mentioned above, over the last few years, researchers have also worked on the development of mathematical models, such as physiologically based pharmacokinetic (PBPK) models, for describing and predicting the behaviour of CNS drugs after being administered. In 2019, Vendel et al. published a review wherein they summarized different types of mathematical models for describing drug distribution within the brain, and all the processes and properties that should be taken into account to develop the “perfect” model [2]:
  • Brain-specific properties, such as the properties of the brain vascular network and the different brain barriers, the characteristics of the brain tissue and the CSF, the fluid movements within the brain or the presence of metabolic enzymes in the CNS;
  • Drug-specific properties, such as molecular (molecular weight, polar surface area, shape or number of hydrogen bond donors and acceptors), physicochemical (pKa, solubility or lipophilicity) and pharmacokinetic properties;
  • Processes affecting drug distribution within the brain, e.g., the drug transport through the brain vascular system, the brain barriers or within the brain fluids, the drug extra-/intracellular exchange, the drug binding or the drug metabolism.
It is shown that, despite the high number of models available, some are too complex, others are not completely predictable, and none are able to cover all the processes mentioned above. At the end of the review, it is concluded that there are three important points that a neuro-PBPK model should include in order to give accurate predictions of the in vivo behaviour: (A) the barrier transport, (B) the transport of the drug once in the brain, and (C) drug–brain binding [2].
Normally, neuroPK parameters (PSin, Kpuu,brain and Vu,brain) are obtained using different experimental models. In this work, a previously proposed and validated single in vitro system [11,12] was used to derive those parameters. Later, these in vitro data were combined with in silico and in vivo pharmacokinetic information from outside the brain to develop a new neuro-semi-physiological mathematical model, including the three factors mentioned above (the barrier transport, the transport within the brain and the drug–brain binding). Thus, the main objective of this work was to jointly develop a new in vitro system coupled with a physiological-based pharmacokinetic (PBPK) model able to predict brain concentration levels for different drugs in a rat. Furthermore, the predictability of the new PBPK model was compared across different cell lines chosen for obtaining the in vitro neuroPK parameters.

2. Materials and Methods

2.1. Drugs and Products

The six drugs used for constructing the mathematical model (amitriptyline, caffeine, carbamazepine, fleroxacin, pefloxacin and zolpidem) and HPLC-grade solvents (acetonitrile, methanol and water) were purchased from Sigma-Aldrich (Barcelona, Spain). The MDCK cell line was purchased from ATCC (USA), MDCK-MDR1 cells were provided by Dr. Gottessman, and the MM (National Institutes of Health, Bethesda, MD, USA) and hCMEC/D3 cell lines were purchased from Cedarlane (Burlington, ON, Canada). Pig brain homogenate was kindly supplied by a local slaughterhouse.
Dulbecco’s modified eagle’s medium (DMEM) with a high content of glucose, L-glutamine, HEPES, MEM non-Essential aminoacid, penicillin−streptomycin, trypsin-EDTA, Hank’s balanced salt solution (HBSS) and fetal bovine serum (FBS) for the cell culture of MDCK and MDCK-MDR1 cell lines were purchased from Sigma-Aldrich (Barcelona, Spain).
The products needed for the culture of hCMEC/D3 cells were purchased from Sigma-Aldrich (Barcelona, Spain) (hydrocortisone, ascorbic acid, HEPES, Triton X-100 and bFGF), Gibco (Barcelona, Spain) (FBS, penicillin–streptomycin, chemically defined lipid concentrate, HBSS, collagen I rat protein and trypsin-EDTA), Lona (Barcelona, Spain) (EBM-2 medium).

2.2. Cell Culture and Permeability Studies

MDCK and MDCK-MDR1 cells were cultured and seeded according to the protocol explained in [11], while the culture and seeding of hCMEC/D3 cell line was done as explained in [12].
On the day of the experiment, the cells were seeded in 6-transwell plates (effective area: 4.2 cm2, pore size: 0.4 micron and pore density: 100 ± 10 × 106/cm2), which were supposed to be confluent, washed twice with HBSS, and transepithelial electrical resistance (TEER) was measured. If the TEER values were around 30–40 kΩ·cm2 [13] for hCMEC/D3 cells, around 130–150 kΩ·cm2 [13] for MDCK cells and around 120–140 kΩ·cm2 [13] for MDCK-MDR1 cells, then the integrity of the monolayers was considered appropriate, and three types of experiments were carried out according to [11,12]:
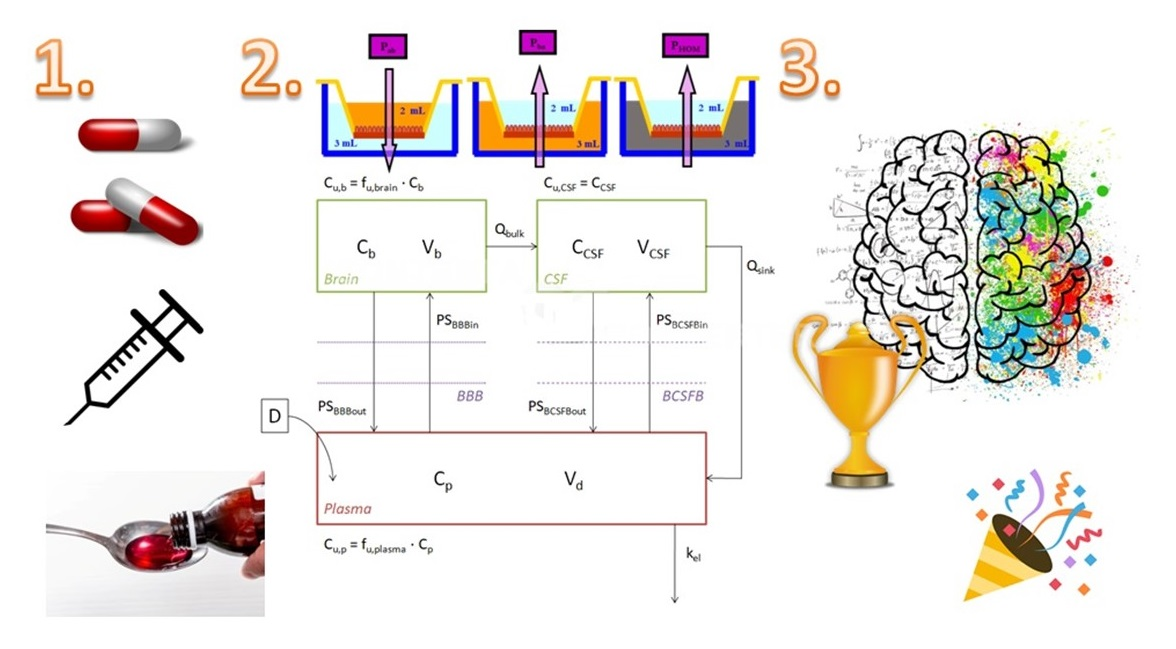
  • Standard AB. This experiment was designed for obtaining the apparent influx permeability (Papp A→B). The drug was dissolved in HBSS; this solution was put into the apical chamber of the transwell and the basolateral chamber was filled with cleaned HBSS. Four samples were taken from the basolateral chamber at pre-established times (15, 30, 60 and 90 min) [11,12]. Three replicates were carried out for each drug;
  • Standard BA. In this case, the montage was the opposite to the first condition and the basolateral chamber was filled with a drug solution in HBSS, while the apical chamber was filled with cleaned HBSS. Four samples were taken from the apical chamber at pre-established times (15, 30, 60 and 90 min) [11,12]. With this test, the apparent efflux permeability (Papp B→A) was obtained. Three replicates were carried out for each drug;
  • Brain homogenate BA. This last condition gives the free drug apparent efflux permeability (Papp HOM), as the drug is added to the basolateral chamber after being dissolved in a 1:3 pig brain homogenate:phosphate buffer (180 mM, pH 7.4) solution, and only the free fraction of drug will be able to cross to the apical chamber, where 4 samples were taken at pre-established times (15, 30, 60 and 90 min) [11,12]. Three replicates were carried out for each drug.
The neuroPK parameters (Kpuu,brain, fu,brain and Vu,brain) were obtained by means of the combination of the apparent permeabilities mentioned above with Equations (1), (3) and (2), respectively.
f u , b r a i n = P a p p   B A P a p p   H O M

2.3. HPLC Analysis of the Samples

Samples from brain homogenate experiments were diluted (50:50) with cold methanol to precipitate proteins, and all the samples were centrifuged at 10,000 rpm for 10 min. Then, the supernatants were analyzed by HPLC. An UV-HPLC equipment (Barcelona, Spain) (Waters 2695 separation module and Waters 2487 UV detector) with a column XBridge C18 (3.5 μM, 4.6 × 100 mm) (Barcelona, Spain), a flow rate of 1 mL/min, a run temperature of 30 °C and an injection volume of 90 μL was used for the analysis. Table S1 summarizes the rest of the chromatographic conditions. All analytical methods were validated and demonstrated to be adequate regarding linearity, accuracy, precision, selectivity and specificity.

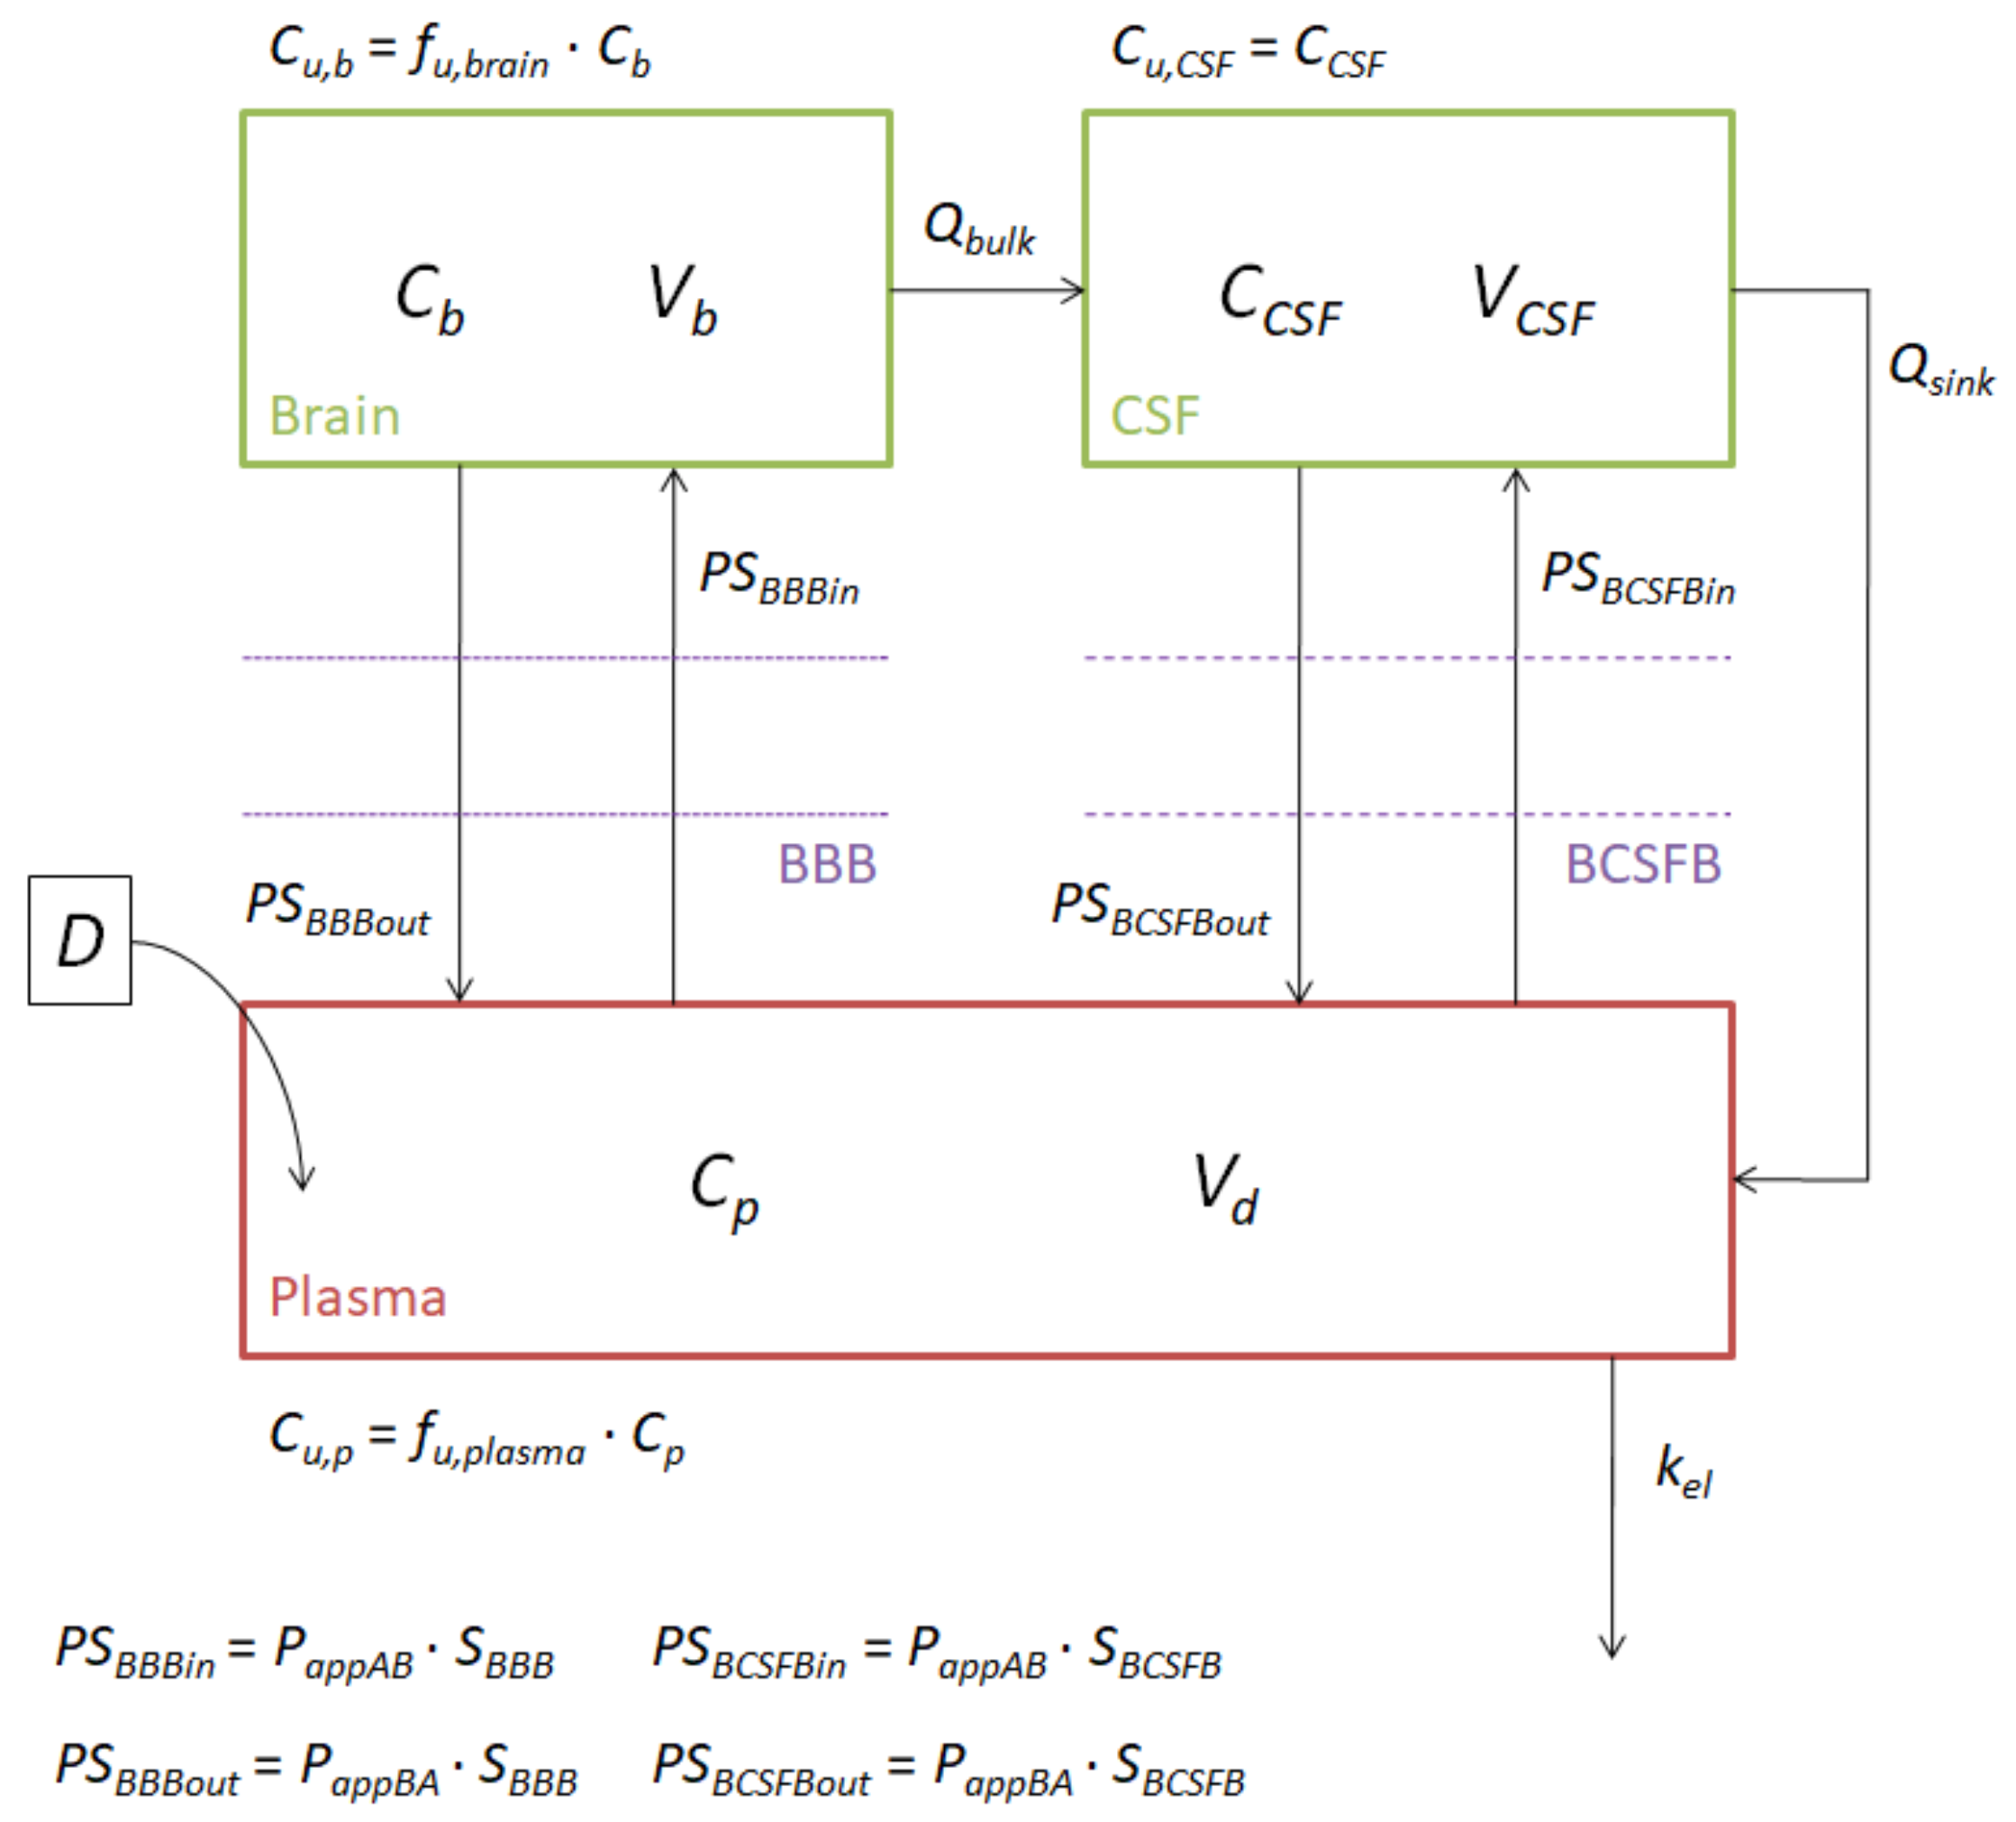
2.4. Model Construction

Figure 1 shows the scheme of the semi-physiological model. An extra absorption site was added when needed (if the available in vivo data were not from intravenous administration).
We defined one compartment for plasma and two compartments for the CNS (one representing the brain tissue itself and the other representing the CSF). According to the scheme, drugs can go in or out of the CNS through the BBB or through the BCSFB, depending on the area that they reach or leave (the tissue or the CSF). Additionally, it was considered that drugs can pass from brain tissue to the CSF following the bulk flow (Qbulk) of the ECF to the CSF, and they can also return to plasma with the drainage of the CSF (Qsink). As CSF is considered a clear liquid, all the drug concentration inside it was considered the unbound drug concentration, while in the plasma and brain tissue, the unbound concentrations were considered equal to the unbound fraction of the drug in that compartment multiplied by the total concentration (the fu,brain that was used in this calculation was obtained from the permeability studies). Influx and efflux clearances through the different brain barriers were obtained by multiplying the apparent permeabilities of the in vitro studies by the surface areas of those barriers. Differential Equations (4)–(6) describe the processes mentioned above for the administration of an intravenous single dose. The values of the physiological parameters, brain volume (Vb), CSF volume (VCSF), Qbulk, Qsink, BBB surface area (SBBB) and BCSFB surface area (SBCSFB) were fixed and equal for all drugs, according to Ball et al. (Vb = 1.28 cm3, VCSF = 0.25 cm3, Qbulk = 0.012 cm3/s, Qsink = 0.132 cm3/s, SBBB = 187.5 cm2) and Engelhard et al. (SBCSFB = 0.0375 cm2) [14,15].
V d · d C p d t = P S B B B i n · C u , p + P S B B B o u t · C u , b P S B C S F B i n · C u , p + P S B C S F B o u t · C C S F + Q s i n k · C C S F k e l · C p · V d
V b · d C b d t = P S B B B i n · C u , p P S B B B o u t · C u , b Q b u l k · C u , b
V C S F · d C C S F d t = P S B C S F B i n · C u , p P S B C S F B o u t · C C S F Q s i n k · C C S F + Q b u l k · C u , b
Plasma and brain concentration profiles were obtained from the literature [16,17,18,19,20] for the six drugs studied. Depending on the publication, the brain concentration profiles derived were for free drug in the brain, total drug in the brain or drug in the ECF (which was considered equivalent to free drug in the brain). The type of data found does not affect the objective of this study, as both free and total drug concentrations are defined in the model.
When the drug administration was performed extravascularly, Equation (7) was added to the model, and Equation (4) was substituted by Equation (8), in which ka is the absorption rate constant. On the other hand, if an intravenous infusion was the method of administration, Equation (4) was substituted by Equation (9), where k0 is the infusion rate constant.
d A d t = k a · A
V d · d C p d t = k a · A P S B B B i n · C u , p + P S B B B o u t · C u , b P S B C S F B i n · C u , p + P S B C S F B o u t · C C S F + Q s i n k · C C S F k e l · C p · V d
V d · d C p d t = k 0 P S B B B i n · C u , p + P S B B B o u t · C u , b P S B C S F B i n · C u , p + P S B C S F B o u t · C C S F + Q s i n k · C C S F k e l · C p · V d
Then, the plasma and brain profiles were adjusted to the model with the Berkeley-Madonna® software (Berkeley, CA, USA), assuming that three scaling factors were needed for transforming the in vitro data obtained from cell cultures into in vivo information (Equations (10)–(14)).
P S B B B i n = S C 1 · P a p p   A B · S B B B
P S B C S F B i n = S C 1 · P a p p   A B · S B C S F B
P S B B B o u t = S C 2 · P a p p   B A · S B B B
P S B C S F B o u t = S C 2 · P a p p   B A · S B C S F B
C u , b = S C 3 · f u , b r a i n · C b
Most mathematical predictive models use scaling factors to transform the in vitro data/parameters into in vivo data due to the different characteristics between the in vitro cells/tissues used and the whole organism; for example, physiological characteristics, such as the surface area available for transport. Therefore, every in vitro parameter used in the model needs to have a scaling factor [21,22]. The first and second scaling factors (SC1 and SC2) were used to adjust the in vitro apparent permeabilities to the physiological permeability, as in [14], because of the differences in terms of surface area and transporters between the in vitro tests and rat physiology. Moreover, the third scaling factor (SC3) was used to correct the possible deviation present in the in vitro fu,brain values, due to the different composition and behavior of the pig brain homogenate and a healthy rat brain. The use of scaling factors allows researchers to obtain an empiric approximation of how a drug accesses the brain. Later on, a refined mechanistic model may be obtained by including both passive and active transport parameters in the differential equations and the expression level differences between the in vitro and in vivo situation.
Table 1 shows the values of the rest of the PK parameters, which were used in the model and were different for each drug. Due to the difficulties of obtaining research articles with all the PK information for rats, in some cases, parameters had to be calculated from human data. The Vd of drugs marked with a + symbol (Table 1) was calculated using the human value (L/kg), and then multiplying it by the weight of the rats used in the studies (from which the plasma and brain profiles were obtained). The rats’ weights varied between 250 and 300 g.

2.5. Quantitative Structure–Property Relationships (QSPRs)

Once all the profiles were adjusted and the three scaling factors were defined for each drug, they were related with their lipophilicity in order to obtain three different QSPRs for each cell line. We are aware that the scaling factors could be influenced by several physicochemical properties, such as lipophilicity, molecular weight, polar surface area, pKa, etc.; nevertheless, the reduced number of compounds precluded the evaluation of complex models. As lipophilicity seems to be the main factor affecting membrane permeation, we selected this parameter to explore its influence. Table S2 shows the molecular and physicochemical properties of the six drugs studied, as well as the transporters for which they are substrates.
Finally, an internal validation of the model was performed to evaluate its predictability in the different cell lines. So, the adjusted scaling factors were substituted in the model by the ones predicted from the QSPRs, and the prediction error percentages (PE%) for brain Cmax and brain AUC were calculated according to Equation (15).
P E % = E x p e r i m e n t a l   v a l u e P r e d i c t e d   v a l u e E x p e r i m e n t a l   v a l u e · 100

3. Results

Apparent permeability values and the fu,brain obtained from the in vitro tests with MDCK, MDCK-MDR1 and hCMEC cell lines are summarized in Table 2. These values were used later as fixed parameters in the model for obtaining the simulated plasma and brain profiles (Figure 2).
As seen in Figure 2, the model is able to describe the behavior of the six model drugs, in terms of both plasma and brain concentration profiles, after adjusting the initial Vd, ka, kel and the scaling factors (SC1, SC2 and SC3), which were defined initially as one. Table 3 shows the values of the parameters mentioned above after being fitted for the different drugs and cell lines.
With the aim of seeing how accurate the adjustment was, the initial PE% values were calculated. The first row of Table 4 shows the mean PE% for brain Cmax and brain the AUC for each cell line; due to the similarity of all the values, it can be seen that the model adjusts properly to all the cell lines.
Figure 3 shows the three QSPRs developed for each cell line after combining the logP of each drug with the natural logarithm of each scaling factor (LnSC).
When the internal validation of the model was complete, the equations of each QSPR were used to calculate the predicted LnSC, which were transformed into SC and substituted into the model to obtain the simulated profiles. Figure 4 shows the simulated brain profiles and visual predictive checks for each drug after using the QSPR equations, and in the second row of Table 4, the PE% values for the Cmax and the AUC for these brain predictions are summarized.
Although all the PE% values were increased from the fitted profiles to the simulated ones, all of them remained below 50%, which can be considered appropriate due to the complexity of the model, which mixes in silico, in vitro and in vivo data for obtaining brain profiles. Furthermore, a clear tendency can be seen when both the PE% values of each cell line are added: as the complexity of the cell line increases, the error increases, which could be explained by the influence that transporters have on the SC of the drugs that are substrates of them, and not on the passive drugs.

4. Discussion

The development of new in vitro and mathematical tools able to predict concentration levels of drugs in humans is extremely interesting for pharmaceutical industries, as they can help avoid failures after huge investments of money, and they can also bypass ethical problems. With this aim, over many years, several researchers have worked on the development of new in vitro dissolution tools or in vitro–in vivo correlations in the field of oral absorption, and biowaivers have been highly legislated [30,31,32,33]. In terms of CNS medicine, although it is less regulated, the development of new PBPK models has become even more important, due to the difficulties in obtaining new treatments able to cross the BBB. The major problem, however, in obtaining this type of neuroPK tool is the lack of human in vivo data to compare with, as obtaining brain profiles is not as simple as obtaining plasma ones. So, in this work, a new PBPK model was developed as an initial tool to predict the brain levels of drugs in rats.
Table 2 shows the values of the apparent permeabilities (Papp A→B and Papp B→A) and the fu,brain obtained with the MDCK, the MDCK-MDR1 and the hCMEC/D3 cell lines. Papp A→B corresponds to the Clin of the drug through the BBB. With the combination of Papp A→B and Papp B→A, the Kpuu,brain can be obtained, and using Equation (2), the in vitro fu,brain parameter can be translated to Vu,brain. As such, the three most important neuroPK parameters (Clin, Kpuu,brain and Vu,brain) used to describe the rate and extent of drug delivery to the brain can be obtained with the same methodology, a fact that has already been highlighted in [11] and [12], investigations in which it was proven that the in vivo neuroPK parameters could be predicted from the in vitro ones. In 2013, the methodology was established in MDCK and MDCK-MDR1, cell lines and in 2021 the predictions were compared with the ones obtained in hCMEC/D3 using the same methodology; in all cases, an adequate r2 was obtained [11,12]. The Papp A→B, Papp B→A and fu,brain values in Table 2 are variable from one cell line to the other, which could be due to the morphological and physiological differences between them, in terms of both tight junctions and transporters [34,35,36].
For obtaining an ideal in vitro BBB model, an environment reflecting the extracellular matrix and the cells surrounding the endothelial cells that constitute the BBB vessels should be simulated. Nonetheless, this environment has not yet been obtained, and cell monolayers lack of pericytes, astrocytes, neurons or different constituents of the neuroglia vascular unit (NGVU). Because of this, in vitro models can express some of the different transporters present in the BBB, but not all. Furthermore, depending on the cell type, in vitro models can express more or less tight junctions, avoiding the passage of drugs through the BBB [37]. The main advantage of cell monolayers is their utility for high-throughput screening [38].
The variability in the in vitro parameters is also reflected when the profiles are fitted with Berkeley-Madonna® and the three scaling factors are obtained for each cell line, as seen in Table 3. The use of scaling factors when establishing a PBPK model of the CNS was previously seen in other studies, as in [14]. Ball et al. defined two scaling factors for transforming in vitro Caco-2 permeability values into the influx and efflux BBB rate constants [14]. In this work, three different scaling factors were defined:
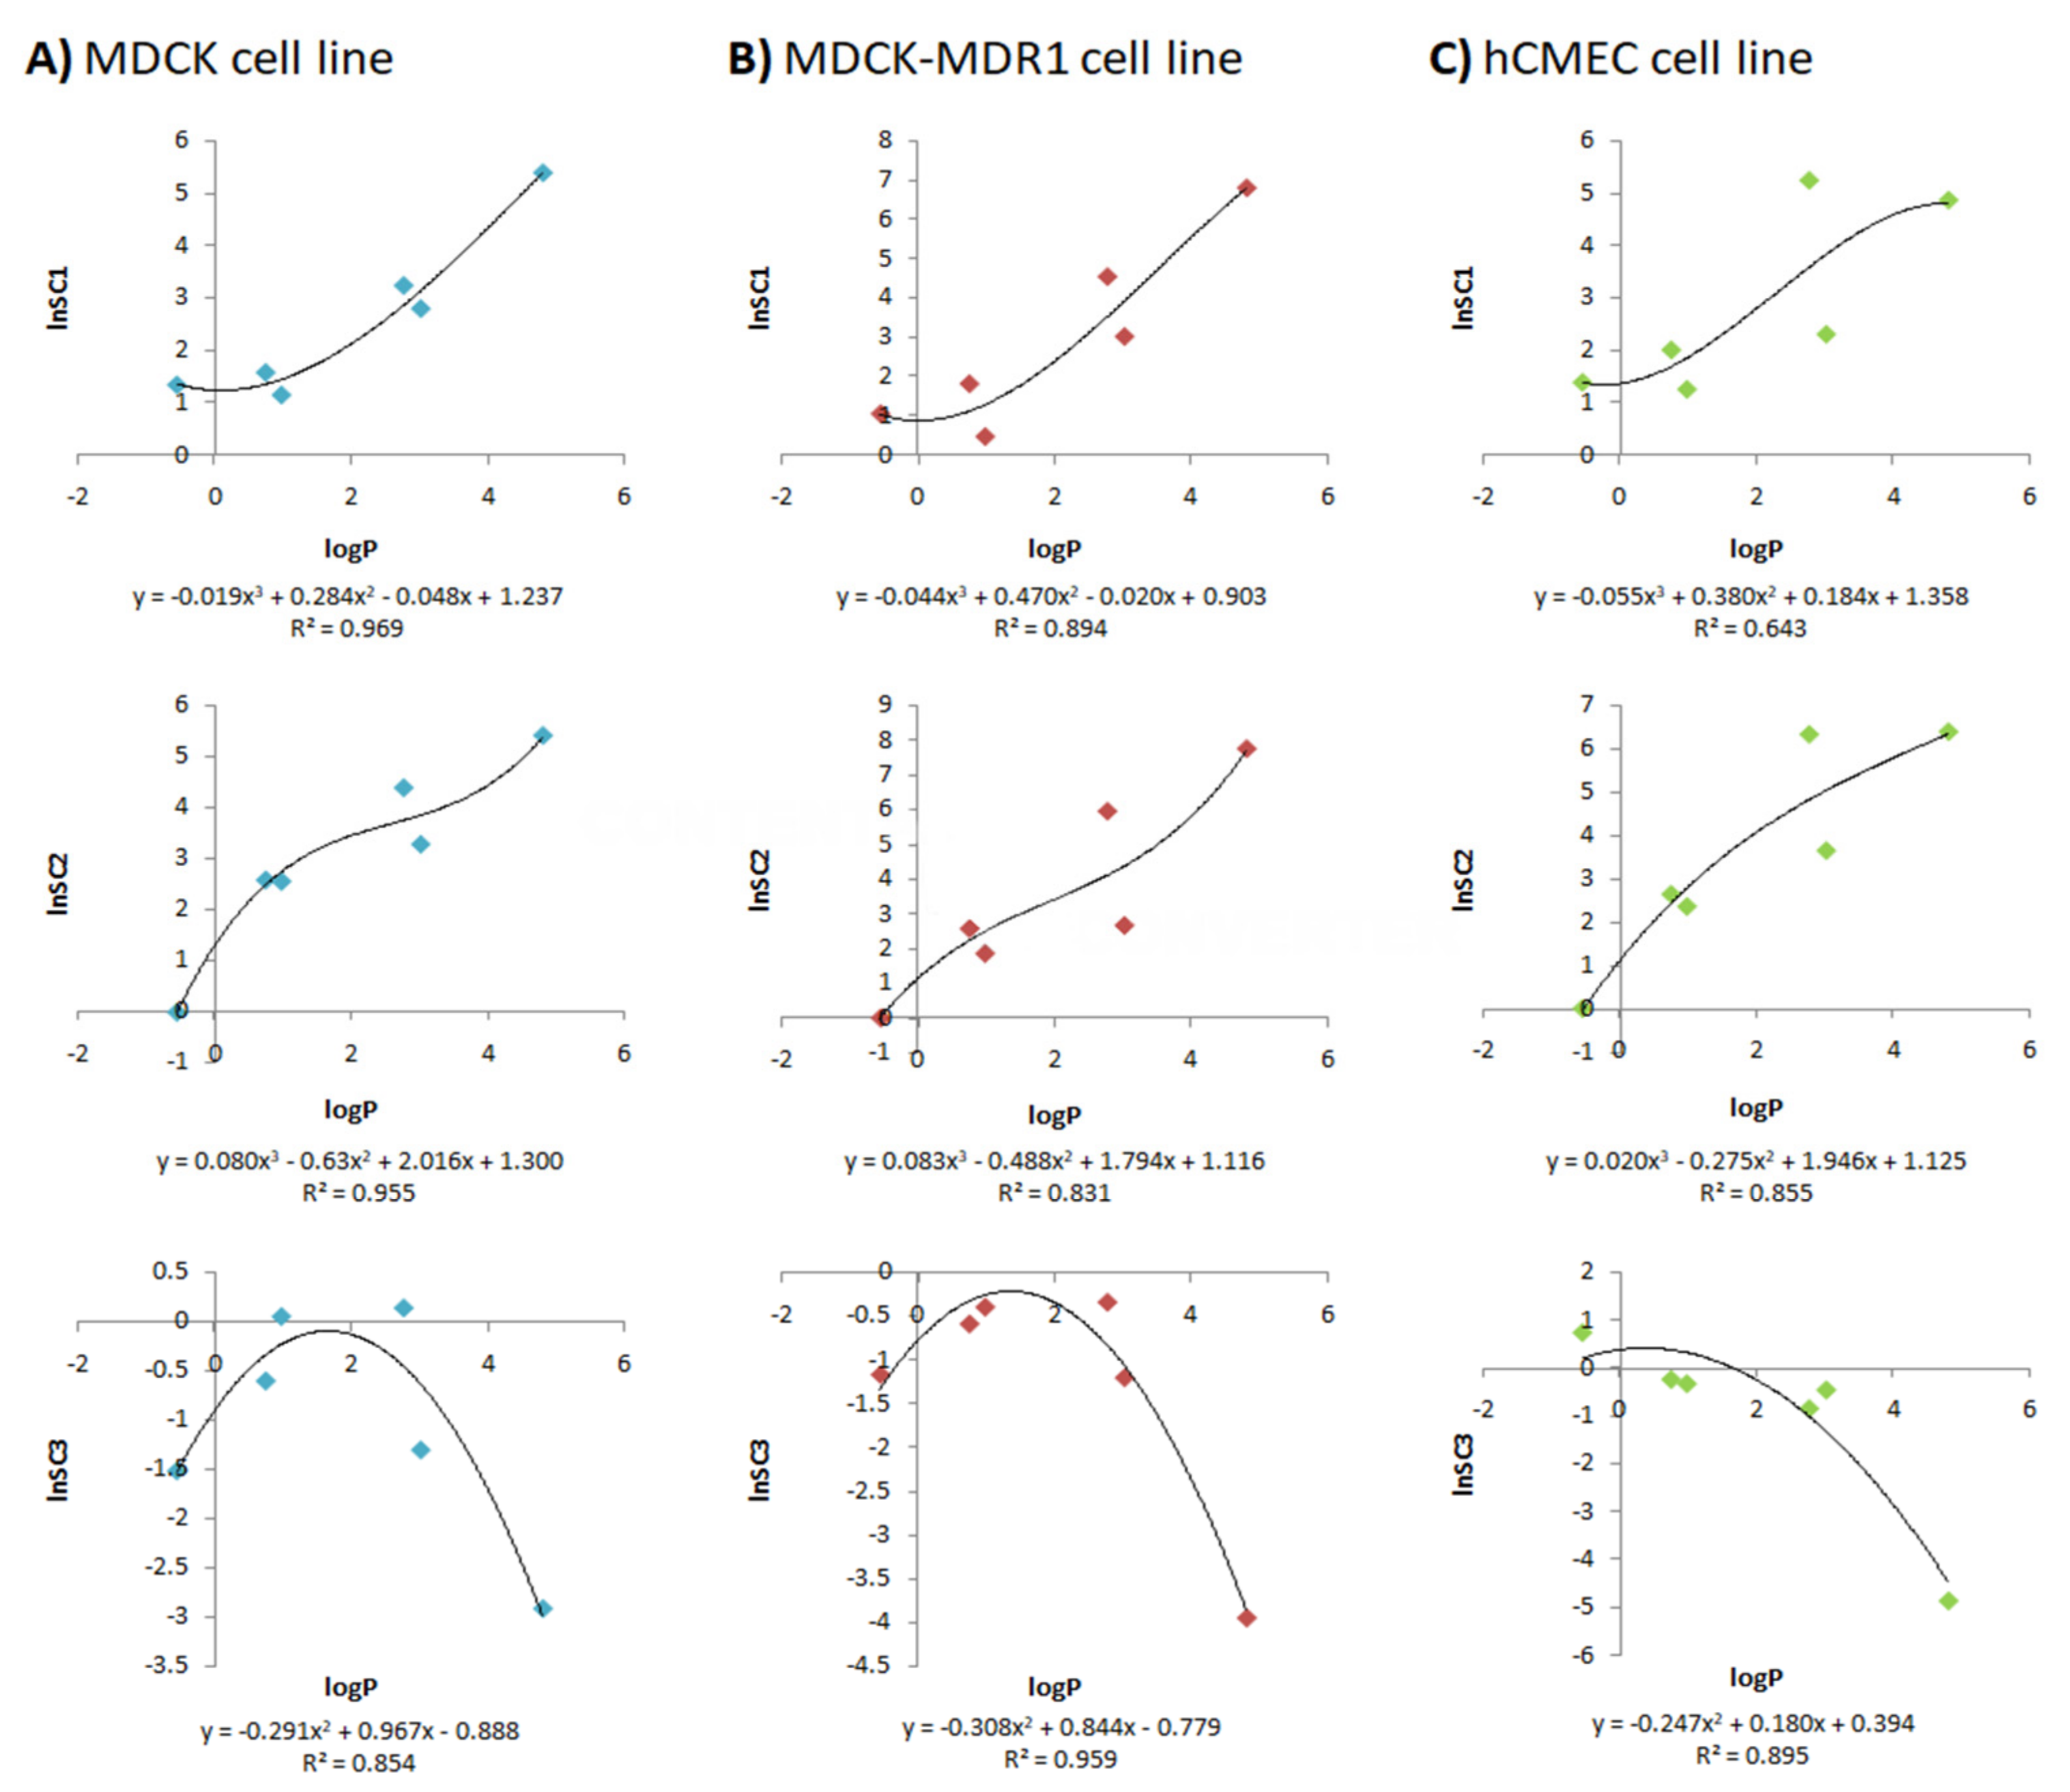
  • SC1 and SC2 were equivalent to those defined by Ball et al., as they transform the apparent permeabilities of the MDCK, MDCK-MDR1 and hCMEC/D3 cell lines into influx and efflux clearances through the BBB. The main justification for introducing these scaling factors is the difference between the rat BBB and the in vitro monolayers. For instance, in terms of tight junctions, it has been proven that primary rat brain endothelial cell cultures have high levels of occludin, endothelial cell-specific adhesion molecule (ESAM) and claudin-5, while in MDCK and MDCK-MDR1 cells, the most abundant proteins are claudin-1 and claudin-2, and in hCMEC/D3, claudin-11 [34]. Furthermore, there are differences in the morphology of the different cell lines and in transporter expressions [34];
  • The reasons for adding SC3, which re-scale the in vitro fu,brain, were, on the one hand, to bypass the inter-species differences, as the brain homogenate used in the in vitro studies came from pigs and the model was to be used to predict rat brain profiles, and, on the other hand, to correct the possible error present in the parameter due to the homogenization process, as brain structures are broken and membrane and internal proteins get mixed.
These scaling factors have been shown to allow the model to fit to the profiles regardless of the origin of the in vitro data, as seen in Figure 2, where the MDCK, MDCK-MDR1 and hCMEC/D3 cell lines are all overlapping in both plasma and brain profiles. Nevertheless, these scaling factors are not useful if they cannot be known in advance when a new drug is developed, because the brain profiles could not be predicted with the current model. Because of this, three different QSPRs were developed for each cell line (Figure 3), relating the lipophilicity of the drugs to the natural logarithm of the scaling factors; thus, in the future, the scaling factors for a new drug could be predicted from its logP.
In Figure 3, two clear non-linear tendencies can be seen: for SC1 and SC2, as the lipophilicity of drugs increases, the value of the scaling factors increases too; for SC3, the relationship follows a parabolic function, and, firstly, the value of the scaling factor increases with logP, but then it arrives to a top zone, and then it decreases.
Sigmoidal and parabolic relationships with lipophilicity have been described for parameters such as intestinal and gastric membrane permeability [39,40,41]. In the case of the intestinal barrier, its lipidic nature favors the permeation of lipidic compounds up to the limit, due to unstirred water layer diffusion. We have not observed any asymptote in our correlations, but this could be due to the moderate lipophilicity of the assayed drugs. In the case of the gastric barrier, the combined alternate presence of hydrophilic and lipophilic layers determines a parabolic correlation between lipophilicity and gastric permeation. As SC3 is related to the differences in composition of the used brain homogenates, which contain different balances of hydrophilic/lipophilic components, a parabolic relationship is a reasonable approach.
In all cases, the tendency is clear and, except for one of the QSPRs (the one for the SC1 in the hCMEC/D3 cell line), the r2 of all of them is greater than 0.80. logP was chosen as the property to relate to the scaling factors because it is one of the major descriptors used by researchers for both calculating BBB permeability [10,42] and obtaining a theoretical unbound fraction of the drug in plasma or brain [42,43].
However, to conclude on whether a given mathematical model is good enough to fulfil its design, it is not enough to look at the r2 parameter of its correlations, but it is necessary to evaluate its predictability by internal validation, comparing the predictions that the model gives with the experimental data that were used for obtaining it. Figure 4 shows, therefore, the simulated brain profiles for the drug studied. In this Figure, it can be seen that there are differences in the predictions between the different cell lines; in fact, when the fitted profiles were presented (Figure 2), all the MDCK, MDCK-MDR1 and hCMEC/D3 profiles were shown to be overlapping, but now, in some cases, they are quite different. Regarding the MDCK cell line, it can be seen that the simulated profiles are, in all drugs, near to the experimental line; meanwhile, the worst prediction for the MDCK-MDR1 cells is found to be that for carbamazepine, a drug substrate of the ABCC2 and RALBP1 transporters [25], and in the case of hCMEC/D3, the zolpidem (passively transported [25]) profile is clearly overpredicted. These clear prediction errors in Figure 4, whose quantitative values (from Equation (15)) are shown in Table 4, confirm that the simulated profiles are worse than the fitted ones, and the best profiles are the ones obtained with the MDCK cell line.
The MDCK cell line is a fairly simple model of BBB, defined as a surrogate for in vivo permeability studies because of its tight junctions, but it does not have significant levels of any BBB transporter [6]. Because of this, some transfected cell lines of MDCK have been created, such as the MDCK-MDR1, which has the benefits of MDCK’s tight junctions, but incorporates the P-glycoprotein (ABCB1) efflux transporter, or the MDCK-MRP2 cell line, which incorporates the multidrug resistance-associated protein 2 transporter (ABCC2) [44]. On the other hand, hCMEC/D3 cells are much more complex, and, despite being less tight in vitro, they contain many more transporters [34,45]. As such, it is thought that they are the most reliable for obtaining brain profile predictions. However, in this study, it was seen that, as the complexity of the cell line was increased, the predictions deteriorated (Table 4). A potential explanation for this fact is that the proposed PBPK model does not include any active transporter in its differential equations, so all the active components of BBB penetration are summarized in the in vitro parameters employed (Papp A→B, Papp B→A and fu,brain), and thus in the three scaling factors. The model would be more physiological if the active components were included in the equations, but the passive pathway with a scaling factor was assumed as a simplification, because only one concentration of each drug was tested, and for modeling the active transport, at least three concentrations of each drug must be studied [21]. Thus, with the scaling factor, an over-parameterization of the model was avoided. Different types of drugs were used in this study (Table S2); some of them with theoretical passive access to the BBB and others of different transporters. In consequence, when the MDCK cell line is used, as it has no transporters, all the scaling factors contain only a passive component. On the other hand, in the other two cell models, the scaling factors vary depending on their transport; the passive drugs will only have these components in their SCs, while the drugs that interact with a transporter will have both the passive and active components in their SCs. Furthermore, the active component of the SC will be different depending on the transporter, so in the hCMEC/D3 cell line, in which there are more transporters, the variability will be greater than in MDCK-MDR1, where the only significant transporter is the P-gp.
In summary, in this study, a new PBPK model, which is able to predict the brain profiles of different types of drugs (both passive and substrate of transporters), has been developed for the cell line MDCK. For obtaining a predictive model for the other two cell lines, two future approaches could be followed: (A) introducing the active component of BBB transport into the model or (B) studying more drugs and dividing them into groups depending on the transporter that they bind to, so a different QSPR could be obtained for each transporter acting in the BBB, and its active component would be summarized in each SC.

5. Conclusions

A new semi-physiological mathematical model, which includes the three most important factors in brain delivery (barrier transport, the disposition within the brain and drug–brain binding) and is able to predict brain concentration levels in rats for different drugs, has been developed. The best predictions obtained are those that used in vitro data from the MDCK cell line, so these cells together with the new mathematical model could be used as a screening tool by the pharmaceutical industry when a new treatment for a neurological disorder is developed. The model could also be used with data from other more complex cell lines, such as MDCK-MDR1 or hCMEC/D3, although it has been proven that the influence of transporters can bias their predictions. Additional studies are needed, with drug batteries of different transporter substrates, in order to refine these results.

Supplementary Materials

The following are available online at https://www.mdpi.com/article/10.3390/pharmaceutics13091402/s1, Table S1: Chromatographic conditions. Table S2: Molecular and physicochemical properties and transporter information for the studied drugs.

Author Contributions

Conceptualization, M.B. and M.G.-A.; methodology, B.S.-D. and I.G.-A.; software, B.S.-D.; validation, B.S.-D., M.B., M.G.-A. and I.G.-A.; formal analysis, B.S.-D.; investigation, B.S.-D. and I.G.-A.; resources, M.B.; data curation, I.G.-A.; writing—original draft preparation, B.S.-D.; writing—review and editing, M.B., M.G.-A. and I.G.-A.; visualization, B.S.-D.; supervision, M.B., M.G.-A. and I.G.-A.; project administration, I.G.-A.; funding acquisition, M.B. All authors have read and agreed to the published version of the manuscript.

Funding

This research was funded by Agencia Estatal Investigación and European Union, through FEDER (Fondo Europeo de Desarrollo Regional), under the project: “Modelos in vitro de evaluación biofarmacéutica” [SAF2016-78756 (AEI/FEDER, EU)]. B.S.-D. received a grant from the Ministry of Science, Innovation and Universities of Spain [FPU17/00530] and an international mobility grant from Miguel Hernandez University [0762/19].

Institutional Review Board Statement

Not applicable.

Informed Consent Statement

Not applicable.

Data Availability Statement

The authors confirm that the data supporting the findings of this study are available within the article and its supplementary material.

Conflicts of Interest

The authors declare no conflict of interest. The funders had no role in the design of the study; in the collection, analyses, or interpretation of data; in the writing of the manuscript, or in the decision to publish the results.

References

  1. Telano, L.N.; Baker, S. Physiology, Cerebral Spinal Fluid (CSF); StatPearls Publishing: Treasure Island, FL, USA, 2018. [Google Scholar]
  2. Vendel, E.; Rottschäfer, V.; de Lange, E.C.M. The need for mathematical modelling of spatial drug distribution within the brain. Fluids Barriers CNS 2019, 16, 12. [Google Scholar] [CrossRef]
  3. Abbot, N.J.; Patabendige, A.A.K.; Dolman, D.E.M.; Yusof, S.R.; Begley, D.J. Structure and function of the blood-brain barrier. Neurobiol. Dis. 2010, 37, 13–25. [Google Scholar] [CrossRef]
  4. Sánchez-Dengra, B.; González-Álvarez, I.; Bermejo, M.; González-Álvarez, M. Nanomedicine in the Treatment of Pathologies of the Central Nervous System Advances in Nanomedicine. In Advances in Nanomedicine; Open Access Ebooks: Las Vegas, NV, USA, 2020. [Google Scholar]
  5. Hammarlund-Udenaes, M.; Fridén, M.; Syvänen, S.; Gupta, A. On the rate and extent of drug delivery to the brain. Pharm. Res. 2008, 25, 1737–1750. [Google Scholar] [CrossRef] [PubMed] [Green Version]
  6. Mangas-Sanjuan, V.; González-Alvarez, M.; Gonzalez-Alvarez, I.; Bermejo, M. Drug penetration across the blood-brain barrier: An overview. Ther. Deliv. 2010, 1, 535–562. [Google Scholar] [CrossRef] [PubMed]
  7. Dagenais, C.; Graff, C.L.; Pollack, G.M. Variable modulation of opioid brain uptake by P-glycoprotein in mice. Biochem. Pharmacol. 2004, 67, 269–276. [Google Scholar] [CrossRef]
  8. Loryan, I.; Sinha, V.; Mackie, C.; van Peer, A.; Drinkenburg, W.; Vermeulen, A.; Morrison, D.; Monshouwer, M.; Heald, D.; Hammarlund-Udenaes, M. Mechanistic understanding of brain drug disposition to optimize the selection of potential neurotherapeutics in drug discovery. Pharm. Res. 2014, 31, 2203–2219. [Google Scholar] [CrossRef] [PubMed]
  9. Carpenter, T.S.; Kirshner, D.A.; Lau, E.Y.; Wong, S.E.; Nilmeier, J.P.; Lightstone, F.C. A Method to Predict Blood-Brain Barrier Permeability of Drug-Like Compounds Using Molecular Dynamics Simulations. Biophys. J. 2014, 107, 630–641. [Google Scholar] [CrossRef] [PubMed] [Green Version]
  10. Geldenhuys, W.J.; Mohammad, A.S.; Adkins, C.E.; Lockman, P.R. Molecular determinants of blood-brain barrier permeation. Ther. Deliv. 2015, 6, 961–971. [Google Scholar] [CrossRef]
  11. Mangas-Sanjuan, V.; González-Álvarez, I.; González-Álvarez, M.; Casabó, V.G.; Bermejo, M. Innovative in vitro method to predict rate and extent of drug delivery to the brain across the blood-brain barrier. Mol. Pharm. 2013, 10, 3822–3831. [Google Scholar] [CrossRef]
  12. Sánchez-Dengra, B.; González-Álvarez, I.; Sousa, F.; Bermejo, M.; González-Álvarez, M.; Sarmento, B. In vitro model for predicting the access and distribution of drugs in the brain using hCMEC/D3 cells. Eur. J. Pharm. Biopharm. 2021, 163, 120–126. [Google Scholar] [CrossRef]
  13. Mangas-Sanjuan, V.; Gonzalez-Alvarez, M.; Gonzalez-Alvarez, I.; Bermejo, M. In vitro methods for assessing drug access to the brain. In Advances in Non-Invasive Drug Delivery to the Brain; Future Science Ltd.: London, UK, 2015; pp. 44–61. ISBN 9781909453937. [Google Scholar]
  14. Ball, K.; Bouzom, F.; Scherrmann, J.M.; Walther, B.; Declèves, X. A physiologically based modeling strategy during preclinical CNS drug development. Mol. Pharm. 2014, 11, 836–848. [Google Scholar] [CrossRef]
  15. Engelhard, H.H.; Arnone, G.D.; Mehta, A.I.; Nicholas, M.K. Biology of the Blood-Brain and Blood-Brain Tumor Barriers. In Handbook of Brain Tumor Chemotherapy, Molecular Therapeutics, and Immunotherapy: Second Edition; Elsevier Inc.: Amsterdam, The Netherlands, 2018; pp. 113–125. ISBN 9780128121009. [Google Scholar]
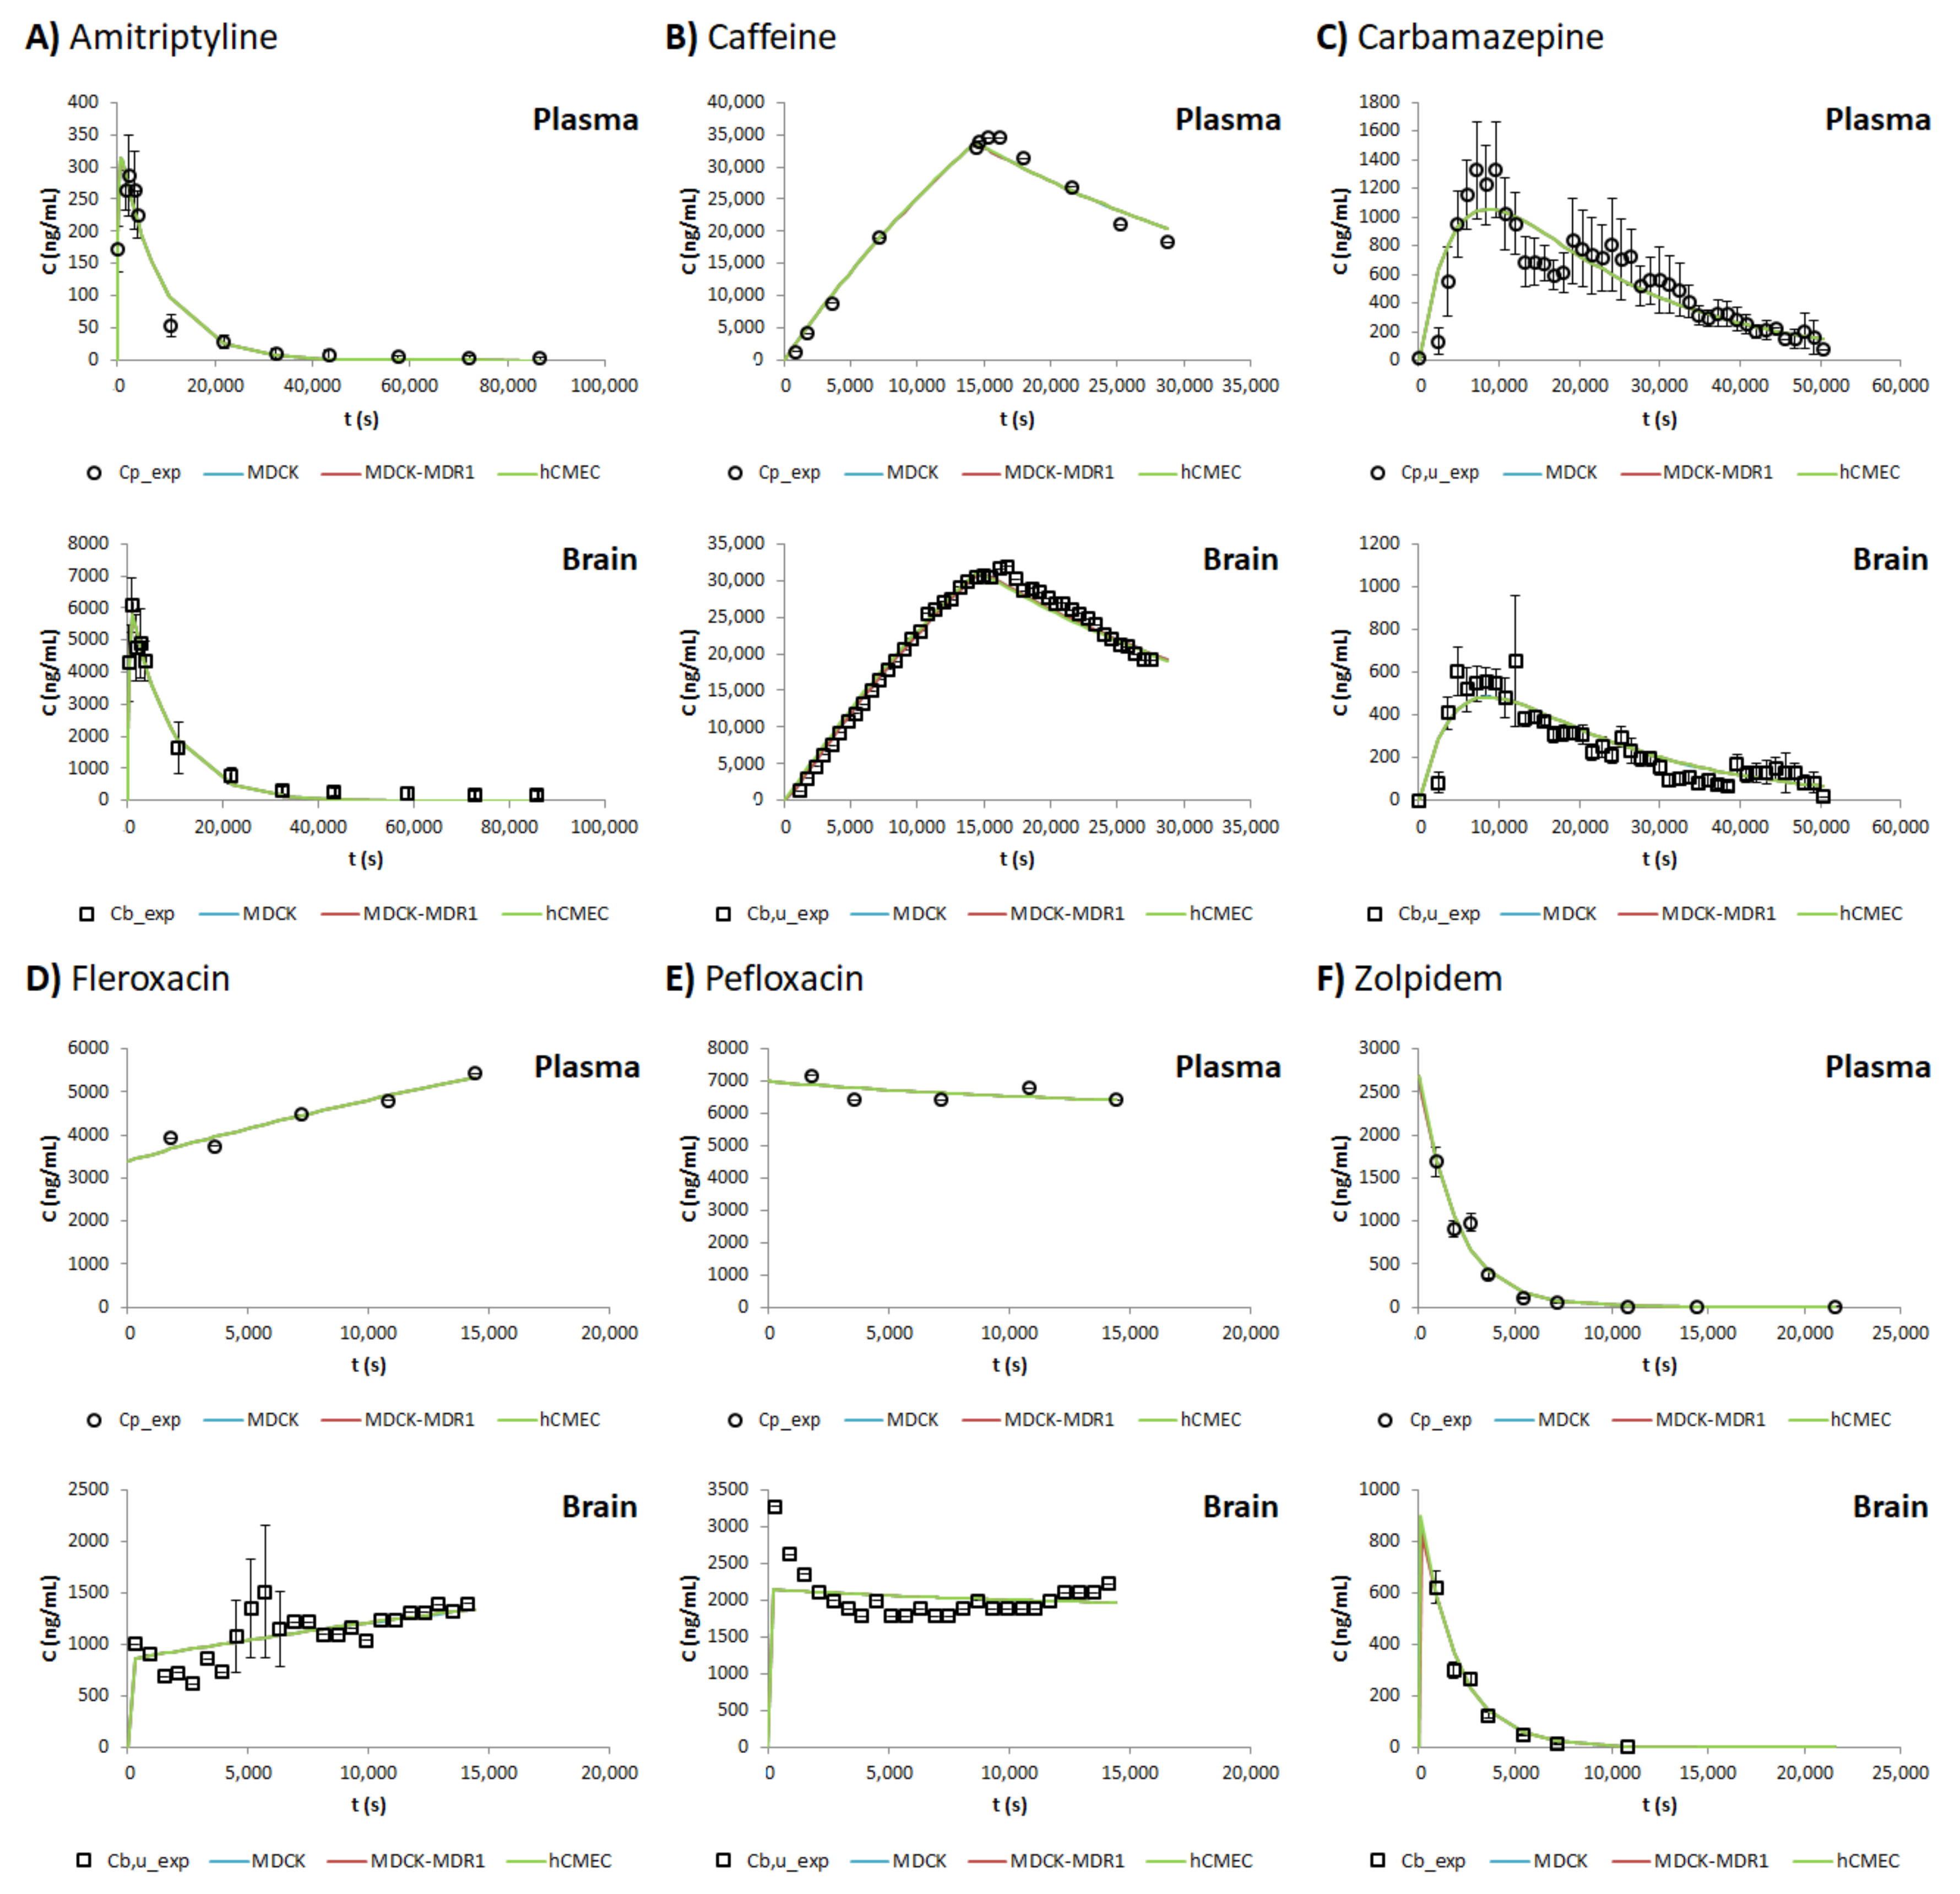
  16. Coudore, F.; Besson, A.; Eschalier, A.; Lavarenne, J.; Fialip, J. Plasma and brain pharmacokinetics of amitriptyline and its demethylated and hydroxylated metabolites after one and six half-life repeated administrations to rats. Gen. Pharmacol. 1996, 27, 215–219. [Google Scholar] [CrossRef]
  17. Hansen, D.K.; Scott, D.O.; Otis, K.W.; Lunte, S.M. Comparison of in vitro BBMEC permeability and in vivo CNS uptake by microdialysis sampling. J. Pharm. Biomed. Anal. 2002, 27, 945–958. [Google Scholar] [CrossRef]
  18. Graumlich, J.F.; McLaughlin, R.G.; Birkhahn, D.; Shah, N.; Burk, A.; Jobe, P.C.; Dailey, J.W. Subcutaneous microdialysis in rats correlates with carbamazepine concentrations in plasma and brain. Epilepsy Res. 2000, 40, 25–32. [Google Scholar] [CrossRef]
  19. Ooie, T.; Terasaki, T.; Suzuki, H.; Sugiyama, Y. Quantitative brain microdialysis study on the mechanism of quinolones distribution in the central nervous system. Drug Metab. Dispos. 1997, 25, 784–789. [Google Scholar] [PubMed]
  20. Garrigou-Gadenne, D.; Burke, J.T.; Durand, A.; Depoortere, H.; Thénot, J.P.; Morselli, P.L. Pharmacokinetics, brain distribution and pharmaco-electrocorticographic profile of zolpidem, a new hypnotic, in the rat. J. Pharmacol. Exp. Ther. 1989, 248, 1283–1288. [Google Scholar] [PubMed]
  21. González-Alvarez, I.; Fernández-Teruel, C.; Casabó-Alós, V.G.; Garrigues, T.M.; Polli, J.E.; Ruiz-García, A.; Bermejo, M. In situ kinetic modelling of intestinal efflux in rats: Functional characterization of segmental differences and correlatlon with in vitro results. Biopharm. Drug Dispos. 2007, 28, 229–239. [Google Scholar] [CrossRef]
  22. Fernandez-Teruel, C.; Gonzalez-Alvarez, I.; Casabó, V.; Ruiz-Garcia, A.; Bermejo, B. Kinetic modelling of the intestinal transport of sarafloxacin. Studies in situ in rat and in vitro in Caco-2 cells. J. Drug Target. 2005, 13, 199–212. [Google Scholar] [CrossRef] [PubMed]
  23. Fridén, M.; Gupta, A.; Antonsson, M.; Bredberg, U.; Hammarlund-Udenaes, M. In vitro methods for estimating unbound drug concentrations in the brain interstitial and intracellular fluids. Drug Metab. Dispos. 2007, 35, 1711–1719. [Google Scholar] [CrossRef] [Green Version]
  24. Kodaira, H.; Kusuhara, H.; Fujita, T.; Ushiki, J.; Fuse, E.; Sugiyama, Y. Quantitative evaluation of the impact of active efflux by P-glycoprotein and breast cancer resistance protein at the blood-brain barrier on the predictability of the unbound concentrations of drugs in the brain using cerebrospinal fluid concentration as a. J. Pharmacol. Exp. Ther. 2011, 339, 935–944. [Google Scholar] [CrossRef] [Green Version]
  25. DrugBank DrugBank. Available online: https://www.drugbank.ca/ (accessed on 14 May 2020).
  26. Remmel, R.P.; Sinz, M.W.; Cloyd, J.C. Dose-Dependent Pharmacokinetics of Carbamazepine in Rats: Determination of the Formation Clearance of Carbamazepine-10,11-epoxide. Pharm. Res. An Off. J. Am. Assoc. Pharm. Sci. 1990, 7, 513–517. [Google Scholar] [CrossRef]
  27. Weidekamm, E.; Portmann, R.; Suter, K.; Partos, C.; Dell, D.; Lucker, P.W. Single- and multiple-dose pharmacokinetics of fleroxacin, a trifluorinated quinolone, in humans. Antimicrob. Agents Chemother. 1987, 31, 1909–1914. [Google Scholar] [CrossRef] [Green Version]
  28. Bulitta, J.B.; Jiao, Y.; Landersdorfer, C.B.; Sutaria, D.S.; Tao, X.; Shin, E.; Höhl, R.; Holzgrabe, U.; Stephan, U.; Sörgel, F. Comparable bioavailability and disposition of pefloxacin in patients with cystic fibrosis and healthy volunteers assessed via population pharmacokinetics. Pharmaceutics 2019, 11, 323. [Google Scholar] [CrossRef] [PubMed] [Green Version]
  29. Chartrand, S.A. Quinolones in Animal Models of Infection. In The New Generation of Quinolones; Siporin, C., Heifetz, C., Domagala, J., Eds.; Marcel Dekker: New York, NY, USA, 1990; ISBN 0-8247-8224-0. [Google Scholar]
  30. Bransford, P.; Cook, J.; Gupta, M.; Haertter, S.; He, H.; Ju, R.; Kanodia, J.; Lennernäs, H.; Lindley, D.; Polli, J.E.; et al. ICH M9 Guideline in Development on Biopharmaceutics Classification System-Based Biowaivers: An Industrial Perspective from the IQ Consortium. Mol. Pharm. 2020, 17, 361–372. [Google Scholar] [CrossRef] [PubMed]
  31. EMA-Committee for Medicinal Products for Human Use (CHMP). Guideline on the Pharmacokinetic and Clinical Evaluation of Modified Release Dosage Forms (EMA/CPMP/EWP/280/96 Corr1); European Medicines Agency: London, UK, 2014. [Google Scholar]
  32. Ruiz Picazo, A.; Martinez-Martinez, M.T.; Colón-Useche, S.; Iriarte, R.; Sánchez-Dengra, B.; González-Álvarez, M.; García-Arieta, A.; González-Álvarez, I.; Bermejo, M. In Vitro Dissolution as a Tool for Formulation Selection: Telmisartan Two-Step IVIVC. Mol. Pharm. 2018, 15, 2307–2315. [Google Scholar] [CrossRef] [PubMed]
  33. Figueroa-Campos, A.; Sánchez-Dengra, B.; Merino, V.; Dahan, A.; González-Álvarez, I.; García-Arieta, A.; González-Álvarez, M.; Bermejo, M. Candesartan Cilexetil In Vitro-In Vivo Correlation: Predictive Dissolution as a Development Tool. Pharmaceutics 2020, 12, 633. [Google Scholar] [CrossRef]
  34. Veszelka, S.; Tóth, A.; Walter, F.R.; Tóth, A.E.; Gróf, I.; Mészáros, M.; Bocsik, A.; Hellinger, É.; Vastag, M.; Rákhely, G.; et al. Comparison of a rat primary cell-based blood-brain barrier model with epithelial and brain endothelial cell lines: Gene expression and drug transport. Front. Mol. Neurosci. 2018, 11. [Google Scholar] [CrossRef]
  35. Weksler, B.; Romero, I.A.; Couraud, P.O. The hCMEC/D3 cell line as a model of the human blood brain barrier. Fluids Barriers CNS 2013, 10. [Google Scholar] [CrossRef] [PubMed] [Green Version]
  36. Garberg, P.; Ball, M.; Borg, N.; Cecchelli, R.; Fenart, L.; Hurst, R.D.; Lindmark, T.; Mabondzo, A.; Nilsson, J.E.; Raub, T.J.; et al. In vitro models for the blood-brain barrier. Toxicol. Vitr. 2005, 19, 299–334. [Google Scholar] [CrossRef]
  37. Molino, Y.; Jabès, F.; Lacassagne, E.; Gaudin, N.; Khrestchatisky, M. Setting-up an In Vitro Model of Rat Blood-brain Barrier (BBB): A Focus on BBB Impermeability and Receptor-mediated Transport. J. Vis. Exp. 2014, 88, 51278. [Google Scholar] [CrossRef] [PubMed] [Green Version]
  38. Bagchi, S.; Chhibber, T.; Lahooti, B.; Verma, A.; Borse, V.; Jayant, R.D. In-vitro blood-brain barrier models for drug screening and permeation studies: An overview. Drug Des. Devel. Ther. 2019, 13, 3591–3605. [Google Scholar] [CrossRef] [Green Version]
  39. Bermejo, M.; Avdeef, A.; Ruiz, A.; Nalda, R.; Ruell, J.A.; Tsinman, O.; González, I.; Fernández, C.; Sánchez, G.; Garrigues, T.M.; et al. PAMPA-A drug absorption in vitro model: 7. Comparing rat in situ, Caco-2, and PAMPA permeability of fluoroquinolones. Eur. J. Pharm. Sci. 2004, 21, 429–441. [Google Scholar] [CrossRef]
  40. Garrigues, T.M.; Pérez-Varona, A.T.; Climent, E.; Bermejo, M.V.; Martín-Villodre, A.; Plá-Delfina, J.M. Gastric absorption of acidic xenobiotics in the rat: Biophysical interpretation of an apparently atypical behaviour. Int. J. Pharm. 1990, 64, 127–138. [Google Scholar] [CrossRef]
  41. Sánchez-Castaño, G.; Ruíz-García, A.; Bañón, N.; Bermejo, M.; Merino, V.; Freixas, J.; Garriguesx, T.M.; Plá-Delfina, J.M. Intrinsic absolute bioavailability prediction in rats based on in situ absorption rate constants and/or in vitro partition coefficients: 6-Fluoroquinolones. J. Pharm. Sci. 2000, 89, 1395–1403. [Google Scholar] [CrossRef]
  42. Lanevskij, K.; Dapkunas, J.; Juska, L.; Japertas, P.; Didziapetris, R. QSAR analysis of blood-brain distribution: The influence of plasma and brain tissue binding. J. Pharm. Sci. 2011, 100, 2147–2160. [Google Scholar] [CrossRef] [PubMed]
  43. Watanabe, R.; Esaki, T.; Kawashima, H.; Natsume-Kitatani, Y.; Nagao, C.; Ohashi, R.; Mizuguchi, K. Predicting Fraction Unbound in Human Plasma from Chemical Structure: Improved Accuracy in the Low Value Ranges. Mol. Pharm. 2018, 15, 5302–5311. [Google Scholar] [CrossRef] [PubMed] [Green Version]
  44. Tang, F.; Horie, K.; Borchardt, R.T. Are MDCK cells transfected with the human MRP2 gene a good model of the human intestinal mucosa? Pharm. Res. 2002, 19, 773–779. [Google Scholar] [CrossRef] [PubMed]
  45. Gomes, M.J.; Mendes, B.; Martins, S.; Sarmento, B. Cell-based in vitro models for studying blood-brain barrier (BBB) permeability. In Concepts and Models for Drug Permeability Studies: Cell and Tissue Based In Vitro Culture Models; Elsevier Inc.: Amsterdam, The Netherlands, 2015; pp. 169–188. ISBN 9780081001141. [Google Scholar]
Figure 1. PBPK model scheme.
Pharmaceutics 13 01402 g001
Figure 2. Experimental and fitted plasma and brain profiles for each drug and cell line studied: (A) Amitriptyline, (B) Caffeine, (C) Carbamazepine, (D) Fleroxacin, (E) Pefloxacin and (F) Zolpidem. Cp_exp = Experimental total plasma concentration; Cp,u_exp = Experimental unbound plasma concentration; Cb_exp = Experimental total brain concentration; Cb,u_exp = Experimental unbound brain concentration.
Pharmaceutics 13 01402 g002
Figure 3. QSPRs developed for each cell line after combining the logP of each drug with the natural logarithm of each scaling factor (LnSC1, LnSC2, LnSC3): (A) MDCK cell line, (B) MDCK-MDR1 cell line and (C) hCMEC/D3 cell line.
Pharmaceutics 13 01402 g003
Figure 4. Simulated brain profiles and visual predictive check (VPC, shaded areas above and below fitted lines) for each drug and cell line, after using the QSPR equations: (A) Amitriptyline, (B) Caffeine, (C) Carbamazepine, (D) Fleroxacin, (E) Pefloxacin and (F) Zolpidem. Cb_exp = Experimental total brain concentration; Cb,u_exp = Experimental unbound brain concentration.
Pharmaceutics 13 01402 g004
Table 1. PK parameters which were different for each drug.
Drugfu,plasmaVd (cm3) *kel (s−1) *ka (s−1) *D (ng)k0 (ng/s)Rat Weight (g)
Amitriptyline0.090 a4000 c,+7.70 × 10⁻⁵ h1.54·10−4 #5,000,000 h 250 h
Caffeine0.917 b180 c,+3.55 × 10⁻⁵ i,$ 833.333 i300 i
Carbamazepine0.385 b1490.5 d4.50 × 10−5 j8.99·10−5 #3,600,000 j 300 j
Fleroxacin0.793 b427.5 e,+7.13 × 10⁻⁵ k 1,114,350 l83.125 l285 l
Pefloxacin0.860 b361.1f,+5.83 × 10⁻⁵ k 3,676,500 l214.542 l285 l
Zolpidem0.267 b304 g1.56 × 10−4 g 499,700 g 190 g
* indicates that the parameter was later adjusted; + indicates that the Vd from the reference was from human data, so it was recalculated for rat; $ this initial estimate corresponds to the α constant rate from the reference; # ka initial estimates were calculated as double the kel initial estimates; a [23], b [24], c [25], d [26], e [27], f [28], g [20], h [16], i [17], j [18], k [29], l [19].
Table 2. Apparent permeability values and the fu,brain obtained from the in vitro tests with MDCK, MDCK-MDR1 and hCMEC cell lines.
DrugMDCK Cell LineMDCK-MDR1 Cell LinehCMEC Cell Line
Papp A→B
(×10−6 cm/s)
Papp B→A
(×10−6 cm/s)
fu,brainPapp A→B
(×10−6 cm/s)
Papp B→A
(×10−6 cm/s)
fu,brainPapp A→B
(×10−6 cm/s)
Papp B→A
(×10−6 cm/s)
fu,brain
Amitriptyline74.77 a178.48 a0.037 a17.95 a16.91 a0.104 a124.24 b66.21 b0.252 b
Caffeine26.1035.310.85733.5730.590.61363.93194.700.095
Carbamazepine114.6478.660.673142.9675.640.23870.14 b51.93 b0.386 b
Fleroxacin88.4863.440.47167.4042.570.81329.96 b25.73 b0.743 b
Pefloxacin41.2137.49 c0.910 c30.8235.39 c0.931 c24.95 b33.14 b0.642 b
Zolpidem21.3236.48 c0.971 c8.9233.43 c0.881 c106.16 b80.76 b0.408 b
a Data already published in [11]. b Data already published in [12]. c Data already published in [30].
Table 3. PK parameters (Vd, ka, kel) and scaling factors (SC1, SC2 and SC3) for each drug and cell line after being adjusted.
DrugVd
(cm3)
kel
(s−1)
ka
(s−1)
MDCK Cell LineMDCK-MDR1 Cell LinehCMEC Cell Line
SC1SC2SC3SC1SC2SC3SC1SC2SC3
Amitriptyline14,632.61.17 × 10−45.86 × 10−3220.59224.820.05920.392377.060.02132.89606.690.01
Caffeine273.63.55 × 10−5 3.851.000.222.851.000.314.091.002.15
Carbamazepine827.05.39 × 10−52.15 × 10−425.7181.011.1695.00391.220.71193.66569.980.44
Fleroxacin327.32.69 × 10−5 3.1812.961.071.596.430.683.5810.650.74
Pefloxacin524.36.75 × 10−5 4.8813.320.556.1513.190.567.5914.090.81
Zolpidem185.95.12 × 10−4 16.5326.790.2720.5914.510.3010.2638.700.65
Table 4. The mean brain Cmax and AUC PE% for each cell line after fitting the model and after obtaining the simulated profiles using the QSPR equation.
ProfileMDCK Cell LineMDCK-MDR1 Cell LinehCMEC Cell Line
%PE Cmax%PE AUC%PE Cmax%PE AUC%PE Cmax%PE AUC
Fitted14.345.2815.055.4513.565.16
Simulated19.2322.3435.7148.2149.7746.69
%PE = prediction error percentages, Cmax = maximum concentration, AUC = area under the curve.
Publisher’s Note: MDPI stays neutral with regard to jurisdictional claims in published maps and institutional affiliations.

