
Population Pharmacokinetics and Dose Optimization of Ceftazidime and Imipenem in Patients with Acute Exacerbations of Chronic Obstructive Pulmonary Disease


 , , , ,
Abstract
:
1. Introduction
2. Materials and Methods
2.1. Study Design and Participants
2.2. Sample Collection and Analysis
2.3. Population Pharmacokinetic Modelling
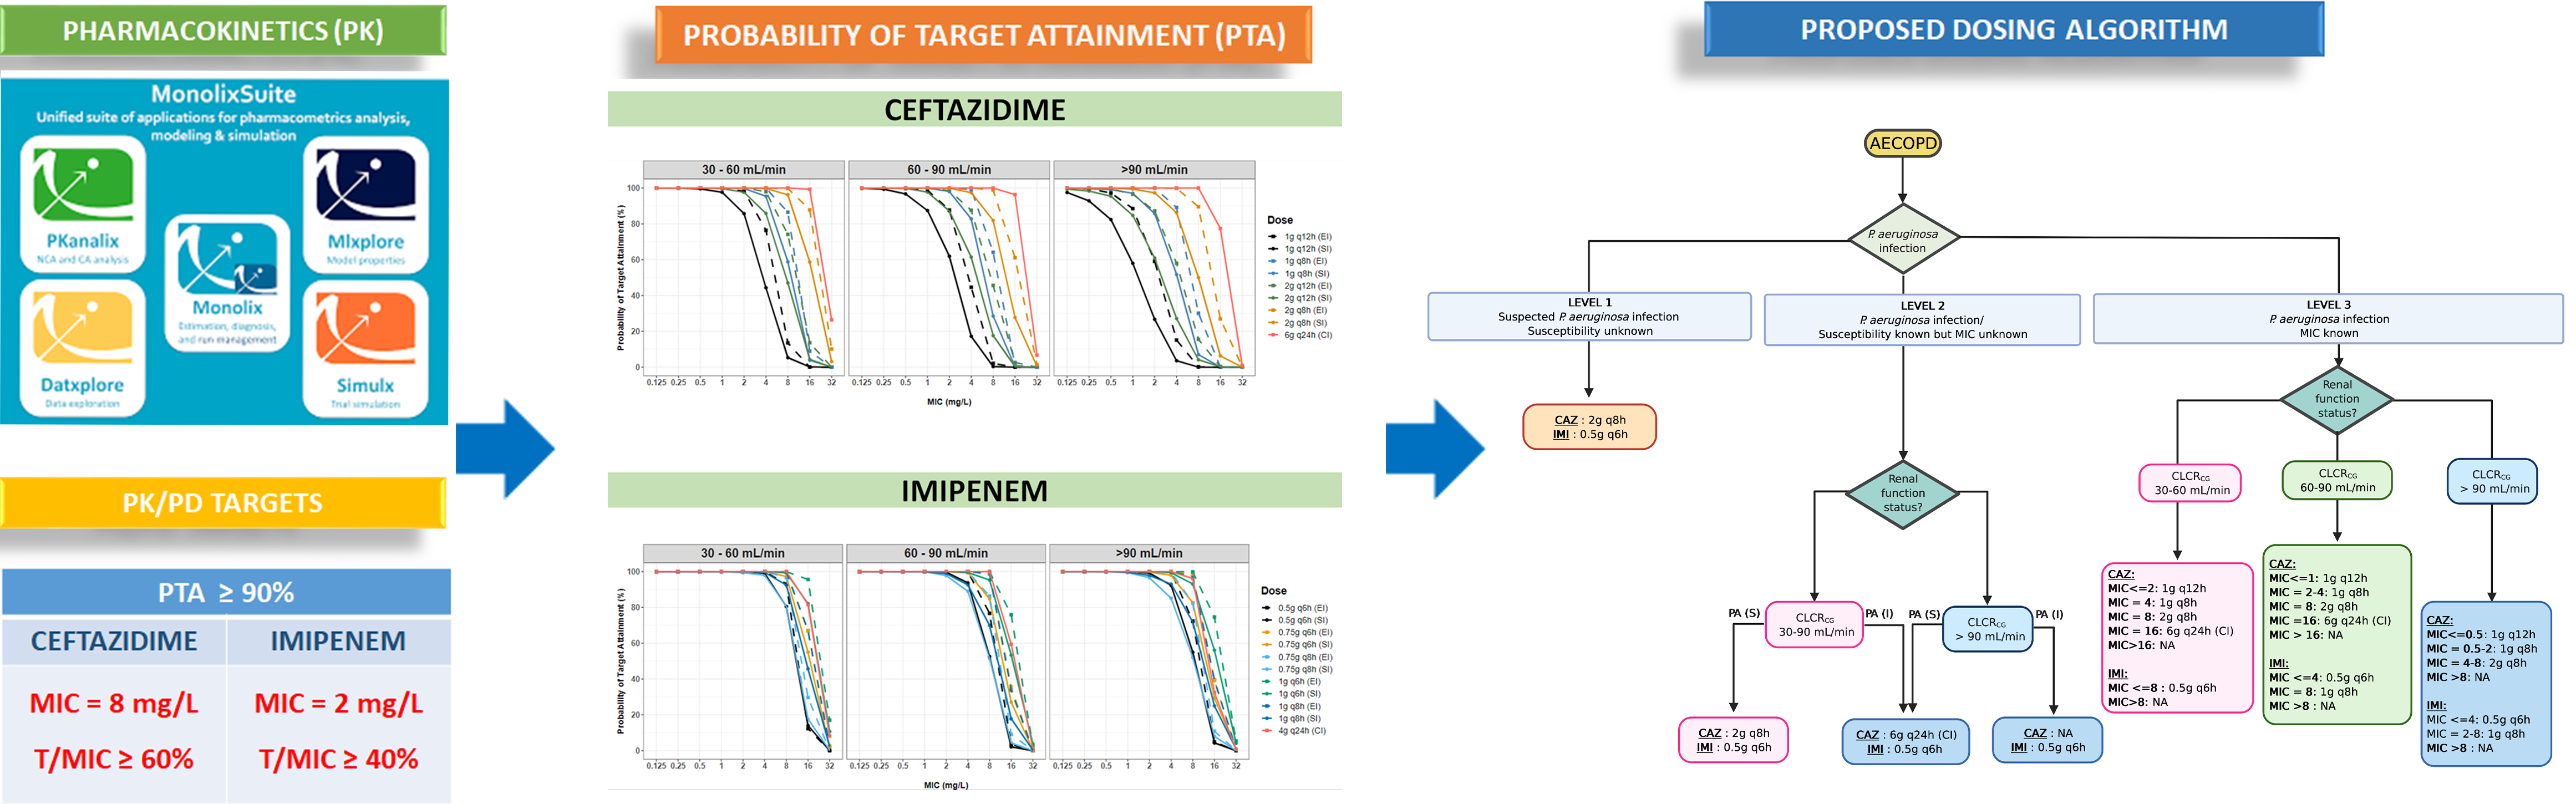
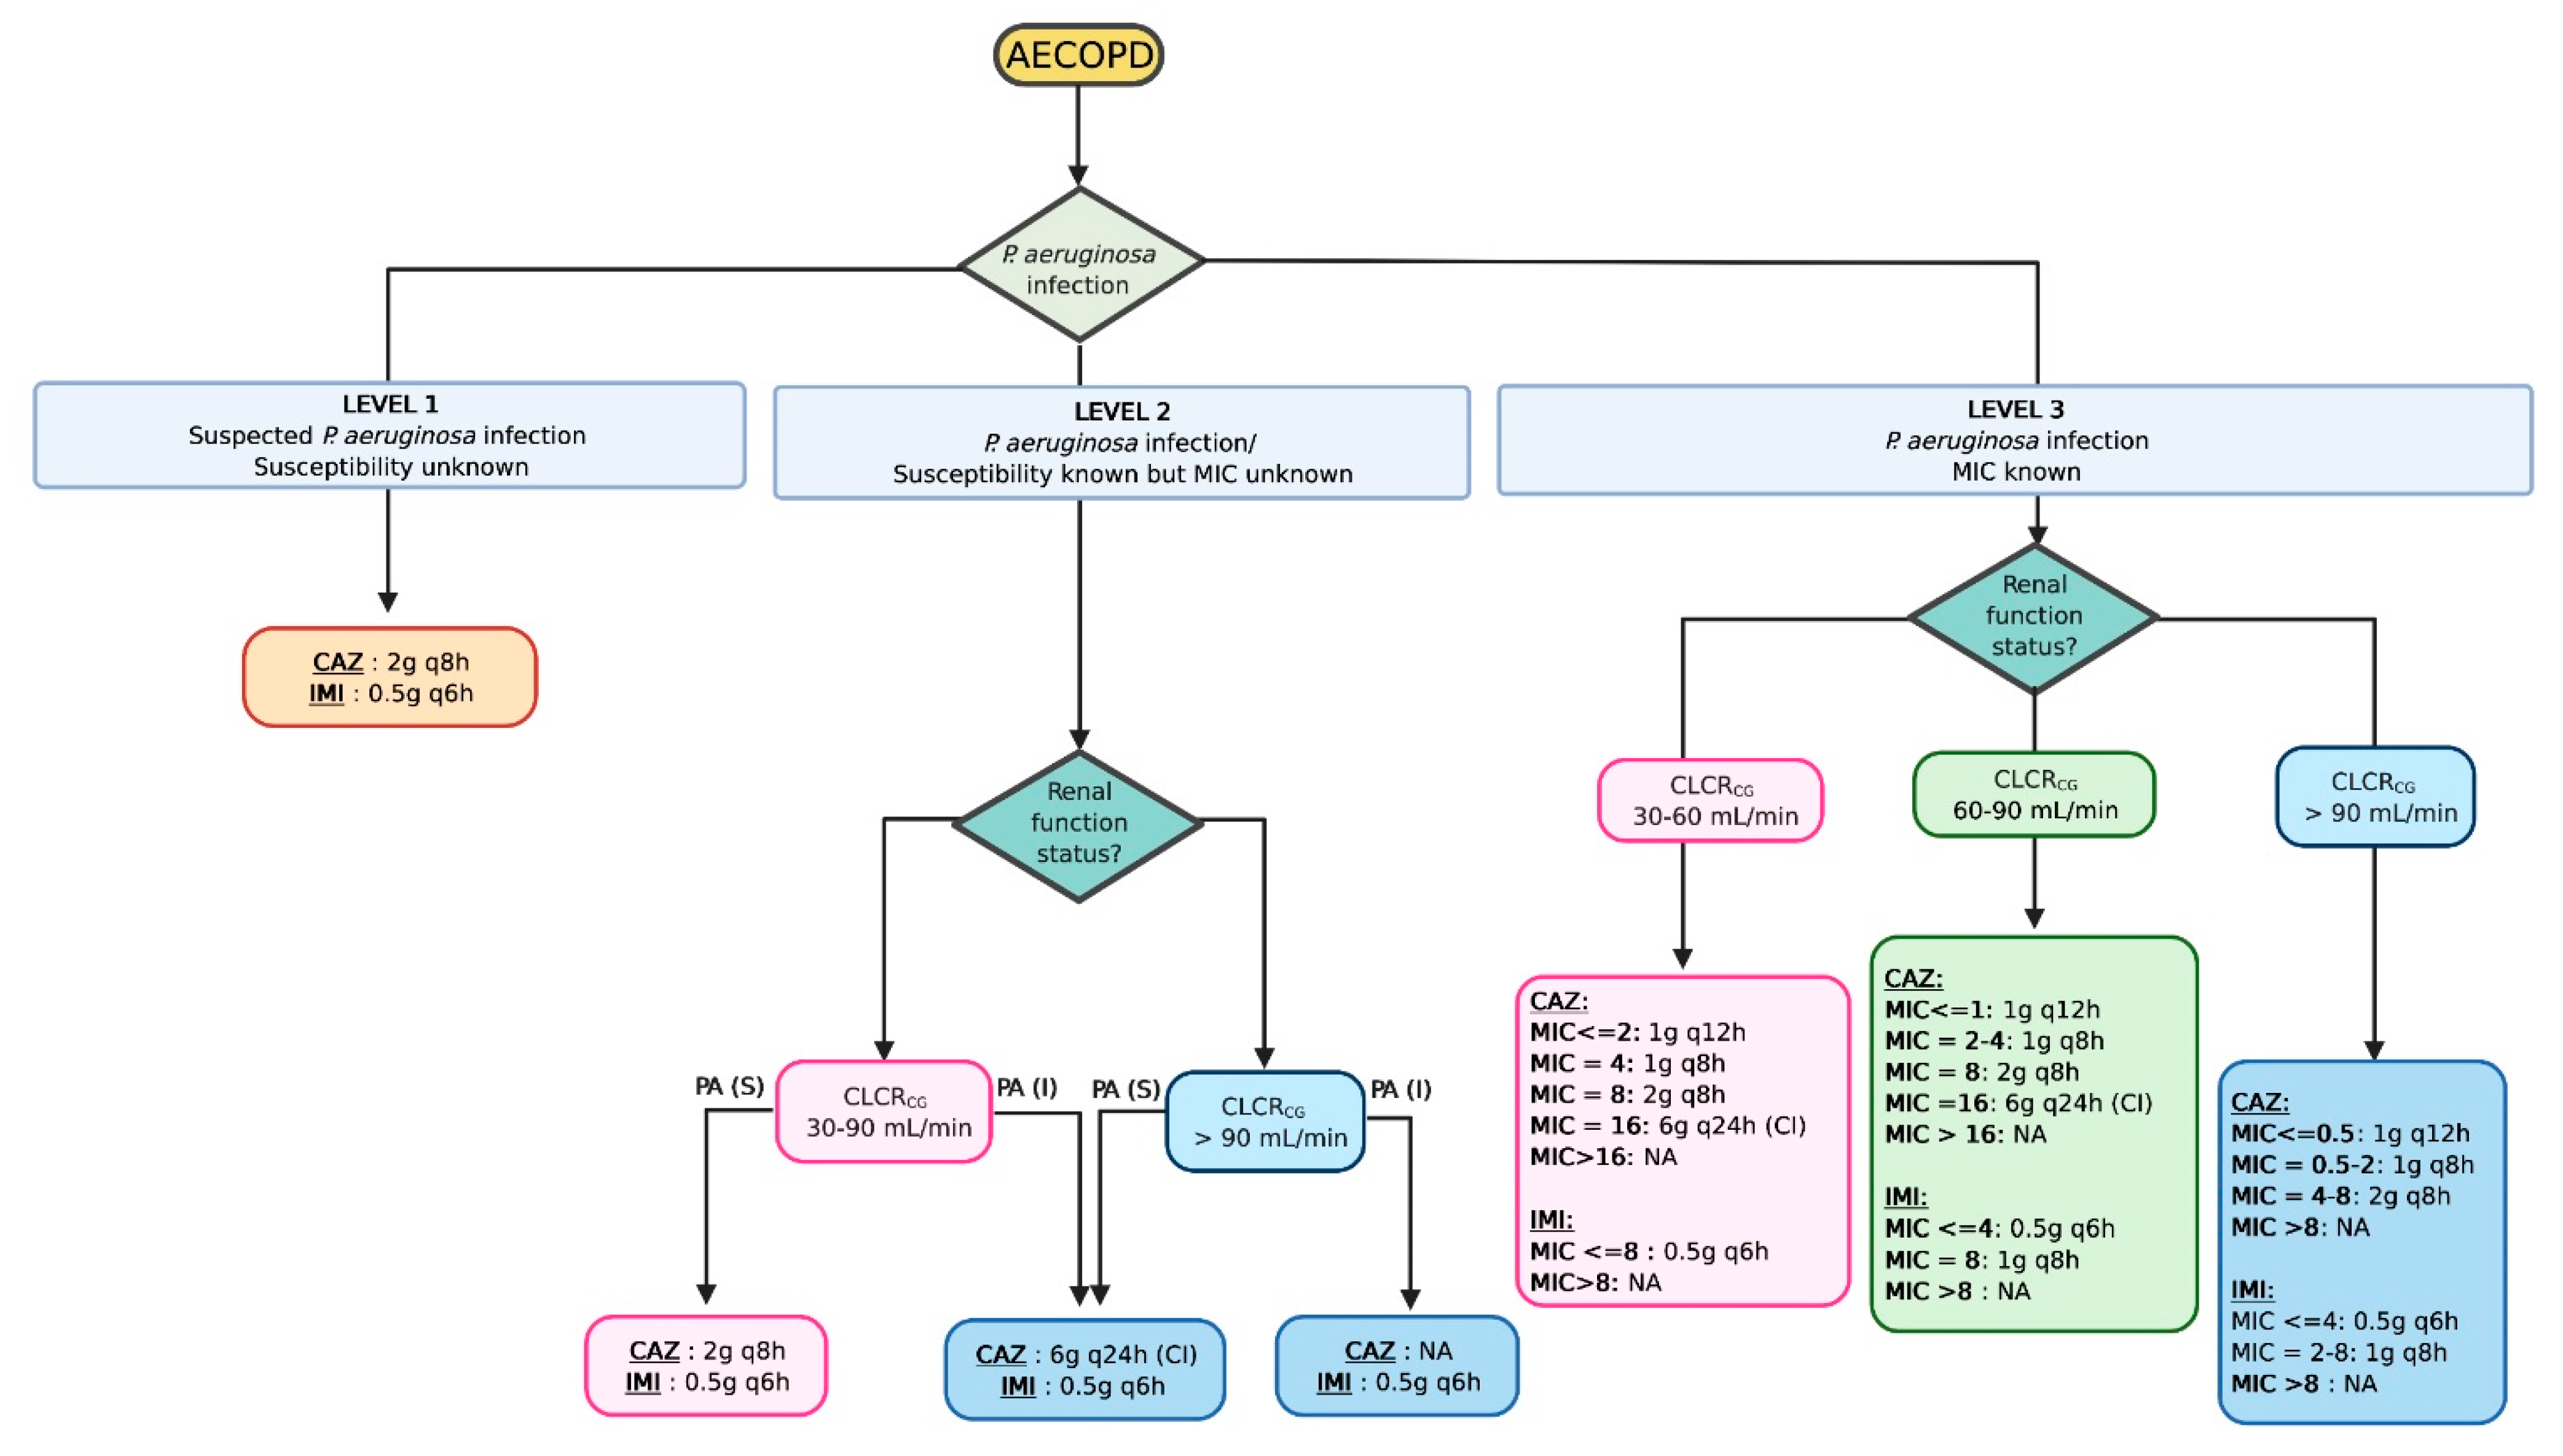
2.4. Monte Carlo Simulations and Development of a Therapeutic Algorithm
3. Results
3.1. Demographics
3.2. Model Building Process
3.3. Population Pharmacokinetic Model
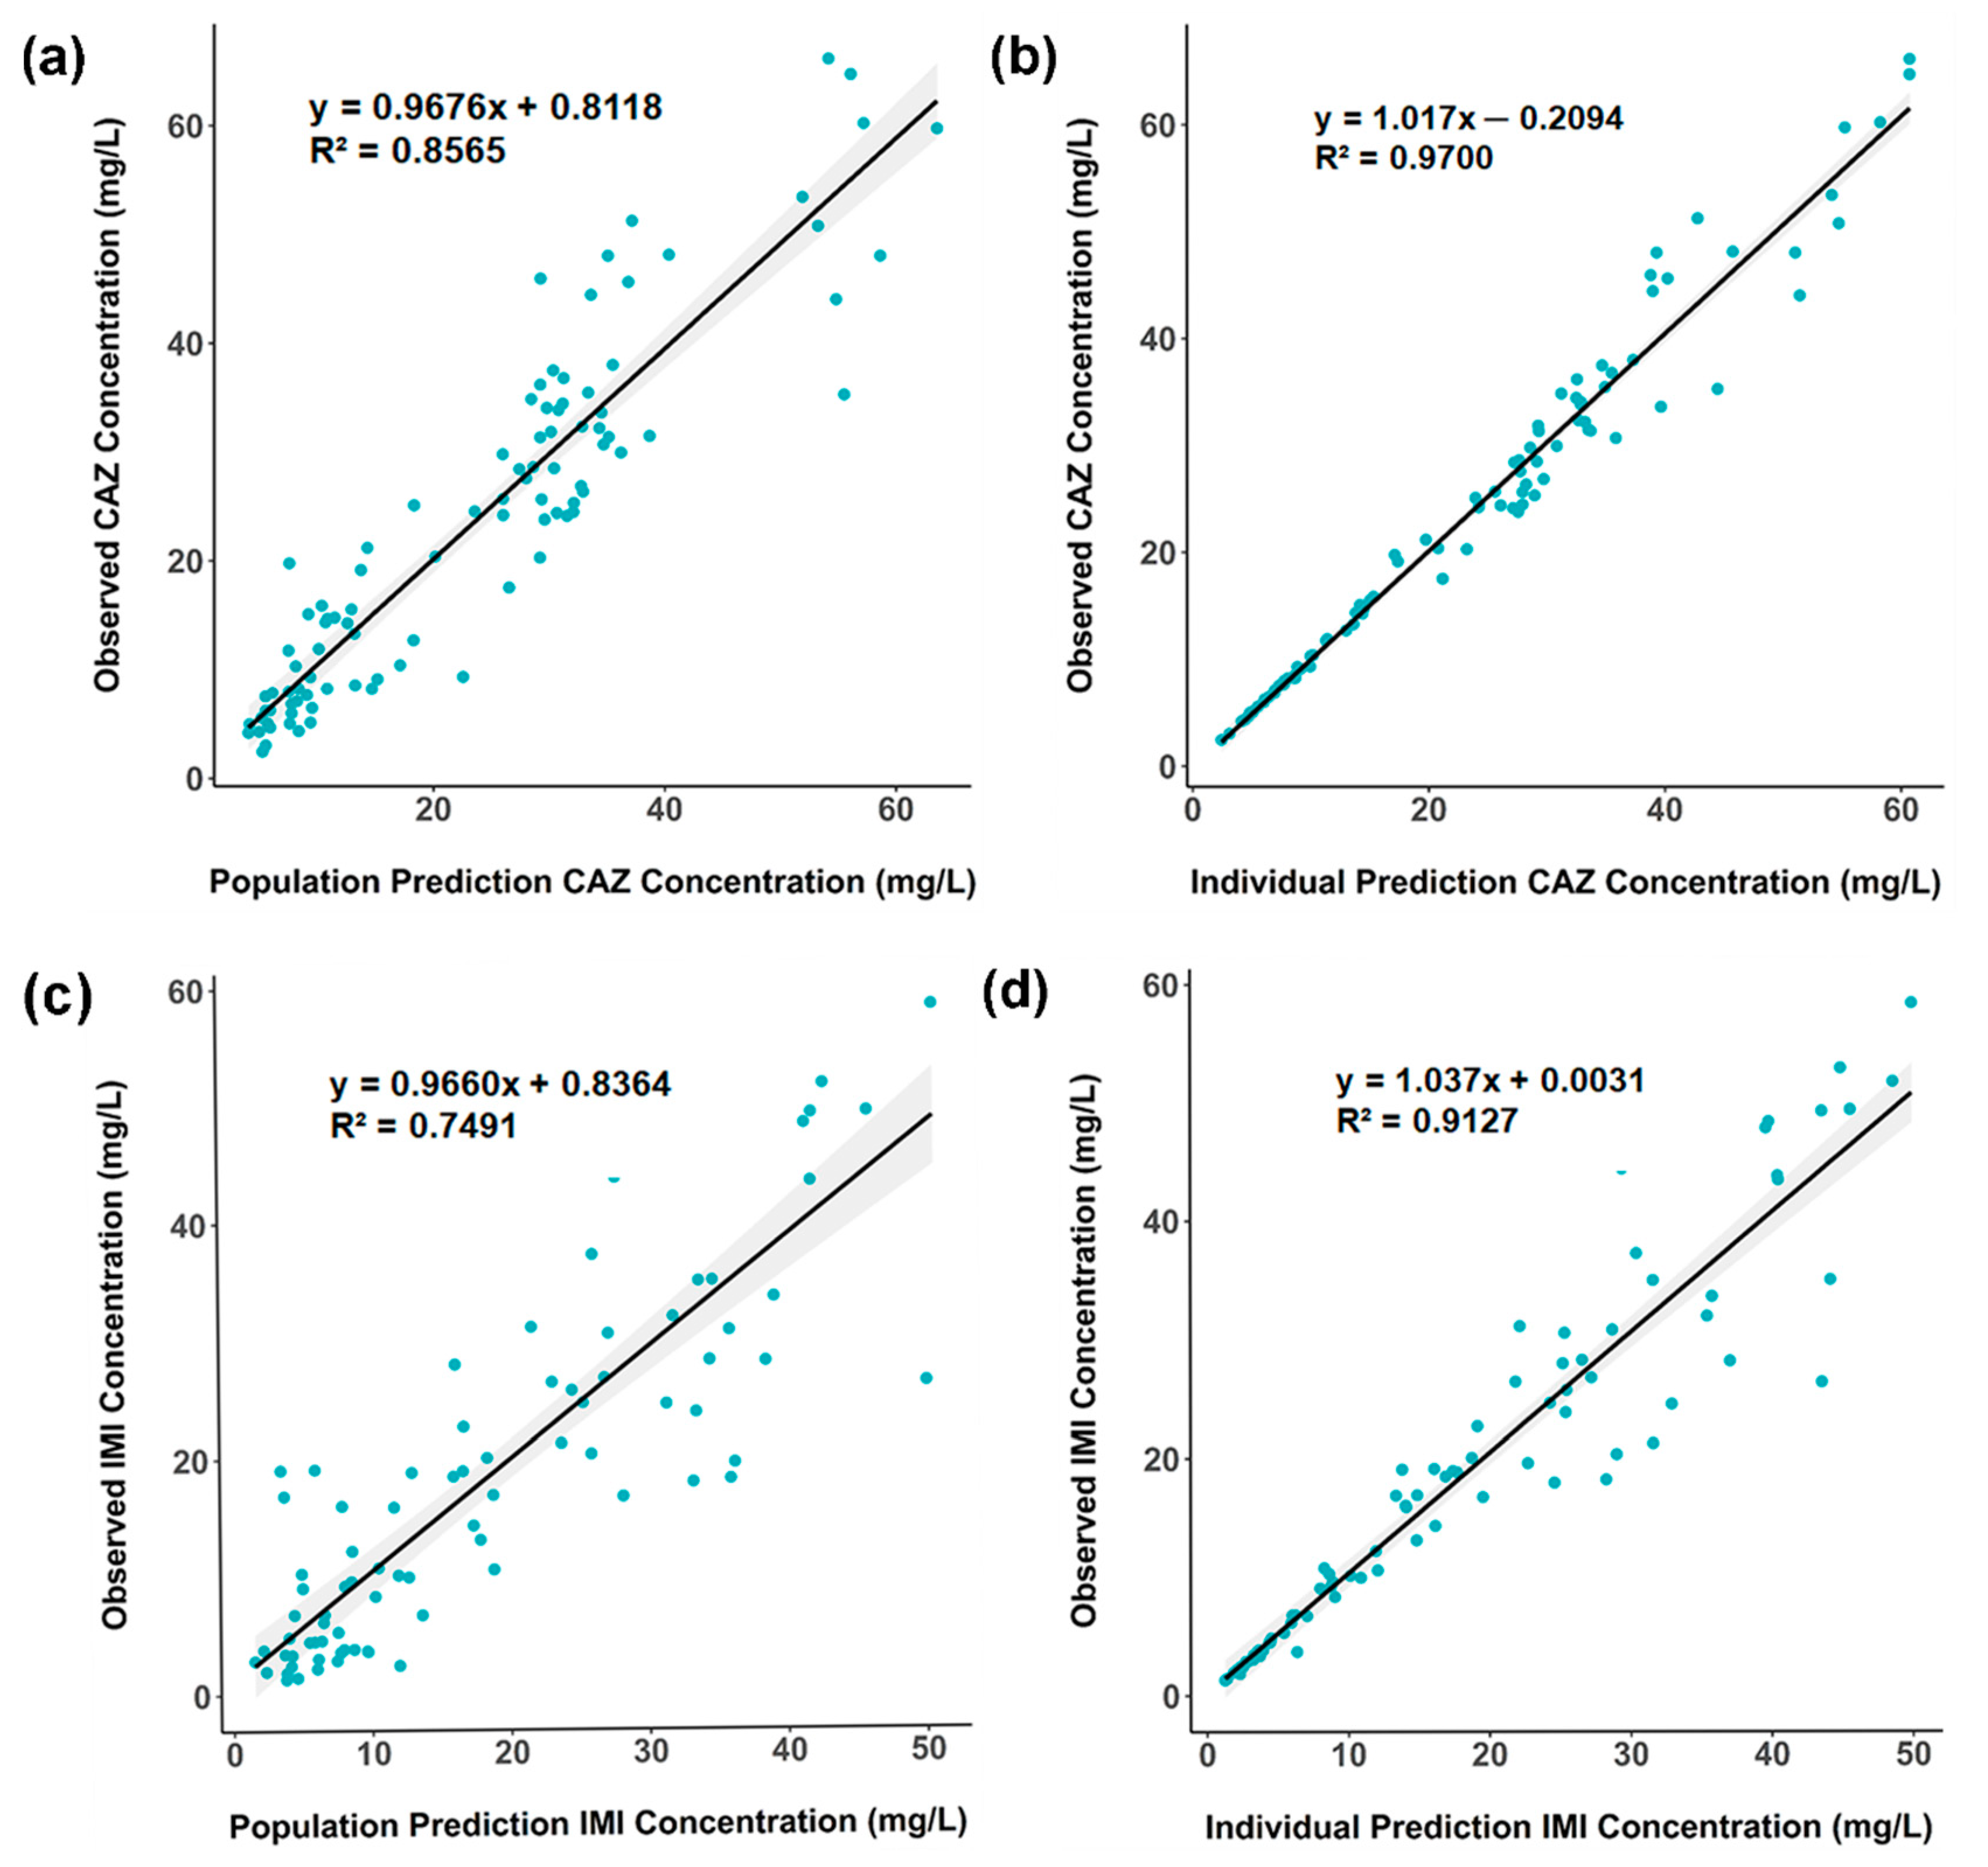
3.4. Model Evaluation
3.5. Monte Carlo Simulations and Dosing Regimen Recommendations
4. Discussion
5. Conclusions
Supplementary Materials
Author Contributions
Funding
Institutional Review Board Statement
Informed Consent Statement
Data Availability Statement
Acknowledgments
Conflicts of Interest
References
- Global Initiative for Chronic Obstructive Lung Disease, GOLD Report 2020. Available online: https://goldcopd.org/wp-content/uploads/2019/12/GOLD-2020-FINAL-ver1.2-03Dec19_WMV.pdf (accessed on 13 February 2021).
- Quaderi, S.A.; Hurst, J.R. The unmet global burden of COPD. Glob. Health Epidemiol. 2018, 3, e4. [Google Scholar] [CrossRef] [PubMed] [Green Version]
- Rabe, K.F.; Watz, H. Chronic obstructive pulmonary disease. Lancet 2017, 389, 1931–1940. [Google Scholar] [CrossRef]
- Lâm, H.T.; Ekerljung, L.; Tu·ò·ng, N.V.; Rönmark, E.; Larsson, K.; Lundbäck, B. Prevalence of COPD by disease severity in men and women in Northern Vietnam. COPD J. Chronic Obstr. Pulm. Dis. 2014, 11, 575–581. [Google Scholar] [CrossRef]
- Châu, N.Q. Situation of Diagnosis and Treatment of Chronic Obstructive Pulmonary Disease at the Centre of Respiratory of Bach Mai Hospital in the Period of 5 Years 1996–2000 (Full-Text in Vietnamese); Medical Publishing House: Hanoi, Vietnam, 2002; Volume 17, pp. 50–58. [Google Scholar]
- Zeki, A.A.; Schivo, M.; Chan, A.; Albertson, T.E.; Louie, S. The Asthma-COPD Overlap Syndrome: A common clinical problem in the elderly. J. Allergy 2011, 2011, 1–10. [Google Scholar] [CrossRef] [Green Version]
- Zamzam, M.A.; Azab, N.Y.; El Wahsh, R.A.; Ragab, A.Z.; Allam, E.M. Quality of life in COPD patients. Egypt. J. Chest Dis. Tuberc. 2012, 61, 281–289. [Google Scholar] [CrossRef] [Green Version]
- Mantero, M.; Rogliani, P.; Di Pasquale, M.; Polverino, E.; Crisafulli, E.; Guerrero, M.; Gramegna, A.; Cazzola, M.; Blasi, F. Acute exacerbations of COPD: Risk factors for failure and relapse. Int. J. Chronic Obs. Pulm. Dis. 2017, 12, 2687–2693. [Google Scholar] [CrossRef] [Green Version]
- Müllerova, H.; Maselli, D.J.; Locantore, N.; Vestbo, J.; Hurst, J.R.; Wedzicha, J.A.; Bakke, P.; Agusti, A.; Anzueto, A. Hospitalized Exacerbations of COPD: Risk factors and outcomes in the ECLIPSE cohort. Chest 2015, 147, 999–1007. [Google Scholar] [CrossRef] [PubMed] [Green Version]
- Guerrero, M.; Crisafulli, E.; Liapikou, A.; Huerta, A.; Gabarrús, A.; Chetta, A.; Soler, N.; Torres, A. Readmission for acute exacerbation within 30 days of discharge is associated with a subsequent progressive increase in mortality risk in COPD patients: A long-term observational study. PLoS ONE 2016, 11, e0150737. [Google Scholar] [CrossRef] [Green Version]
- Tiew, P.Y.; Jaggi, T.K.; Chan, L.L.Y.; Chotirmall, S.H. The airway microbiome in COPD, bronchiectasis and bronchiectasis-COPD overlap. Clin. Respir. J. 2021, 15, 123–133. [Google Scholar] [CrossRef]
- Dixit, D.; Bridgeman, M.B.; Madduri, R.P.; Kumar, S.T.; Cawley, M.J. Pharmacological management and prevention of exacerbations of chronic obstructive pulmonary disease in hospitalized patients. P T 2016, 41, 703–712. [Google Scholar]
- Sapey, E.; Stockley, R.A. COPD exacerbations. 2: Aetiology. Thorax 2006, 61, 250–258. [Google Scholar] [CrossRef] [PubMed] [Green Version]
- Erkan, L.; Uzun, O.; Findik, S.; Katar, D.; Sanic, A.; Atici, A.G. Role of bacteria in acute exacerbations of chronic obstructive pulmonary disease. Int. J. Chronic Obs. Pulm. Dis. 2008, 3, 463–467. [Google Scholar] [CrossRef] [Green Version]
- Groenewegen, K.H.; Wouters, E.F.M. Bacterial infections in patients requiring admission for an acute exacerbation of COPD; a 1-year prospective study. Respir. Med. 2003, 97, 770–777. [Google Scholar] [CrossRef] [Green Version]
- Roede, B.M.; Bresser, P.; Bindels, P.J.E.; Kok, A.; Prins, M.; Riet, G.T.; Geskus, R.B.; Herings, R.M.C.; Prins, J.M. Antibiotic treatment is associated with reduced risk of a subsequent exacerbation in obstructive lung disease: An historical population based cohort study. Thorax 2008, 63, 968–973. [Google Scholar] [CrossRef] [PubMed] [Green Version]
- Domenech, A.; Puig, C.; Martí, S.; Santos, S.; Fernández, A.; Calatayud, L.; Dorca, J.; Ardanuy, C.; Liñares, J. Infectious etiology of acute exacerbations in severe COPD patients. J. Infect. 2013, 67, 516–523. [Google Scholar] [CrossRef] [PubMed]
- Garcia-Vidal, C.; Almagro, P.; Romani, V.; Rodriguez-Carballeira, M.; Cuchi, E.; Canales, L.; Blasco, D.; Heredia, J.L.; Garau, J. Pseudomonas aeruginosa in patients hospitalised for COPD exacerbation: A prospective study. Eur. Respir. J. 2009, 34, 1072–1078. [Google Scholar] [CrossRef] [PubMed] [Green Version]
- Eklöf, J.; Sørensen, R.; Ingebrigtsen, T.S.; Sivapalan, P.; Achir, I.; Boel, J.B.; Bangsborg, J.; Ostergaard, C.; Dessau, R.B.; Jensen, U.S.; et al. Pseudomonas aeruginosa and risk of death and exacerbations in patients with chronic obstructive pulmonary disease: An observational cohort study of 22 053 patients. Clin. Microbiol. Infect. 2020, 26, 227–234. [Google Scholar] [CrossRef] [PubMed] [Green Version]
- Choi, J.; Oh, J.Y.; Lee, Y.S.; Hur, G.Y.; Lee, S.Y.; Shim, J.J.; Kang, K.H.; Min, K.H. Pseudomonas aeruginosa infection increases the readmission rate of COPD patients. COPD 2018, 13, 3077–3083. [Google Scholar] [CrossRef] [Green Version]
- Planquette, B.; Peron, J.; Dubuisson, E.; Roujansky, A.; Laurent, V.; Legriel, S.; Ferre, A.; Bruneel, F.; Bedos, J.P.; Le Monnier, A.; et al. Antibiotics against pseudomonas aeruginosa for COPD exacerbation in ICU: A 10-year retrospective study. COPD 2015, 379. [Google Scholar] [CrossRef] [PubMed] [Green Version]
- Minh, N.T.; Hường, T.T. Analysis of actual use of antibiotics for acute exacerbation of chronic obstructive pulmonary disease in the respiratory center of bach mai hospital (Ha Noi) (Full-Text in Vietnamese). Pharm. J. (Tap Duoc) 2019, 59, 3–8. [Google Scholar]
- Thắng, N.M. Study on Clinical and Microbiological Characteristics in the Exacerbation of Chronic Obstructive Pulmonary Disease at Respiratory Center, Bach Mai Hospital (Ha Noi) (Full-Text in Vietnamese). Master’s Thesis, Hanoi Medical University, Hanoi, Vietnam, 2017. [Google Scholar]
- Tängdén, T.; Ramos Martín, V.; Felton, T.W.; Nielsen, E.I.; Marchand, S.; Brüggemann, R.J.; Bulitta, J.B.; Bassetti, M.; Theuretzbacher, U.; Tsuji, B.T.; et al. The role of infection models and PK/PD modelling for optimising care of critically ill patients with severe infections. Intensive Care Med. 2017, 43, 1021–1032. [Google Scholar] [CrossRef]
- Chi, L.Đ. Development of HPLC method for assay of ceftazidime in Plasma (Full-Text in Vietnamese). Pharm. J. (Tap Duoc) 2018, 501, 71–74. [Google Scholar]
- Chi, L.Đ. Development of HPLC Method for assay of imipenem and meropenem in Plasma (Full-text in Vietnamese). Pharm. J. (Tap Duoc) 2017, 500, 46–49. [Google Scholar]
- Traynard, P.; Ayral, G.; Twarogowska, M.; Chauvin, J. Efficient pharmacokinetic modeling workflow with the Monolixsuite: A case study of remifentanil. CPT Pharmacomet. Syst. Pharmacol. 2020, 9, 198–210. [Google Scholar] [CrossRef] [Green Version]
- Mould, D.; Upton, R. Basic concepts in population modeling, simulation, and model-based drug development-part 2: Introduction to pharmacokinetic modeling methods. Cpt Pharmacomet. Syst. Pharmacol. 2013, 2, 38. [Google Scholar] [CrossRef]
- Willems, J.M.; Vlasveld, T.; den Elzen, W.P.; Westendorp, R.G.; Rabelink, T.J.; de Craen, A.J.; Blauw, G.J. Performance of Cockcroft-Gault, MDRD, and CKD-EPI in estimating prevalence of renal function and predicting survival in the oldest old. BMC Geriatr. 2013, 13, 113. [Google Scholar] [CrossRef] [PubMed] [Green Version]
- Electronic Medicines Compendium (Emc) Ceftazidime 1g Powder for Solution for Injection-Summary of Product Characteristics (SmPC)-(Emc). Available online: https://www.medicines.org.uk/emc/product/6346/smpc (accessed on 27 February 2021).
- Suchánková, H.; Lipš, M.; Urbánek, K.; Neely, M.N.; Strojil, J. Is continuous infusion of imipenem always the best choice? Int. J. Antimicrob. Agents 2017, 49, 348–354. [Google Scholar] [CrossRef]
- LeBel, M.; Barbeau, G.; Vallee, F.; Bergeron, M.G. Pharmacokinetics of ceftazidime in elderly volunteers. Antimicrob. Agents Chemother. 1985, 28, 713–715. [Google Scholar] [CrossRef] [Green Version]
- Van Hasselt, J.G.C.; Rizk, M.L.; Lala, M.; Chavez-Eng, C.; Visser, S.A.G.; Kerbusch, T.; Danhof, M.; Rao, G.; van der Graaf, P.H. Pooled population pharmacokinetic model of imipenem in plasma and the lung epithelial lining fluid: Imipenem Pharmacokinetics in Lung and Plasma. Br. J. Clin. Pharmacol. 2016, 81, 1113–1123. [Google Scholar] [CrossRef] [Green Version]
- Keel, R.A.; Kuti, J.L.; Sahm, D.F.; Nicolau, D.P. Pharmacodynamic evaluation of i.v. antimicrobials against pseudomonas aeruginosa samples collected from U.S. hospitals. Am. J. Health Syst. Pharmacol. 2011, 68, 1619–1625. [Google Scholar] [CrossRef]
- Eagye, K.J.; Banevicius, M.A.; Nicolau, D.P. Pseudomonas aeruginosa is not just in the intensive care unit any more: Implications for empirical therapy. Crit. Care Med. 2012, 40, 1329–1332. [Google Scholar] [CrossRef] [PubMed]
- Drusano, G.L. Antimicrobial pharmacodynamics: Critical interactions of “bug and drug”. Nat. Rev. Microbiol. 2004, 2, 289–300. [Google Scholar] [CrossRef] [PubMed]
- Sakka, S.G.; Glauner, A.K.; Bulitta, J.B.; Kinzig-Schippers, M.; Pfister, W.; Drusano, G.L.; Sörgel, F. Population pharmacokinetics and pharmacodynamics of continuous versus short-term infusion of imipenem-cilastatin in critically ill patients in a randomized, controlled trial. Antimicrob. Agents Chemother. 2007, 51, 3304–3310. [Google Scholar] [CrossRef] [PubMed] [Green Version]
- Crandon, J.L.; Bulik, C.C.; Kuti, J.L.; Nicolau, D.P. Clinical pharmacodynamics of cefepime in patients infected with pseudomonas aeruginosa. Antimicrob. Agents Chemother. 2010, 54, 1111–1116. [Google Scholar] [CrossRef] [PubMed] [Green Version]
- Zelenitsky, S.A.; Ariano, R.E.; Zhanel, G.G. Pharmacodynamics of empirical antibiotic monotherapies for an intensive care unit (ICU) population based on canadian surveillance data. J. Antimicrob. Chemother. 2011, 66, 343–349. [Google Scholar] [CrossRef] [Green Version]
- McKinnon, P.S.; Paladino, J.A.; Schentag, J.J. Evaluation of area under the Inhibitory Curve (AUIC) and time above the minimum inhibitory concentration (T>MIC) as predictors of outcome for cefepime and ceftazidime in serious bacterial infections. Int. J. Antimicrob. Agents 2008, 31, 345–351. [Google Scholar] [CrossRef] [PubMed]
- Vollenweider, D.J.; Frei, A.; Steurer-Stey, C.A.; Garcia-Aymerich, J.; Puhan, M.A. Antibiotics for exacerbations of chronic obstructive pulmonary disease. Cochrane Database Syst. Rev. 2018, 10, CD010257. [Google Scholar] [CrossRef] [PubMed]
- Europe Medicine Agency. Guideline on the Use of Pharmacokinetics and Pharmacodynamics in the Development of Antimicrobial Medicinal Products. Available online: https://www.ema.europa.eu/en/documents/scientific-guideline/guideline-use-pharmacokinetics-pharmacodynamics-development-antimicrobial-medicinal-products_en.pdf (accessed on 19 February 2021).
- User Guide-Simulx. Available online: http://simulx.webpopix.org/userguide/ (accessed on 19 February 2021).
- Bafadhel, M.; McKenna, S.; Terry, S.; Mistry, V.; Reid, C.; Haldar, P.; McCormick, M.; Haldar, K.; Kebadze, T.; Duvoix, A.; et al. Acute exacerbations of chronic obstructive pulmonary disease: Identification of biologic clusters and their biomarkers. Am. J. Respir. Crit. Care Med. 2011, 184, 662–671. [Google Scholar] [CrossRef]
- Jacobs, D.M.; Pandit, U.; Sethi, S. Acute exacerbations in chronic obstructive pulmonary disease: Should we use antibiotics and if so, which ones? Curr. Opin. Infect. Dis. 2019, 32, 143–151. [Google Scholar] [CrossRef] [PubMed]
- Bensman, T.J.; Wang, J.; Jayne, J.; Fukushima, L.; Rao, A.P.; D’Argenio, D.Z.; Beringer, P.M. Pharmacokinetic-pharmacodynamic target attainment analyses to determine optimal dosing of ceftazidime-avibactam for the treatment of acute pulmonary exacerbations in patients with cystic fibrosis. Antimicrob. Agents Chemother. 2017, 61, e00988-17. [Google Scholar] [CrossRef] [PubMed] [Green Version]
- Li, S.; Xie, F. Population pharmacokinetics and simulations of imipenem in critically Ill patients undergoing continuous renal replacement therapy. Int. J. Antimicrob. Agents 2019, 53, 98–105. [Google Scholar] [CrossRef] [PubMed]
- Muller, A.E.; Punt, N.; Mouton, J.W. Optimal exposures of ceftazidime predict the probability of microbiological and clinical outcome in the treatment of nosocomial pneumonia. J. Antimicrob. Chemother. 2013, 68, 900–906. [Google Scholar] [CrossRef] [Green Version]
- Mouton, J.W.; Punt, N.; Vinks, A.A. A retrospective analysis using monte carlo simulation to evaluate recommended ceftazidime dosing regimens in healthy volunteers, patients with cystic fibrosis, and patients in the intensive care unit. Clin. Ther. 2005, 27, 762–772. [Google Scholar] [CrossRef]
- MacVane, S.H.; Kuti, J.L.; Nicolau, D.P. Clinical pharmacodynamics of antipseudomonal cephalosporins in patients with ventilator-associated pneumonia. Antimicrob. Agents Chemother. 2014, 58, 1359–1364. [Google Scholar] [CrossRef] [Green Version]
- Couffignal, C.; Pajot, O.; Laouénan, C.; Burdet, C.; Foucrier, A.; Wolff, M.; Armand-Lefevre, L.; Mentré, F.; Massias, L. Population pharmacokinetics of imipenem in critically Ill patients with suspected ventilator-associated pneumonia and evaluation of dosage regimens: Population pharmacokinetics of imipenem in ICU. Br. J. Clin. Pharmacol. 2014, 78, 1022–1034. [Google Scholar] [CrossRef] [Green Version]
- Huang, Y.; Yang, J.; Xie, J.; Liu, L.; Liu, S.; Guo, F.; Qiu, H.; Yang, Y. Association between pathophysiology and volume of distribution among patients with sepsis or septic shock treated with imipenem: A prospective cohort study. J. Infect. Dis. 2020, 221, S272–S278. [Google Scholar] [CrossRef]
- Baptista, J.P. Augmented renal clearance. In Antibiotic Pharmacokinetic/Pharmacodynamic Considerations in the Critically Ill; Springer: Berlin/Heidelberg, Germany, 2018; pp. 125–150. [Google Scholar]
- Hobbs, A.L.V.; Shea, K.M.; Roberts, K.M.; Daley, M.J. Implications of augmented renal clearance on drug dosing in critically Ill patients: A focus on antibiotics. Pharmacotherapy 2015, 35, 1063–1075. [Google Scholar] [CrossRef]
- O’Donnell, J.N.; Bidell, M.R.; Lodise, T.P. Approach to the treatment of patients with serious multidrug-resistant Pseudomonas aeruginosa infections. Pharmacotherapy 2020, phar.2449. [Google Scholar] [CrossRef]
- Zasowski, E.J.; Rybak, J.M.; Rybak, M.J. The β-Lactams strike back: Ceftazidime-avibactam. Pharmacotherapy 2015, 35, 755–770. [Google Scholar] [CrossRef] [PubMed] [Green Version]
- Prescott, W.A.; Gentile, A.E.; Nagel, J.L.; Pettit, R.S. Continuous-infusion antipseudomonal beta-lactam therapy in patients with cystic fibrosis. P T 2011, 36, 723–763. [Google Scholar] [PubMed]
- Keel, R.A.; Sutherland, C.A.; Crandon, J.L.; Nicolau, D.P. Stability of doripenem, imipenem and meropenem at elevated room temperatures. Int. J. Antimicrob. Agents 2011, 37, 184–185. [Google Scholar] [CrossRef] [PubMed]
- Tada, T.; Nhung, P.H.; Miyoshi-Akiyama, T.; Shimada, K.; Tsuchiya, M.; Phuong, D.M.; Anh, N.Q.; Ohmagari, N.; Kirikae, T. Multidrug-resistant sequence type 235 pseudomonas aeruginosa clinical isolates producing IMP-26 with increased carbapenem-hydrolyzing activities in Vietnam. Antimicrob. Agents Chemother. 2016, 60, 6853–6858. [Google Scholar] [CrossRef] [Green Version]
- De Velde, F.; Mouton, J.W.; de Winter, B.C.M.; van Gelder, T.; Koch, B.C.P. Clinical applications of population pharmacokinetic models of antibiotics: Challenges and perspectives. Pharmacol. Res. 2018, 134, 280–288. [Google Scholar] [CrossRef] [PubMed]
- Jonsson, E.N.; Wade, J.R.; Karlsson, M.O. Comparison of some practical sampling strategies for population pharmacokinetic studies. J Pharm. Biopharm. 1996, 24, 245–263. [Google Scholar] [CrossRef] [PubMed]


| Parameters | Ceftazidime (n = 50) | Imipenem (n = 44) |
|---|---|---|
| Age (years) | 69 (63–77) | 65 (60–72) |
| Male (No., %) | 47 (94) | 41 (93) |
| History of diagnosis of COPD | ||
| <1 year (No., %) | 18 (36) | 10 (23) |
| 1–10 year (No., %) | 31 (62) | 30 (68) |
| >10 year (No., %) | 1 (2) | 4 (9) |
| Total body weight (kg) | 51 (47–57) | 50 (47–55) |
| Height (cm) | 162.5 (160–167) | 160 (159–165) |
| Body Mass Index (kg/m2) | 19.49 (17.55–21.44) | 19.51 (18.22–19.51) |
| Free Fat Mass (kg) | 45 (41–47) | 43 (40–46) |
| FEV1 a | ||
| <30% (No., %) | 13/23 (57) | 2/6 (33) |
| 30–50% (No., %) | 6/23 (26) | 2/6 (33) |
| 50–70% (No., %) | 3/23 (13) | 1/6 (17) |
| >70% (No., %) | 1/23 (4) | 1/6 (17) |
| Anthonisen score b | ||
| Major (No., %) | 12 (24) | 18 (41) |
| Medium (No., %) | 27 (54) | 8 (18) |
| Minor (No., %) | 11 (22) | 18 (41) |
| Respiratory distress (No., %) | 17 (34) | 29 (66) |
| Invasiveventilation (No., %) | 7 (14) | 13 (30) |
| CLCRCG (mL/min) | 62.9 (49.0–76.8) | 76.6 (57.5–96.6) |
| Concomitantmedication | ||
| Diuretic (No., %) | 9 (18) | 8 (18) |
| Systemic corticosteroids (No., %) | 27 (54) | 32 (73) |
| Inhaled corticosteroids (No., %) | 47 (94) | 41 (93) |
| Systemic SABA (No., %) | 16 (32) | 16 (36) |
| Inhaled SABA (No., %) | 50 (100) | 41 (93) |
| SAMA (No., %) | 43 (86) | 41 (93) |
| Antibiotic regimen | ||
| 0.5 g q12h (No., %) | - | 1 (2) |
| 0.5 g q8h (No., %) | - | 4 (9) |
| 0.5 g q6h (No., %) | - | 7 (16) |
| 1 g q12h (No., %) | 1 (2) | 8 (18) |
| 1 g q8h (No., %) | 39 (78) | 24 (55) |
| 1 g q6h (No., %) | 1 (2) | - |
| 2 g q12h (No., %) | 3 (6) | - |
| 2 g q8h (No., %) | 6 (12) | - |
| Duration of antibiotherapy—(No., days) | 10 [8–13] | 10 [7–14] |
| Parameters | Final Model | Bootstrap Results | |||||
|---|---|---|---|---|---|---|---|
| Estimates | RSE (%) | p | Median | 95% Confidence Interval | |||
| 2.5% | 97.5% | ||||||
| CEFTAZIDIME | |||||||
| Vd (L) | 23.7 | 2.96 | 23.98 | 22.361 | 25.66 | ||
| CL (L/h) | 8.74 | 3.18 | 8.76 | 8.185 | 9.358 | ||
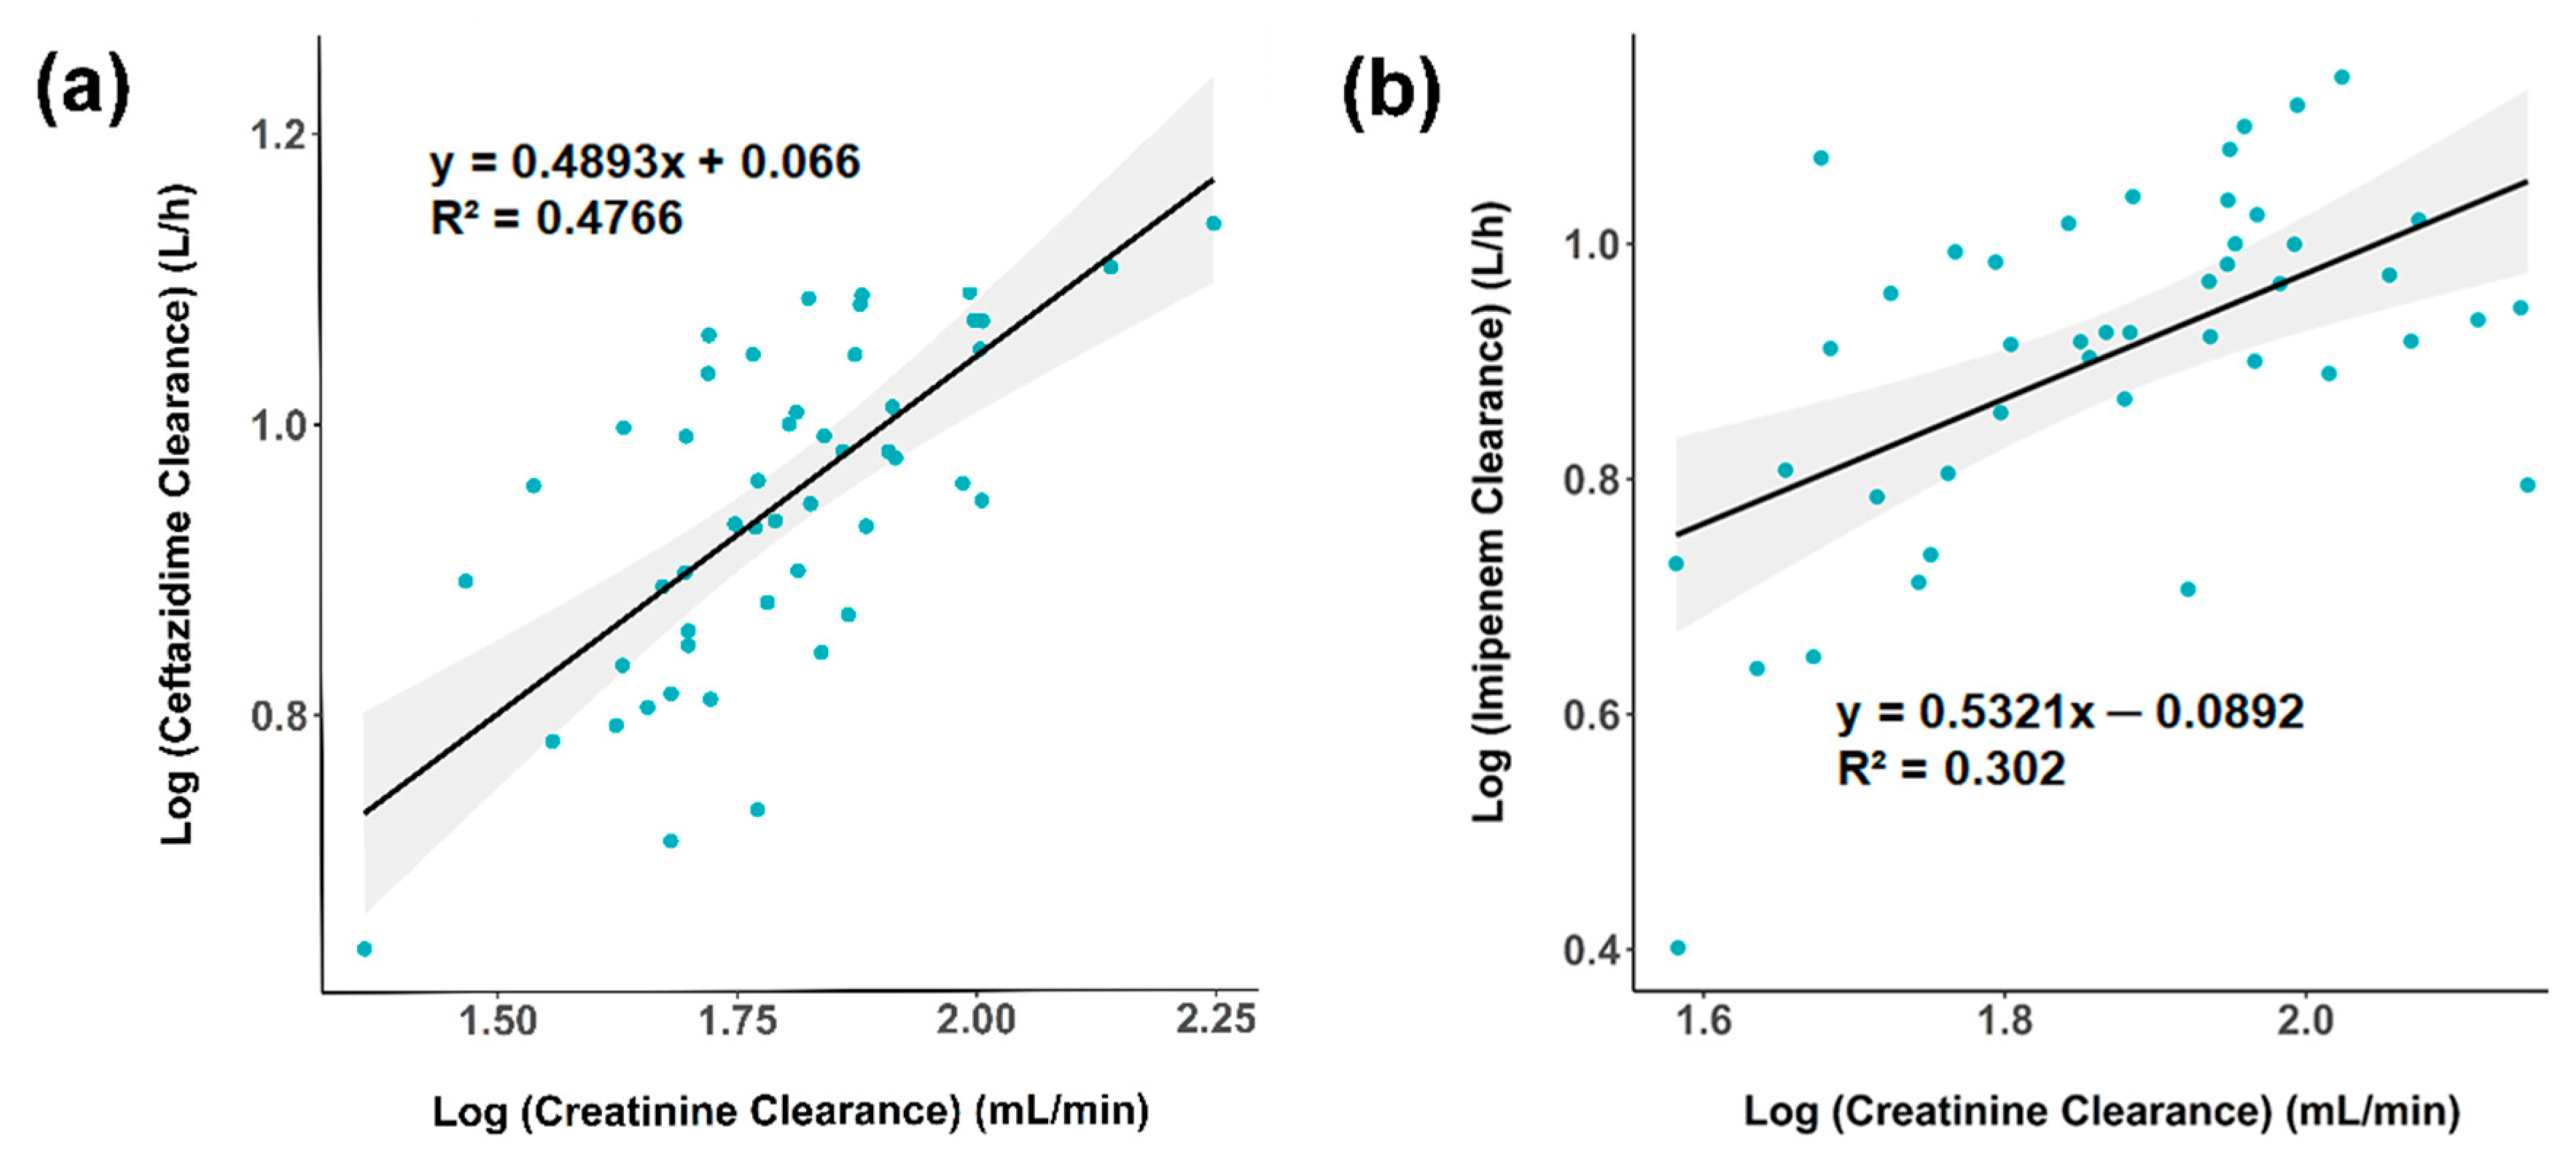
| βCLCRCG on CL | 0.485 | 17.2 | 2.8 × 10⁻⁸ | 0.492 | 0.328 | 0.643 | |
| ωV (%) | 13 | 32 | 9.55 | 3.9 | 20.1 | ||
| ωCL (%) | 20.8 | 12.2 | 19.9 | 14.8 | 24.8 | ||
| b (%) | 12.1 | 16 | 12.65 | 7.1 | 16.6 | ||
| IMIPENEM | |||||||
| Vd (L) | 15.1 | 6.07 | 15.17 | 13.318 | 17284 | ||
| CL (L/h) | 7.88 | 5.35 | 7.91 | 7.117 | 8.771 | ||
| βCLCRCG on CL | 0.532 | 27.2 | 8.1 × 10⁻⁵ | 0.54 | 0.163 | 0.949 | |
| ωV (%) | 10.7 | 76.4 | 14.54 | 6.7 | 29.2 | ||
| ωCL (%) | 29.4 | 12.6 | 28.75 | 18.9 | 38.1 | ||
| b (%) | 23.3 | 12.3 | 21.3 | 15.6 | 26.8 | ||
Publisher’s Note: MDPI stays neutral with regard to jurisdictional claims in published maps and institutional affiliations. |
© 2021 by the authors. Licensee MDPI, Basel, Switzerland. This article is an open access article distributed under the terms and conditions of the Creative Commons Attribution (CC BY) license (http://creativecommons.org/licenses/by/4.0/).
Share and Cite
Nguyen, T.-M.; Ngo, T.-H.; Truong, A.-Q.; Vu, D.-H.; Le, D.-C.; Vu, N.-B.; Can, T.-N.; Nguyen, H.-A.; Phan, T.-P.; Van Bambeke, F.; et al. Population Pharmacokinetics and Dose Optimization of Ceftazidime and Imipenem in Patients with Acute Exacerbations of Chronic Obstructive Pulmonary Disease. Pharmaceutics 2021, 13, 456. https://doi.org/10.3390/pharmaceutics13040456
Nguyen T-M, Ngo T-H, Truong A-Q, Vu D-H, Le D-C, Vu N-B, Can T-N, Nguyen H-A, Phan T-P, Van Bambeke F, et al. Population Pharmacokinetics and Dose Optimization of Ceftazidime and Imipenem in Patients with Acute Exacerbations of Chronic Obstructive Pulmonary Disease. Pharmaceutics. 2021; 13(4):456. https://doi.org/10.3390/pharmaceutics13040456
Chicago/Turabian StyleNguyen, Thu-Minh, Thu-Hue Ngo, Anh-Quan Truong, Dinh-Hoa Vu, Dinh-Chi Le, Ngan-Binh Vu, Tuyet-Nga Can, Hoang-Anh Nguyen, Thu-Phuong Phan, Françoise Van Bambeke, and et al. 2021. "Population Pharmacokinetics and Dose Optimization of Ceftazidime and Imipenem in Patients with Acute Exacerbations of Chronic Obstructive Pulmonary Disease" Pharmaceutics 13, no. 4: 456. https://doi.org/10.3390/pharmaceutics13040456