
Utilizing Dynamic Contrast-Enhanced Magnetic Resonance Imaging (DCE-MRI) to Analyze Interstitial Fluid Flow and Transport in Glioblastoma and the Surrounding Parenchyma in Human Patients

 , , , and
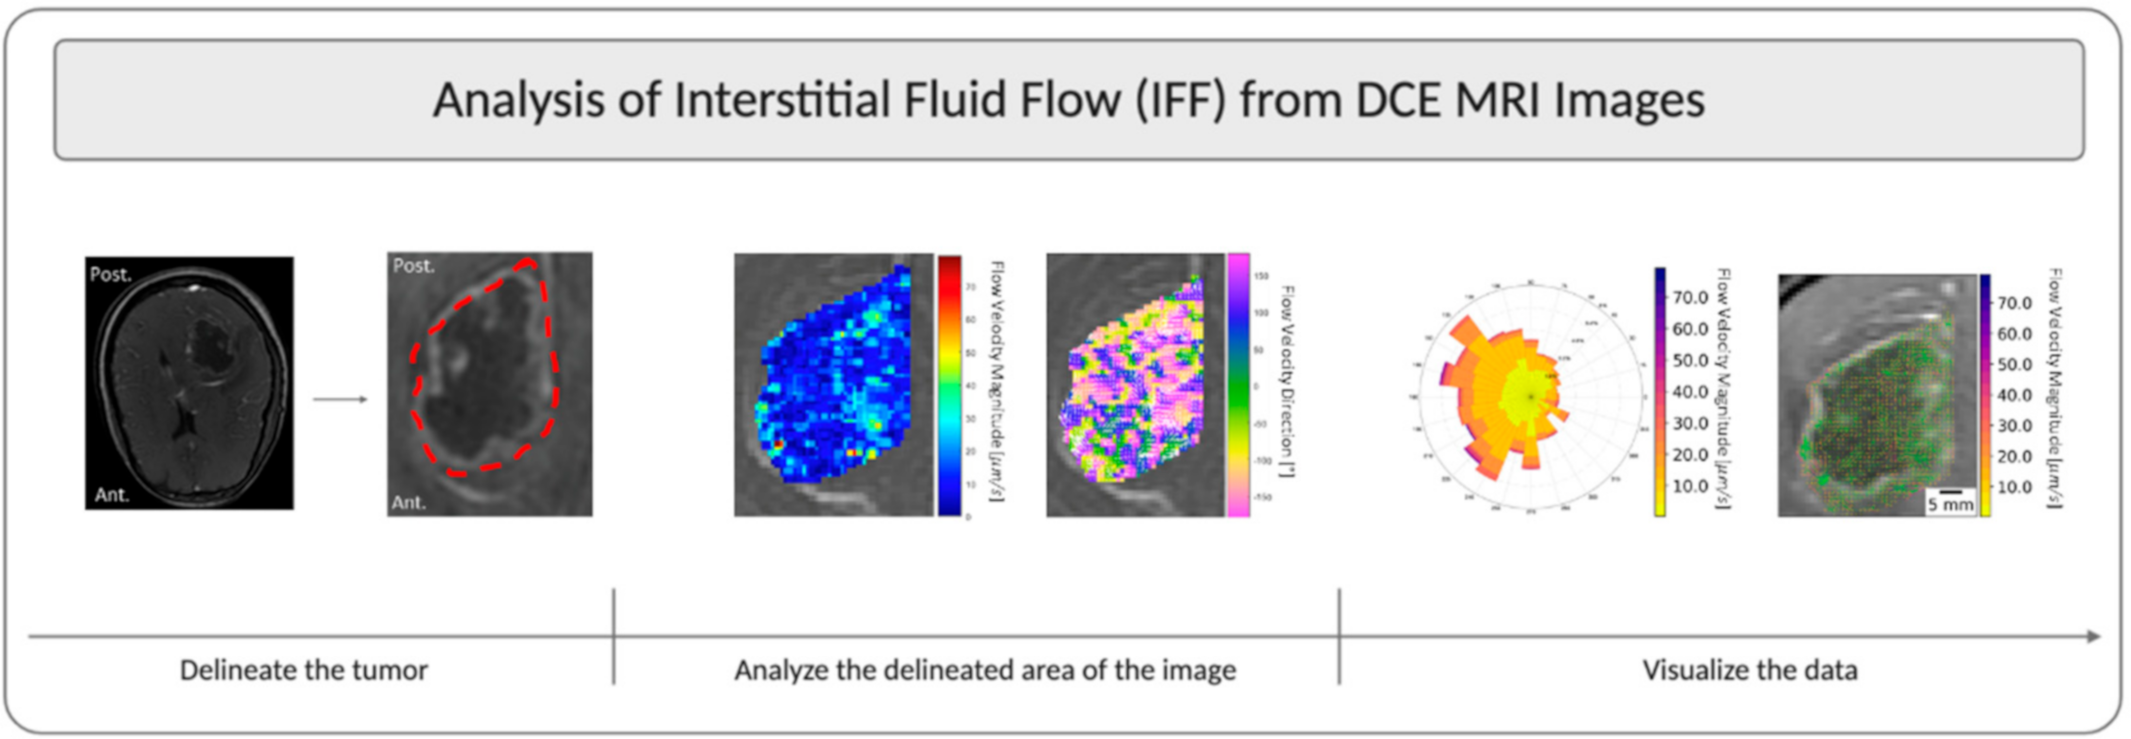
Abstract
:1. Introduction
2. Materials and Methods
2.1. The Cancer Imaging Archive Ivy GAP Database
2.2. Convection and Diffusion Analysis
2.3. Statistics and Graphing and Generation of Figures
3. Results
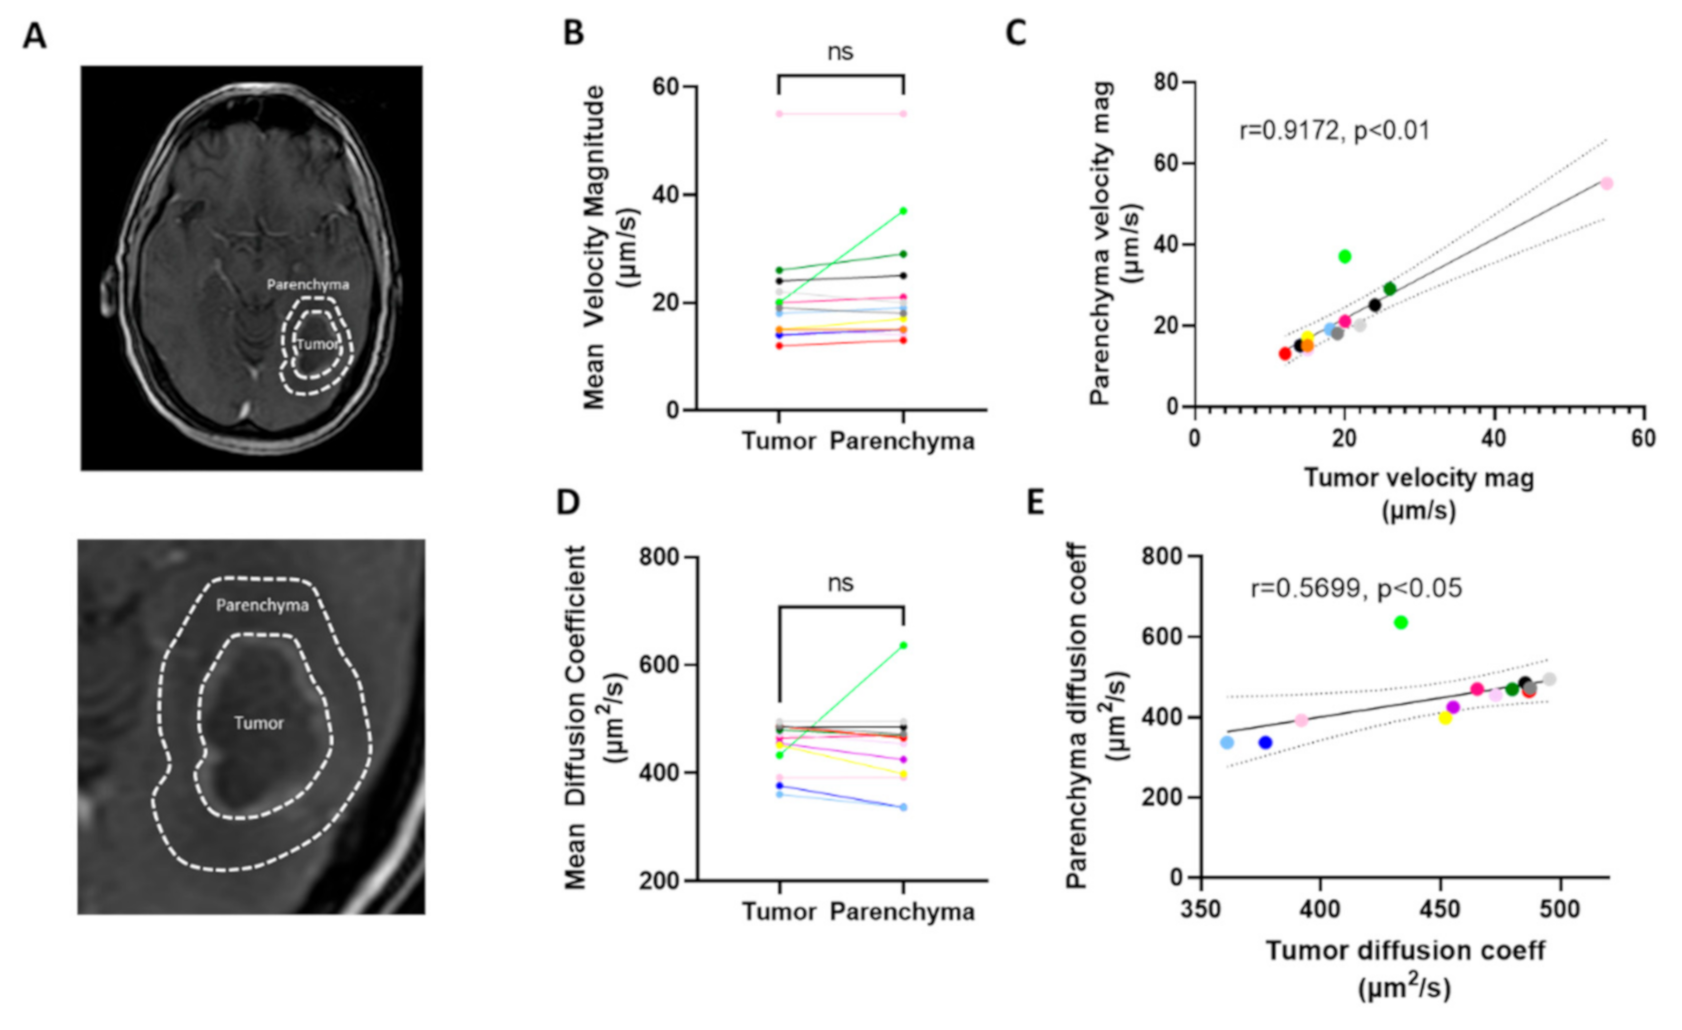
3.1. Interstitial Flow and Diffusion Coefficients Can Be Calculated from DCE-MRI
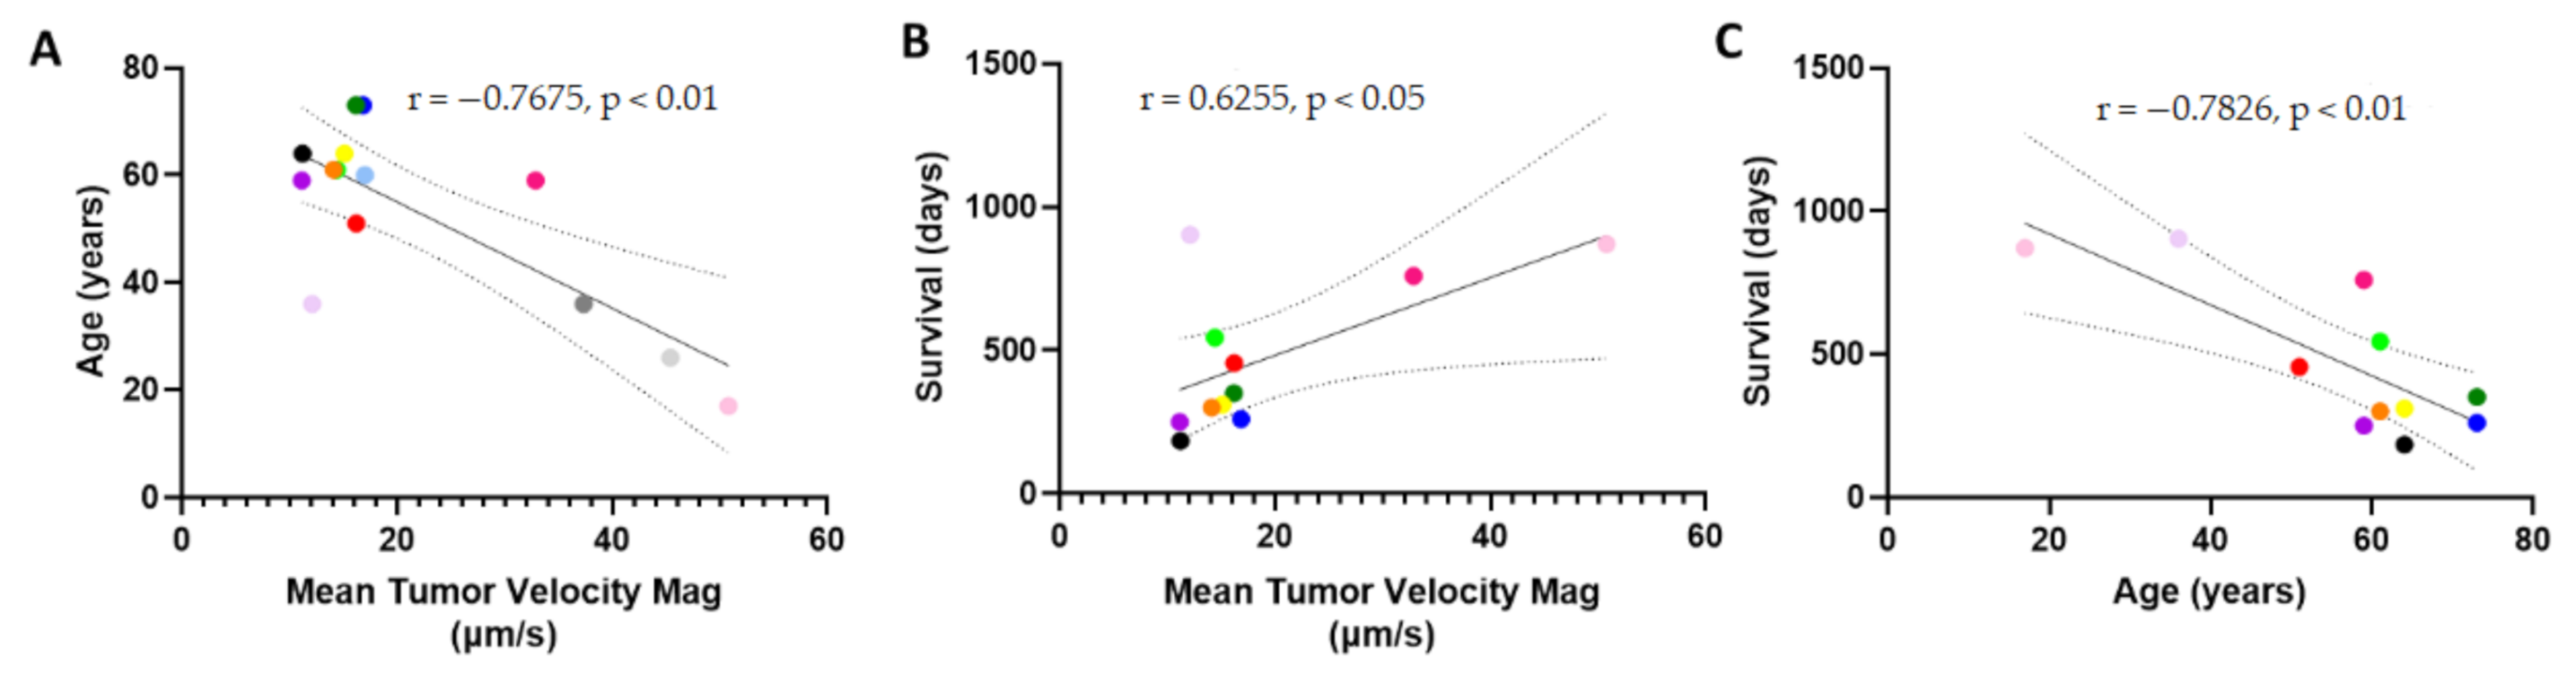
3.2. Interstitial Fluid Flow Magnitude Is Variable across Patients
3.3. Patient Survival Correlates Positively with Mean Velocity Magnitude
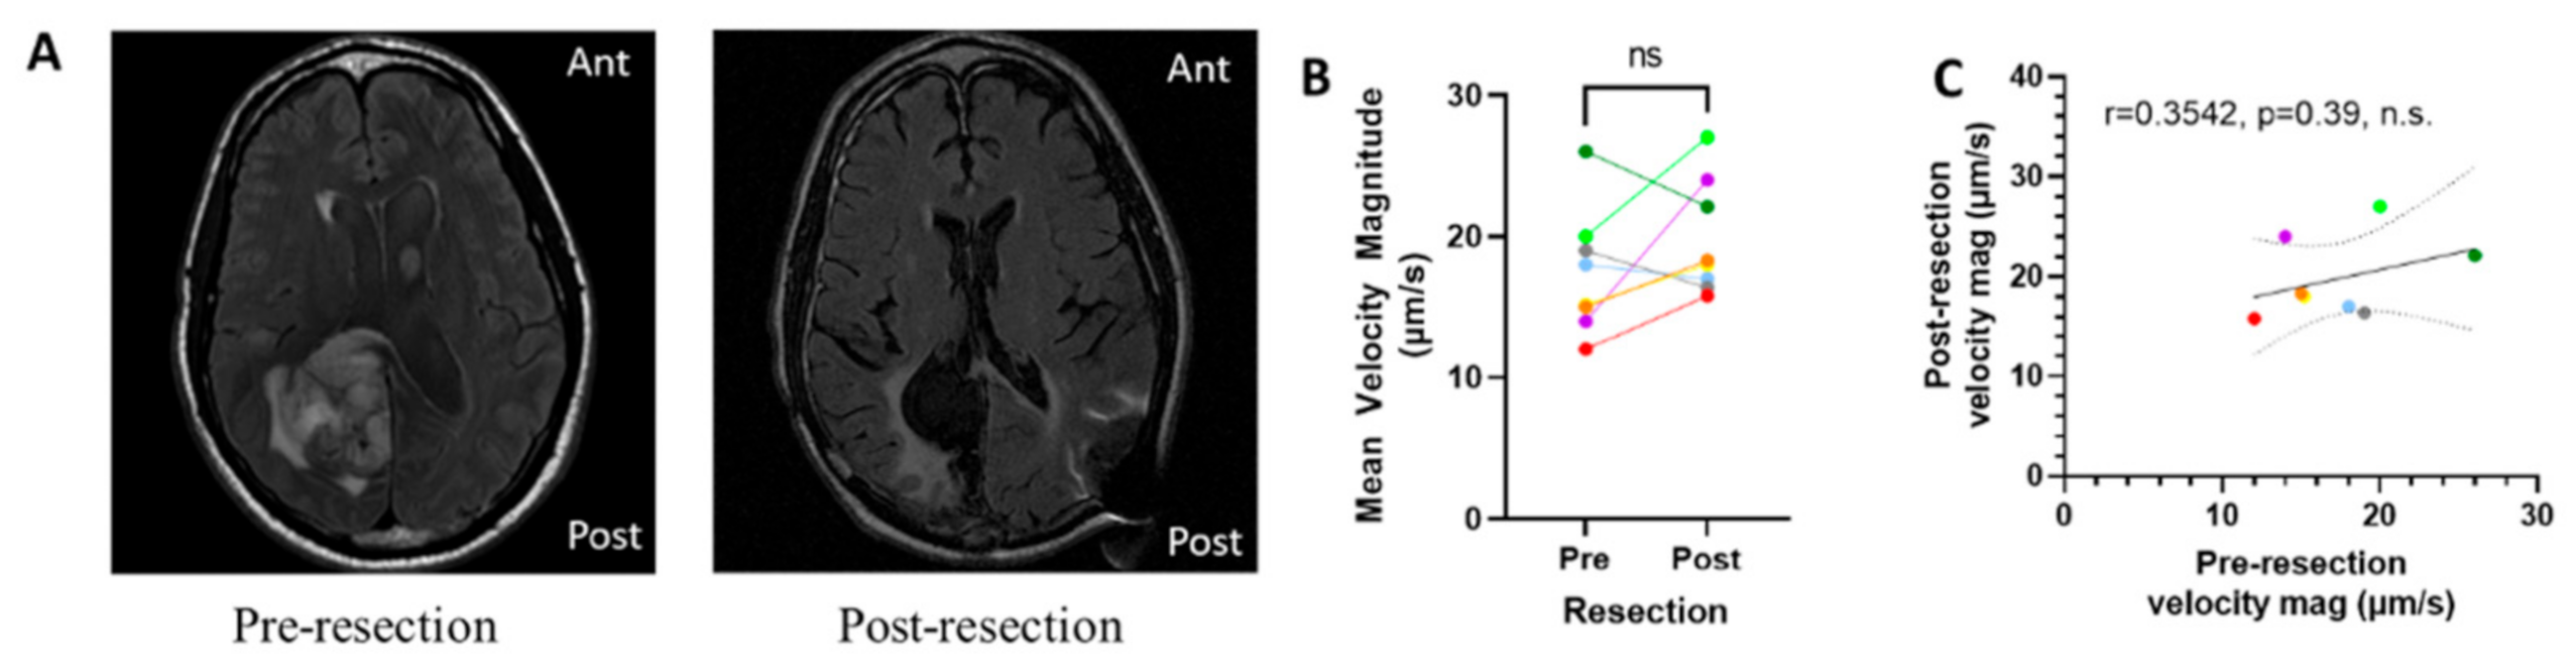
3.4. Resection of Tumor Does Not Eliminate Interstitial Fluid Flow
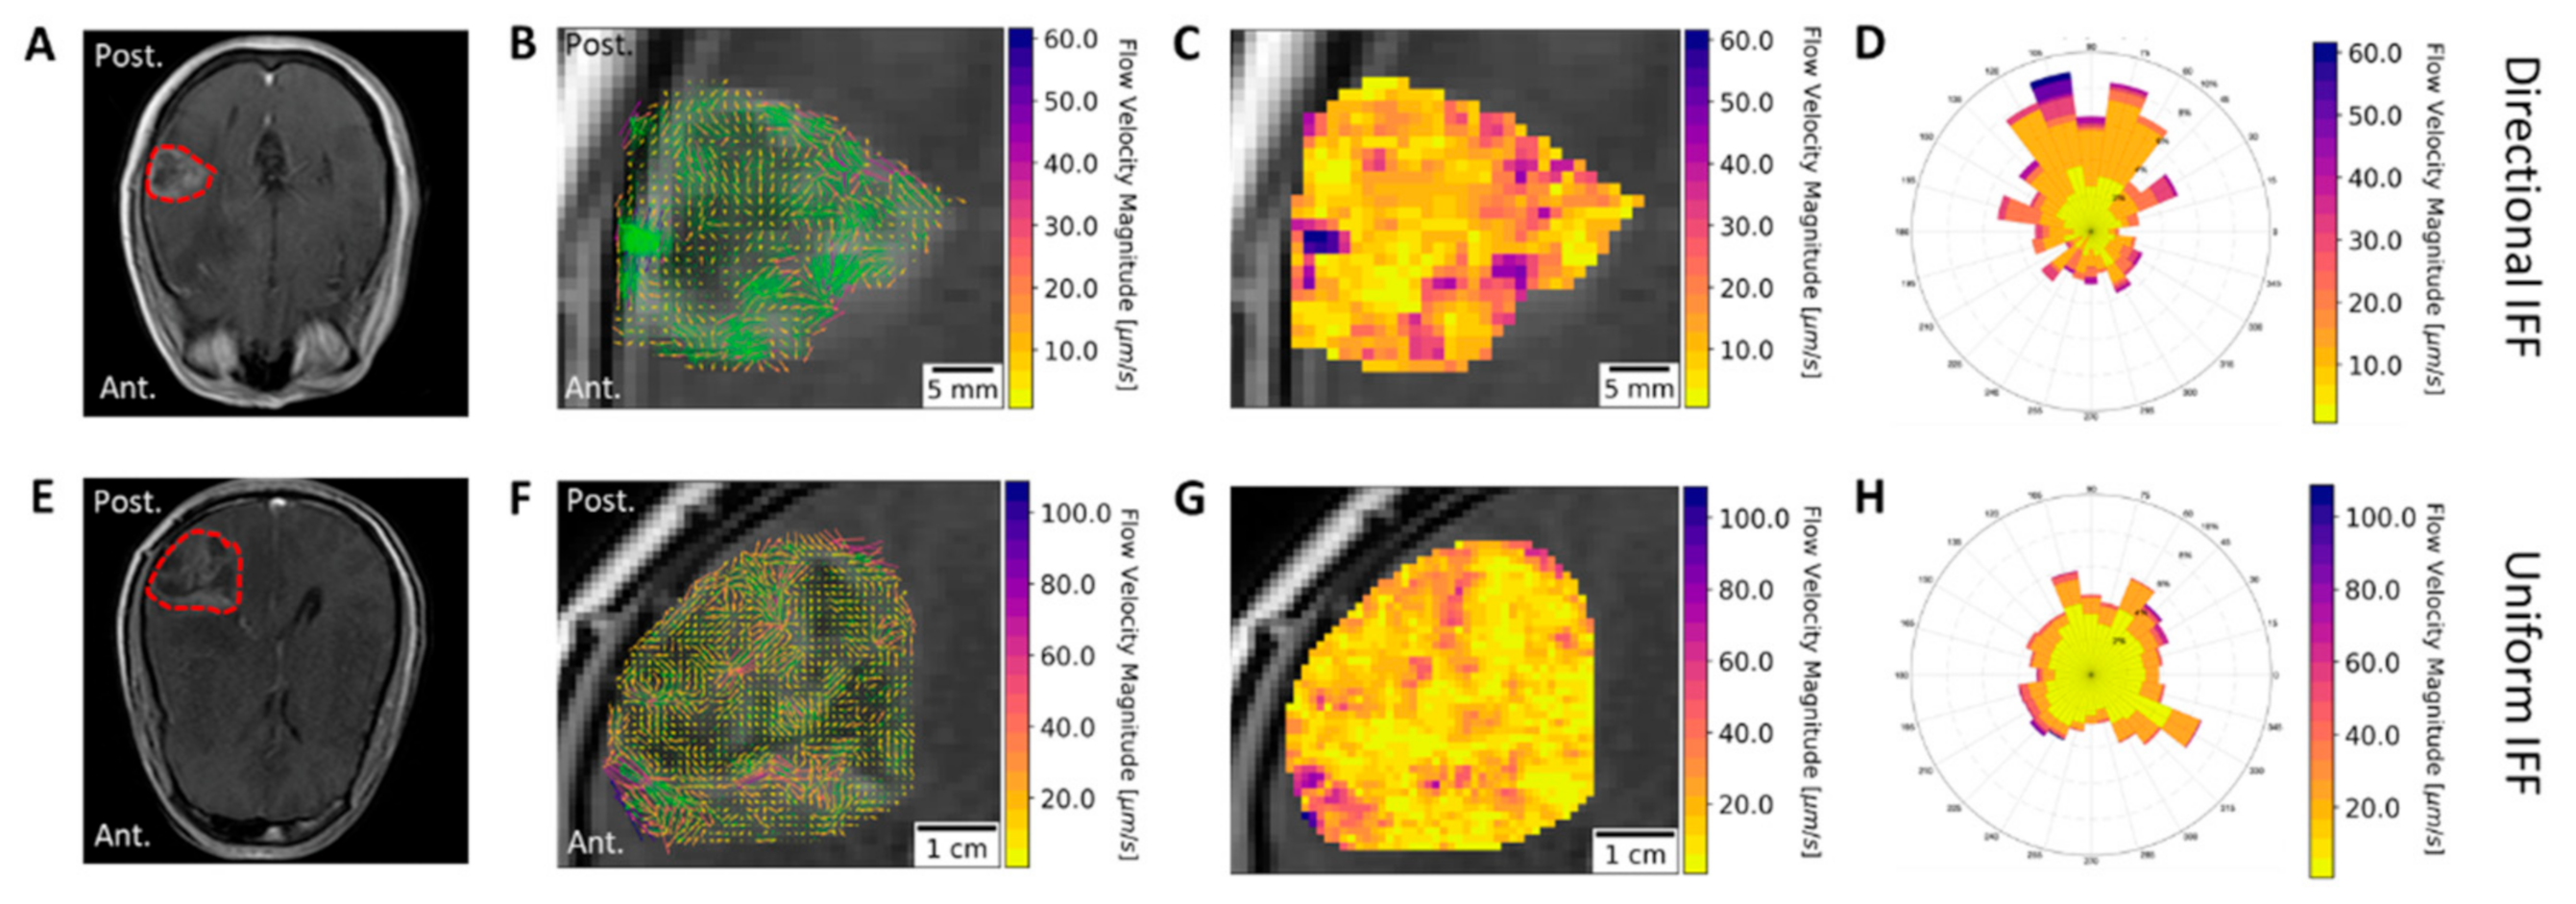
3.5. Directional Flow Velocity is Patient-Specific
4. Discussion
5. Conclusions
Supplementary Materials
Author Contributions
Funding
Institutional Review Board Statement
Informed Consent Statement
Data Availability Statement
Acknowledgments
Conflicts of Interest
References
- Stupp, R.; Mason, W.P.; van den Bent, M.J.; Weller, M.; Fisher, B.; Taphoorn, M.J.B.; Belanger, K.; Brandes, A.A.; Marosi, C.; Bogdahn, U.; et al. Radiotherapy plus concomitant and adjuvant temozolomide for glioblastoma. N. Engl. J. Med. 2005, 352, 987–996. [Google Scholar] [CrossRef] [PubMed]
- Shergalis, A.; Bankhead, A.; Luesakul, U.; Muangsin, N.; Neamati, N. Current challenges and opportunities in treating glioblastomas. Pharmacol. Rev. 2018, 70, 412–445. [Google Scholar] [CrossRef] [Green Version]
- Ellis, L.M.; Fidler, I.J. Finding the tumor copycat: Therapy fails, patients don’t. Nat. Med. 2010, 16, 974–975. [Google Scholar] [CrossRef] [PubMed]
- Ganipineni, L.P.; Danhier, F.; Préat, V. Drug delivery challenges and future of chemotherapeutic nanomedicine for glioblastoma treatment. J. Control. Release 2018, 281, 42–57. [Google Scholar] [CrossRef]
- Jain, R.K.; Di Tomaso, E.; Duda, D.G.; Loeffler, J.S.; Sorensen, A.G.; Batchelor, T.T. Angiogenesis in brain tumours. Nat. Rev. Neurosci. 2007, 8, 610–622. [Google Scholar] [CrossRef]
- Kofman, A.V.; Abounader, R. When tumor cells make blood vessels: Implications for glioblastoma therapy. Future Oncol. 2011, 7, 841–843. [Google Scholar] [CrossRef] [Green Version]
- Sarkaria, J.N.; Hu, L.S.; Parney, I.F.; Pafundi, D.H.; Brinkmann, D.H.; Laack, N.N.; Giannini, C.; Burns, T.C.; Kizilbash, S.H.; Laramy, J.K.; et al. Is the blood–brain barrier really disrupted in all glioblastomas? A critical assessment of existing clinical data. Neuro. Oncol. 2018, 20, 184–191. [Google Scholar] [CrossRef] [PubMed]
- Quail, D.F.; Joyce, J.A. The Microenvironmental Landscape of Brain Tumors. Cancer Cell 2017, 31, 326–341. [Google Scholar] [CrossRef] [Green Version]
- Hassid, Y.; Furman-Haran, E.; Margalit, R.; Eilam, R.; Degani, H. Noninvasive magnetic resonance imaging of transport and interstitial fluid pressure in ectopic human lung tumors. Cancer Res. 2006, 66, 4159–4166. [Google Scholar] [CrossRef] [PubMed] [Green Version]
- Raghavan, R.; Brady, M.L.; Rodríguez-Ponce, M.I.; Pedain, C.; Hartlep, A.; Sampson, J.H. Convection-enhanced delivery of therapeutics for brain disease, and its optimization. Neurosurg. Focus 2006, 20, E12. [Google Scholar] [CrossRef]
- Wadajkar, A.S.; Dancy, J.G.; Hersh, D.S.; Anastasiadis, P.; Tran, N.L.; Woodworth, G.F.; Winkles, J.A.; Kim, A.J. Tumor-targeted nanotherapeutics: Overcoming treatment barriers for glioblastoma. Wiley Interdiscip. Rev. Nanomed. Nanobiotechnol. 2017, 9. [Google Scholar] [CrossRef] [PubMed]
- Mehta, A.M.; Sonabend, A.M.; Bruce, J.N. Convection-Enhanced Delivery. Neurotherapeutics 2017, 14, 358–371. [Google Scholar] [CrossRef] [Green Version]
- Wiig, H.; Swartz, M.A. Interstitial Fluid and Lymph Formation and Transport: Physiological Regulation and Roles in Inflammation and Cancer. Physiol. Rev. 2012, 92, 1005–1060. [Google Scholar] [CrossRef]
- Stine, C.A.; Munson, J.M. Convection-Enhanced Delivery: Connection to and Impact of Interstitial Fluid Flow. Front. Oncol. 2019, 9. [Google Scholar] [CrossRef] [PubMed] [Green Version]
- Teo, C.S.; Tan, W.H.K.; Lee, T.; Wang, C.H. Transient interstitial fluid flow in brain tumors: Effect on drug delivery. Chem. Eng. Sci. 2005, 60, 4803–4821. [Google Scholar] [CrossRef]
- Sarntinoranont, M.; Rooney, F.; Ferrari, M. Interstitial stress and fluid pressure within a growing tumor. Ann. Biomed. Eng. 2003, 31, 327–335. [Google Scholar] [CrossRef] [PubMed]
- Boucher, Y.; Baxter, L.T.; Jain, R.K. Interstitial pressure gradients in tissue- isolated and subcutaneous tumours: Implications for therapy. Cancer Res. 1990, 50, 4478–4484. [Google Scholar] [CrossRef]
- Hompland, T.; Ellingsen, C.; Øvrebø, K.M.; Rofstad, E.K. Interstitial fluid pressure and associated lymph node metastasis revealed in tumors by dynamic contrast-enhanced MRI. Cancer Res. 2012, 72, 4899–4908. [Google Scholar] [CrossRef] [PubMed] [Green Version]
- Kingsmore, K.M.; Vaccari, A.; Abler, D.; Cui, S.X.; Epstein, F.H.; Rockne, R.C.; Acton, S.T.; Munson, J.M. MRI analysis to map interstitial flow in the brain tumor microenvironment. APL Bioeng. 2018, 2, 031905. [Google Scholar] [CrossRef] [PubMed]
- Sarntinoranont, M.; Chen, X.; Zhao, J.; Mareci, T.H. Computational model of interstitial transport in the spinal cord using diffusion tensor imaging. Ann. Biomed. Eng. 2006, 34, 1304–1321. [Google Scholar] [CrossRef]
- Chertok, B.; Moffat, B.A.; David, A.E.; Yu, F.; Bergemann, C.; Ross, B.D.; Yang, V.C. Iron oxide nanoparticles as a drug delivery vehicle for MRI monitored magnetic targeting of brain tumors. Biomaterials 2008, 29, 487–496. [Google Scholar] [CrossRef] [Green Version]
- Jackson, P.; Kim, M.; Hawkins-Daarud, A.; Singleton, K.; Mohammad, A.; Burns, T.; Parney, I.; Hu, L.; Kaufmann, T.; Elmquist, W.; et al. SCIDOT-16. T2-WEIGHTED IMAGING MAY BE INDICATIVE OF DRUG DISTRIBUTION IN GLIOBLASTOMA PATIENTS. Neuro-Oncology 2019, 21, vi274–vi275. [Google Scholar] [CrossRef]
- Gordon, Y.; Partovi, S.; Müller-Eschner, M.; Amarteifio, E.; Bäuerle, T.; Weber, M.-A.; Kauczor, H.-U.; Rengier, F. Dynamic contrast-enhanced magnetic resonance imaging: Fundamentals and application to the evaluation of the peripheral perfusion. Cardiovasc. Diagn. Ther. 2014, 4, 147–164. [Google Scholar] [CrossRef]
- Puchalski, R.B.; Shah, N.; Miller, J.; Dalley, R.; Nomura, S.R.; Yoon, J.G.; Smith, K.A.; Lankerovich, M.; Bertagnolli, D.; Bickley, K.; et al. An anatomic transcriptional atlas of human glioblastoma. Science 2018, 360, 660–663. [Google Scholar] [CrossRef] [PubMed] [Green Version]
- Clark, K.; Vendt, B.; Smith, K.; Freymann, J.; Kirby, J.; Koppel, P.; Moore, S.; Phillips, S.; Maffitt, D.; Pringle, M.; et al. The cancer imaging archive (TCIA): Maintaining and operating a public information repository. J. Digit. Imaging 2013, 26, 1045–1057. [Google Scholar] [CrossRef] [Green Version]
- Da Mesquita, S.; Louveau, A.; Vaccari, A.; Smirnov, I.; Cornelison, R.C.; Kingsmore, K.M.; Contarino, C.; Onengut-gumuscu, S.; Farber, E.; Raper, D.; et al. Functional aspects of meningeal lymphatics in ageing and Alzheimer ’s disease. Nature 2018. [Google Scholar] [CrossRef] [PubMed]
- Walid, M. Prognostic Factors for Long-Term Survival after Glioblastoma. Perm. J. 2008, 12, 45. [Google Scholar] [CrossRef] [Green Version]
- Ladomersky, E.; Scholtens, D.M.; Kocherginsky, M.; Hibler, E.A.; Bartom, E.T.; Otto-Meyer, S.; Zhai, L.; Lauing, K.L.; Choi, J.; Sosman, J.A.; et al. The Coincidence Between Increasing Age, Immunosuppression, and the Incidence of Patients With Glioblastoma. Front. Pharmacol. 2019, 10, 200. [Google Scholar] [CrossRef] [PubMed]
- Tofts, P.S.; Brix, G.; Buckley, D.L.; Evelhoch, J.L.; Henderson, E.; Knopp, M.V.; Larsson, H.B.W.; Lee, T.-Y.; Mayr, N.A.; Parker, G.J.M.; et al. Estimating Kinetic Parameters From Dynamic Contrast-Enhanced T1-Weighted\tMRI of a Diffusable Tracer: Standardized Quantities and Symbols. J. Magn. Reson. Imaging 1999, 10, 223–232. [Google Scholar] [CrossRef]
- Waldman, A.D.; Jackson, A.; Price, S.J.; Clark, C.A.; Booth, T.C.; Auer, D.P.; Tofts, P.S.; Collins, D.J.; Leach, M.O.; Rees, J.H. Quantitative imaging biomarkers in neuro-oncology. Nat. Rev. Clin. Oncol. 2009, 6, 445–454. [Google Scholar] [CrossRef]
- Baish, J.W.; Netti, P.A.; Jain, R.K. Transmural coupling of fluid flow in microcirculatory network and interstitium in tumors. Microvasc. Res. 1997, 53, 128–141. [Google Scholar] [CrossRef] [PubMed]
- Chauhan, V.P.; Stylianopoulos, T.; Boucher, Y.; Jain, R.K. Delivery of Molecular and Nanoscale Medicine to Tumors: Transport Barriers and Strategies. Annu. Rev. Chem. Biomol. Eng. 2011, 2, 281–298. [Google Scholar] [CrossRef] [PubMed]
- Chauhan, V.P.; Martin, J.D.; Liu, H.; Lacorre, D.A.; Jain, S.R.; Kozin, S.V.; Stylianopoulos, T.; Mousa, A.S.; Han, X.; Adstamongkonkul, P.; et al. Angiotensin inhibition enhances drug delivery and potentiates chemotherapy by decompressing tumour blood vessels. Nat. Commun. 2013, 4. [Google Scholar] [CrossRef] [Green Version]
- Boucher, Y.; Jain, R.K. Microvascular Pressure Is the Principal Driving Force for Interstitial Hypertension in Solid Tumors: Implications for Vascular Collapse. Cancer Res. 1992, 52, 5110–5114. [Google Scholar] [PubMed]
- Ewing, J.R.; Nagaraja, T.N.; Aryal, M.P.; Keenan, K.A.; Elmghirbi, R.; Bagher-Ebadian, H.; Panda, S.; Lu, M.; Mikkelsen, T.; Cabral, G.; et al. Peritumoral tissue compression is predictive of exudate flux in a rat model of cerebral tumor: An MRI study in an embedded tumor. NMR Biomed. 2015, 28, 1557–1569. [Google Scholar] [CrossRef] [PubMed]
- Ohara, S.; Nagai, H.; Matsumoto, T.; Banno, T. MR imaging of CSF pulsatory flow and its relation to intracranial pressure. J. Neurosurg. 1988, 69, 675–682. [Google Scholar] [CrossRef]
- Swinburne, N.; LoCastro, E.; Paudyal, R.; Oh, J.H.; Taunk, N.K.; Shah, A.; Beal, K.; Vachha, B.; Young, R.J.; Holodny, A.I.; et al. Computational Modeling of Interstitial Fluid Pressure and Velocity in Non-small Cell Lung Cancer Brain Metastases Treated With Stereotactic Radiosurgery. Front. Neurol. 2020, 11, 402. [Google Scholar] [CrossRef]
- Luetmer, P.H.; Huston, J.; Friedman, J.A.; Dixon, G.R.; Petersen, R.C.; Jack, C.R.; McClelland, R.L.; Ebersold, M.J.; Milhorat, T.H.; Hodge, C.J. Measurement of cerebrospinal fluid flow at the cerebral aqueduct by use of phase-contrast magnetic resonance imaging: Technique validation and utility in diagnosing idiopathic normal pressure hydrocephalus. Neurosurgery 2002, 50, 534–543. [Google Scholar] [CrossRef]
- Iliff, J.J.; Lee, H.; Yu, M.; Feng, T.; Logan, J.; Nedergaard, M.; Benveniste, H. Brain-wide pathway for waste clearance captured by contrast-enhanced MRI. J. Clin. Investig. 2013, 123, 1299–1309. [Google Scholar] [CrossRef] [PubMed] [Green Version]
- Iliff, J.J.; Wang, M.; Liao, Y.; Plogg, B.A.; Peng, W.; Gundersen, G.A.; Benveniste, H.; Vates, G.E.; Deane, R.; Goldman, S.A.; et al. A Paravascular Pathway Facilitates CSF Flow Through the Brain Parenchyma and the Clearance of Interstitial Solutes, Including Amyloid. Sci. Transl. Med. 2012, 4, 147ra111. [Google Scholar] [CrossRef] [Green Version]
- Naish, J.H.; Baldwin, R.C.; Patankar, T.; Jeffries, S.; Burns, A.S.; Taylor, C.J.; Waterton, J.C.; Jackson, A. Abnormalities of CSF flow patterns in the cerebral aqueduct in treatment-resistant late-life depression: A potential biomarker of microvascular angiopathy. Magn. Reson. Med. 2006, 56, 509–516. [Google Scholar] [CrossRef]
- Abbott, N.J.; Pizzo, M.E.; Preston, J.E.; Janigro, D.; Thorne, R.G. The role of brain barriers in fluid movement in the CNS: Is there a ‘glymphatic’ system? Acta Neuropathol. 2018, 135, 387–407. [Google Scholar] [CrossRef] [Green Version]
- Abbott, N.J. Evidence for bulk flow of brain interstitial fluid: Significance for physiology and pathology. Neurochem. Int. 2004, 45, 545–552. [Google Scholar] [CrossRef] [PubMed]
- Wu, C.X.; Lin, G.S.; Lin, Z.X.; Zhang, J.D.; Liu, S.Y.; Zhou, C.F. Peritumoral edema shown by MRI predicts poor clinical outcome in glioblastoma. World J. Surg. Oncol. 2015, 13. [Google Scholar] [CrossRef] [Green Version]
- Jang, S.H.; Wientjes, M.G.; Lu, D.; Au, J.L.S. Drug delivery and transport to solid tumors. Pharm. Res. 2003, 20, 1337–1350. [Google Scholar] [CrossRef] [PubMed]
- Cornelison, R.C.; Brennan, C.E.; Kingsmore, K.M.; Munson, J.M. Convective forces increase CXCR4-dependent glioblastoma cell invasion in GL261 murine model. Sci. Rep. 2018, 8, 17057. [Google Scholar] [CrossRef] [Green Version]
- Kingsmore, K.M.; Logsdon, D.K.; Floyd, D.H.; Peirce, S.M.; Purow, B.W.; Munson, J.M. Interstitial flow differentially increases patient-derived glioblastoma stem cell invasion via CXCR4, CXCL12, and CD44-mediated mechanisms. Integr. Biol. 2016, 8, 1246–1260. [Google Scholar] [CrossRef] [PubMed]
- Jackson, P.R.; Juliano, J.; Hawkins-Daarud, A.; Rockne, R.C.; Swanson, K.R. Patient-Specific Mathematical Neuro-Oncology: Using a Simple Proliferation and Invasion Tumor Model to Inform Clinical Practice. Bull. Math. Biol. 2015, 77. [Google Scholar] [CrossRef] [PubMed] [Green Version]
- Baldock, A.L.; Rockne, R.C.; Boone, A.D.; Neal, M.L.; Hawkins-Daarud, A.; Corwin, D.M.; Bridge, C.A.; Guyman, L.A.; Trister, A.D.; Mrugala, M.M.; et al. From patient-specific mathematical neuro-oncology to precision medicine. Front. Oncol. 2013, 3, 62. [Google Scholar] [CrossRef] [PubMed] [Green Version]
- Rockne, R.C.; Hawkins-Daarud, A.; Swanson, K.R.; Sluka, J.P.; Glazier, J.A.; Macklin, P.; Hormuth, D.A.; Jarrett, A.M.; Lima, E.A.B.F.; Tinsley Oden, J.; et al. The 2019 mathematical oncology roadmap. Phys. Biol. 2019, 16, 41005. [Google Scholar] [CrossRef] [PubMed]


Publisher’s Note: MDPI stays neutral with regard to jurisdictional claims in published maps and institutional affiliations. |
© 2021 by the authors. Licensee MDPI, Basel, Switzerland. This article is an open access article distributed under the terms and conditions of the Creative Commons Attribution (CC BY) license (http://creativecommons.org/licenses/by/4.0/).
Share and Cite
Chatterjee, K.; Atay, N.; Abler, D.; Bhargava, S.; Sahoo, P.; Rockne, R.C.; Munson, J.M. Utilizing Dynamic Contrast-Enhanced Magnetic Resonance Imaging (DCE-MRI) to Analyze Interstitial Fluid Flow and Transport in Glioblastoma and the Surrounding Parenchyma in Human Patients. Pharmaceutics 2021, 13, 212. https://doi.org/10.3390/pharmaceutics13020212
Chatterjee K, Atay N, Abler D, Bhargava S, Sahoo P, Rockne RC, Munson JM. Utilizing Dynamic Contrast-Enhanced Magnetic Resonance Imaging (DCE-MRI) to Analyze Interstitial Fluid Flow and Transport in Glioblastoma and the Surrounding Parenchyma in Human Patients. Pharmaceutics. 2021; 13(2):212. https://doi.org/10.3390/pharmaceutics13020212
Chicago/Turabian StyleChatterjee, Krishnashis, Naciye Atay, Daniel Abler, Saloni Bhargava, Prativa Sahoo, Russell C. Rockne, and Jennifer M. Munson. 2021. "Utilizing Dynamic Contrast-Enhanced Magnetic Resonance Imaging (DCE-MRI) to Analyze Interstitial Fluid Flow and Transport in Glioblastoma and the Surrounding Parenchyma in Human Patients" Pharmaceutics 13, no. 2: 212. https://doi.org/10.3390/pharmaceutics13020212