
Probing Critical Physical Properties of Lactose-Polyethylene Glycol Microparticles in Pulmonary Delivery of Chitosan Nanoparticles

 and
and
Abstract
:1. Introduction
2. Materials and Methods
2.1. Materials
2.2. Preparation of Lactose-PEG Microparticles
2.3. Preparation of Chitosan Nanoparticles
2.4. Physicochemical Analysis of Lactose-PEG Microparticles
2.4.1. Density
2.4.2. Size
2.4.3. Scanning Electron Microscopy
2.4.4. X-ray Powder Diffraction
2.5. Physicochemical Characterization of Chitosan Nanoparticles
2.5.1. Size
2.5.2. Zeta Potential
2.6. In Vitro Aerosolization and Inhalation
2.7. Fourier Transform Infrared (FTIR) Spectroscopy
3. Results and Discussion
3.1. Physicochemical Characteristics of Lactose-PEG Microparticles
3.1.1. Size
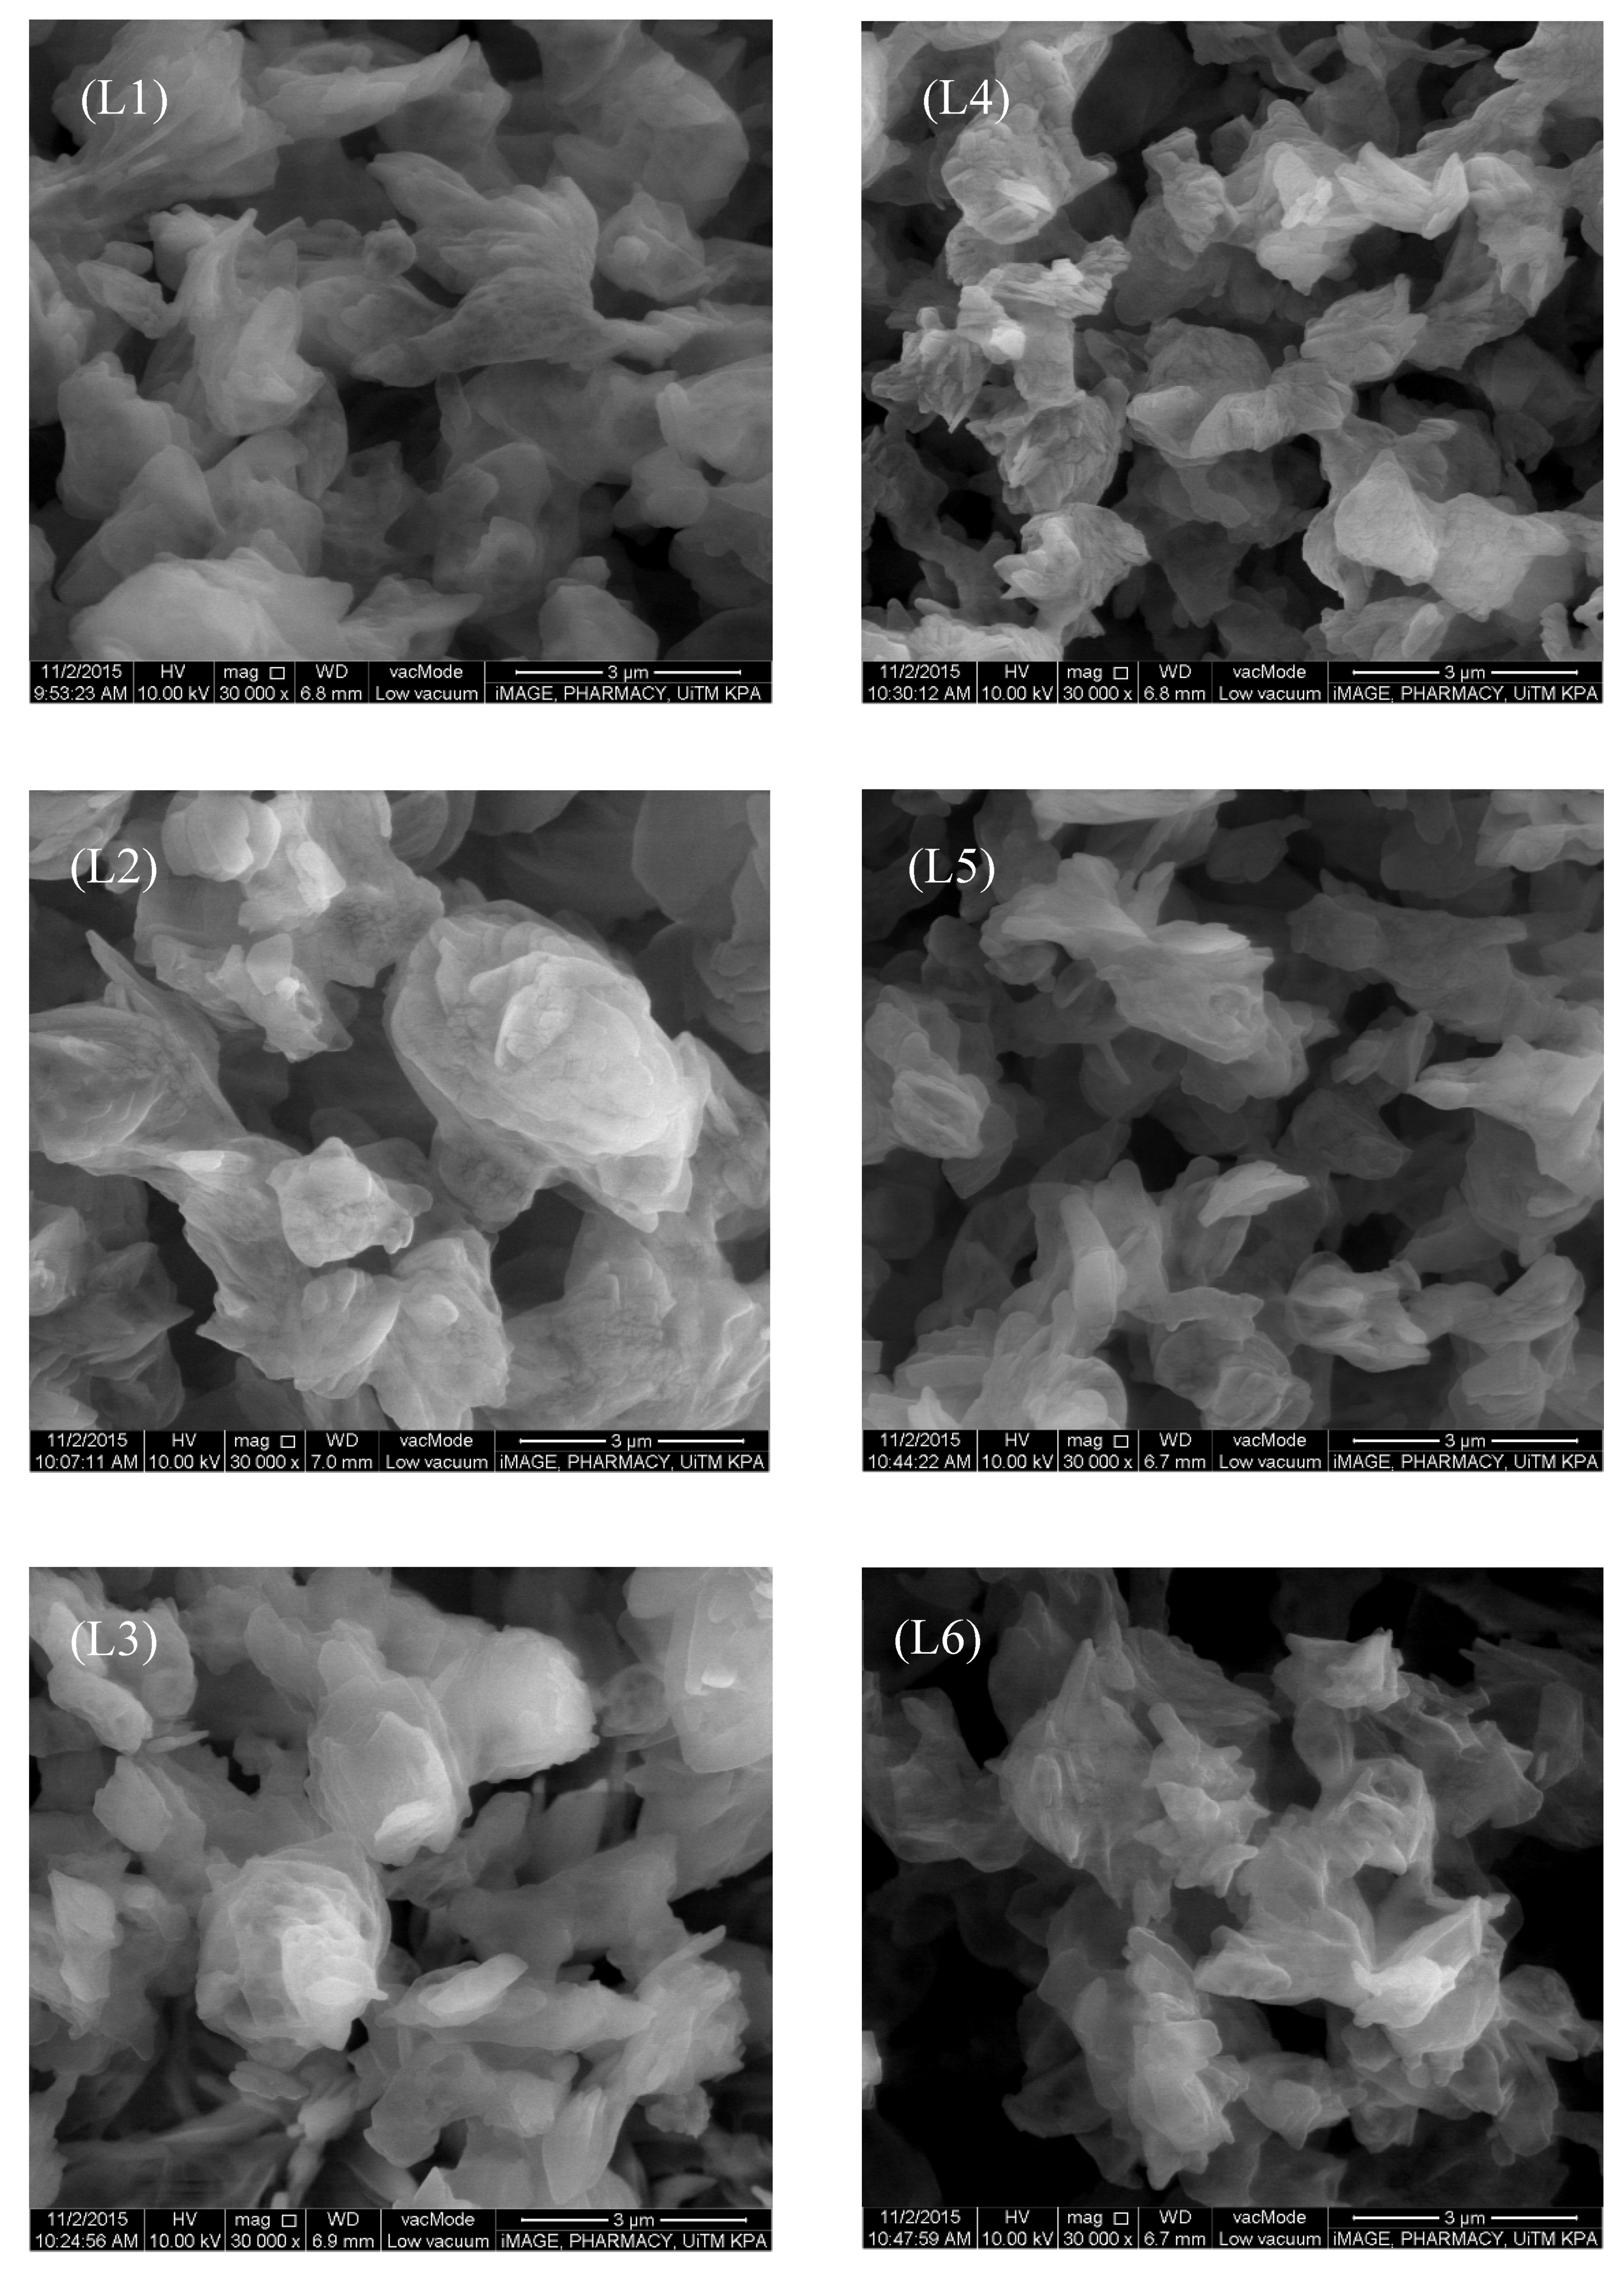
3.1.2. Morphology
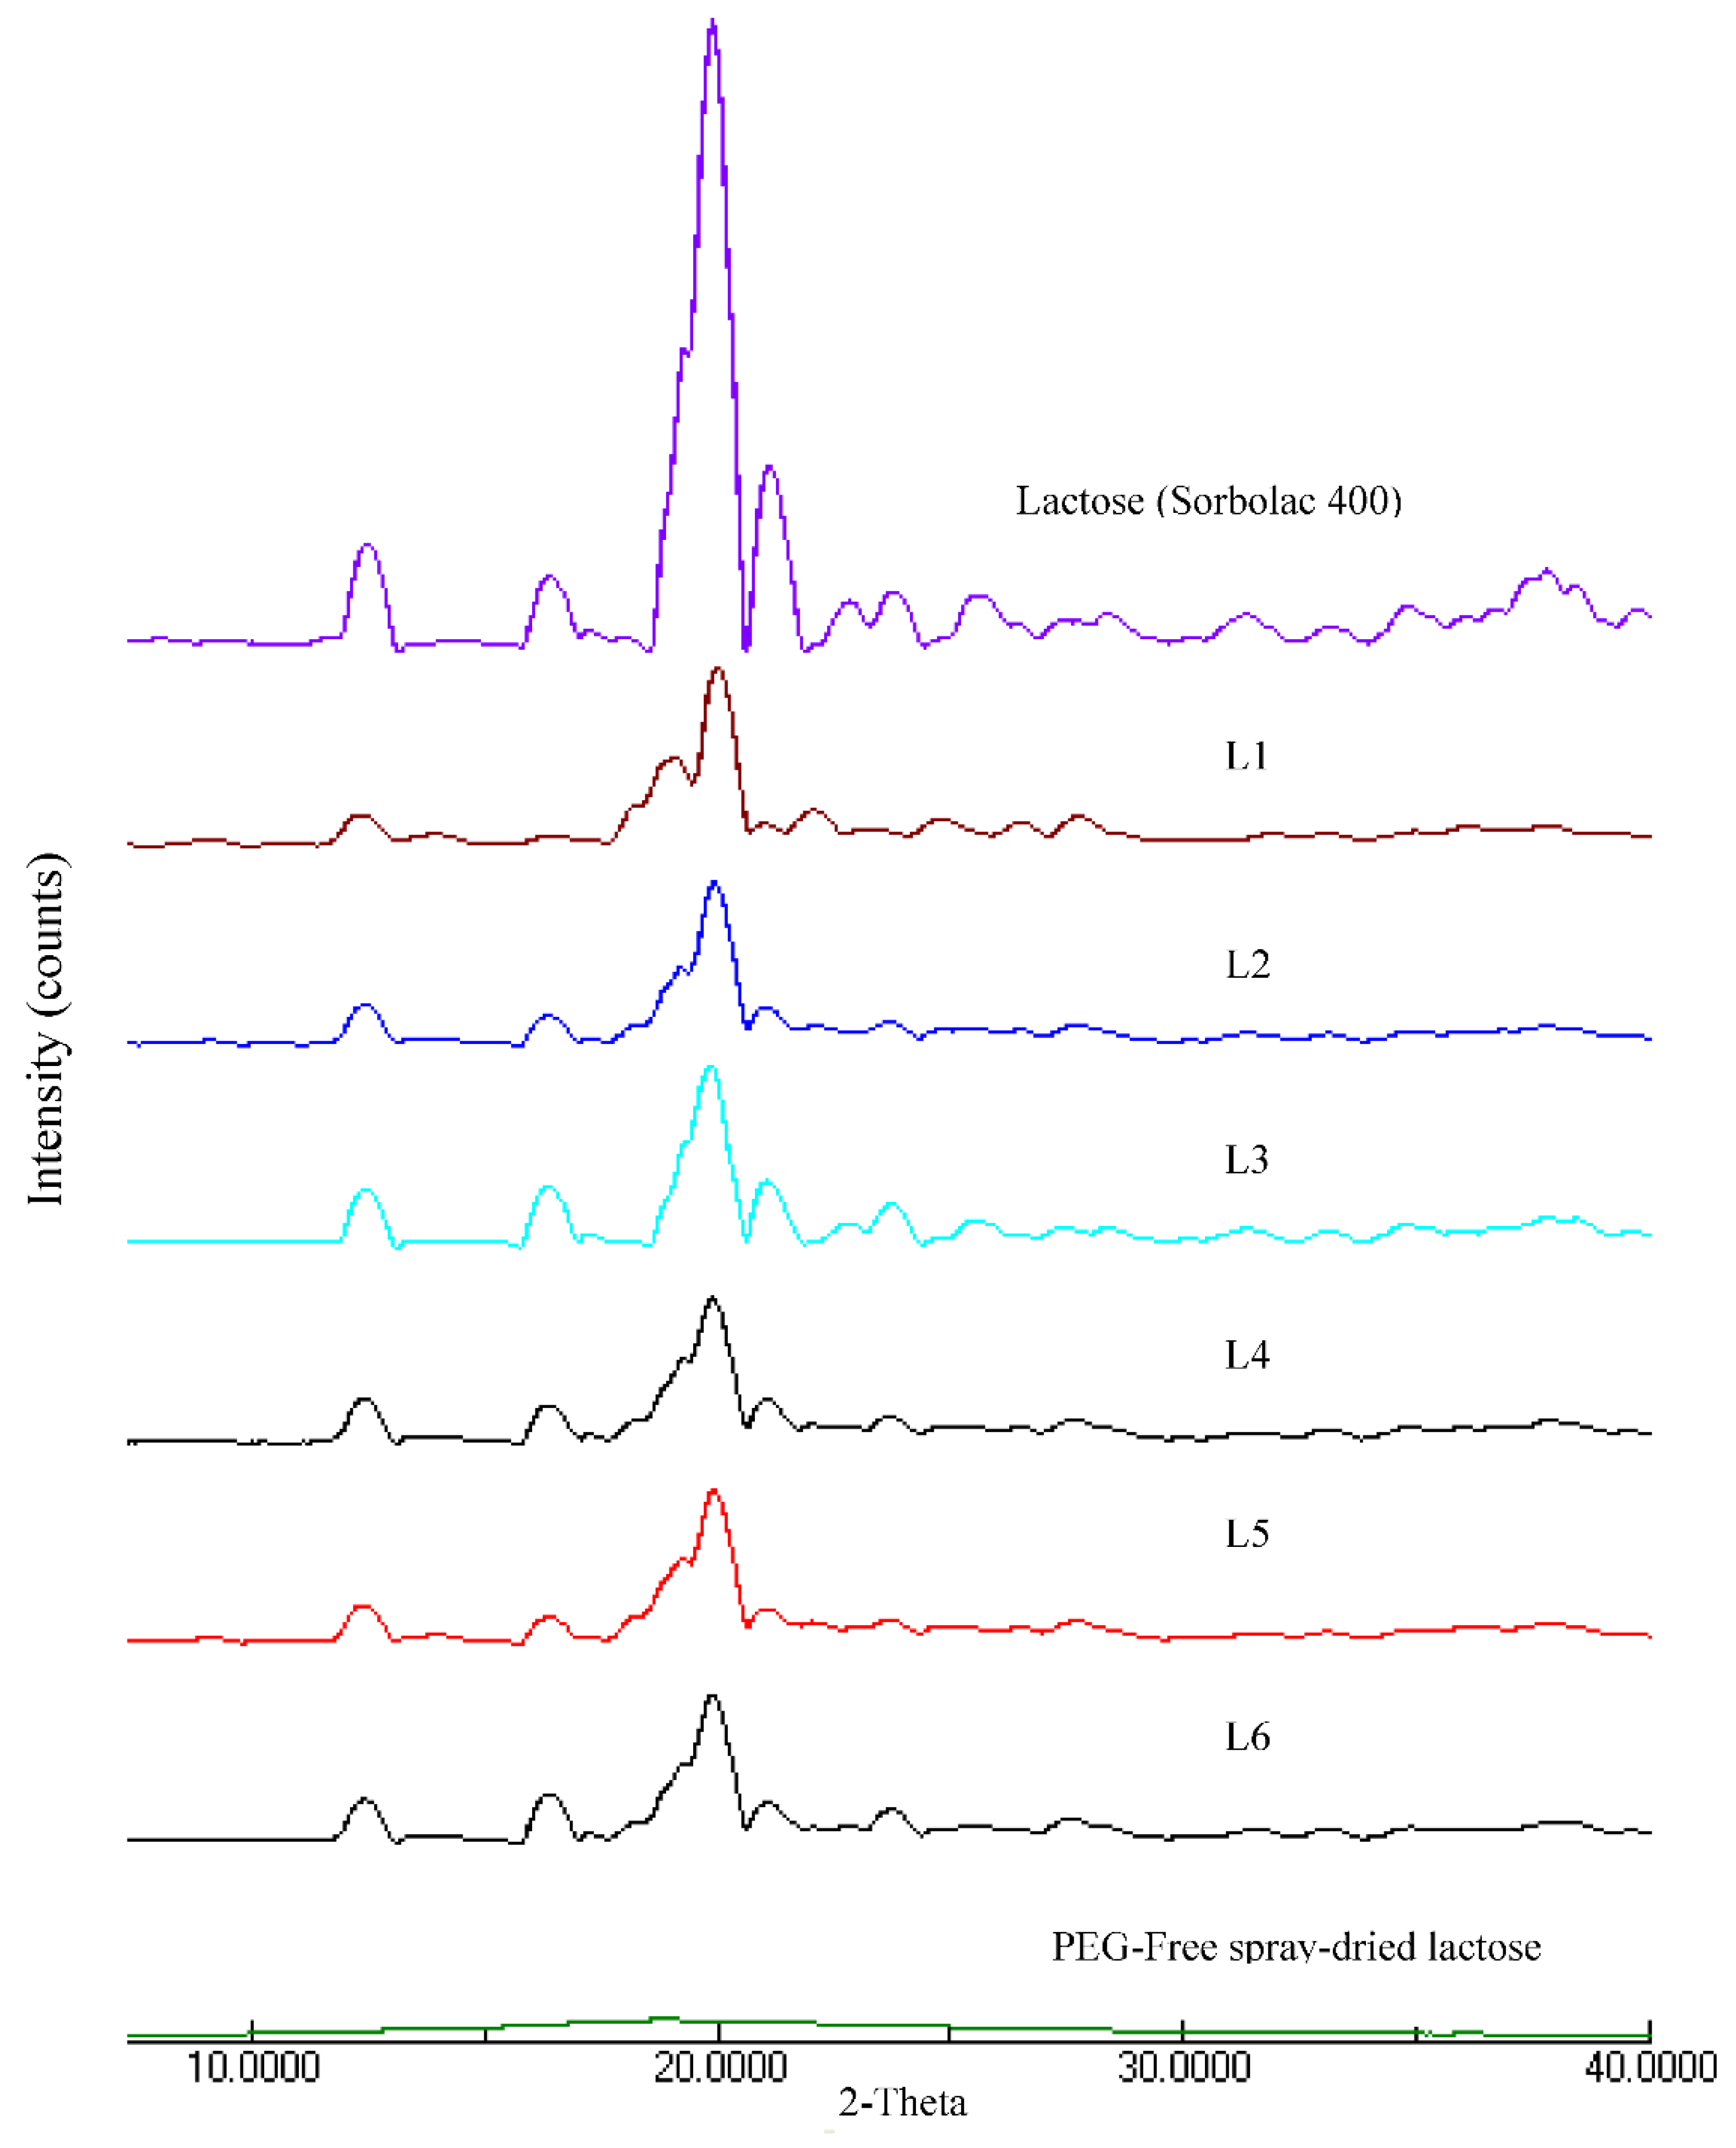
3.1.3. Crystallinity
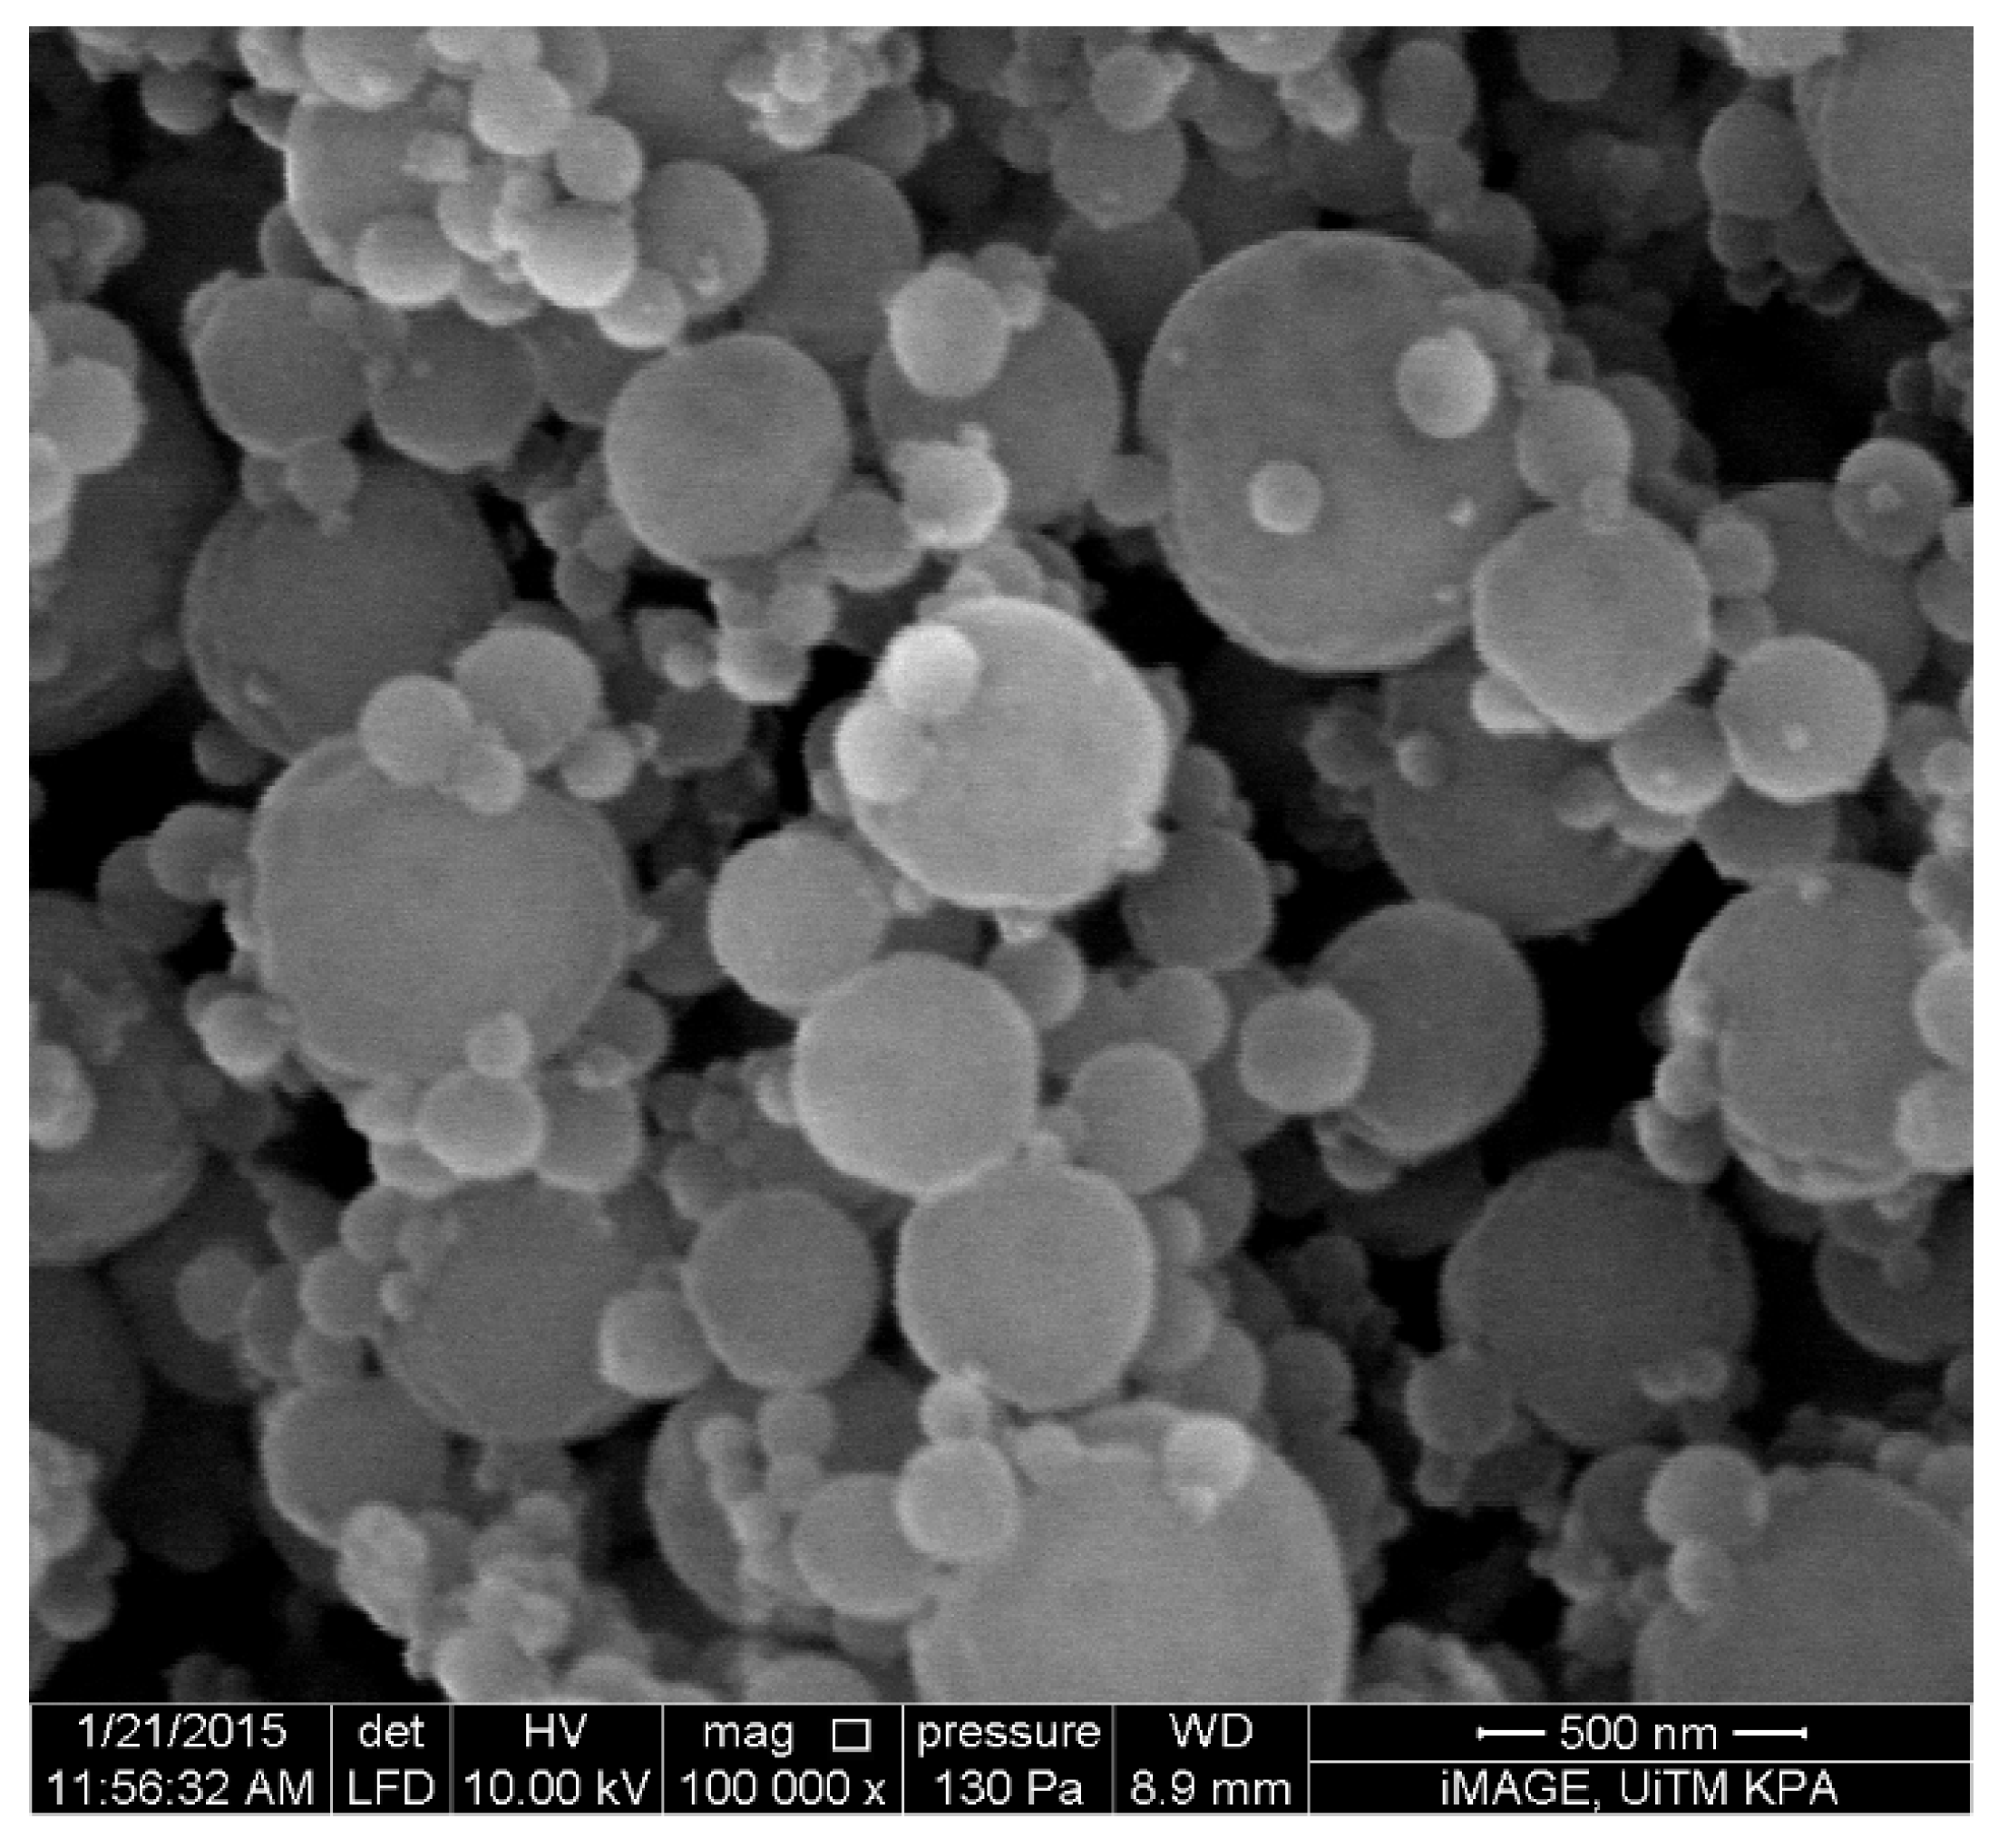
3.2. Physicochemical Characteristics of Chitosan Nanoparticles
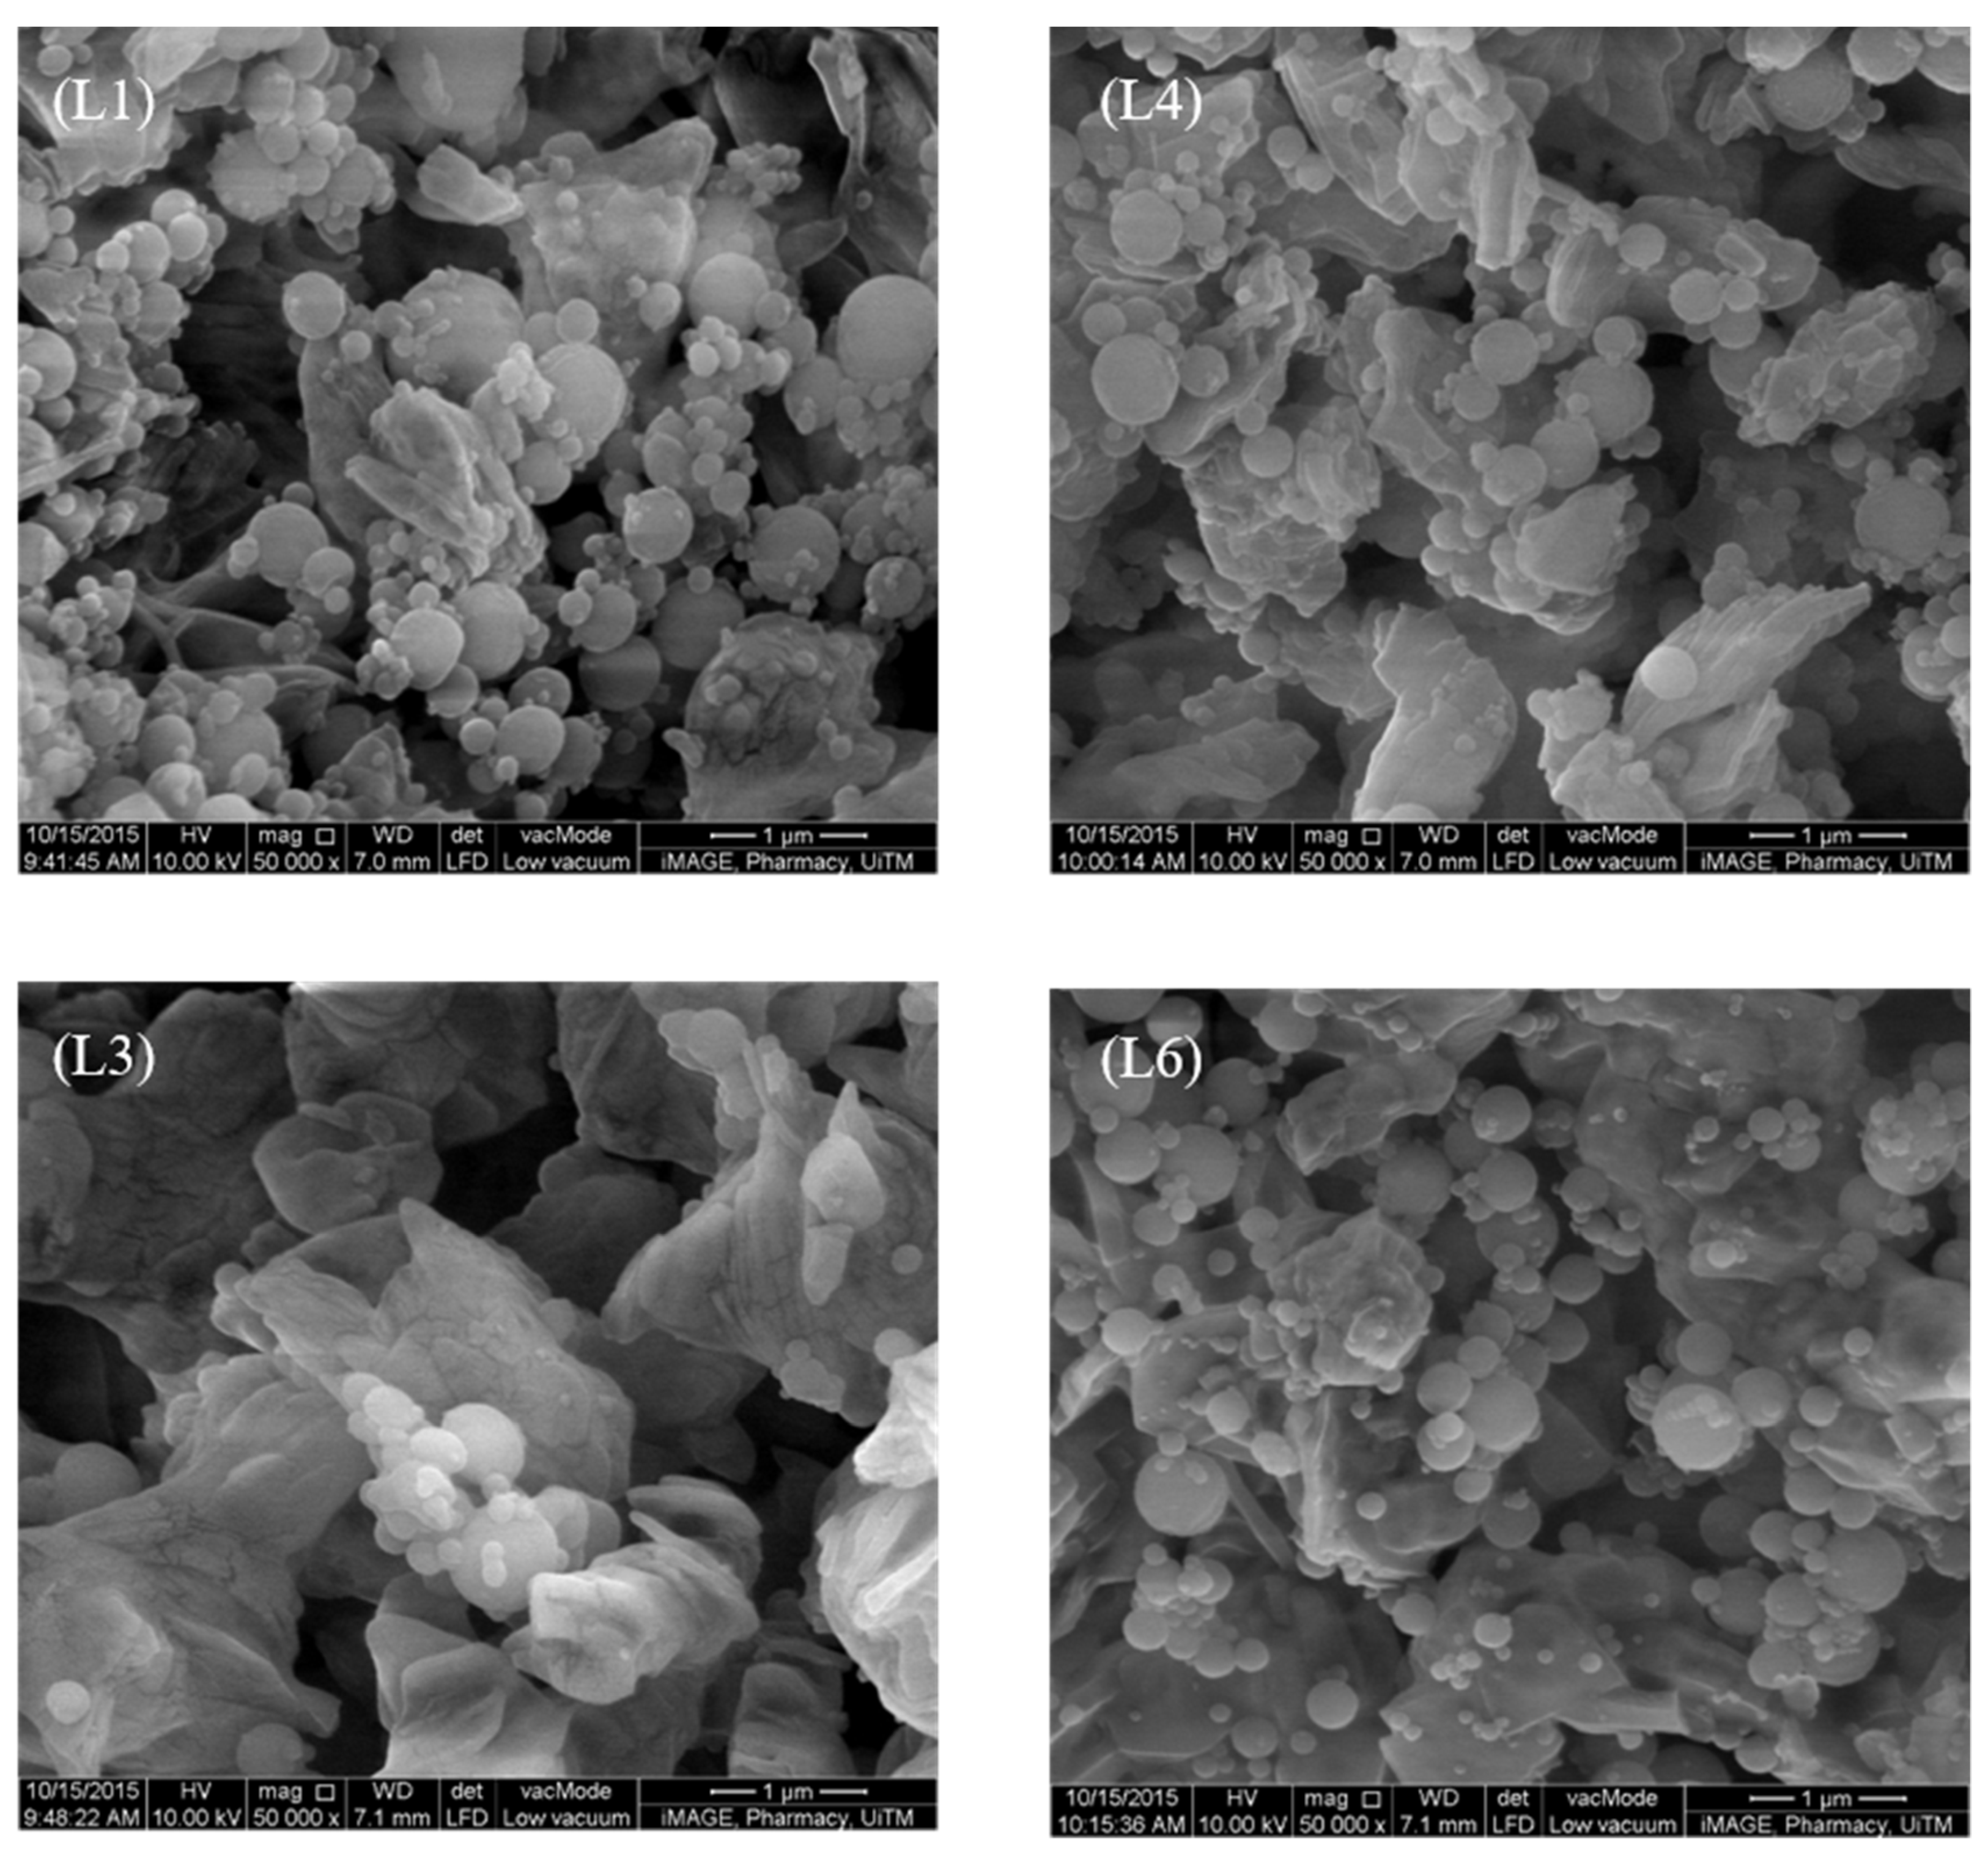
3.3. Nanoparticle–Microparticle Blend
3.4. FTIR Study
4. Conclusions
Author Contributions
Funding
Institutional Review Board Statement
Informed Consent Statement
Data Availability Statement
Conflicts of Interest
Abbreviations
References
- Zhou, Q.T.; Morton, D.A.V. Drug-lactose binding aspects in adhesive mixtures: Controlling performance in dry powder inhaler formulations by altering lactose carrier surfaces. Adv. Drug Deliv. Rev. 2012, 64, 275–284. [Google Scholar] [CrossRef]
- Pinto, J.T.; Zellnitz, S.; Guidi, T.; Roblegg, E.; Paudel, A. Assessment of dry powder inhaler carrier targeted design: A comparative case study of diverse anomeric compositions and physical properties of lactose. Mol. Pharm. 2018, 15, 2827–2839. [Google Scholar] [CrossRef] [PubMed]
- Lee, H.J.; Lee, H.G.; Kwon, Y.B.; Kim, J.Y.; Rhee, Y.S.; Chon, J.; Park, E.S.; Kim, D.W.; Park, C.W. The role of lactose carrier on the powder behavior and aerodynamic performance of bosentan microparticles for dry powder inhalation. Eur. J. Pharm. Sci. 2018, 117, 279–289. [Google Scholar] [CrossRef] [PubMed]
- Molina, C.; Kaialy, W.; Chen, Q.; Commandeur, D.; Nokhodchi, A. Agglomerated novel spray-dried lactose-leucine tailored as a carrier to enhance the aerosolization performance of salbutamol sulfate from DPI formulations, Drug Deliv. Transl. Res. 2018, 8, 1769–1780. [Google Scholar] [CrossRef] [Green Version]
- Smyth, H.D.C.; Hickey, A.J. Carriers in Drug Powder Delivery, Am. J. Drug Deliv. 2005, 3, 117–132. [Google Scholar] [CrossRef]
- Odziomek, M.; Sosnowski, T.R.; Gradoń, L. Conception, preparation and properties of functional carrier particles for pulmonary drug delivery. Int. J. Pharm. 2012, 433, 51–59. [Google Scholar] [CrossRef] [PubMed]
- Sheshala, R.; Anuar, N.K.; Samah, N.H.A.; Wong, T.W. In vitro drug dissolution/permeation testing of nanocarriers for skin application: A comprehensive review. AAPS PharmSciTech. 2019, 20, 164. [Google Scholar] [CrossRef] [PubMed]
- Smola, M.; Vandamme, T.; Sokolowski, A. Nanocarriers as pulmonary drug delivery systems to treat and to diagnose respiratory and non respiratory diseases. Int. J. Nanomed. 2008, 3, 1–19. [Google Scholar]
- Patil, T.S.; Deshpande, A.S. Mannosylated nanocarriers mediated site-specific drug delivery for the treatment of cancer and other infectious diseases: A state of the art review. J. Control. Release 2020, 320, 239–252. [Google Scholar] [CrossRef] [PubMed]
- Bharathi, D.; Ranjithkumar, R.; Chandarshekar, B.; Bhuvaneshwari, V. Bio-inspired synthesis of chitosan/copper oxide nanocomposite using rutin and their anti-proliferative activity in human lung cancer cells. Int. J. Biol. Macromol. 2019, 141, 476–483. [Google Scholar] [CrossRef]
- Chi, J.; Jiang, Z.; Qiao, J.; Peng, Y.; Liu, W.; Han, B. Synthesis and anti-metastasis activities of norcantharidin-conjugated carboxymethyl chitosan as a novel drug delivery system. Carbohydr. Polym. 2019, 214, 80–89. [Google Scholar] [CrossRef]
- Cirillo, G.; Vittorio, O.; Kunhardt, D.; Valli, E.; Voli, F.; Farfalla, A.; Curcio, M.; Spizzirri, U.G.; Hampel, S. Combining carbon nanotubes and chitosan for the vectorization of methotrexate to lung cancer cells. Materials 2019, 12, 2889. [Google Scholar] [CrossRef] [Green Version]
- Li, W.; Hu, X.; Wang, S.; Xing, Y.; Wang, H.; Nie, Y.; Liu, T.; Song, K. Multiple comparisons of three different sources of biomaterials in the application of tumor tissue engineering in vitro and in vivo. Int. J. Biol. Macromol. 2019, 130, 166–176. [Google Scholar] [CrossRef]
- Pandey, P.; Dua, K.; Dureja, H. Erlotinib loaded chitosan nanoparticles: Formulation, physicochemical characterization and cytotoxic potential. Int. J. Biol. Macromol. 2019, 139, 1304–1316. [Google Scholar] [CrossRef] [PubMed]
- Tao, L.; Jiang, J.; Gao, Y.; Wu, C.; Liu, Y. Biodegradable alginate-chitosan hollow nanospheres for codelivery of doxorubicin and paclitaxel for the effect of human lung cancer A549 cells. Biomed Res. Int. 2018, 2018, 4607945. [Google Scholar] [CrossRef] [PubMed]
- Wang, F.; Wang, Y.; Ma, Q.; Cao, Y.; Yu, B. Development and characterization of folic acid-conjugated chitosan nanoparticles for targeted and controlled delivery of gemcitabinein lung cancer therapeutics. Artif. Cells Nanomed. Biotechnol. 2017, 45, 1530–1538. [Google Scholar] [CrossRef] [PubMed]
- Shah, K.; Chan, L.W.; Wong, T.W. Critical physicochemical and biological attributes of nanoemulsions for pulmonary delivery of rifampicin by nebulization technique in tuberculosis treatment. Drug Deliv. 2017, 24, 1631–1647. [Google Scholar] [CrossRef] [Green Version]
- Rosière, R.; van Woensel, M.; Gelbcke, M.; Mathieu, V.; Hecq, J.; Mathivet, T.; Vermeersch, M.; van Antwerpen, P.; Amighi, K.; Wauthoz, N. New folate-grafted chitosan derivative to improve delivery of paclitaxel-loaded solid lipid nanoparticles for lung tumor therapy by inhalation. Mol. Pharm. 2018, 15, 899–910. [Google Scholar] [CrossRef]
- Yang, W.; Peters, J.I.; Williams, R.O. Inhaled nanoparticles-A current review. Int. J. Pharm. 2008, 356, 239–247. [Google Scholar] [CrossRef]
- Alhajj, N.; Zakaria, Z.; Naharudin, I.; Ahsan, F.; Li, W.; Wong, T.W. Critical physicochemical attributes of chitosan nanoparticles admixed lactose-PEG 3000 microparticles in pulmonary inhalation. Asian J. Pharm. Sci. 2020, 12, 374–384. [Google Scholar] [CrossRef]
- Agnihotri, S.A.; Mallikarjuna, N.N.; Aminabhavi, T.M. Recent advances on chitosan-based micro- and nanoparticles in drug delivery. J. Control. Release 2004, 100, 5–28. [Google Scholar] [CrossRef]
- Pilcer, G.; Amighi, K. Formulation strategy and use of excipients in pulmonary drug delivery. Int. J. Pharm. 2010, 392, 1–19. [Google Scholar] [CrossRef]
- Luo, Y.; Zhang, Z.; Huang, G.; Yu, H.; Ma, Y.; Zheng, Q.; Yue, P. Roles of maltodextrin and inulin as matrix formers on particle performance of inhalable drug nanocrystal-embedded microparticles. Carbohydr. Polym. 2020, 235, 115937. [Google Scholar] [CrossRef] [PubMed]
- Zeng, X.M.; Martin, G.P.; Marriott, C.; Pritchard, J. The influence of carrier morphology on drug delivery by dry powder inhalers. Int. J. Pharm. 2000, 200, 93–106. [Google Scholar] [CrossRef]
- Zeng, X.M.; Martin, G.P.; Marriott, C.; Pritchard, J. Lactose as a carrier in dry powder formulations: The influence of surface characteristics on drug delivery. J. Pharm. Sci. 2001, 90, 1424–1434. [Google Scholar] [CrossRef] [PubMed]
- Rasul, S.M.; Muniandy, M.T.A.; Zakaria, Z.; Shah, K.; Chee, C.F.; Dabbagh, A.; Rahman, N.A.; Wong, T.W. A review on chitosan and its development as pulmonary particulate anti-infective and anti-cancer drug carriers. Carbohydr. Polym. 2020, 250, 116800. [Google Scholar] [CrossRef] [PubMed]
- Garbuzenko, O.B.; Mainelis, G.; Taratula, O.; Minko, T. Inhalation treatment of lung cancer: The influence of composition, size and shape of nanocarriers on their lung accumulation and retention. Cancer Biol. Med. 2014, 11, 44–55. [Google Scholar] [PubMed]
- Mehta, P. Dry powder inhalers: A focus on advancements in novel drug delivery systems. J. Drug Deliv. 2016, 2016, 8290963. [Google Scholar] [CrossRef] [Green Version]
- Segal, L.; Creely, J.J.; Martin, A.E.; Conrad, C.M. An empirical method for estimating the degree of crystallinity of native cellulose using the X-ray diffractometer. Text. Res. J. 1959, 29, 786–794. [Google Scholar] [CrossRef]
- Kumar, A.B.V.; Varadaraj, M.C.; Lalitha, R.G.; Tharanathan, R.N. Low molecular weight chitosans: Preparation with the aid of papain and characterization. Biochim. Biophys. Acta—Gen. Subj. 2004, 1670, 137–146. [Google Scholar] [CrossRef]
- Haglund, B.O. Solubility studies of polyethylene glycols in ethanol and water. Thermochim. Acta 1987, 114, 97–102. [Google Scholar] [CrossRef]
- Chidavaenzi, O.C.; Buckton, G.; Koosha, F. The effect of co-spray drying with polyethylene glycol 4000 on the crystallinity and physical form of lactose. Int. J. Pharm. 2001, 216, 43–49. [Google Scholar] [CrossRef]
- Corrigan, D.O.; Healy, A.M.; Corrigan, O.I. The effect of spray drying solutions of polyethylene glycol (PEG) and lactose/PEG on their physicochemical properties. Int. J. Pharm. 2002, 235, 193–205. [Google Scholar] [CrossRef]
- Hellrup, J.; Mahlin, D. Confinement of amorphous lactose in pores formed upon co-spray drying with nanoparticles. J. Pharm. Sci. 2017, 106, 322–330. [Google Scholar] [CrossRef] [Green Version]
- Harjunen, P.; Lehto, V.P.; Valisaari, J.; Lankinen, T. Effecst of ethanol to water ratio in feed solution on the crystallinity of spray-dried lactose. Drug Dev. Ind. Pharm. 2002, 28, 949–955. [Google Scholar] [CrossRef] [PubMed]
- Noraizaan, A.N.; Wong, T.W. Physicochemical effects of lactose microcarrier on inhalation performance of rifampicin in polymeric nanoparticles. Powder Technol. 2017, 310, 272–281. [Google Scholar] [CrossRef]
- Hogg, J.C. Response of the lung to inhaled particles. Med. J. Aust. 1985, 142, 675. [Google Scholar] [CrossRef] [PubMed]


| Formulation/Processing Condition | L1 | L2 | L3 | L4 | L5 | L6 |
|---|---|---|---|---|---|---|
| Lactose concentration (%w/w) | 2 | 2 | 2 | 2 | 2 | 2 |
| PEG concentration (%w/w) | 2.5 | 2.5 | 2.5 | 2.5 | 2.5 | 2.5 |
| PEG molecular weight (g/mol) | 400 | 1000 | 3000 | 400 | 1000 | 3000 |
| Ethanol concentration (%w/w) | 0 | 0 | 0 | 50 | 50 | 50 |
| Feeding rate (mL/min) | 2 | 2 | 2 | 2 | 2 | 2 |
| Inlet temperature (°C) | 70 | 70 | 70 | 70 | 70 | 70 |
| Outlet temperature (°C) | 26 | 25.6 | 27.5 | 26.9 | 27.3 | 27.6 |
| Atomizing pressure (bar) | 5.5 | 5.5 | 5.5 | 5.5 | 5.5 | 5.5 |
| Particle Characteristic | L1 | L2 | L3 | L4 | L5 | L6 |
|---|---|---|---|---|---|---|
| Crystallinity (Peak area2θ=19.98°) | 888.27 ± 3.36 | 705.57 ± 14.10 | 508.73 ± 11.98 | 612.90 ± 17.90 | 764.03 ± 2.00 | 618.53 ± 13.48 |
| pb (g/cm3) | 0.150 ± 0.002 | 0.119 ± 0.001 | 0.102 ± 0.002 | 0.112 ± 0.003 | 0.091 ± 0.002 | 0.113 ± 0.002 |
| pt (g/cm3) | 0.283 ± 0.005 | 0.310 ± 0.001 | 0.212 ± 0.003 | 0.313 ± 0.002 | 0.252 ± 0.003 | 0.271 ± 0.002 |
| Carr’s Index (%) | 46.98 ± 1.67 | 61.51 ± 0.22 | 51.91 ± 0.13 | 64.25 ± 1.07 | 63.99 ± 0.52 | 58.47 ± 0.80 |
| Hausner Ratio | 1.89 ± 0.06 | 2.60 ± 0.02 | 2.08 ± 0.01 | 2.80 ± 0.08 | 2.78 ± 0.04 | 2.41 ± 0.05 |
| Circ | 0.12 ± 0.01 | 0.14 ± 0.02 | 0.16 ± 0.06 | 0.22 ± 0.02 | 0.27 ± 0.02 | 0.16 ± 0.02 |
| Ra (nm) | 129.73 ± 7.62 | 75.19 ± 1.47 | 127.21 ± 1.11 | 114.70 ± 17.83 | 86.24 ± 2.91 | 122.84 ± 1.25 |
| Specific surface area (m2/g) | 1.49 ± 0.08 | 1.24 ± 0.02 | 1.90 ± 0.01 | 1.55 ± 0.04 | 0.99 ± 0.02 | 1.31 ± 0.20 |
| D[4,3] (µm) | 23.09 ± 0.64 | 19.23 ± 0.14 | 20.61 ± 1.04 | 15.53 ± 1.54 | 18.11 ± 3.44 | 20.74 ± 1.62 |
| D[3,2] (µm) | 4.03 ± 0.25 | 4.84 ± 0.07 | 3.15 ± 0.02 | 3.87 ± 0.20 | 6.07 ± 0.14 | 4.62 ± 0.69 |
| Span | 6.57 ± 0.19 | 3.20 ± 0.04 | 9.76 ± 0.15 | 4.08 ± 0.27 | 2.05 ± 0.07 | 4.20 ± 0.35 |
| d10 (µm) | 1.72 ± 0.06 | 2.62 ± 0.06 | 1.58 ± 0.01 | 1.72 ± 0.04 | 4.02 ± 0.10 | 1.91 ± 0.18 |
| d50 (µm) | 9.33 ± 1.01 | 13.23 ± 0.18 | 5.43 ± 0.10 | 8.30 ± 0.27 | 13.32 ± 0.15 | 10.44 ± 0.48 |
| d90 (µm) | 63.03 ± 4.79 | 43.60 ± 1.14 | 54.60 ± 1.70 | 35.59 ± 1.86 | 31.30 ± 1.26 | 45.89 ± 5.85 |
| L1 | L3 | L4 | L6 | |
|---|---|---|---|---|
| MMAD (µm) | 2.95 ± 0.17 | 4.30 ± 0.85 | 3.90 ± 0.92 | 3.16 ± 0.30 |
| GSD | 3.22 ± 0.60 | 5.10 ± 0.35 | 3.74 ± 0.19 | 3.18 ± 0.40 |
| TD mg | 15 | 15 | 15 | 15 |
| ED mg | 11.81 ± 1.39 | 12.40 ± 1.80 | 12.81 ± 1.65 | 14.42 ± 0.49 |
| DD mg | 4.38 ± 0.29 | 6.70 ± 1.30 | 6.52 ± 1.33 | 7.87 ± 0.54 |
| PD (%) | 78.72 ± 9.30 | 82.80 ± 12.00 | 85.38 ± 10.99 | 96.12 ± 3.24 |
| PI (%) | 29.20 ± 1.92 | 44.40 ± 8.80 | 43.43 ± 8.84 | 52.44 ± 3.62 |
| Particles < 4.5 µm | ||||
| FPD (mg) | 3.51 ± 0.07 | 4.60 ± 1.20 | 4.57 ± 0.73 | 6.27 ± 0.59 |
| FPF (%) | 29.95 ± 2.96 | 36.96 ± 4.70 | 35.58 ± 1.22 | 43.47 ± 3.25 |
| RF (%) | 80.40 ± 6.34 | 69 ± 3.90 | 70.63 ± 4.20 | 79.66 ± 2.86 |
| Particles < 3.6 µm | ||||
| FPD (mg) | 2.21 ± 0.27 | 2.78 ± 0.85 | 2.98 ± 0.24 | 4.02 ± 0.52 |
| FPF (%) | 18.93 ± 3.36 | 22.14 ± 4.30 | 23.56 ± 3.79 | 27.81 ± 2.92 |
| RF (%) | 50.43 ± 3.08 | 41.23 ± 5.10 | 47.12 ± 10.63 | 50.94 ± 3.67 |
| 0.5 µm < Particles < 3.6 µm | ||||
| FPD (mg) | 1.79 ± 0.128 | 1.98 ± 0.61 | 2.58 ± 0.22 | 3.58 ± 0.55 |
| FPF (%) | 15.39 ± 2.74 | 15.75 ± 3.08 | 20.44 ± 3.72 | 24.77 ± 3.32 |
| RF (%) | 40.97 ± 1.97 | 29.31 ± 3.70 | 40.94 ± 10.27 | 45.32 ± 4.09 |
| r | p | r | p | r | p | ||||
|---|---|---|---|---|---|---|---|---|---|
| FPF<4.5 | FPF<3.6 | 0.5<FPF<3.6 | |||||||
| Crystallinity (Peak area2θ=19.98°) | −0.670 | 0.330 | −0.571 | 0.429 | −0.296 | 0.704 | |||
| pb (g/cm3) | −0.701 | 0.299 | −0.620 | 0.380 | −0.362 | 0.638 | |||
| pt (g/cm3) | −0.205 | 0.795 | 0.055 | 0.945 | 0.372 | 0.628 | |||
| Carr’s Index (%) | 0.532 | 0.468 | 0.684 | 0.316 | 0.720 | 0.280 | |||
| Hausner Ratio | 0.436 | 0.564 | 0.606 | 0.394 | 0.669 | 0.331 | |||
| Circ | 0.301 | 0.699 | 0.426 | 0.574 | 0.418 | 0.582 | |||
| Ra (nm) | −0.324 | 0.676 | −0.504 | 0.496 | −0.583 | 0.417 | |||
| Specific surface area (m2/g) | −0.272 | 0.728 | −0.446 | 0.554 | −0.703 | 0.297 | |||
| D[4,3] (µm) | −0.202 | 0.798 | −0.342 | 0.658 | −0.361 | 0.639 | |||
| D[3,2] (µm) | 0.380 | 0.620 | 0.530 | 0.470 | 0.753 | 0.247 | |||
| Span | −0.288 | 0.712 | −0.522 | 0.478 | −0.776 | 0.224 | |||
| d10 (µm) | 0.568 | 0.432 | 0.693 | 0.307 | 0.860 | 0.140 | |||
| d50 (µm) | 0.192 | 0.808 | 0.361 | 0.639 | 0.629 | 0.371 | |||
| d90 (µm) | −0.503 | 0.497 | −0.652 | 0.348 | −0.680 | 0.320 | |||
| RF<4.5 | RF<3.6 | 0.5<RF<3.6 | |||||||
| Crystallinity (Peak area2θ=19.98°) | 0.744 | 0.256 | 0.686 | 0.314 | 0.468 | 0.532 | |||
| pb (g/cm3) | 0.724 | 0.276 | 0.635 | 0.365 | 0.401 | 0.599 | |||
| pt (g/cm3) | 0.311 | 0.689 | 0.685 | 0.315 | 0.777 | 0.223 | |||
| Carr’s Index (%) | −0.363 | 0.637 | 0.044 | 0.956 | 0.346 | 0.654 | |||
| Hausner Ratio | −0.362 | 0.638 | 0.067 | 0.933 | 0.363 | 0.637 | |||
| Circ | −0.648 | 0.352 | −0.251 | 0.749 | 0.041 | 0.959 | |||
| Ra (nm) | 0.398 | 0.602 | −0.044 | 0.956 | −0.331 | 0.669 | |||
| Specific surface area (m2/g) | −0.803 | 0.197 | −0.964 * | 0.036 | −0.989 * | 0.011 | |||
| D[4,3] (µm) | 0.634 | 0.366 | 0.222 | 0.778 | −0.058 | 0.942 | |||
| D[3,2] (µm) | 0.808 | 0.192 | 0.936 | 0.064 | 0.963 * | 0.037 | |||
| Span | −0.408 | 0.592 | −0.765 | 0.235 | −0.920 | 0.080 | |||
| d10 (µm) | 0.715 | 0.285 | 0.840 | 0.160 | 0.908 | 0.092 | |||
| d50 (µm) | 0.855 | 0.145 | 0.986 * | 0.014 | 0.979 * | 0.021 | |||
| d90 (µm) | 0.412 | 0.588 | 0.004 | 0.996 | −0.300 | 0.700 |
| L3 | L6 | |||||
|---|---|---|---|---|---|---|
| Stage | Chitosan Nanoparticles | Lactose-PEG 3000 Microparticles | Blend | Chitosan Nanoparticles | Lactose-PEG 3000 Microparticles | Blend |
| 0 | 0.5316 ± 0.013 | 0.9815 ± 0.007 | 0.9888 ± 0.005 | 0.5280 ± 0.009 | 0.9809 ± 0.005 | 0.9868 ± 0.003 |
| 1 | 0.5338 ± 0.009 | 0.9578 ± 0.006 | 0.9838 ± 0.007 | 0.5530 ± 0.007 | 0.9228 ± 0.006 | 0.9365 ± 0.006 |
| 2 | 0.5279 ± 0.008 | 0.9482 ± 0.008 | 0.9882 ± 0.004 | 0.6029 ± 0.013 | 0.8754 ± 0.022 | 0.8963 ± 0.020 |
| 3 | 0.5755 ± 0.010 | 0.9545 ± 0.003 | 0.9832 ± 0.001 | 0.6064 ± 0.006 | 0.7437 ± 0.014 | 0.7743 ± 0.016 |
| 4 | 0.7013 ± 0.046 | 0.8406 ± 0.031 | 0.8228 ± 0.030 | 0.6960 ± 0.001 | 0.7638 ± 0.019 | 0.7936 ± 0.019 |
| 5 | 0.7093 ± 0.012 | 0.9120 ± 0.001 | 0.8861 ± 0.004 | 0.6879 ± 0.010 | 0.8523 ± 0.016 | 0.8727 ± 0.011 |
| 6 | 0.6527 ± 0.007 | 0.9186 ± 0.004 | 0.8931 ± 0.005 | 0.6783 ± 0.059 | 0.7688 ± 0.054 | 0.7668 ± 0.060 |
| 7 | 0.9281 ± 0.005 | 0.4965 ± 0.010 | 0.5546 ± 0.011 | 0.9203 ± 0.008 | 0.3968 ± 0.007 | 0.4392 ± 0.002 |
Publisher’s Note: MDPI stays neutral with regard to jurisdictional claims in published maps and institutional affiliations. |
© 2021 by the authors. Licensee MDPI, Basel, Switzerland. This article is an open access article distributed under the terms and conditions of the Creative Commons Attribution (CC BY) license (https://creativecommons.org/licenses/by/4.0/).
Share and Cite
Alhajj, N.; Naharudin, I.; Colombo, P.; Quarta, E.; Wong, T.W. Probing Critical Physical Properties of Lactose-Polyethylene Glycol Microparticles in Pulmonary Delivery of Chitosan Nanoparticles. Pharmaceutics 2021, 13, 1581. https://doi.org/10.3390/pharmaceutics13101581
Alhajj N, Naharudin I, Colombo P, Quarta E, Wong TW. Probing Critical Physical Properties of Lactose-Polyethylene Glycol Microparticles in Pulmonary Delivery of Chitosan Nanoparticles. Pharmaceutics. 2021; 13(10):1581. https://doi.org/10.3390/pharmaceutics13101581
Chicago/Turabian StyleAlhajj, Nasser, Idanawati Naharudin, Paolo Colombo, Eride Quarta, and Tin Wui Wong. 2021. "Probing Critical Physical Properties of Lactose-Polyethylene Glycol Microparticles in Pulmonary Delivery of Chitosan Nanoparticles" Pharmaceutics 13, no. 10: 1581. https://doi.org/10.3390/pharmaceutics13101581