Multi-Compartment 3D-Cultured Organ-on-a-Chip: Towards a Biomimetic Lymph Node for Drug Development

 , , , ,
  and
and 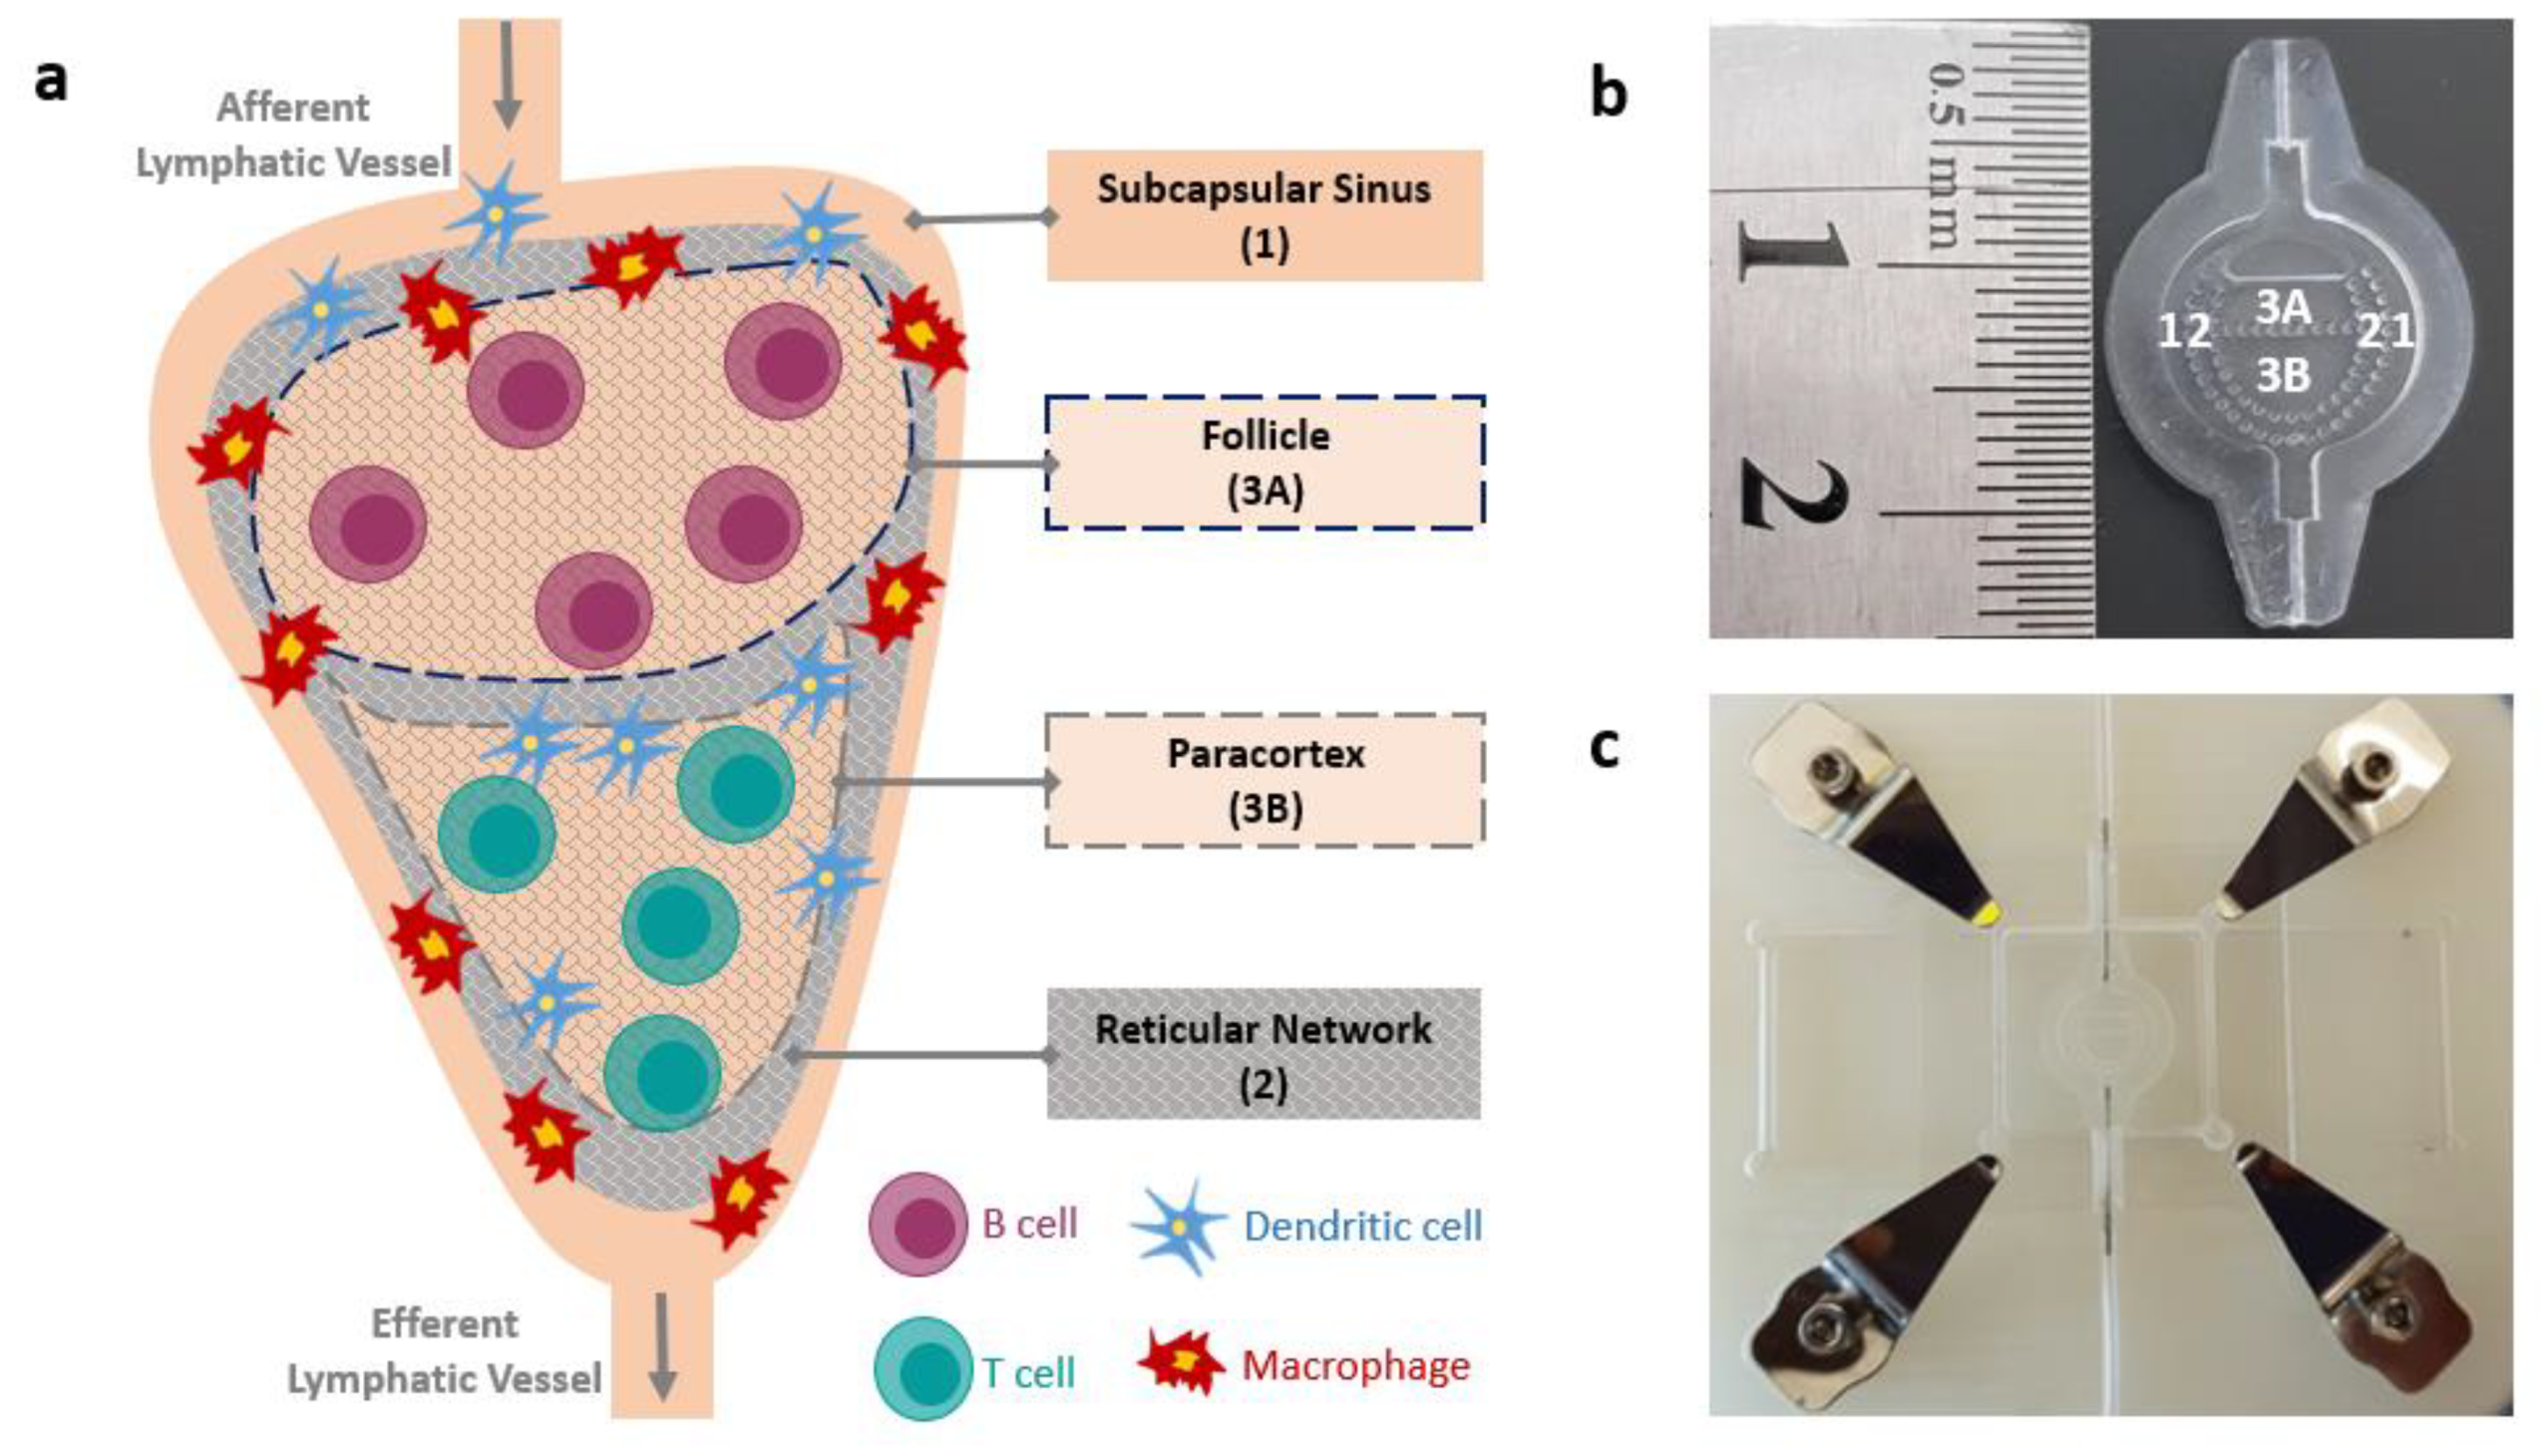
Abstract
:1. Introduction
2. Materials and Methods
2.1. LN-on-a-Chip Design and Fabrication
2.2. Hydrogel Preparation
2.3. Hydrogel Characterization
2.3.1. Topological Analysis
2.3.2. Permeability Analysis
2.3.3. Hydrogel Mechanics
2.4. Flow Simulation
2.5. Perfusion of the System
2.6. Compartmentalization Assessment
2.7. Cell Culture
2.8. Device Cytocompatibility
2.9. Data Analysis
3. Results
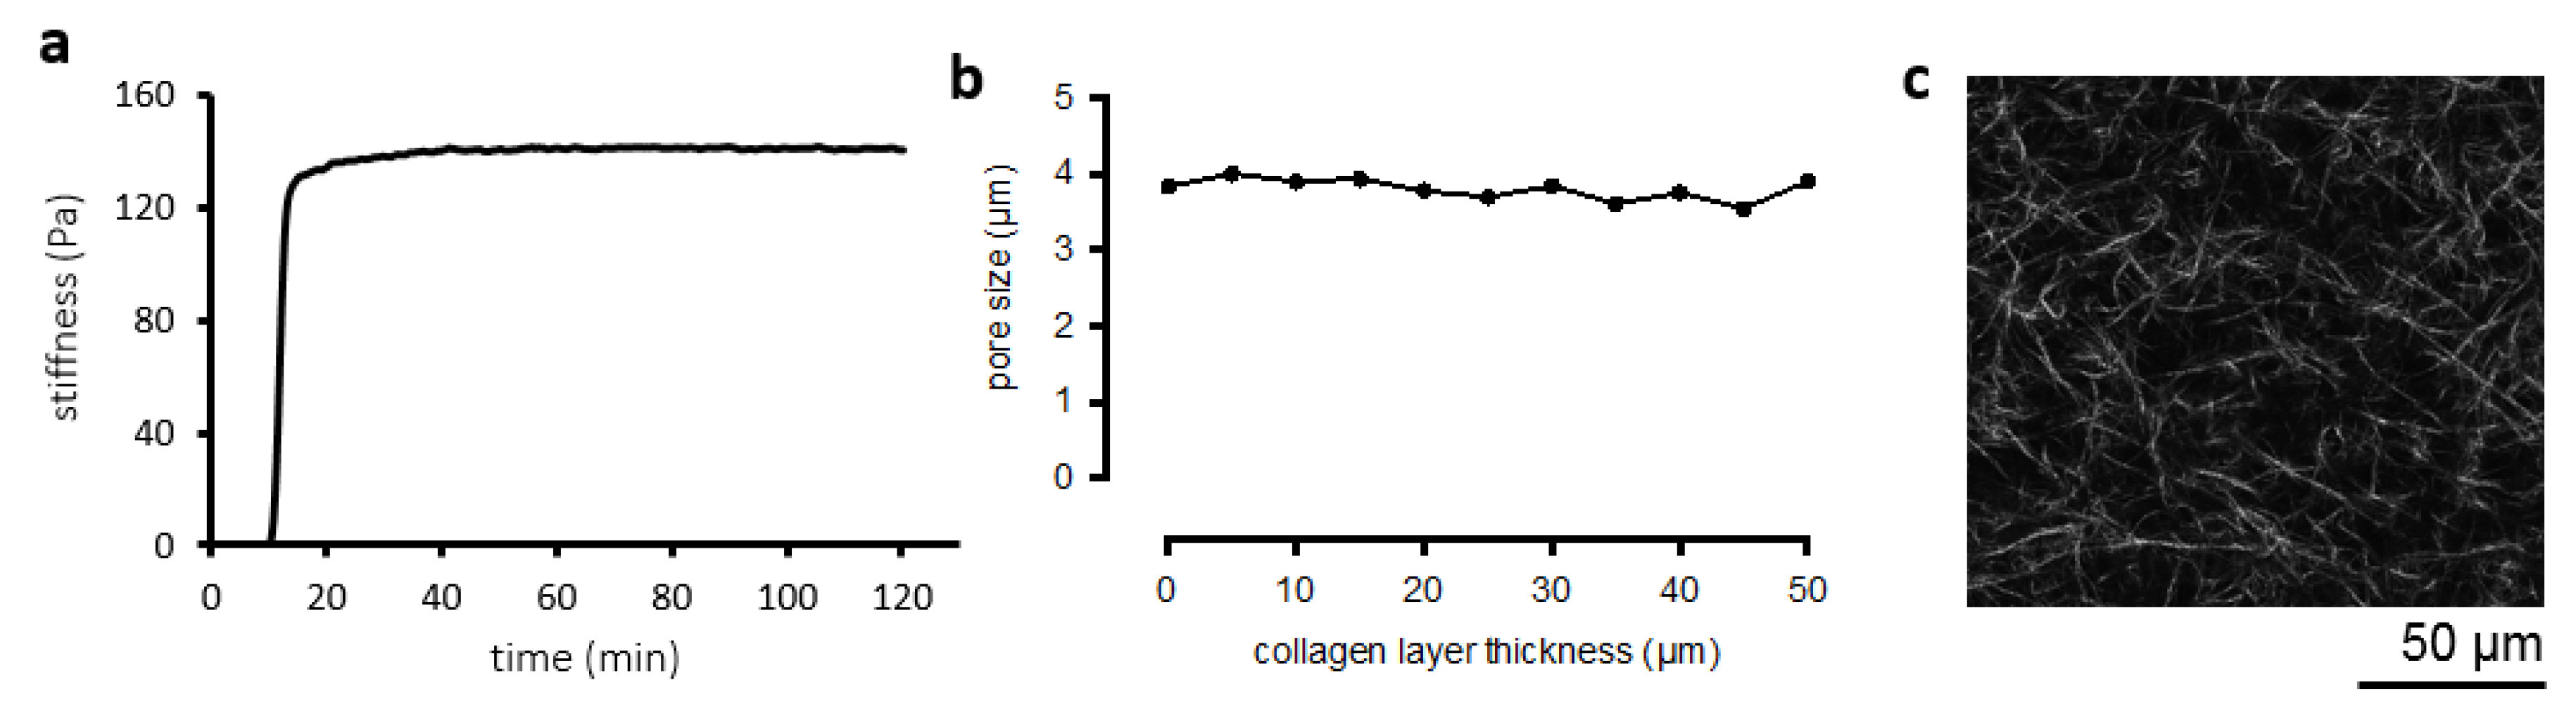
3.1. Collagen Matrix Characterization
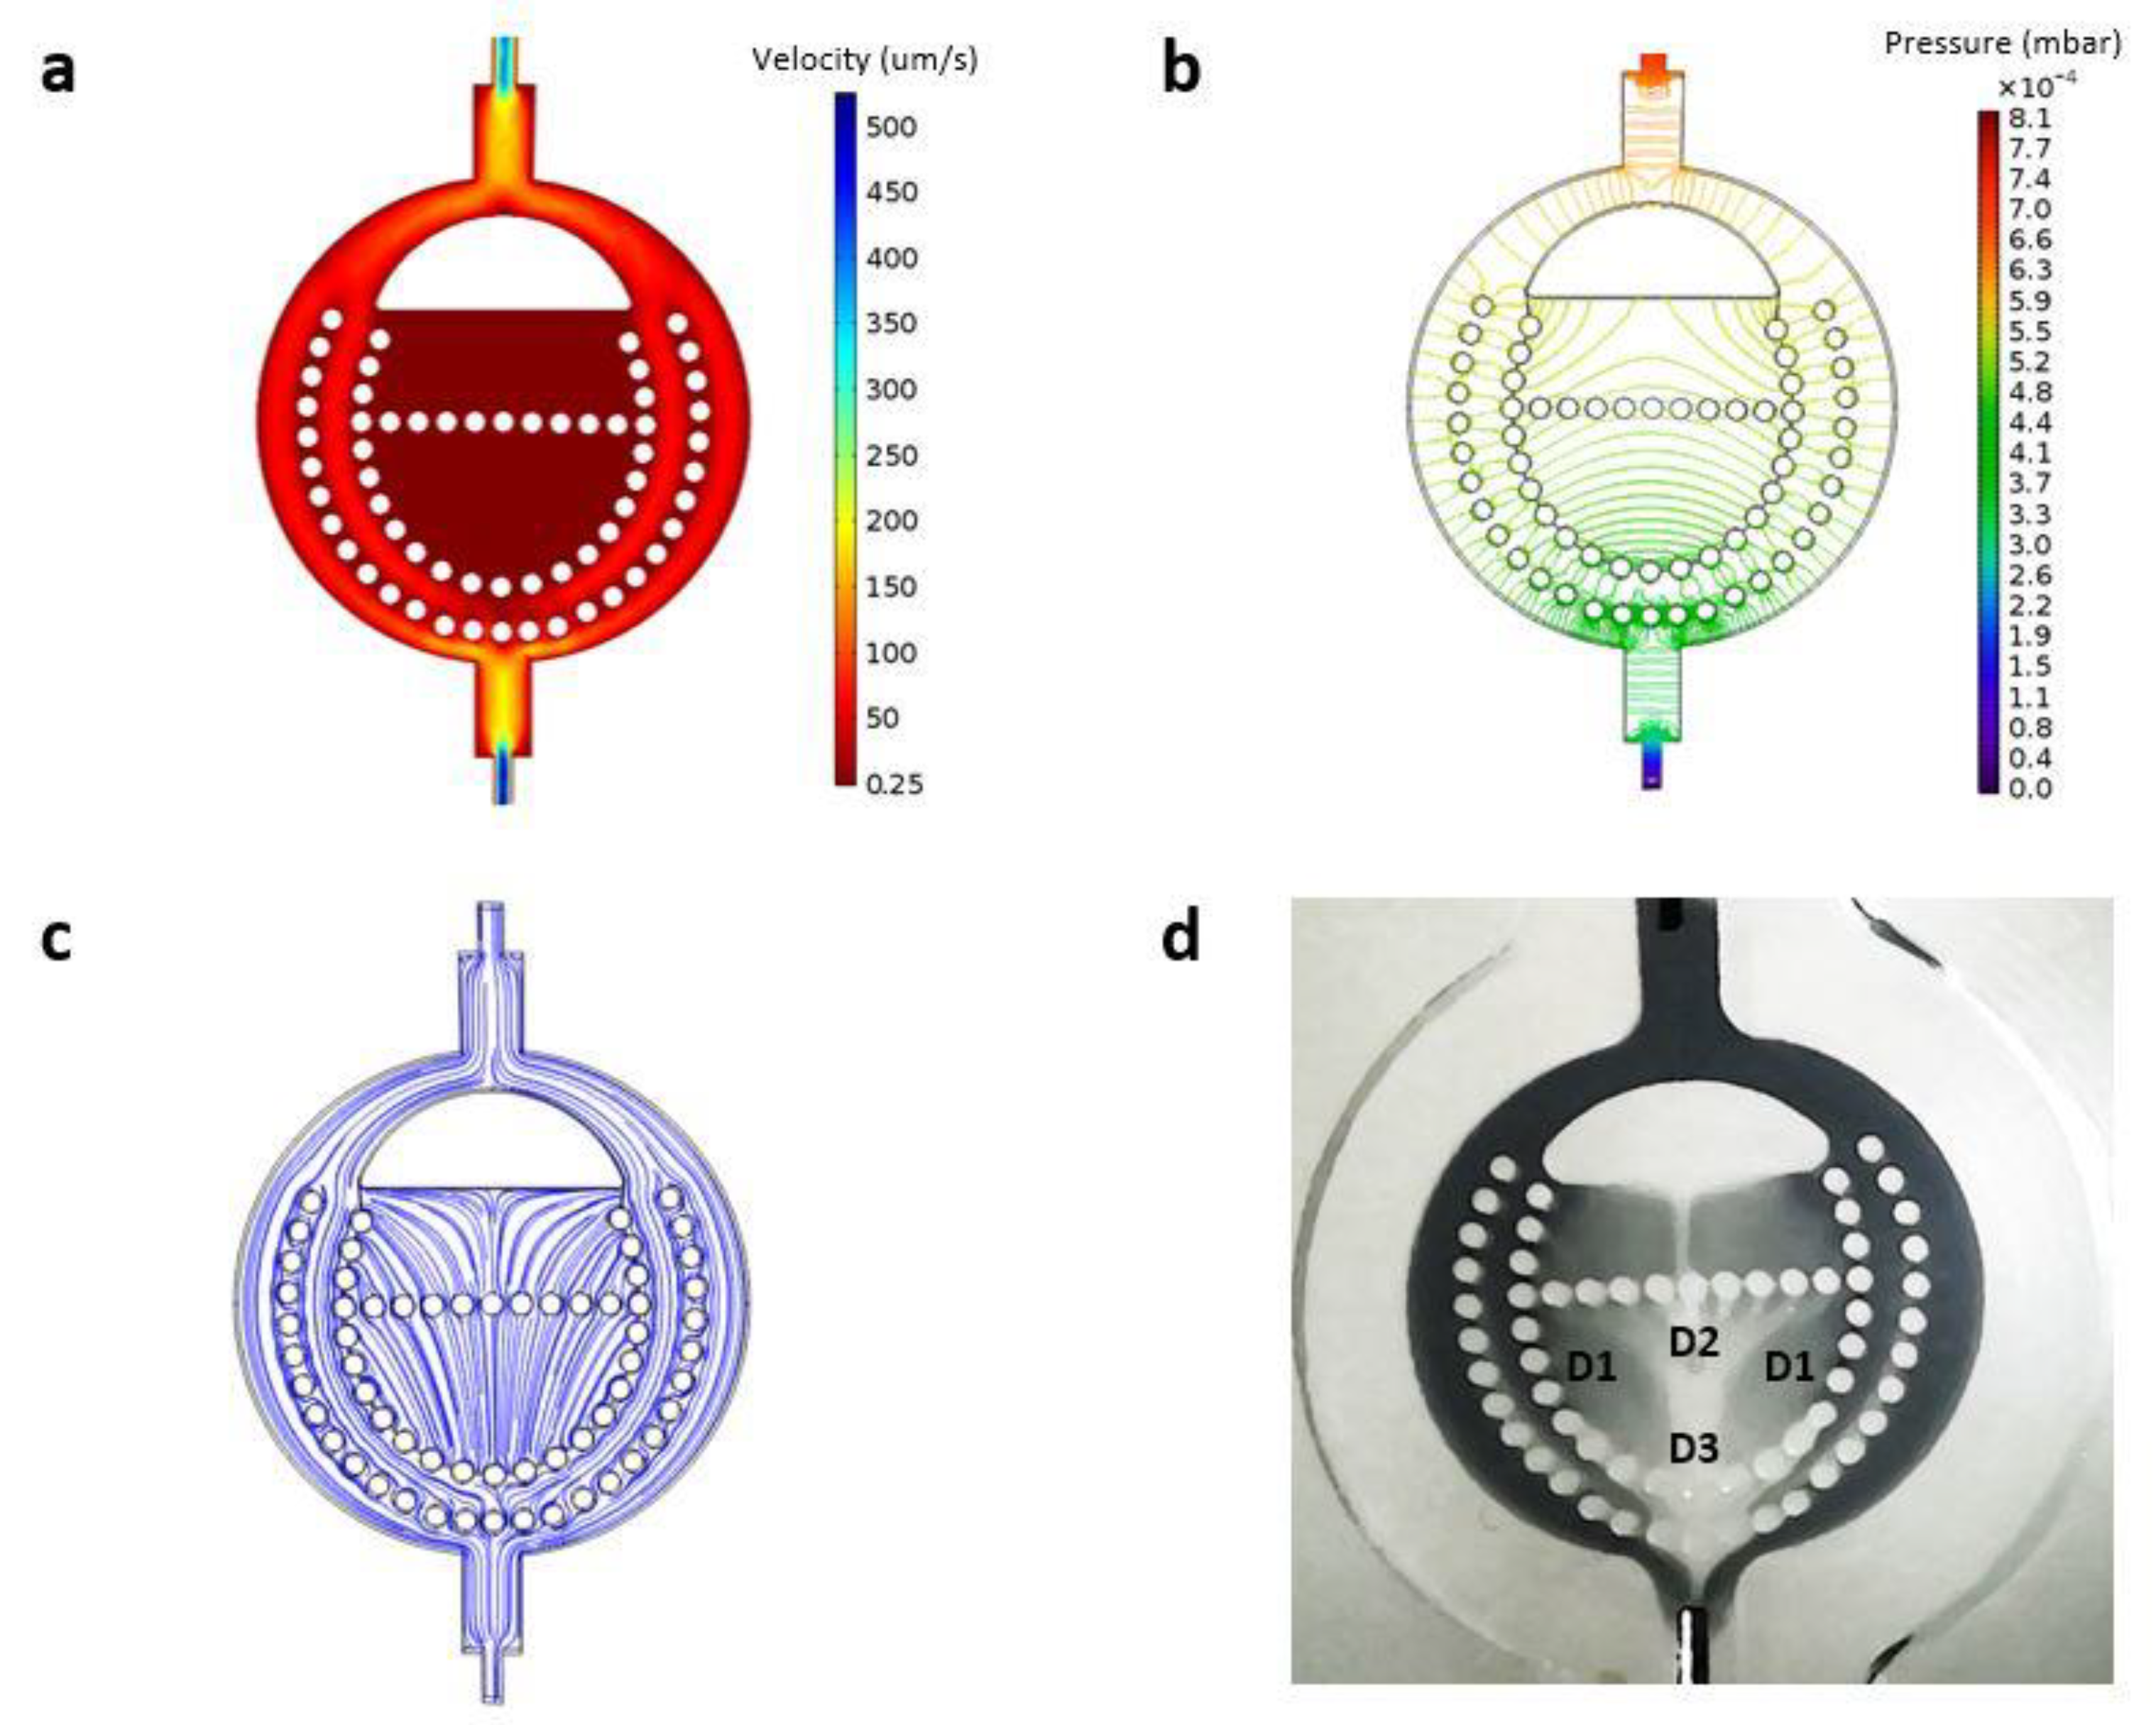
3.2. Flow Simulation
3.3. Flow Pattern within LN-on-a-Chip
3.4. Effect of Micropillars
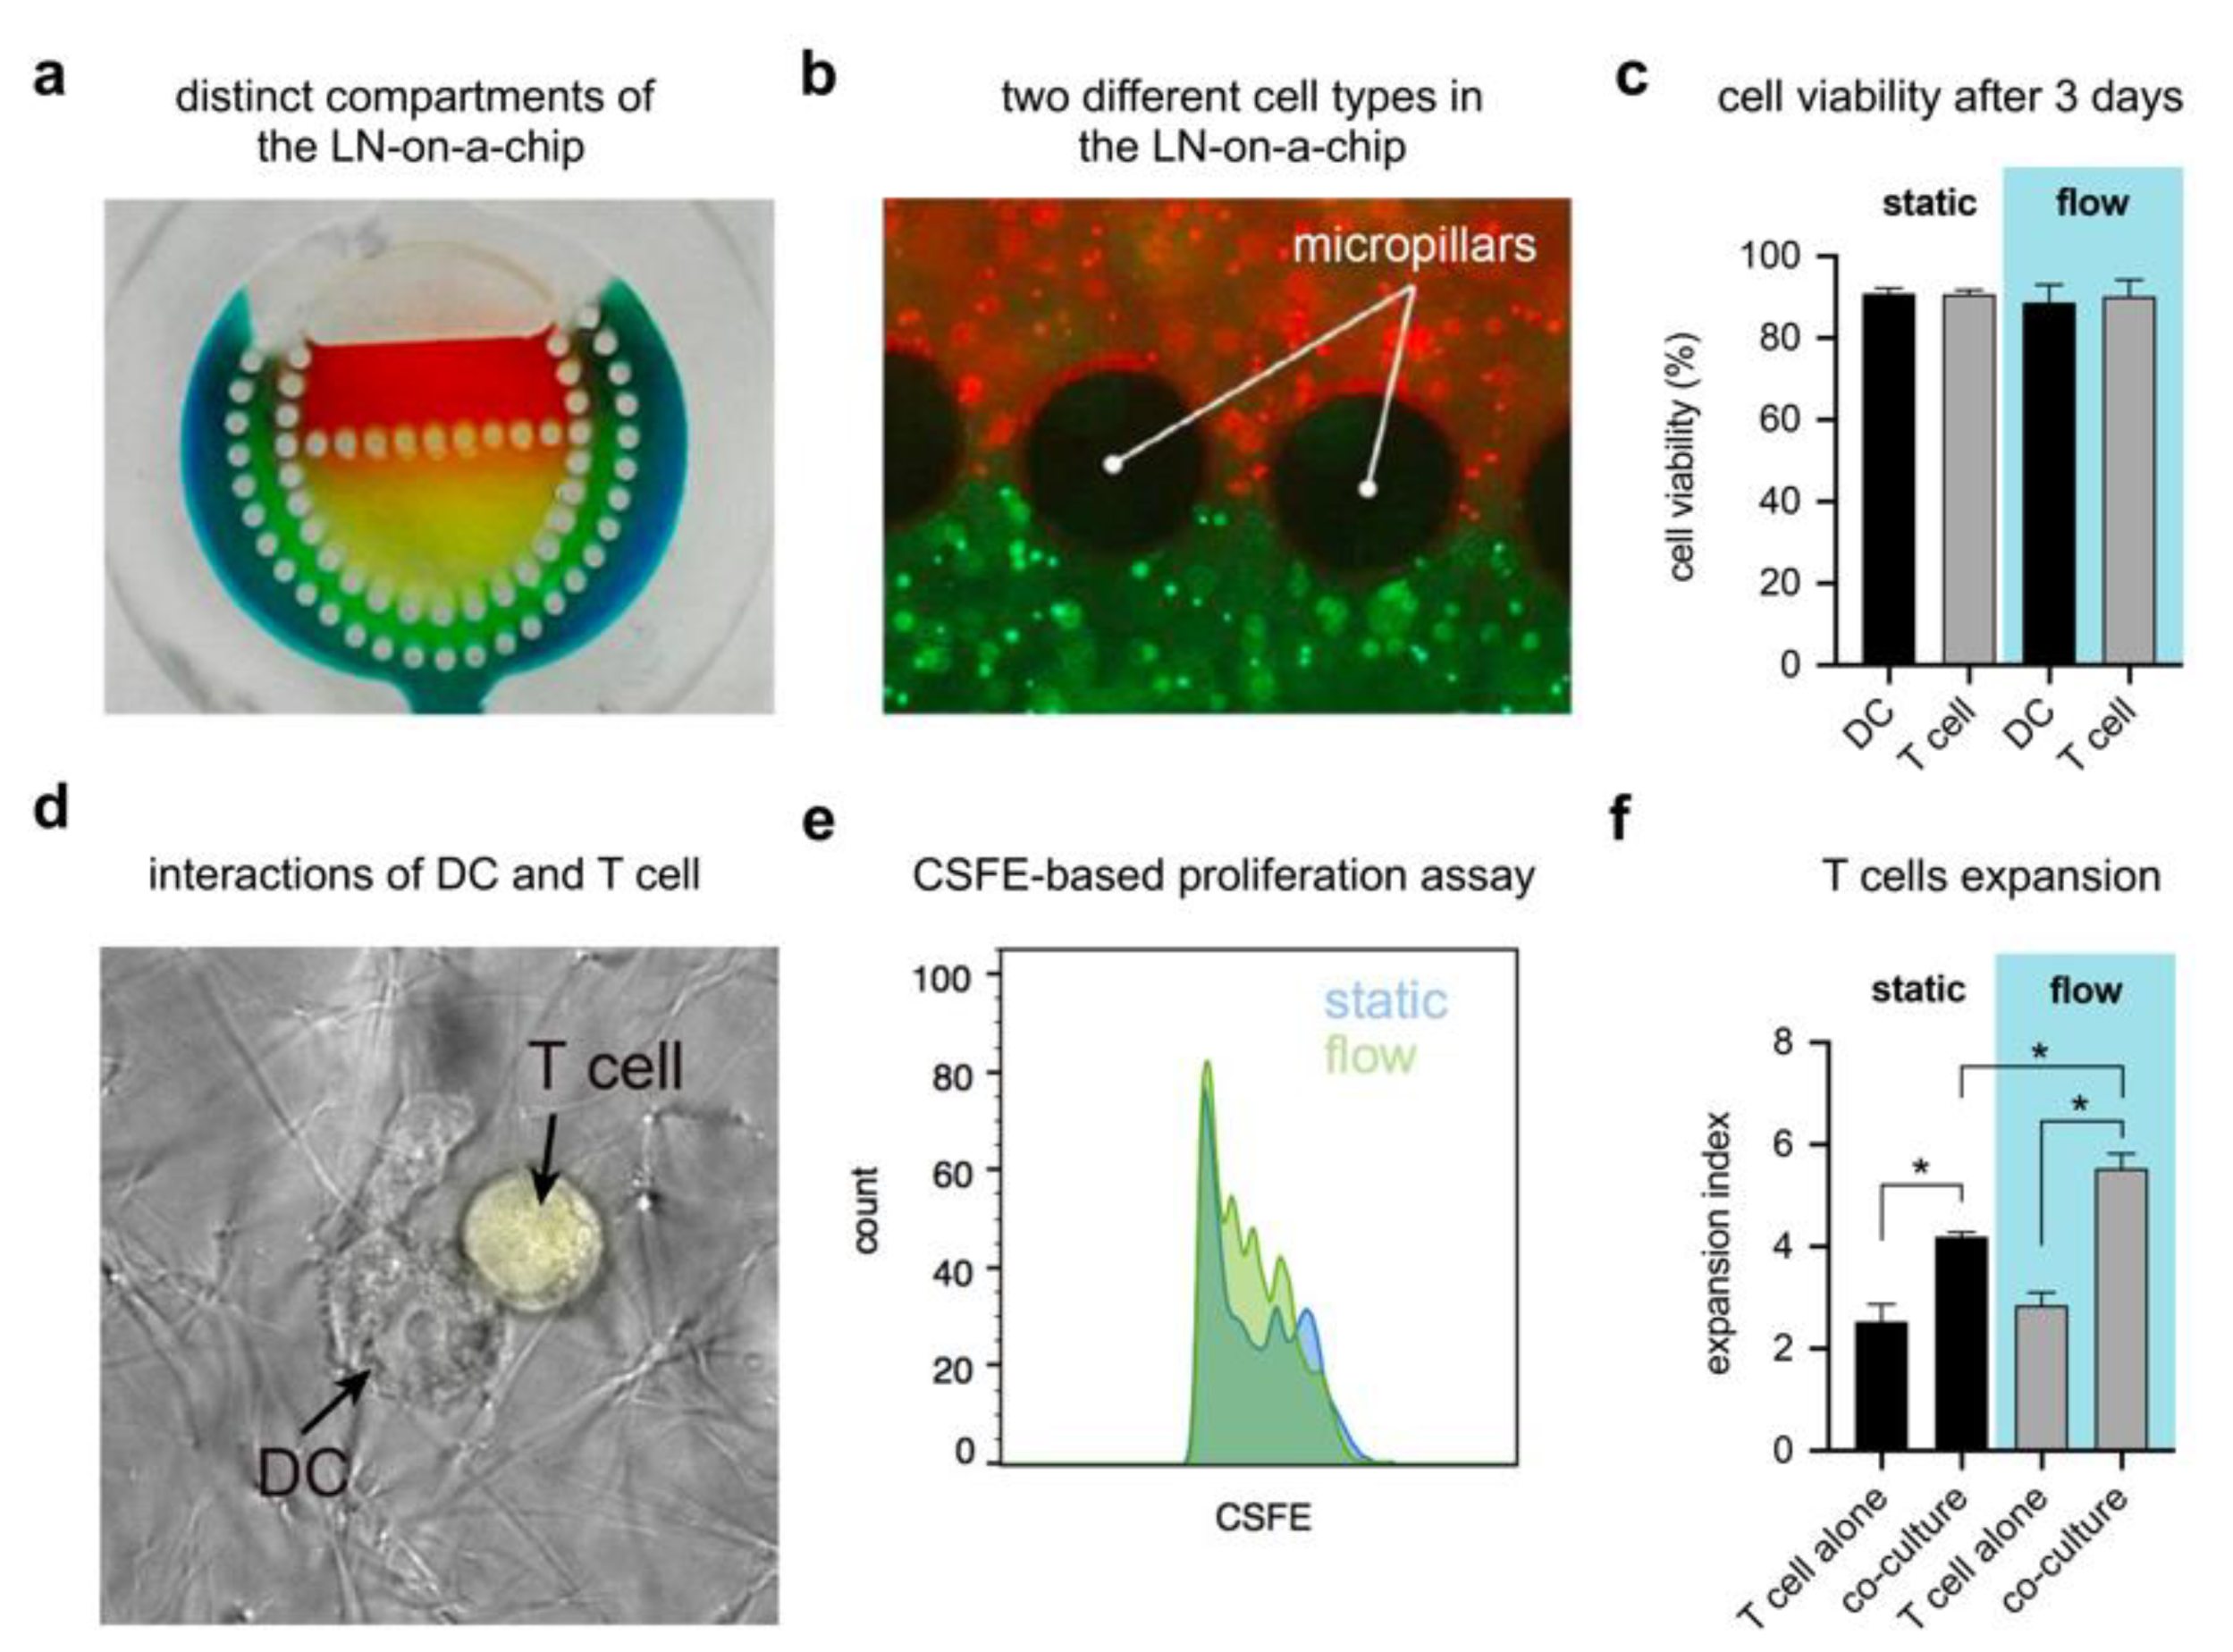
3.5. LN-on-a-Chip System Cytocompatibility
4. Discussion
5. Conclusions
6. Patents
Supplementary Materials
Author Contributions
Funding
Conflicts of Interest
References
- Roberts, R.A.; Kavanagh, S.L.; Mellor, H.R.; Pollard, C.E.; Robinson, S.; Platz, S.J. Reducing attrition in drug development: Smart loading preclinical safety assessment. Drug Discov. Today 2014, 19, 341–347. [Google Scholar] [CrossRef] [PubMed] [Green Version]
- Waring, M.J.; Arrowsmith, J.; Leach, A.R.; Leeson, P.D.; Mandrell, S.; Owen, R.M.; Pairaudeau, G.; Pennie, W.D.; Pickett, S.D.; Wang, J.; et al. An analysis of the attrition of drug candidates from four major pharmaceutical companies. Nat. Rev. Drug Discov. 2015, 14, 475–486. [Google Scholar] [CrossRef] [PubMed]
- Kidd, B.A.; Wroblewska, A.; Boland, M.R.; Agudo, J.; Merad, M.; Tatonetti, N.P.; Brown, B.D.; Dudley, J.T. Mapping the effects of drugs on the immune system. Nat. Biotechnol. 2016, 34, 47–54. [Google Scholar] [CrossRef] [PubMed]
- Guengerich, F.P. Mechanisms of drug toxicity and relevance to pharmaceutical development. Drug Metab. Pharm. 2011, 26, 3–14. [Google Scholar] [CrossRef] [Green Version]
- Berlin, J.A.; Glasser, S.C.; Ellenberg, S.S. Adverse event detection in drug development: Recommendations and obligations beyond phase 3. Am. J. Public Health 2008, 98, 1366–1371. [Google Scholar] [CrossRef]
- McKim, J.M. Building a tiered approach to in vitro predictive toxicity screening: A focus on assays with in vivo relevance. Comb. Chem. High Throughput Screen. 2010, 13, 188–206. [Google Scholar] [CrossRef] [Green Version]
- Liu, Y.; Gill, E.; Huang, Y.Y.S. Microfluidic on-chip biomimicry for 3D cell culture: A fit-for-purpose investigation from the end user standpoint. Future Sci. OA 2017, 3. [Google Scholar] [CrossRef]
- Fliervoet, L.A.L.; Mastrobattista, E. Drug delivery with living cells. Adv. Drug Deliv. Rev. 2016, 106, 63–72. [Google Scholar] [CrossRef]
- Sun, Y.; Su, J.; Liu, G.; Chen, J.; Zhang, X.; Zhang, R.; Jiang, M.; Qiu, M. Advances of blood cell-based drug delivery systems. Eur. J. Pharm. Sci. 2017, 96, 115–128. [Google Scholar] [CrossRef]
- Fischbach, C.; Reagan, M. Editorial: Special issue on tissue engineering and biomaterials approaches to tumor modeling. ACS Biomater. Sci. Eng. 2018, 4, 291–293. [Google Scholar] [CrossRef] [Green Version]
- Yoo, J.-W.; Irvine, D.J.; Discher, D.E.; Mitragotri, S. Bio-inspired, bioengineered and biomimetic drug delivery carriers. Nat. Rev. Drug Discov. 2011, 10, 521–535. [Google Scholar] [CrossRef] [PubMed]
- Sackmann, E.K.; Fulton, A.L.; Beebe, D.J. The present and future role of microfluidics in biomedical research. Nature 2014, 507, 181–189. [Google Scholar] [CrossRef] [PubMed]
- Shanti, A.; Teo, J.; Stefanini, C. In vitro immune organs-on-chip for drug development: A review. Pharmaceutics 2018, 10, 278. [Google Scholar] [CrossRef] [PubMed] [Green Version]
- Witzel, I.-I.; Nasser, R.; Garcia-Sabaté, A.; Sapudom, J.; Ma, C.; Chen, W.; Teo, J.C.M. Deconstructing immune microenvironments of lymphoid tissues for reverse engineering. Adv. Healthc. Mater. 2018, 1801126. [Google Scholar] [CrossRef]
- Giese, C.; Lubitz, A.; Demmler, C.D.; Reuschel, J.; Bergner, K.; Marx, U. Immunological substance testing on human lymphatic micro-organoids in vitro. J. Biotechnol. 2010, 148, 38–45. [Google Scholar] [CrossRef]
- Kim, H.J.; Ingber, D.E. Gut-on-a-Chip microenvironment induces human intestinal cells to undergo villus differentiation. Integr. Biol. 2013, 5, 1130. [Google Scholar] [CrossRef] [Green Version]
- Sieber, S.; Wirth, L.; Cavak, N.; Koenigsmark, M.; Marx, U.; Lauster, R.; Rosowski, M. Bone marrow-on-a-chip: Long-term culture of human haematopoietic stem cells in a three-dimensional microfluidic environment. J. Tissue Eng. Regen. Med. 2018, 12, 479–489. [Google Scholar] [CrossRef]
- Ramadan, Q.; Ting, F.C.W. In vitro micro-physiological immune-competent model of the human skin. Lab Chip 2016, 16, 1899–1908. [Google Scholar] [CrossRef]
- Giese, C.; Demmler, C.D.; Ammer, R.; Hartmann, S.; Lubitz, A.; Miller, L.; Müller, R.; Marx, U. A human lymph node in vitro? Challenges and progress. Artif. Organs 2006, 30, 803–808. [Google Scholar] [CrossRef]
- Galarza, S.; Kim, H.; Atay, N.; Peyton, S.R.; Munson, J.M. 2D or 3D? How cell motility measurements are conserved across dimensions in vitro and translate in vivo. Bioeng. Transl. Med. 2020, 5. [Google Scholar] [CrossRef] [Green Version]
- Fullerton, J.N.; Gilroy, D.W. Resolution of inflammation: A new therapeutic frontier. Nat. Rev. Drug Discov. 2016, 15, 551–567. [Google Scholar] [CrossRef]
- Girard, J.-P.; Moussion, C.; Förster, R. HEVs, lymphatics and homeostatic immune cell trafficking in lymph nodes. Nat. Rev. Immunol. 2012, 12, 762–773. [Google Scholar] [CrossRef] [PubMed]
- Kaldjian, E.P.; Gretz, J.E.; Anderson, A.O.; Shi, Y.; Shaw, S. Spatial and molecular organization of lymph node T cell cortex: A labyrinthine cavity bounded by an epithelium-like monolayer of fibroblastic reticular cells anchored to basement membrane-like extracellular matrix. Int. Immunol. 2001, 13, 1243–1253. [Google Scholar] [CrossRef] [PubMed]
- Wiig, H.; Keskin, D.; Kalluri, R. Interaction between the extracellular matrix and lymphatics: Consequences for lymphangiogenesis and lymphatic function. Matrix Biol. 2010, 29, 645–656. [Google Scholar] [CrossRef] [PubMed] [Green Version]
- Cupedo, T.; Stroock, A.; Coles, M. Application of tissue engineering to the immune system: Development of artificial lymph nodes. Front. Immunol. 2012, 3. [Google Scholar] [CrossRef] [PubMed] [Green Version]
- Crivellato, E.; Vacca, A.; Ribatti, D. Setting the stage: An anatomist’s view of the immune system. Trends Immunol. 2004, 25, 210–217. [Google Scholar] [CrossRef] [PubMed]
- Von Andrian, U.H.; Mempel, T.R. Homing and cellular traffic in lymph nodes. Nat. Rev. Immunol. 2003, 3, 867–878. [Google Scholar] [CrossRef] [PubMed]
- Jafarnejad, M.; Woodruff, M.C.; Zawieja, D.C.; Carroll, M.C.; Moore, J.E. Modeling lymph flow and fluid exchange with blood vessels in lymph nodes. Lymphat. Res. Biol. 2015, 13, 234–247. [Google Scholar] [CrossRef] [Green Version]
- Gretz, J.E.; Norbury, C.C.; Anderson, A.O.; Proudfoot, A.E.; Shaw, S. Lymph-borne chemokines and other low molecular weight molecules reach high endothelial venules via specialized conduits while a functional barrier limits access to the lymphocyte microenvironments in lymph node cortex. J. Exp. Med. 2000, 192, 1425–1440. [Google Scholar] [CrossRef]
- Liao, S.; von der Weid, P.Y. Lymphatic system: An active pathway for immune protection. Semin. Cell Dev. Biol. 2015, 38, 83–89. [Google Scholar] [CrossRef] [Green Version]
- Hughes, C.E.; Benson, R.A.; Bedaj, M.; Maffia, P. Antigen-presenting cells and antigen presentation in tertiary lymphoid organs. Front. Immunol. 2016, 7. [Google Scholar] [CrossRef] [PubMed]
- Tomei, A.A.; Siegert, S.; Britschgi, M.R.; Luther, S.A.; Swartz, M.A. Fluid flow regulates stromal cell organization and CCL21 expression in a tissue-engineered lymph node microenvironment. J. Immunol. 2009, 183, 4273–4283. [Google Scholar] [CrossRef] [PubMed] [Green Version]
- Modi, S.; Stanton, A.W.B.; Svensson, W.E.; Peters, A.M.; Mortimer, P.S.; Levick, J.R. Human lymphatic pumping measured in healthy and lymphoedematous arms by lymphatic congestion lymphoscintigraphy. J. Physiol. (Lond.) 2007, 583, 271–285. [Google Scholar] [CrossRef] [PubMed]
- Li, F.; Liu, W.; Stefanini, C.; Fu, X.; Dario, P. A novel bioinspired PVDF micro/nano hair receptor for a robot sensing system. Sensors 2010, 10, 994–1011. [Google Scholar] [CrossRef] [PubMed]
- Spina, G.L.; Stefanini, C.; Menciassi, A.; Dario, P. A novel technological process for fabricating micro-tips for biomimetic adhesion. J. Micromech. Microeng. 2005, 15, 1576–1587. [Google Scholar] [CrossRef]
- Mota, C.; Danti, S.; D’Alessandro, D.; Trombi, L.; Ricci, C.; Puppi, D.; Dinucci, D.; Milazzo, M.; Stefanini, C.; Chiellini, F.; et al. Multiscale fabrication of biomimetic scaffolds for tympanic membrane tissue engineering. Biofabrication 2015, 7, 025005. [Google Scholar] [CrossRef]
- Haessler, U.; Teo, J.C.M.; Foretay, D.; Renaud, P.; Swartz, M.A. Migration dynamics of breast cancer cells in a tunable 3D interstitial flow chamber. Integr. Biol. 2012, 4, 401–409. [Google Scholar] [CrossRef]
- Borchard, F.; Betz, P. Number and size of perigastric lymph nodes in human adults without gastric cancer. Surg. Radiol. Anat. 1991, 13, 117–121. [Google Scholar] [CrossRef]
- Qatarneh, S.M.; Kiricuta, I.-C.; Brahme, A.; Tiede, U.; Lind, B.K. Three-dimensional atlas of lymph node topography based on the visible human data set. Anat. Rec. Part B New Anat. 2006, 289B, 98–111. [Google Scholar] [CrossRef]
- Sapudom, J.; Rubner, S.; Martin, S.; Kurth, T.; Riedel, S.; Mierke, C.T.; Pompe, T. The phenotype of cancer cell invasion controlled by fibril diameter and pore size of 3D collagen networks. Biomaterials 2015, 52, 367–375. [Google Scholar] [CrossRef] [Green Version]
- Sapudom, J.; Kalbitzer, L.; Wu, X.; Martin, S.; Kroy, K.; Pompe, T. Fibril bending stiffness of 3D collagen matrices instructs spreading and clustering of invasive and non-invasive breast cancer cells. Biomaterials 2019, 193, 47–57. [Google Scholar] [CrossRef] [PubMed]
- Franke, K.; Sapudom, J.; Kalbitzer, L.; Anderegg, U.; Pompe, T. Topologically defined composites of collagen types I and V as in vitro cell culture scaffolds. Acta Biomater. 2014, 10, 2693–2702. [Google Scholar] [CrossRef] [PubMed]
- Taylor, C.; Hood, P. A numerical solution of the Navier-Stokes equations using the finite element technique. Comput. Fluids 1973, 1, 73–100. [Google Scholar] [CrossRef]
- Durlofsky, L.; Brady, J.F. Analysis of the Brinkman equation as a model for flow in porous media. Phys. Fluids 1987, 30, 3329. [Google Scholar] [CrossRef]
- Berges, C.; Naujokat, C.; Tinapp, S.; Wieczorek, H.; Höh, A.; Sadeghi, M.; Opelz, G.; Daniel, V. A cell line model for the differentiation of human dendritic cells. Biochem. Biophys. Res. Commun. 2005, 333, 896–907. [Google Scholar] [CrossRef] [PubMed]
- De la Zerda, A.; Kratochvil, M.J.; Suhar, N.A.; Heilshorn, S.C. Review: Bioengineering strategies to probe T cell mechanobiology. APL Bioeng. 2018, 2, 021501. [Google Scholar] [CrossRef] [PubMed]
- Ghaemmaghami, A.M.; Hancock, M.J.; Harrington, H.; Kaji, H.; Khademhosseini, A. Biomimetic tissues on a chip for drug discovery. Drug Discov. Today 2012, 17, 173–181. [Google Scholar] [CrossRef] [Green Version]
- Zhu, M.; Li, W.; Dong, X.; Yuan, X.; Midgley, A.C.; Chang, H.; Wang, Y.; Wang, H.; Wang, K.; Ma, P.X.; et al. In vivo engineered extracellular matrix scaffolds with instructive niches for oriented tissue regeneration. Nat. Commun. 2019, 10, 4620. [Google Scholar] [CrossRef] [PubMed] [Green Version]
- Willard-Mack, C.L. Normal structure, function, and histology of lymph nodes. Toxicol. Pathol. 2006, 34, 409–424. [Google Scholar] [CrossRef] [Green Version]
- Duval, K.; Grover, H.; Han, L.-H.; Mou, Y.; Pegoraro, A.F.; Fredberg, J.; Chen, Z. Modeling physiological events in 2D vs. 3D cell culture. Physiology 2017, 32, 266–277. [Google Scholar] [CrossRef]
- Baker, B.M.; Chen, C.S. Deconstructing the third dimension—How 3D culture microenvironments alter cellular cues. J. Cell Sci. 2012, 125, 3015–3024. [Google Scholar] [CrossRef] [PubMed] [Green Version]
- Langhans, S.A. Three-dimensional in vitro cell culture models in drug discovery and drug repositioning. Front. Pharmacol. 2018, 9, 6. [Google Scholar] [CrossRef] [PubMed]
- Savinkov, R.; Kislitsyn, A.; Watson, D.J.; van Loon, R.; Sazonov, I.; Novkovic, M.; Onder, L.; Bocharov, G. Data-driven modelling of the FRC network for studying the fluid flow in the conduit system. Eng. Appl. Artif. Intell. 2017, 62, 341–349. [Google Scholar] [CrossRef] [Green Version]
- Kakkad, S.M.; Solaiyappan, M.; Argani, P.; Sukumar, S.; Jacobs, L.K.; Leibfritz, D.; Bhujwalla, Z.M.; Glunde, K. Collagen I fiber density increases in lymph node positive breast cancers: Pilot study. J. Biomed. Opt. 2012, 17, 116017. [Google Scholar] [CrossRef] [PubMed] [Green Version]
- Esterházy, D.; Canesso, M.C.C.; Mesin, L.; Muller, P.A.; de Castro, T.B.R.; Lockhart, A.; ElJalby, M.; Faria, A.M.C.; Mucida, D. Compartmentalized gut lymph node drainage dictates adaptive immune responses. Nature 2019, 569, 126–130. [Google Scholar] [CrossRef]
- Textor, J.; Westermann, J. Modeling migration, compartmentalization and exit of naive t cells in lymph nodes without chemotaxis. In Artificial Immune Systems, Lecture Notes in Computer Science; de Castro, L.N., Von Zuben, F.J., Knidel, H., Eds.; Springer: Berlin/Heidelberg, Germany, 2007; Volume 4628, pp. 228–239. ISBN 978-3-540-73921-0. [Google Scholar]
- Bajénoff, M.; Egen, J.G.; Koo, L.Y.; Laugier, J.P.; Brau, F.; Glaichenhaus, N.; Germain, R.N. Stromal cell networks regulate lymphocyte entry, migration, and territoriality in lymph nodes. Immunity 2006, 25, 989–1001. [Google Scholar] [CrossRef] [Green Version]
- Brinkman, C.C.; Burrell, B.E.; Iwami, D.; Nakayama, Y.; Warren, K.J.; Xiong, Y.; Bromberg, J.S. Anatomy of tolerance. Curr. Opin. Organ Transplant. 2013, 18, 393–401. [Google Scholar] [CrossRef]
- Gonzalez, S.F.; Pitcher, L.A.; Mempel, T.; Schuerpf, F.; Carroll, M.C. B cell acquisition of antigen in vivo. Curr. Opin. Immunol. 2009, 21, 251–257. [Google Scholar] [CrossRef] [Green Version]
- Cooper, L.J.; Heppell, J.P.; Clough, G.F.; Ganapathisubramani, B.; Roose, T. An image-based model of fluid flow through lymph nodes. Bull. Math. Biol. 2016, 78, 52–71. [Google Scholar] [CrossRef]
- Hirosue, S.; Dubrot, J. Modes of antigen presentation by lymph node stromal cells and their immunological implications. Front. Immunol. 2015, 6, 446. [Google Scholar] [CrossRef] [Green Version]
- Parker, D.C. T cell-dependent B cell activation. Annu. Rev. Immunol. 1993, 11, 331–360. [Google Scholar] [CrossRef] [PubMed]
- Pape, K.A.; Catron, D.M.; Itano, A.A.; Jenkins, M.K. The humoral immune response is initiated in lymph nodes by B cells that acquire soluble antigen directly in the follicles. Immunity 2007, 26, 491–502. [Google Scholar] [CrossRef] [PubMed] [Green Version]
- Bousso, P. T-cell activation by dendritic cells in the lymph node: Lessons from the movies. Nat. Rev. Immunol. 2008, 8, 675–684. [Google Scholar] [CrossRef]
- Hommel, M. On the dynamics of T-cell activation in lymph nodes. Immunol. Cell Biol. 2004, 82, 62–66. [Google Scholar] [CrossRef] [PubMed]
- Kaech, S.M.; Ahmed, R. Memory CD8+ T cell differentiation: Initial antigen encounter triggers a developmental program in naïve cells. Nat. Immunol. 2001, 2, 415–422. [Google Scholar] [CrossRef] [PubMed] [Green Version]
- Feigelson, S.W.; Solomon, A.; Biram, A.; Hatzav, M.; Lichtenstein, M.; Regev, O.; Kozlovski, S.; Varol, D.; Curato, C.; Leshkowitz, D.; et al. ICAMs are not obligatory for functional immune synapses between naive CD4 T cells and lymph node DCs. Cell Rep. 2018, 22, 849–859. [Google Scholar] [CrossRef] [Green Version]
- Ramanujan, S.; Pluen, A.; McKee, T.D.; Brown, E.B.; Boucher, Y.; Jain, R.K. Diffusion and convection in collagen gels: Implications for transport in the tumor interstitium. Biophys. J. 2002, 83, 1650–1660. [Google Scholar] [CrossRef] [Green Version]
- Osidak, E.O.; Osidak, M.S.; Akhmanova, M.A.; Domogatskii, S.P. Collagen—A biomaterial for delivery of growth factors and tissue regeneration. Russ. J. Gen. Chem. 2014, 84, 368–378. [Google Scholar] [CrossRef]
- Carrasco, Y.R.; Batista, F.D. B cells acquire particulate antigen in a macrophage-rich area at the boundary between the follicle and the subcapsular sinus of the lymph node. Immunity 2007, 27, 160–171. [Google Scholar] [CrossRef] [Green Version]
- Chary, S.R.; Jain, R.K. Direct measurement of interstitial convection and diffusion of albumin in normal and neoplastic tissues by fluorescence photobleaching. Proc. Natl. Acad. Sci. USA 1989, 86, 5385–5389. [Google Scholar] [CrossRef] [Green Version]
- Dafni, H.; Israely, T.; Bhujwalla, Z.M.; Benjamin, L.E.; Neeman, M. Overexpression of vascular endothelial growth factor 165 drives peritumor interstitial convection and induces lymphatic drain: Magnetic resonance imaging, confocal microscopy, and histological tracking of triple-labeled albumin. Cancer Res. 2002, 62, 6731–6739. [Google Scholar]
- Baldazzi, V.; Paci, P.; Bernaschi, M.; Castiglione, F. Modeling lymphocyte homing and encounters in lymph nodes. BMC Bioinform. 2009, 10, 387. [Google Scholar] [CrossRef] [PubMed] [Green Version]
- Beltman, J.B.; Marée, A.F.M.; de Boer, R.J. Spatial modelling of brief and long interactions between T cells and dendritic cells. Immunol. Cell Biol. 2007, 85, 306–314. [Google Scholar] [CrossRef] [PubMed] [Green Version]
- Beltman, J.B.; Henrickson, S.E.; von Andrian, U.H.; de Boer, R.J.; Marée, A.F.M. Towards estimating the true duration of dendritic cell interactions with T cells. J. Immunol. Methods 2009, 347, 54–69. [Google Scholar] [CrossRef] [PubMed] [Green Version]
- Gasteiger, G.; Ataide, M.; Kastenmüller, W. Lymph node—An organ for T-cell activation and pathogen defense. Immunol. Rev. 2016, 271, 200–220. [Google Scholar] [CrossRef] [PubMed]
- Mandl, J.N.; Liou, R.; Klauschen, F.; Vrisekoop, N.; Monteiro, J.P.; Yates, A.J.; Huang, A.Y.; Germain, R.N. Quantification of lymph node transit times reveals differences in antigen surveillance strategies of naive CD4+ and CD8+ T cells. Proc. Natl. Acad. Sci. USA 2012, 109, 18036–18041. [Google Scholar] [CrossRef] [Green Version]
- Purwada, A.; Singh, A. Immuno-engineered organoids for regulating the kinetics of B-cell development and antibody production. Nat. Protoc. 2017, 12, 168–182. [Google Scholar] [CrossRef]
- Blondel, D.; Lutolf, M.P. Bioinspired hydrogels for 3D organoid culture. Chimia (Aarau) 2019, 73, 81–85. [Google Scholar] [CrossRef]
- Negro, A.; Cherbuin, T.; Lutolf, M.P. 3D inkjet printing of complex, cell-laden hydrogel structures. Sci. Rep. 2018, 8, 17099. [Google Scholar] [CrossRef]
- Xu, T.; Kincaid, H.; Atala, A.; Yoo, J.J. High-throughput production of single-cell microparticles using an inkjet printing technology. J. Manuf. Sci. Eng. 2008, 130, 021017. [Google Scholar] [CrossRef]


© 2020 by the authors. Licensee MDPI, Basel, Switzerland. This article is an open access article distributed under the terms and conditions of the Creative Commons Attribution (CC BY) license (http://creativecommons.org/licenses/by/4.0/).
Share and Cite
Shanti, A.; Samara, B.; Abdullah, A.; Hallfors, N.; Accoto, D.; Sapudom, J.; Alatoom, A.; Teo, J.; Danti, S.; Stefanini, C. Multi-Compartment 3D-Cultured Organ-on-a-Chip: Towards a Biomimetic Lymph Node for Drug Development. Pharmaceutics 2020, 12, 464. https://doi.org/10.3390/pharmaceutics12050464
Shanti A, Samara B, Abdullah A, Hallfors N, Accoto D, Sapudom J, Alatoom A, Teo J, Danti S, Stefanini C. Multi-Compartment 3D-Cultured Organ-on-a-Chip: Towards a Biomimetic Lymph Node for Drug Development. Pharmaceutics. 2020; 12(5):464. https://doi.org/10.3390/pharmaceutics12050464
Chicago/Turabian StyleShanti, Aya, Bisan Samara, Amal Abdullah, Nicholas Hallfors, Dino Accoto, Jiranuwat Sapudom, Aseel Alatoom, Jeremy Teo, Serena Danti, and Cesare Stefanini. 2020. "Multi-Compartment 3D-Cultured Organ-on-a-Chip: Towards a Biomimetic Lymph Node for Drug Development" Pharmaceutics 12, no. 5: 464. https://doi.org/10.3390/pharmaceutics12050464