Systematic Meta-Analysis Identifies Co-Expressed Kinases and GPCRs in Ovarian Cancer Tissues Revealing a Potential for Targeted Kinase Inhibitor Delivery


Abstract
:1. Introduction
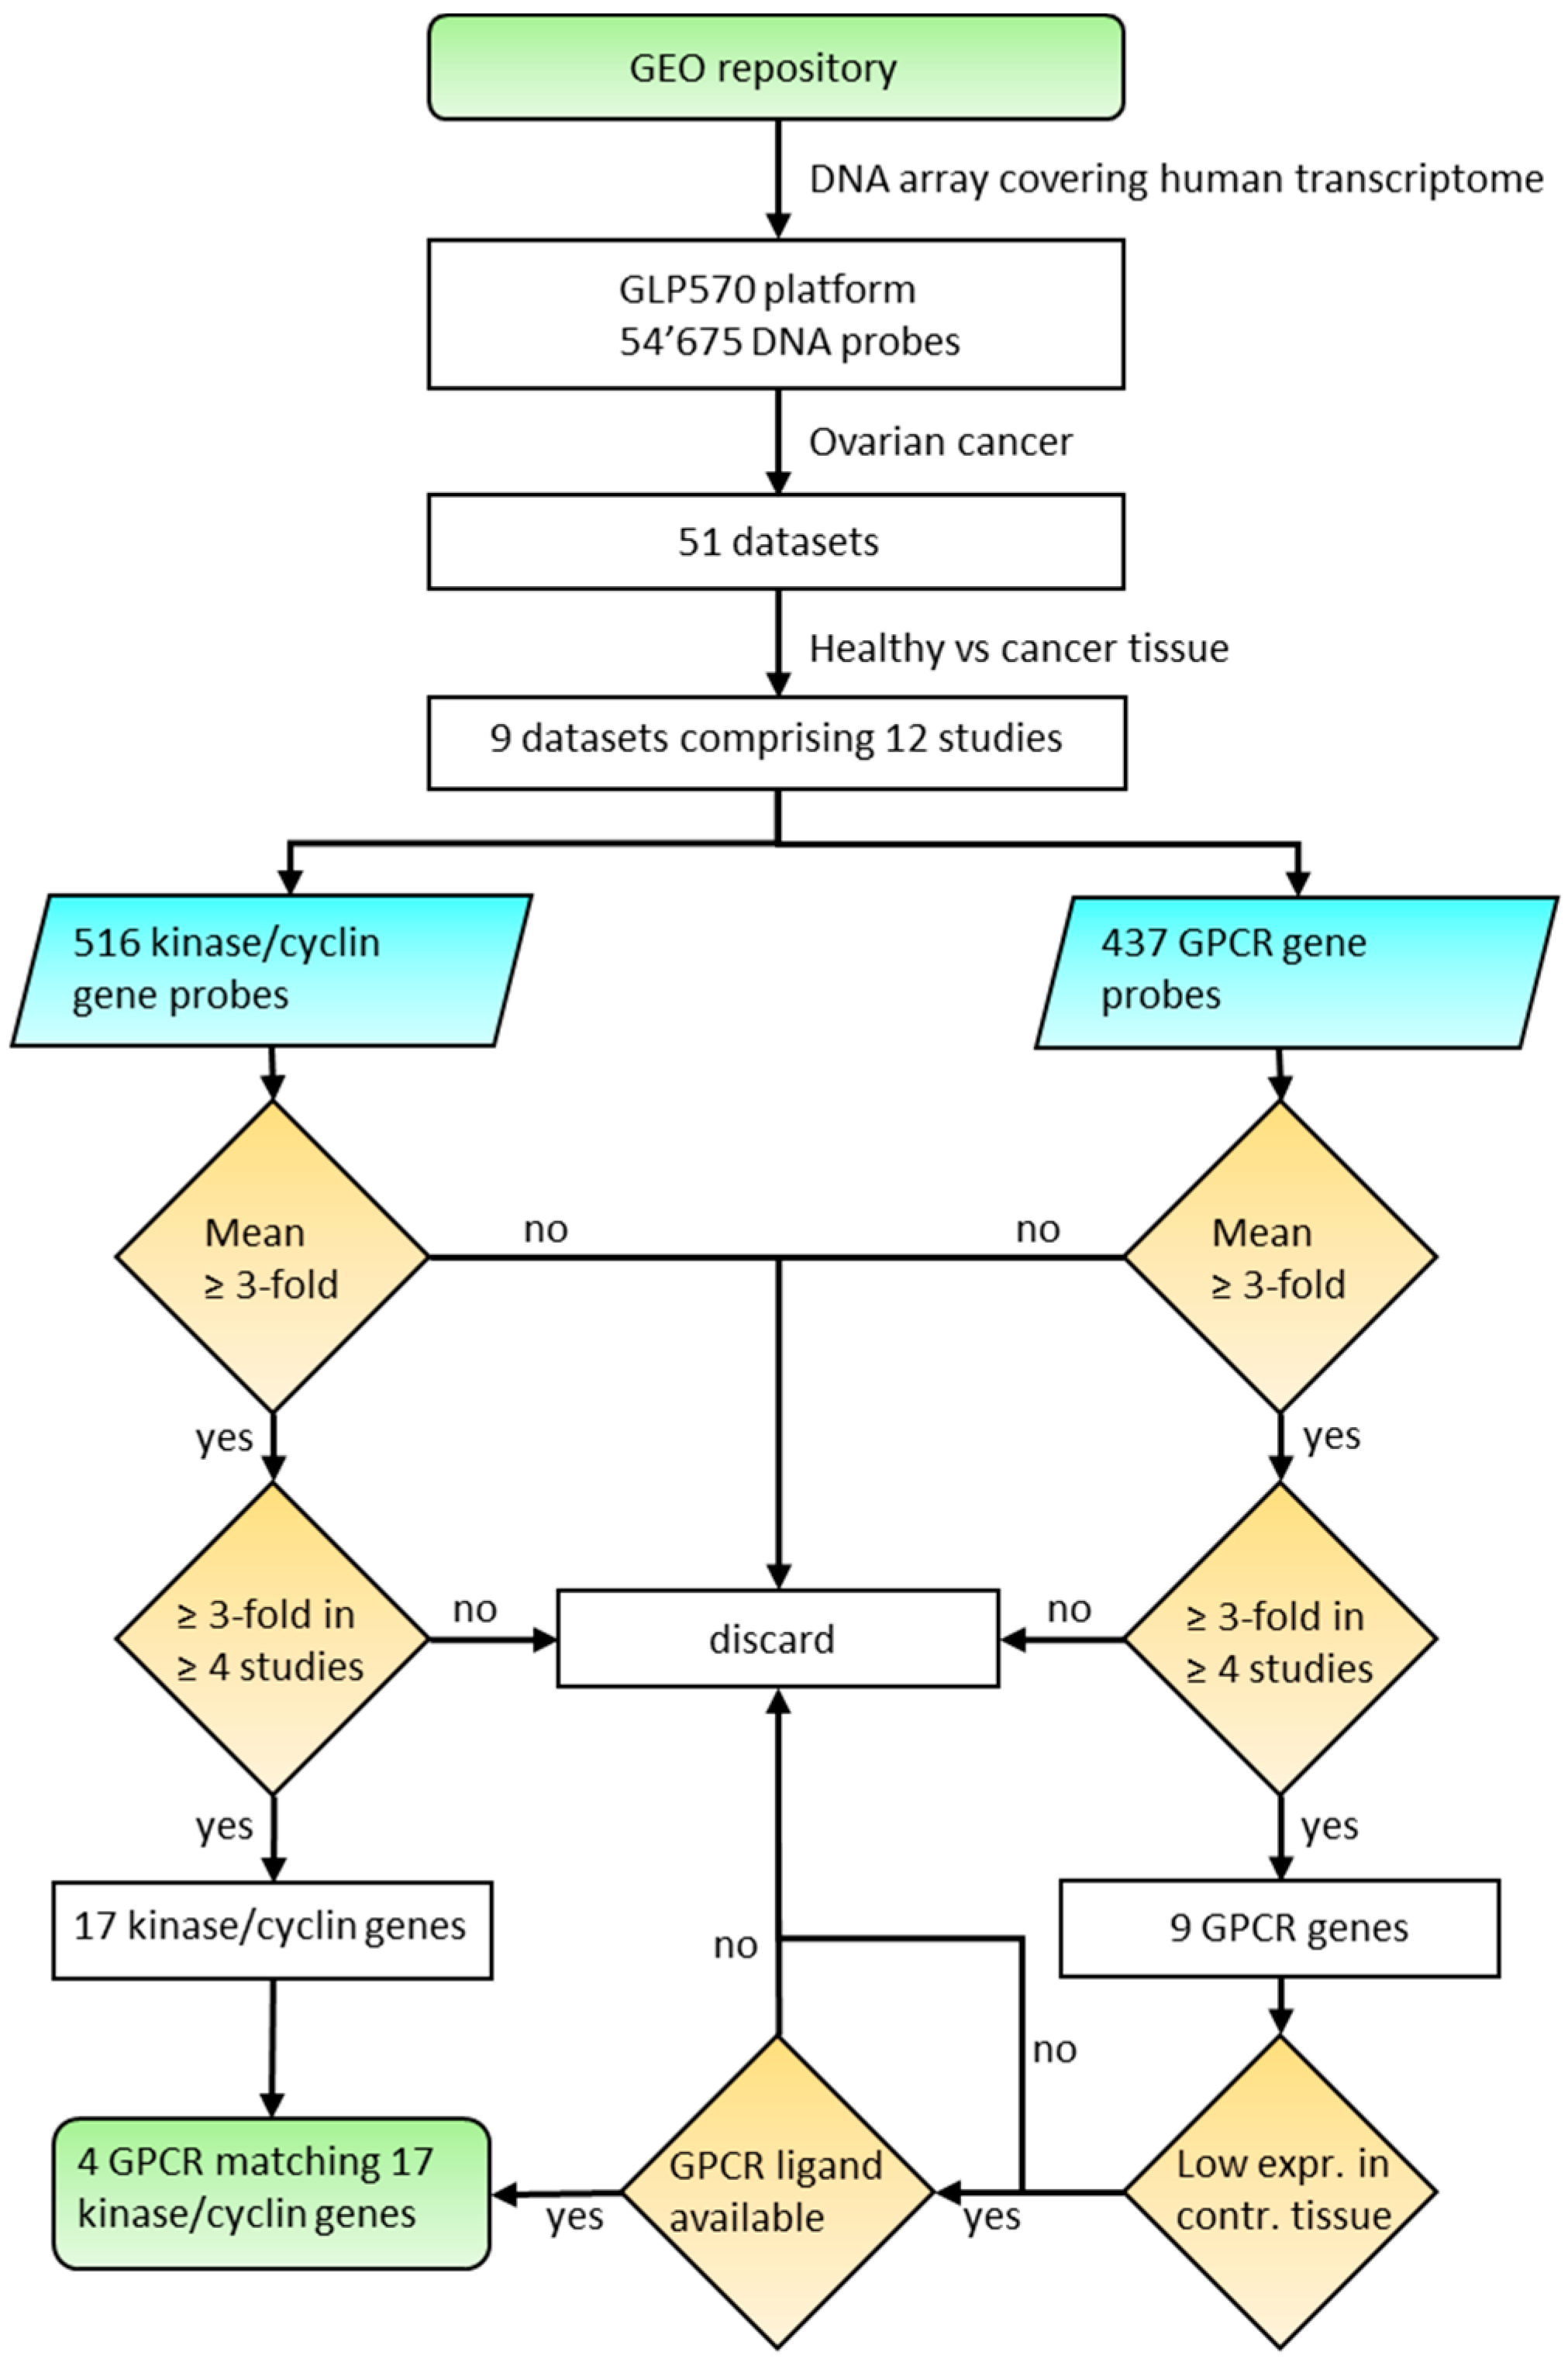
2. Materials and Methods
3. Results and Discussion
4. Ligand Docking
5. Conclusions
Supplementary Materials
Author Contributions
Funding
Acknowledgments
Conflicts of Interest
Abbreviations
References
- Siegel, R.L.; Miller, K.D.; Jemal, A. Cancer statistics 2016. CA Cancer J. Clin. 2016, 66, 7–30. [Google Scholar] [CrossRef] [PubMed]
- Jemal, A.; Bray, F.; Center, M.M.; Ferlay, J.; Ward, E.; Forman, D. Global cancer statistics. CA Cancer J. Clin. 2011, 61, 69–90. [Google Scholar] [CrossRef] [PubMed] [Green Version]
- Lopez, M.D.C.; Agresti, R.; Pérez, M.J.S.; Innos, K.; Langseth, H.; Larrañaga, N.; Siesling, S.; Hackl, M.; Zielonke, N.; Oberaigner, W.; et al. Survival of women with cancers of breast and genital organs in Europe 1999–2007: Results of the EUROCARE-5 study. Eur. J. Cancer 2015, 51, 2191–2205. [Google Scholar]
- Matulonis, U.A.; Sood, A.K.; Fallowfield, L.; Howitt, B.E.; Sehouli, J.; Karlan, B.Y. Ovarian cancer. Nat. Rev. Dis. Primers 2016, 2, 16061. [Google Scholar] [CrossRef] [PubMed]
- Force, T.; Krause, D.S.; Van Etten, R.A. Molecular mechanisms of cardiotoxicity of tyrosine kinase inhibition. Nat. Rev. Cancer 2007, 7, 332–344. [Google Scholar] [CrossRef] [PubMed]
- Olaharski, A.J.; Gonzaludo, N.; Bitter, H.; Goldstein, D.; Kirchner, S.; Uppal, H.; Kolaja, K. Identification of a Kinase Profile that Predicts Chromosome Damage Induced by Small Molecule Kinase Inhibitors. PLoS Comput. Biol. 2009, 5, e1000446. [Google Scholar] [CrossRef] [PubMed]
- Fabbro, D. 25 years of small molecular weight kinase inhibitors: Potentials and limitations. Mol. Pharmacol. 2015, 87, 766–775. [Google Scholar] [CrossRef] [PubMed]
- Ferguson, F.M.; Gray, N.S. Kinase inhibitors: The road ahead. Nat. Rev. Drug Discov. 2018, 17, 353–377. [Google Scholar] [CrossRef] [PubMed]
- Fischer, P.M. Appoved and Experimental Small-Molecule Oncology Kinase Inhibitor Drugs: A Mid-2016 Overview. Med. Res. Rev. 2017, 37, 314–367. [Google Scholar] [CrossRef] [PubMed]
- Hobbs, S.K.; Monsky, W.L.; Yuan, F.; Roberts, W.G.; Griffith, L.; Torchilin, V.P.; Jain, R.K. Regulation of transport pathways in tumor vessels: Role of tumor type and microenvironment. Proc. Natl. Acad. Sci. USA 1998, 95, 4607–4612. [Google Scholar] [CrossRef] [PubMed] [Green Version]
- Gaumet, M.; Vargas, A.; Gurny, R.; Delie, F. Nanoparticles for drug delivery: The need for precision in reporting particle size parameters. Eur. J. Pharm. Biopharm. 2008, 69, 1–9. [Google Scholar] [CrossRef] [PubMed]
- Sau, S.; Alsaab, H.O.; Kashaw, S.K.; Tatiparti, K.; Iyer, A.K. Advances in antibody–drug conjugates: A new era of targeted cancer therapy. Drug Discov. Today 2017, 22, 1547–1556. [Google Scholar] [CrossRef] [PubMed]
- Wang, Y.; Cheetham, A.G.; Angacian, G.; Su, H.; Xie, L.; Cui, H. Peptide–drug conjugates as effective prodrug strategies for targeted delivery. Adv. Drug Deliv. Rev. 2017, 110–111, 112–126. [Google Scholar] [CrossRef]
- Barragán, F.; González-Cantó, A.; Moreno, V.; Carrion-Salip, D.; Gómez-Pinto, I.; Sadler, P.J.; De Llorens, R.; González, C.; Massaguer, A.; Marchán, V. Somatostatin Subtype-2 Receptor-Targeted Metal-Based Anticancer Complexes. Bioconjug. Chem. 2012, 23, 1838–1855. [Google Scholar] [CrossRef] [PubMed] [Green Version]
- De Jong, M.; Breeman, W.A.; Kwekkeboom, D.J.; Valkema, R.; Krenning, E.P. Tumor imaging and therapy using radiolabeled somatostatin analogues. Acc. Chem. Res. 2009, 42, 873–880. [Google Scholar] [CrossRef] [PubMed]
- Okarvi, S. Peptide-based radiopharmaceuticals and cytotoxic conjugates: Potential tools against cancer. Cancer Treat. Rev. 2008, 34, 13–26. [Google Scholar] [CrossRef] [PubMed]
- Accardo, A.; Morisco, A.; Tesauro, D.; Pedone, C.; Morelli, G. Naposomes: A new class of peptide-derivatized, target-selective multimodal nanoparticles for imaging and therapeutic applications. Ther. Deliv. 2011, 2, 235–257. [Google Scholar] [CrossRef]
- Aloj, L.; Aurilio, M.; Rinaldi, V.; D’ambrosio, L.; Tesauro, D.; Peitl, P.K.; Maina, T.; Mansi, R.; Von Guggenberg, E.; Joosten, L.; et al. Comparison of the binding and internalization properties of 12 DOTA-coupled and (1)(1)(1)In-labelled CCK2/gastrin receptor binding peptides: A collaborative project under COST Action BM0607. Eur. J. Nucl. Med. Mol. Imaging 2011, 38, 1417–1425. [Google Scholar] [CrossRef]
- Accardo, A.; Mansi, R.; Morisco, A.; Mangiapia, G.; Paduano, L.; Tesauro, D.; Radulescu, A.; Aurilio, M.; Aloj, L.; Arra, C.; et al. Peptide modified nanocarriers for selective targeting of bombesin receptors. Mol. BioSyst. 2010, 6, 878. [Google Scholar] [CrossRef]
- Parry, J.J.; Kelly, T.S.; Andrews, R.; Rogers, B.E. In Vitro and in Vivo Evaluation of64Cu-Labeled DOTA-Linker-Bombesin(7–14) Analogues Containing Different Amino Acid Linker Moieties. Bioconjug. Chem. 2007, 18, 1110–1117. [Google Scholar] [CrossRef]
- Smith, C.J.; Volkert, W.A.; Hoffman, T.J. Radiolabeled peptide conjugates for targeting of the bombesin receptor superfamily subtypes. Nucl. Med. Biol. 2005, 32, 733–740. [Google Scholar] [CrossRef] [PubMed]
- Zhang, L. Luteinizing hormone-releasing hormone receptor-mediated delivery of mitoxantrone using LHRH analogs modified with PEGylated liposomes. Int. J. Nanomed. 2010, 5, 697. [Google Scholar] [CrossRef]
- Nagy, A.; Schally, A.V. Targeting of Cytotoxic Luteinizing Hormone-Releasing Hormone Analogs to Breast, Ovarian, Endometrial, and Prostate Cancers1. Biol. Reprod. 2005, 73, 851–859. [Google Scholar] [CrossRef] [PubMed] [Green Version]
- Falciani, C.; Brunetti, J.; Lelli, B.; Accardo, A.; Tesauro, D.; Morelli, G.; Bracci, L. Nanoparticles exposing neurotensin tumor-specific drivers. J. Pept. Sci. 2013, 19, 198–204. [Google Scholar] [CrossRef] [PubMed]
- Falciani, C.; Fabbrini, M.; Pini, A.; Lozzi, L.; Lelli, B.; Pileri, S.; Brunetti, J.; Bindi, S.; Scali, S.; Bracci, L. Synthesis and biological activity of stable branched neurotensin peptides for tumor targeting. Mol. Cancer Ther. 2007, 6, 2441–2448. [Google Scholar] [CrossRef] [PubMed] [Green Version]
- Allen, J.K.; Brock, D.J.; Kondow-McConaghy, H.M.; Pellois, J.-P. Efficient Delivery of Macromolecules into Human Cells by Improving the Endosomal Escape Activity of Cell-Penetrating Peptides: Lessons Learned from dfTAT and its Analogs. Biomolecules 2018, 8, 50. [Google Scholar] [CrossRef] [PubMed]
- Irizarry, R.A.; Hobbs, B.; Collin, F.; Beazer-Barclay, Y.D.; Antonellis, K.J.; Scherf, U.; Speed, T.P. Exploration, normalization, and summaries of high density oligonucleotide array probe level data. Biostatistics 2003, 4, 249–264. [Google Scholar] [CrossRef] [PubMed] [Green Version]
- Arnold, K.; Bordoli, L.; Kopp, J.; Schwede, T. The SWISS-MODEL workspace: A web-based environment for protein structure homology modelling. Bioinformatics 2006, 22, 195–201. [Google Scholar] [CrossRef] [PubMed]
- Benkert, P.; Biasini, M.; Schwede, T. Toward the estimation of the absolute quality of individual protein structure models. Bioinformatics 2011, 27, 343–350. [Google Scholar] [CrossRef]
- Biasini, M.; Bienert, S.; Waterhouse, A.; Arnold, K.; Studer, G.; Schmidt, T.; Kiefer, F.; Cassarino, T.G.; Bertoni, M.; Bordoli, L.; et al. SWISS-MODEL: Modelling protein tertiary and quaternary structure using evolutionary information. Nucleic Acids Res. 2014, 42, W252–W258. [Google Scholar] [CrossRef]
- Altschul, S. Gapped BLAST and PSI-BLAST: A new generation of protein database search programs. Nucleic Acids Res. 1997, 25, 3389–3402. [Google Scholar] [CrossRef] [PubMed]
- Remmert, M.; Biegert, A.; Hauser, A.; Söding, J. HHblits: Lightning-fast iterative protein sequence searching by HMM-HMM alignment. Nat. Methods 2011, 9, 173–175. [Google Scholar] [CrossRef] [PubMed]
- Benkert, P.; Künzli, M.; Schwede, T. QMEAN server for protein model quality estimation. Nucleic Acids Res. 2009, 37, W510–W514. [Google Scholar] [CrossRef] [PubMed] [Green Version]
- Kurcinski, M.; Jamroz, M.; Blaszczyk, M.; Kolinski, A.; Kmiecik, S. CABS-dock web server for the flexible docking of peptides to proteins without prior knowledge of the binding site. Nucleic Acids Res. 2015, 43, W419–W424. [Google Scholar] [CrossRef] [PubMed]
- Grosdidier, A.; Zoete, V.; Michielin, O. SwissDock, a protein-small molecule docking web service based on EADock DSS. Nucleic Acids Res. 2011, 39, W270–W277. [Google Scholar] [CrossRef] [PubMed] [Green Version]
- Grosdidier, A.; Zoete, V.; Michielin, O. Fast docking using the CHARMM force field with EADock DSS. J. Comput. Chem. 2011, 32, 2149–2159. [Google Scholar] [CrossRef] [PubMed]
- Saurin, A.T. Kinase and Phosphatase Cross-Talk at the Kinetochore. Front. Cell Dev. Biol. 2018, 6, 62. [Google Scholar] [CrossRef] [Green Version]
- Yamada, M.; Masai, H.; Bartek, J. Regulation and roles of Cdc7 kinase under replication stress. Cell Cycle 2014, 13, 1859–1866. [Google Scholar] [CrossRef]
- Ganguly, R.; Hong, C.; Smith, L.; Kornblum, H.I.; Nakano, I. Maternal Embryonic Leucine-zipper Kinase: Key Kinase for Stem Cell Phenotype in Glioma and Other Cancers. Mol. Cancer Ther. 2014, 13, 1393–1398. [Google Scholar] [CrossRef]
- Liu, X.; Gao, Y.; Lu, Y.; Zhang, J.; Li, L.; Yin, F. Up-regulation of NEK2 is associated with drug resistance in ovarian cancer. Oncol. Rep. 2014, 31, 745–754. [Google Scholar] [CrossRef]
- Fang, Y.; Zhang, X. Targeting NEK2 as a promising therapeutic approach for cancer treatment. Cell Cycle 2016, 15, 895–907. [Google Scholar] [CrossRef] [PubMed] [Green Version]
- Bartaula-Brevik, S.; Brattås, M.K.L.; Tvedt, T.H.A.; Reikvam, H.; Bruserud, Ø. Splenic tyrosine kinase (SYK) inhibitors and their possible use in acute myeloid leukemia. Expert Opin. Investig. Drugs 2018, 27, 1–11. [Google Scholar] [CrossRef] [PubMed]
- Huang, S.; Alberts, I.; Li, Q.; Li, X. PRKX, a Novel cAMP-Dependent Protein Kinase Member, Plays an Important Role in Development. J. Cell. Biochem. 2016, 117, 566–573. [Google Scholar] [CrossRef] [PubMed]
- Dominguez-Brauer, C.; Thu, K.L.; Mason, J.M.; Blaser, H.; Bray, M.R.; Mak, T.W. Targeting Mitosis in Cancer: Emerging Strategies. Mol. Cell 2015, 60, 524–536. [Google Scholar] [CrossRef] [PubMed] [Green Version]
- Kübler, E.; Albrecht, H. Large set data mining reveals overexpressed GPCRs in prostate and breast cancer: Potential for active targeting with engineered anti-cancer nanomedicines. Oncotarget 2018, 9, 24882–24897. [Google Scholar] [CrossRef] [PubMed]
- Frimurer, T.M.; Mende, F.; Graae, A.S.; Engelstoft, M.S.; Egerod, K.L.; Nygaard, R.; Gerlach, L.O.; Hansen, J.B.; Schwartz, T.W.; Holst, B. Model-Based Discovery of Synthetic Agonists for the Zn(2+)-Sensing G-Protein-Coupled Receptor 39 (GPR39) Reveals Novel Biological Functions. J. Med. Chem. 2017, 60, 886–898. [Google Scholar] [CrossRef] [PubMed]
- Mishra, R.; Patel, H.; Alanazi, S.; Yuan, L.; Garrett, J.T. HER3 signaling and targeted therapy in cancer. Oncol. Rev. 2018, 12, 355. [Google Scholar] [CrossRef] [Green Version]
- Siu, K.T.; Rosner, M.R.; Minella, A.C. An integrated view of cyclin E function and regulation. Cell Cycle 2012, 11, 57–64. [Google Scholar] [CrossRef] [Green Version]
- Barretina, J.; Caponigro, G.; Stransky, N.; Venkatesan, K.; Margolin, A.A.; Kim, S.; Wilson, C.J.; Lehár, J.; Kryukov, G.V.; Sonkin, D.; et al. The Cancer Cell Line Encyclopedia enables predictive modelling of anticancer drug sensitivity. Nature 2012, 483, 603–607. [Google Scholar] [CrossRef]
- Weaver, R.E.; Mobarec, J.C.; Wigglesworth, M.J.; Reynolds, C.A.; Donnelly, D. High affinity binding of the peptide agonist TIP-39 to the parathyroid hormone 2 (PTH2) receptor requires the hydroxyl group of Tyr-318 on transmembrane helix 5. Biochem. Pharmacol. 2017, 127, 71–81. [Google Scholar] [CrossRef]


| Accession # | Sample Size | Primary Cancer Samples | Calculations a |
|---|---|---|---|
| GSE10971 | 37 | Non-malignant fallopian epithelium (12 BRCA wt; 12 BRCA mut b) versus high grade SOC c (13) | 1 |
| GSE14401 | 23 | HOSE (3) d, low grade SOC (10), high grade SOC (10) | 2 |
| GSE14407 | 24 | HOSE (12), high grade SOC (12) | 1 |
| GSE18520 | 63 | Normal ovary (10), advanced stage high grade SOC (53) | 1 |
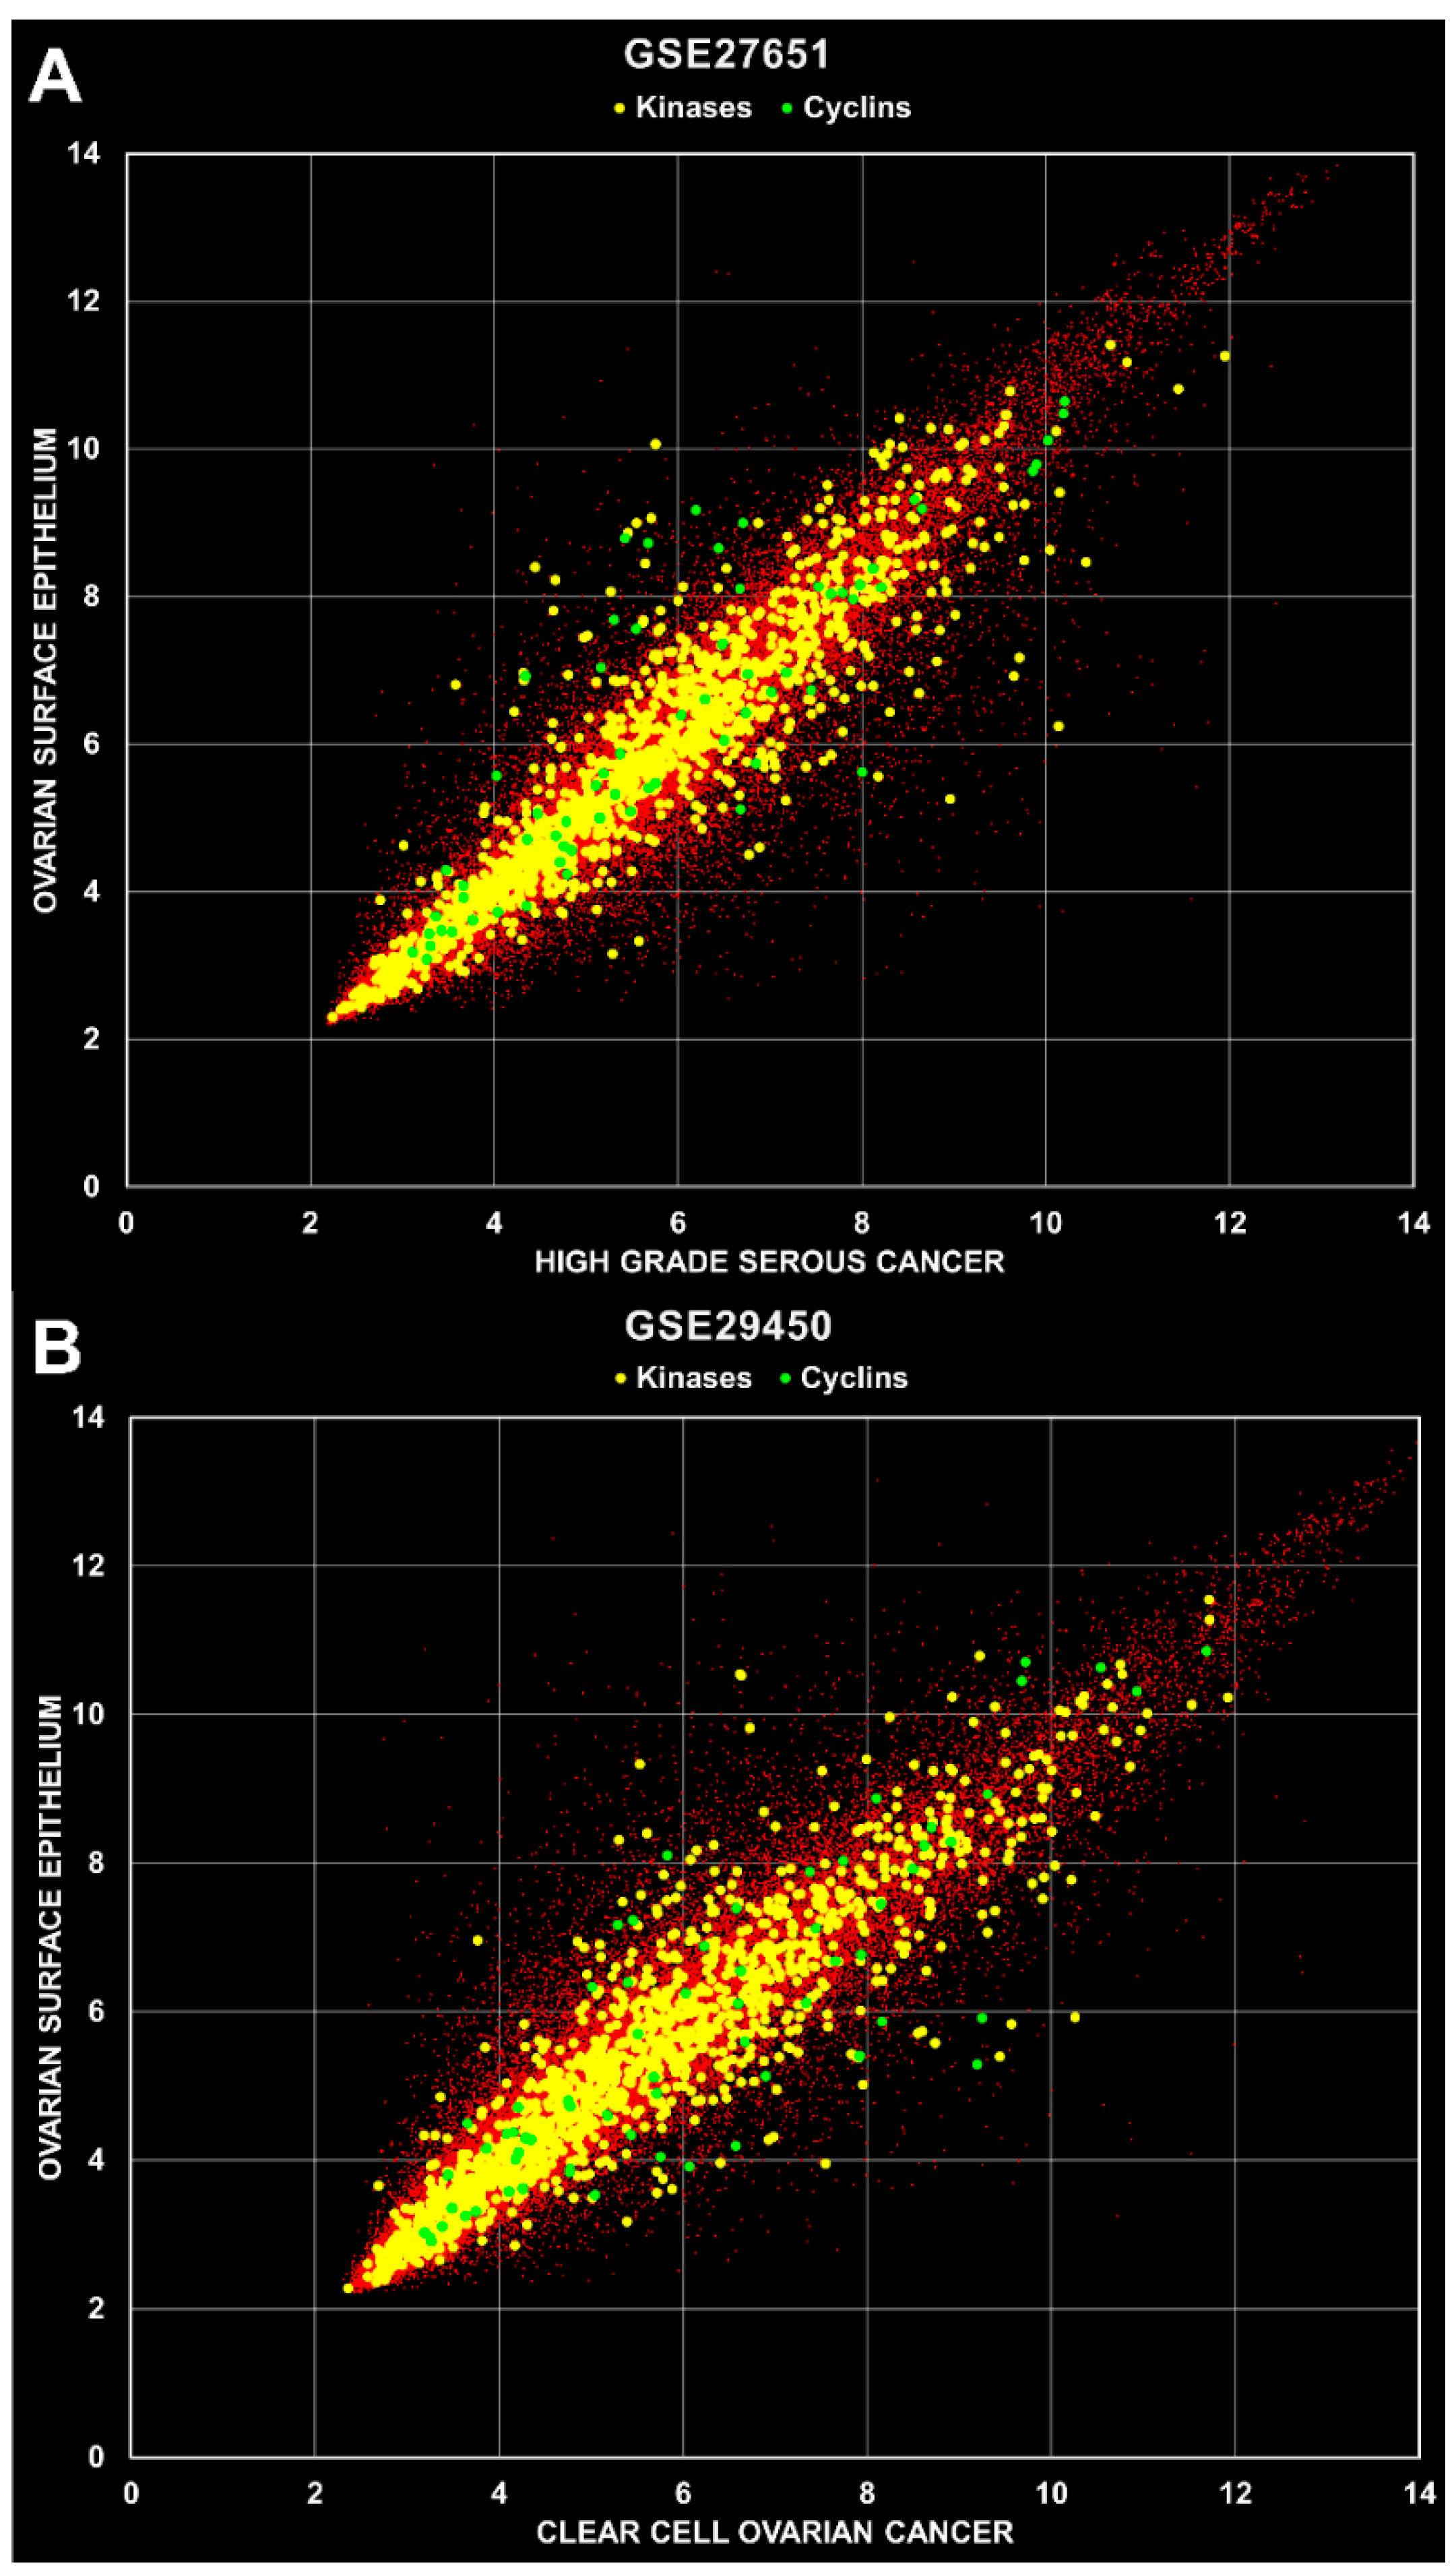
| GSE27651 | 49 | HOSE (6), serous borderline ovarian tumors (8), low grade SOC (13), high grade SOC (22) | 3 |
| GSE29450 | 20 | HOSE (10) versus clear cell ovarian carcinoma (10) | 1 |
| GSE52037 | 20 | Healthy (10) versus primary tumors (10) e,f | 1 |
| GSE54388 | 22 | Healthy (6) versus high grade SOC f (16) | 1 |
| GSE105437 | 22 | Normal tissue (5), cancer (10) g, [wound (7)] b | 1 |
| Gene | Probe ID | Fold Induction (p-Value) |
|---|---|---|
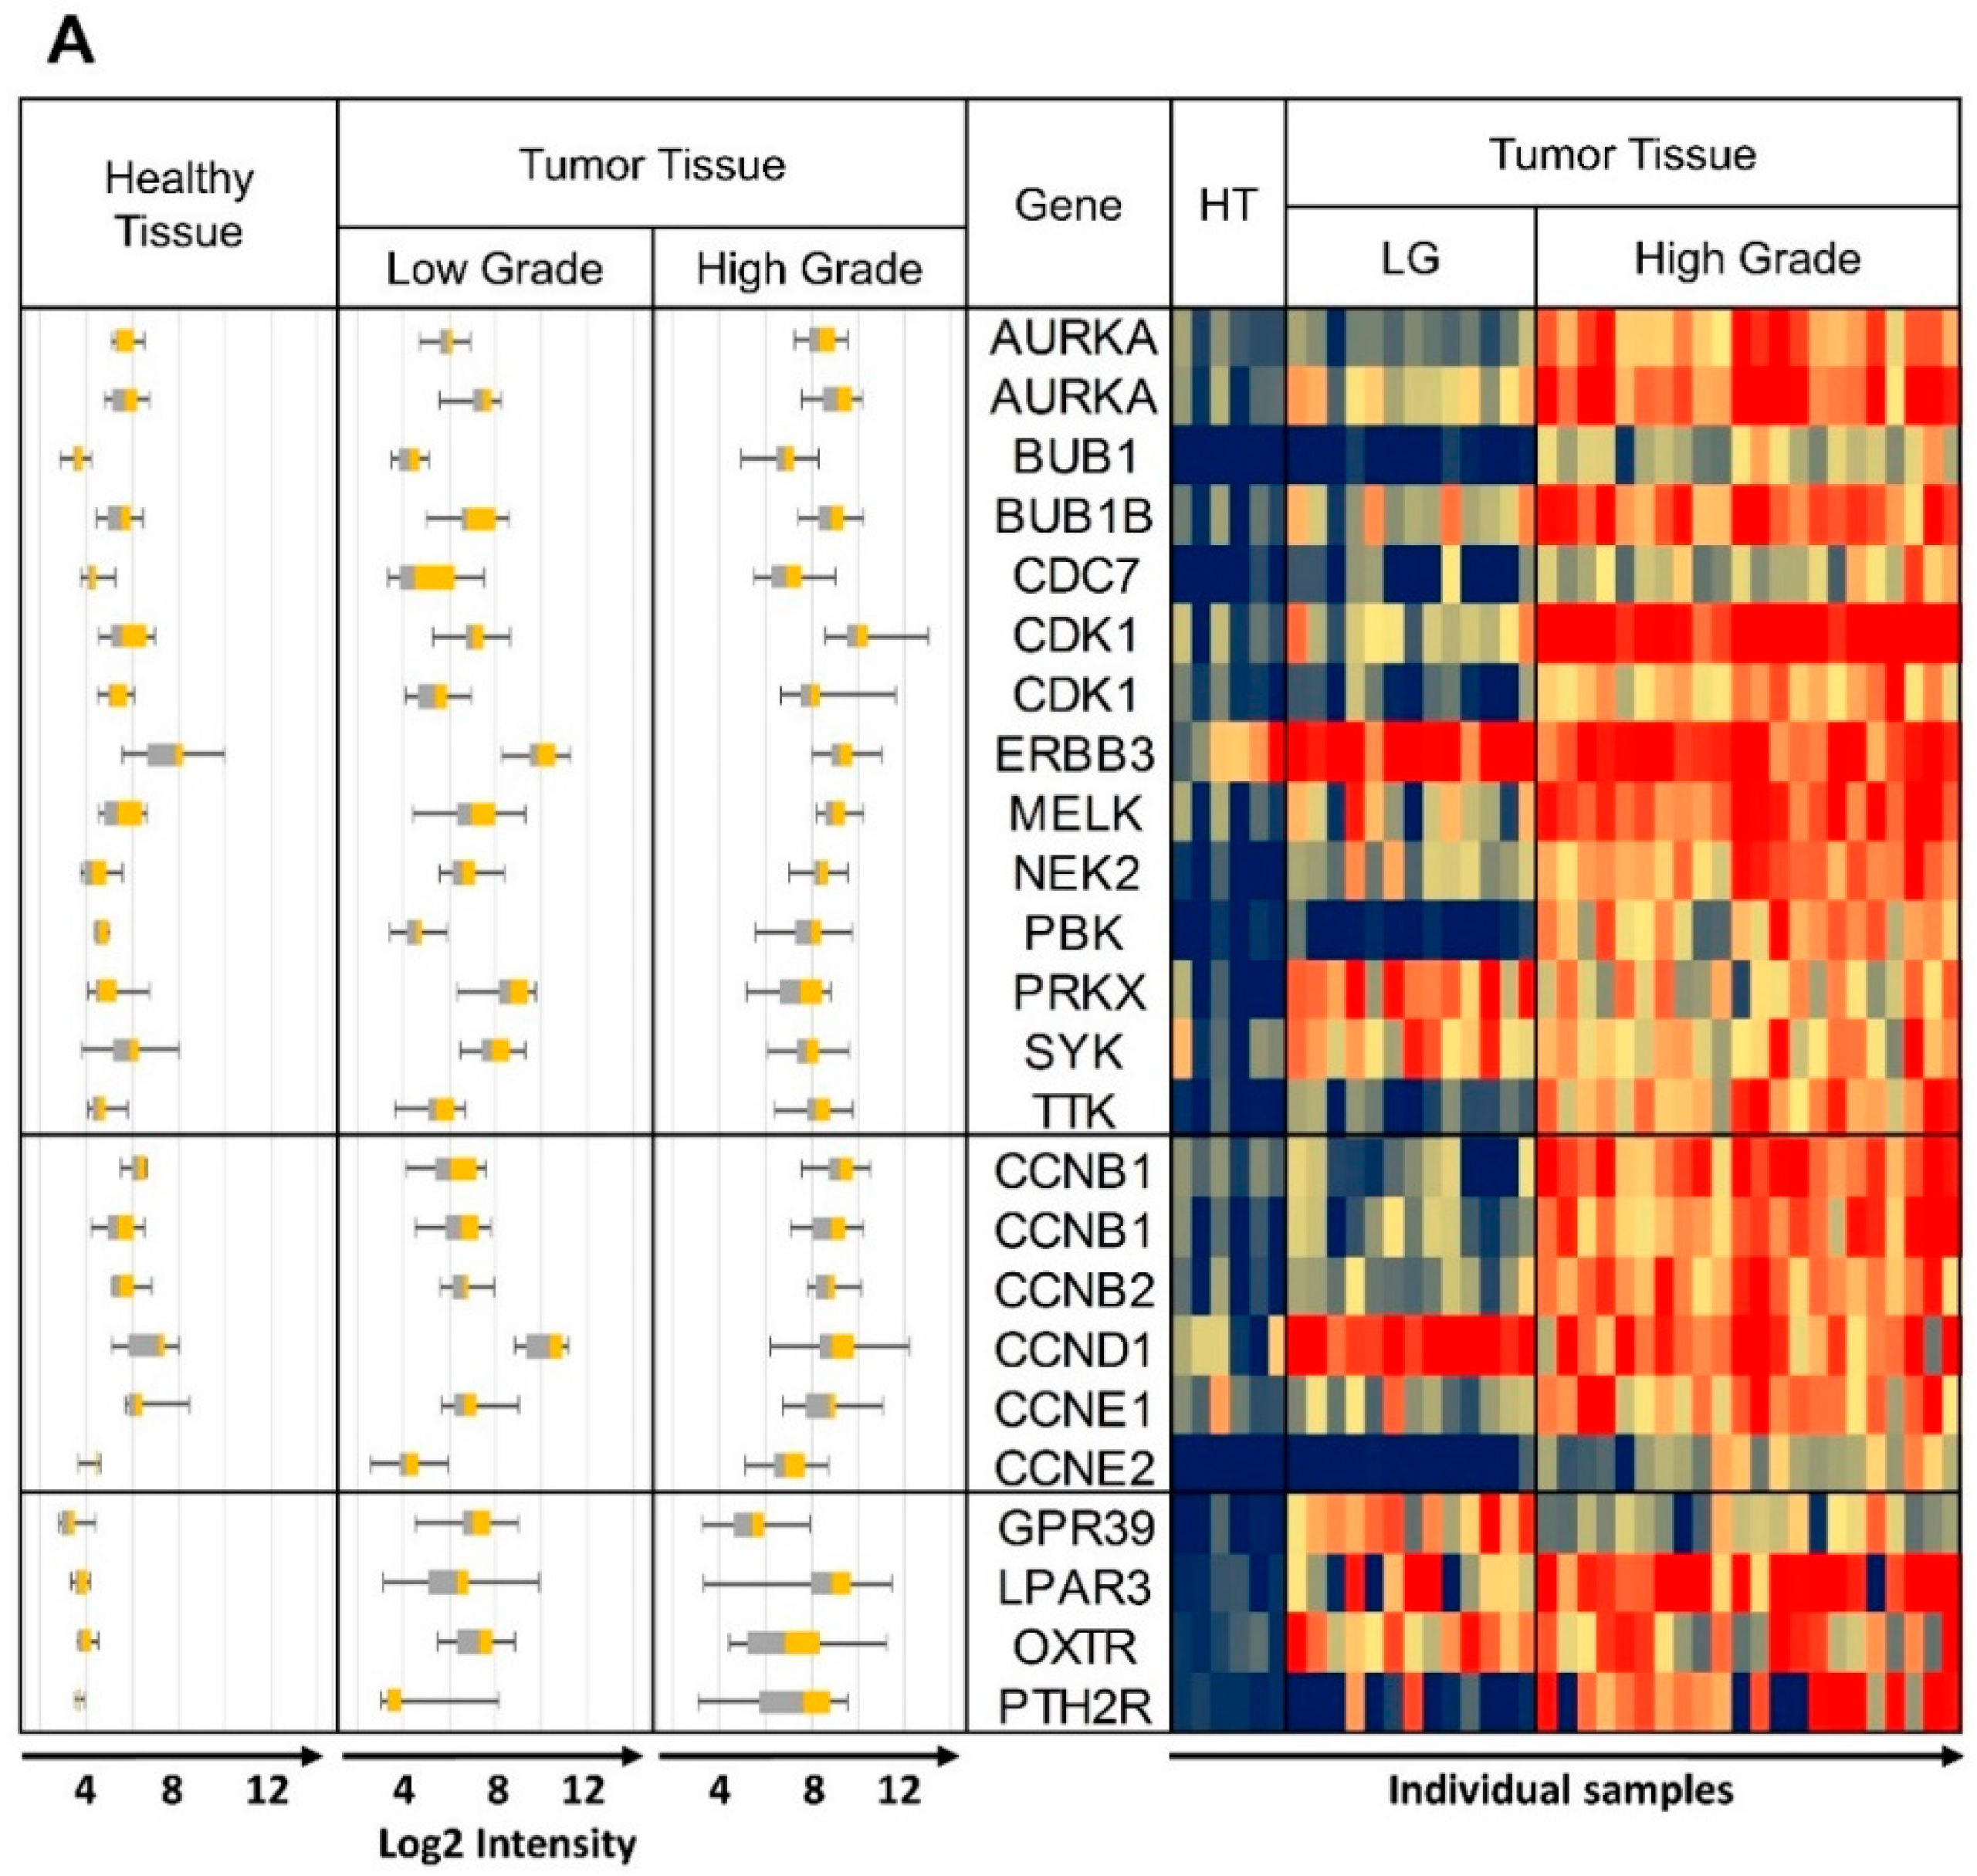
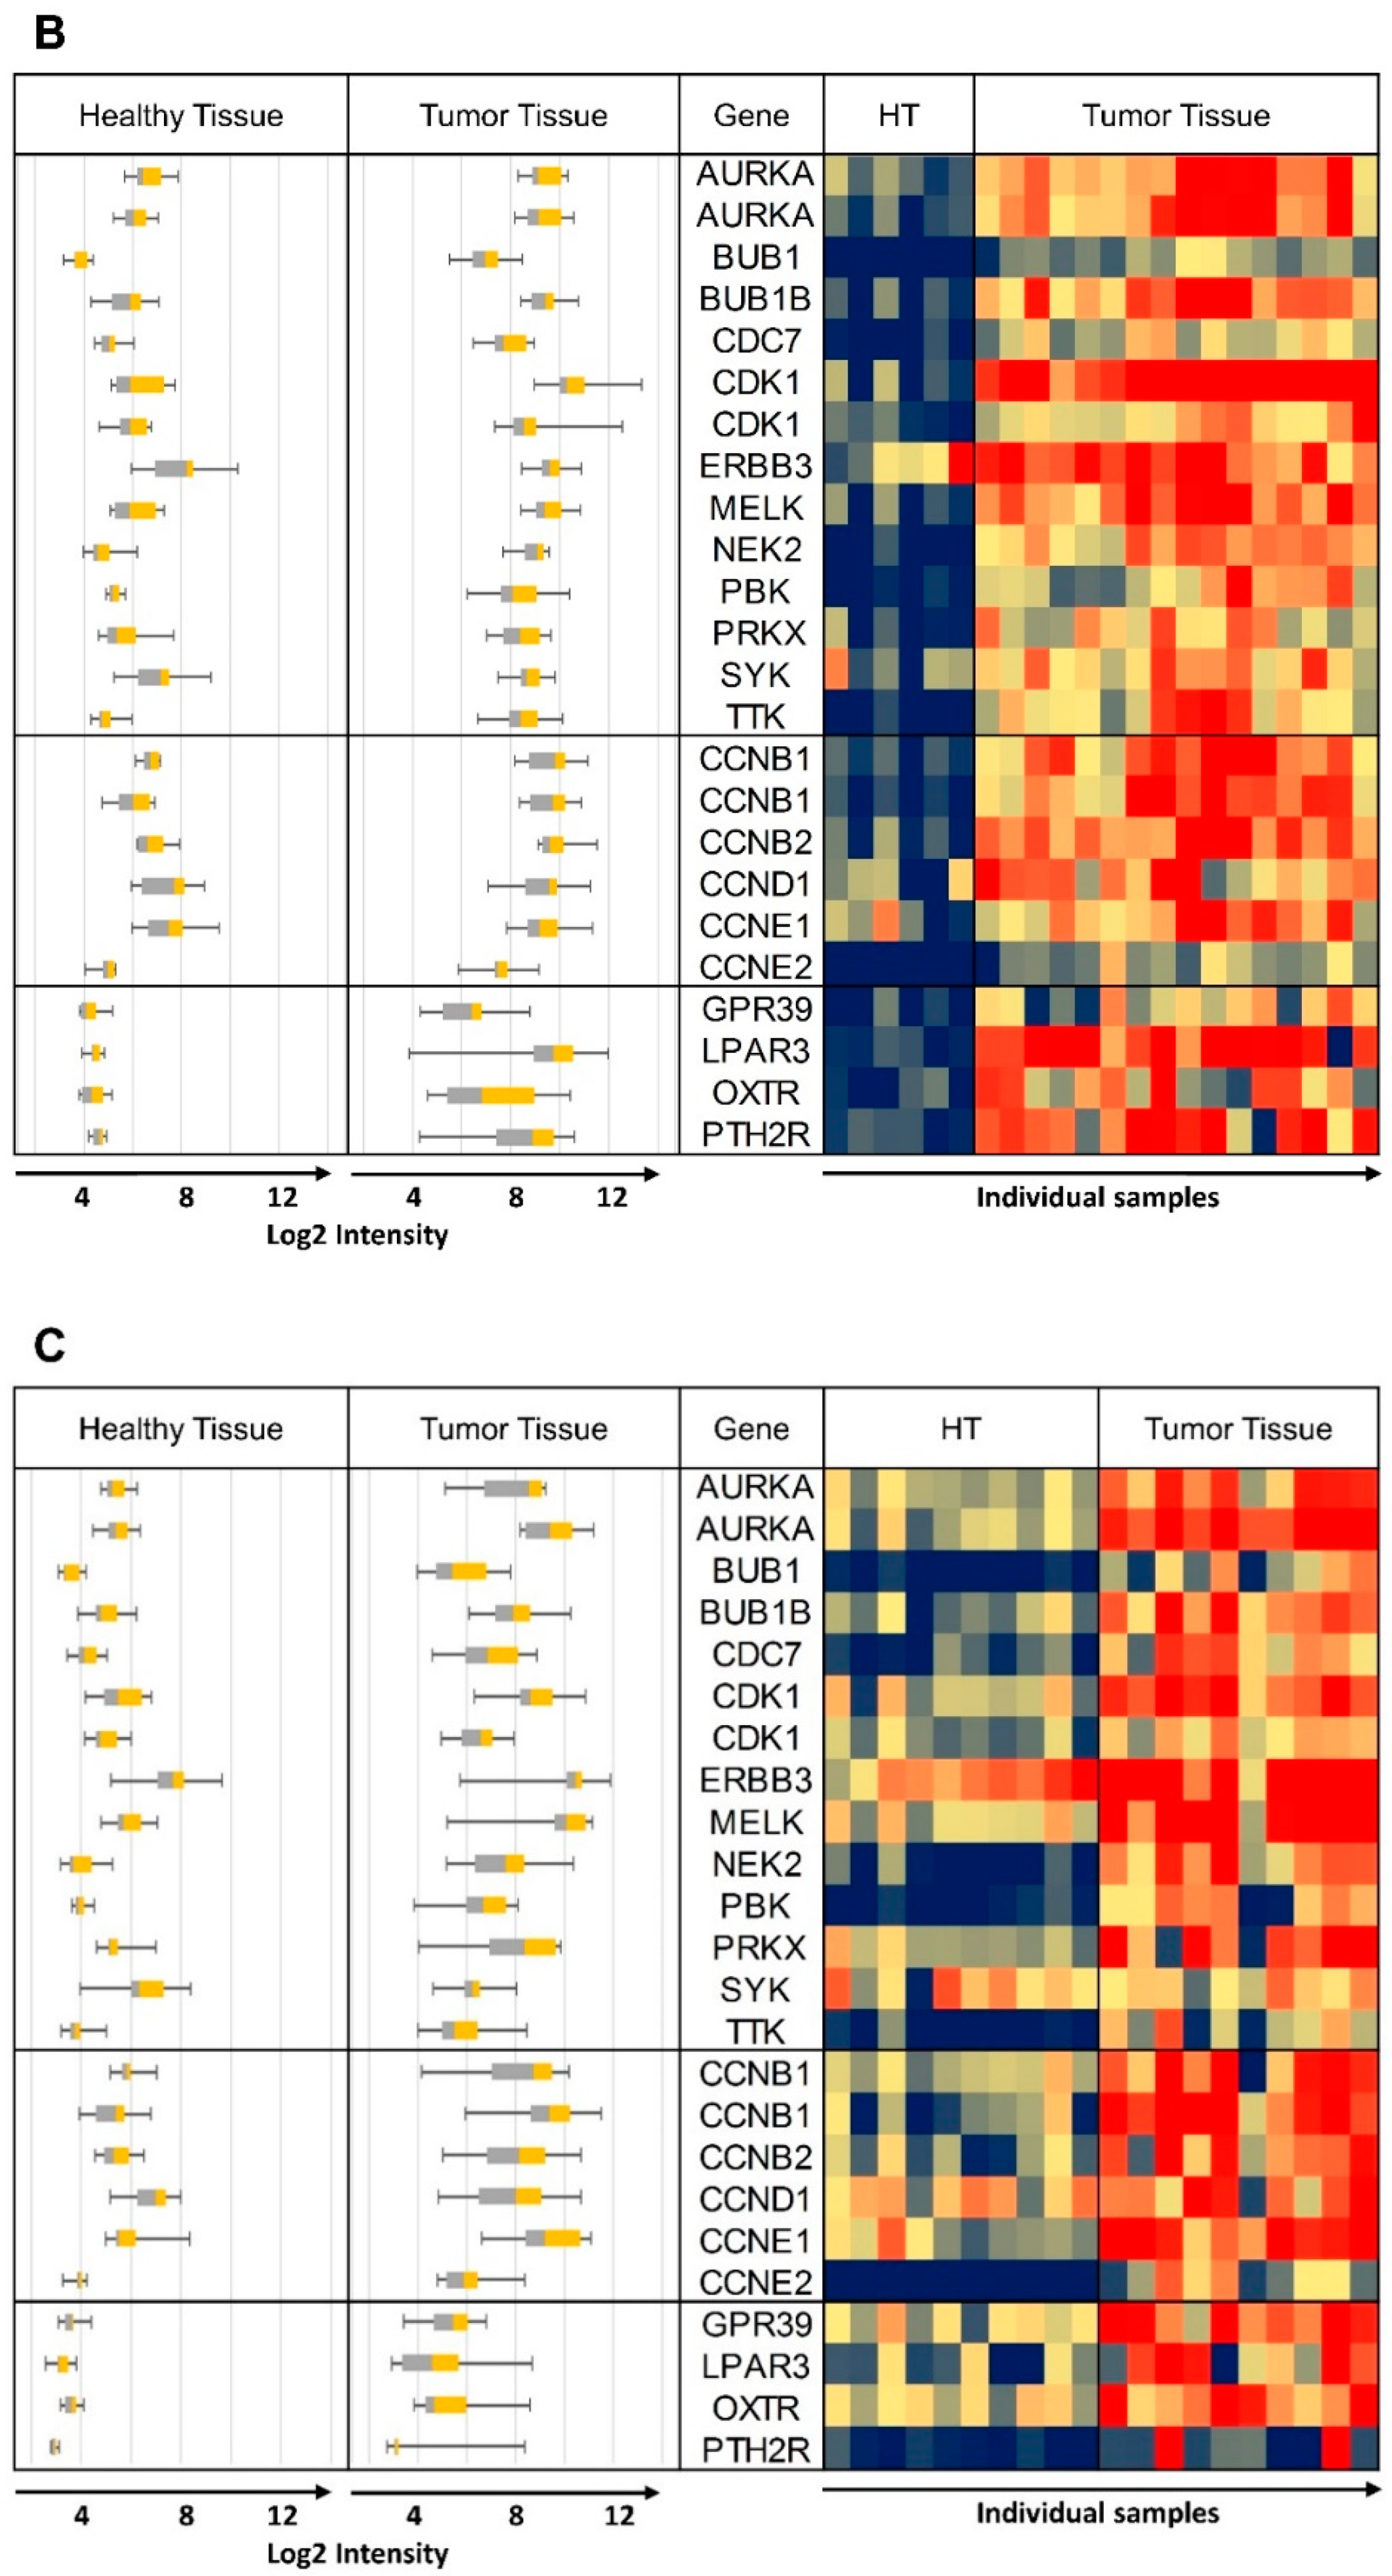
| AURKA | 204092_s_at | 13.35 (0.00), 10.85 (0.00), 0.44 (0.09), 0.78 (0.64), 2.75 (0.00), 5.46 (0.00), 7.04 (0.00), 1.19 (0.51), 5.71 (0.00), 2.64 (0.00), 6.3 (0.00), 1.4 (0.55); mean: 4.83 |
| 208079_s_at | 15.46 (0.00), 11.82 (0.00), 0.19 (0.02), 0.62 (0.49), 5.69 (0.00), 6.31 (0.00), 10.27 (0.00), 3.00 (0.00), 16.29 (0.00), 5.25 (0.00), 9.24 (0.00), 1.44 (0.58); mean: 7.13 | |
| BUB1 | 209642_at | 6.24 (0.00), 5.99 (0.00), 0.33 (0.1), 0.73 (0.66), 2.71 (0.00), 6.20 (0.00), 9.43 (0.00), 1.59 (0.04), 4.41 (0.00), 3.36 (0.00), 9.36 (0.00), 1.53 (0.35); mean: 4.32 |
| BUB1B | 203755_at | 10.9 (0.00), 13.95 (0.00), 0.35 (0.05), 1.05 (0.93), 5.62 (0.00), 7.00 (0.00), 10.7 (0.00), 3.02 (0.01), 7.59 (0.00), 6.08 (0.00), 12.09 (0.00), 1.95 (0.32); mean: 6.69 |
| CDC7 | 204510_at | 6.69 (0.00), 6.24 (0.00), 0.45 (0.03), 0.99 (0.98), 1.90 (0.01), 2.77 (0.00), 6.31 (0.00), 1.64 (0.19), 6.25 (0.00), 1.66 (0.05), 6.68 (0.00), 0.80 (0.74); mean: 3.53 |
| CDK1 | 203213_at | 7.03 (0.00), 6.28 (0.00), 0.34 (0.05), 0.93 (0.90), 4.25 (0.00), 8.72 (0.00), 20.02 (0.00), 2.46 (0.04), 8.86 (0.00), 4.31 (0.00), 18.85 (0.00), 2.25 (0.28); mean: 7.02 |
| 210559_s_at | 7.86 (0.00), 6.17 (0.00), 0.32 (0.01), 0.77 (0.54), 2.72 (0.01), 5.69 (0.00), 7.01 (0.00), 1.01 (0.97), 2.77 (0.00), 2.21 (0.05), 7.22 (0.00), 1.44 (0.56); mean: 3.77 | |
| ERBB3 | 226213_at | 0.86 (0.84), 0.98 (0.98), 6.28 (0.00), 7.83 (0.00), 1.11 (0.77), 2.05 (0.04), 3.22 (0.06), 4.85 (0.02), 5.19 (0.02), 1.03 (0.92), 3.20 (0.08), 1.31 (0.63); mean: 3.16 |
| MELK | 204825_at | 6.19 (0.00), 5.44 (0.00), 0.18 (0.00), 0.47 (0.06), 6.84 (0.00), 5.86 (0.00), 11.01 (0.00), 2.56 (0.06), 13.18 (0.00), 5.32 (0.00), 10.77 (0.00), 3.59 (0.13); mean: 5.95 |
| NEK2 | 204641_at | 3.50 (0.02), 2.81 (0.02), 0.66 (0.5), 1.38 (0.62), 5.43 (0.00), 11.06 (0.00), 15.65 (0.00), 4.96 (0.00), 12.01 (0.00), 6.59 (0.00), 17.27 (0.00), 2.59 (0.03); mean: 6.99 |
| PBK | 219148_at | 4.04 (0.00), 4.81 (0.00), 0.14 (0.00), 0.40 (0.16), 2.52 (0.04), 4.23 (0.00), 9.03 (0.00), 0.92 (0.69), 5.38 (0.00), 2.76 (0.03), 7.56 (0.00), 2.05 (0.29); mean: 3.65 |
| PRKX | 204061_at | 0.67 (0.34), 0.69 (0.29), 5.56 (0.00), 3.28 (0.00), 1.39 (0.13), 4.50 (0.00), 5.59 (0.00), 11.54 (0.00), 5.24 (0.02), 1.62 (0.07), 6.23 (0.00), 0.66 (0.23); mean: 3.91 |
| SYK | 226068_at | 1.15 (0.77), 1.25 (0.68), 6.55 (0.00), 6.17 (0.00), 2.41 (0.02), 1.6 (0.19), 4.04 (0.01), 4.52 (0.01), 0.91 (0.86), 2.43 (0.01), 3.19 (0.05), 1.97 (0.12); mean: 3.02 |
| TTK | 204822_at | 7.22 (0.00), 8.01 (0.00), 0.24 (0.03), 1.06 (0.94), 4.87 (0.00), 8.68 (0.00), 11.88 (0.00), 1.74 (0.09), 3.61 (0.01), 3.46 (0.02), 12.12 (0.00), 1.68 (0.31); mean: 5.38 |
| Gene | Probe ID | Fold Induction (p-Value) |
|---|---|---|
| CCNB1 | 214710_s_at | 5.63 (0.00), 8.42 (0.00), 0.13 (0.00), 0.35 (0.1), 2.2 (0.05), 4.18 (0.00), 7.91 (0.00), 0.94 (0.88), 4.86 (0.01), 1.82 (0.14), 7.63 (0.00), 1.83 (0.38); mean: 3.83 |
| 228729_at | 4.94 (0.00), 6.22 (0.00), 0.20 (0.01), 0.51 (0.26), 3.18 (0.01), 5.16 (0.00), 10.37 (0.00), 2.06 (0.07), 14.81 (0.00), 3.15 (0.01), 12.16 (0.00), 1.28 (0.68); mean: 5.34 | |
| CCNB2 | 202705_at | 11.87 (0.00), 10.79 (0.00), 0.43 (0.09), 0.94 (0.92), 4.85 (0.00), 5.69 (0.00), 8.34 (0.00), 1.96 (0.04), 5.65 (0.01), 3.60 (0.00), 8.33 (0.00), 1.89 (0.25); mean: 5.36 |
| CCND1 | 208712_at | 0.59 (0.19), 0.61 (0.25), 0.87 (0.67), 0.89 (0.80), 2.32 (0.06), 3.17 (0.00), 4.92 (0.00), 10.58 (0.00), 2.22 (0.2), 3.84 (0.00), 3.85 (0.02), 2.77 (0.13); mean: 3.05 |
| CCNE1 | 213523_at | 18.67 (0.00), 13.54 (0.00), 0.48 (0.00), 1.17 (0.59), 4.82 (0.00), 5.74 (0.00), 4.66 (0.00), 1.32 (0.54), 10.03 (0.00), 4.71 (0.00), 3.63 (0.03), 1.83 (0.00); mean: 5.88 |
| CCNE2 | 205034_at | 6.57 (0.00), 6.15 (0.00), 0.16 (0.00), 0.27 (0.01), 2.8 (0.00), 3.53 (0.00), 6.03 (0.00), 0.95 (0.84), 4.41 (0.00), 1.63 (0.14), 6.7 (0.00), 1.24 (0.62); mean: 3.37 |
| Gene | Probe ID | Fold Induction (p-Value); Mean Fold Induction |
|---|---|---|
| ADGRG1 | 212070_at | 1.27 (0.31), 1.07 (0.84), 3.32 (0.16), 2.73 (0.26), 4.62 (0.00), 5.70 (0.00), 9.08 (0.00), 17.23 (0.00), 9.29 (0.00), 5.22 (0.00), 6.81 (0.00), 1.58 (0.43); mean: 5.66 |
| ADGRG2 | 206002_at | 1.16 (0.89), 1.66 (0.57), 16.73 (0.00), 7.60 (0.00), 0.57 (0.33), 1.59 (0.16), 4.64 (0.01), 16.58 (0.00), 0.25 (0.01), 1.22 (0.73), 4.05 (0.05), 1.14 (0.71); mean: 4.77 |
| CXCR4 | 217028_at | 0.80 (0.32), 0.73 (0.12), 18.04 (0.00), 42.93 (0.00), 4.31 (0.05), 3.26 (0.00), 9.41 (0.00), 6.32 (0.01), 7.45 (0.00), 5.28 (0.04), 8.52 (0.00), 7.53 (0.12); mean: 9.55 |
| GABBR1, UBD | 205890_s_at | 31.64 (0.00), 34.43 (0.00), 5.13 (0.00), 3.68 (0.00), 1.28 (0.63), 1.26 (0.45), 2.13 (0.19), 1.11 (0.87), 1.92 (0.4), 1.18 (0.74), 2.00 (0.32), 2.31 (0.06); mean: 7.34 |
| GPR39 | 229105_at | 1.00 (1.00), 1.21 (0.67), 0.26 (0.00), 0.20 (0.00), 2.44 (0.02), 3.19 (0.00), 4.06 (0.00), 13.10 (0.00), 3.36 (0.00), 3.52 (0.00), 3.88 (0.00), 1.40 (0.33); mean: 3.13 |
| LGR6 | 227819_at | 1.19 (0.84), 1.14 (0.88), 10.31 (0.00), 6.02 (0.00), 2.64 (0.01), 4.57 (0.00), 8.18 (0.00), 26.42 (0.00), 1.16 (0.68), 3.52 (0.00), 5.82 (0.00), 0.52 (0.27); mean: 5.96 |
| LPAR3 | 231192_at | 0.17 (0.00), 0.23 (0.02), 3.17 (0.00), 14.73 (0.00), 3.00 (0.11), 19.72 (0.00), 30.52 (0.00), 5.29 (0.01), 3.02 (0.04), 3.45 (0.04), 30.62 (0.00), 1.81 (0.28); mean: 9.64 |
| OXTR | 206825_at | 1.76 (0.39), 1.20 (0.79), 0.10 (0.00), 0.10 (0.00), 1.44 (0.20), 5.04 (0.00), 7.78 (0.00), 9.43 (0.00), 3.10 (0.01), 1.56 (0.08), 6.56 (0.00), 1.88 (0.17); mean: 3.33 |
| PTH2R | 206772_at | 7.23 (0.01), 6.84 (0.01), 1.47 (0.01), 4.74 (0.00), 4.02 (0.02), 8.28 (0.00), 9.94 (0.00), 1.36 (0.46), 1.94 (0.23), 3.76 (0.04), 13.39 (0.00), 1.43 (0.38); mean: 5.37 |
| GeneSymbol | Protein/RNA | CXCR4 | ADGRG1 | LPAR3 | PTH2R | LGR6 | GPR39 | ADGRG2 | OXTR | GABBR1 | GeneSymbol | Protein/RNA | CXCR4 | ADGRG1 | LPAR3 | PTH2R | LGR6 | GPR39 | ADGRG2 | OXTR | GABBR1 |
|---|---|---|---|---|---|---|---|---|---|---|---|---|---|---|---|---|---|---|---|---|---|
| Pituitary Gland | P | Oral Mucosa | P | 2 | 0 | 1 | 0 | 0 | 0 | ||||||||||||
| R | 20 | 6 | 0 | 0 | 11 | 0 | 1 | 0 | 33 | R | |||||||||||
| Hypothalamus | P | Esophagus | P | 2 | 0 | 1 | 1 | 0 | 0 | ||||||||||||
| R | 8 | 18 | 1 | 1 | 3 | 0 | 0 | 3 | 72 | R | 9 | 15 | 4 | 0 | 3 | 0 | 0 | 1 | 13 | ||
| Cerebral Cortex | P | 1 | 1 | 2 | 1 | 0 | 2 | Stomach | P | 2 | 1 | 1 | 0 | 0 | 0 | ||||||
| R | 3 | 21 | 2 | 2 | 0 | 0 | 0 | 1 | 88 | R | 14 | 14 | 0 | 0 | 0 | 2 | 2 | 0 | 17 | ||
| Hippocampus | P | 0 | 0 | 1 | 2 | 0 | 2 | Duodenum | P | 3 | 0 | 3 | 0 | 0 | 0 | ||||||
| R | 6 | 16 | 2 | 1 | 0 | 0 | 0 | 1 | 56 | R | |||||||||||
| Caudate | P | 0 | 0 | 0 | 3 | 0 | 1 | Small Intestine | P | 3 | 0 | 2 | 0 | 0 | 0 | ||||||
| R | 5 | 22 | 1 | 0 | 0 | 0 | 0 | 3 | 91 | R | 151 | 6 | 0 | 0 | 1 | 1 | 1 | 0 | 19 | ||
| Cerebellum | P | 0 | 0 | 0 | 1 | 0 | 2 | Colon | P | 3 | 1 | 3 | 0 | 0 | 0 | ||||||
| R | 1 | 6 | 0 | 0 | 3 | 0 | 0 | 1 | 111 | R | 11 | 6 | 0 | 0 | 1 | 1 | 0 | 0 | 26 | ||
| Thyroid Gland | P | 2 | 0 | 2 | 0 | 0 | 1 | Rectum | P | 3 | 0 | 2 | 0 | 0 | 0 | ||||||
| R | 19 | 48 | 0 | 0 | 4 | 0 | 1 | 0 | 28 | R | |||||||||||
| Parathyroid Gland | P | 3 | 0 | 2 | 0 | 0 | 1 | Kidney | P | 2 | 3 | 2 | 1 | 0 | 1 | ||||||
| R | R | 16 | 53 | 0 | 2 | 1 | 1 | 1 | 0 | 15 | |||||||||||
| Adrenal Gland | P | 2 | 0 | 1 | 1 | 0 | 1 | Urinary Bladder | P | 2 | 0 | 2 | 0 | 0 | 1 | ||||||
| R | 45 | 4 | 1 | 0 | 0 | 0 | 0 | 0 | 16 | R | 18 | 14 | 3 | 0 | 2 | 2 | 1 | 0 | 27 | ||
| Appendix | P | 2 | 0 | 3 | 0 | 0 | 0 | Testis | P | 2 | 0 | 2 | 0 | 0 | 1 | ||||||
| R | R | 3 | 23 | 7 | 0 | 7 | 2 | 1 | 0 | 11 | |||||||||||
| Bone Marrow | P | 3 | 0 | 1 | 1 | 0 | 0 | Prostate | P | 2 | 0 | 2 | 1 | 0 | 0 | ||||||
| R | R | 16 | 14 | 7 | 0 | 4 | 0 | 3 | 1 | 41 | |||||||||||
| Lymph Node | P | 2 | 0 | 0 | 1 | 0 | 0 | Epididymis | P | 2 | 0 | 1 | 0 | 2 | 1 | ||||||
| R | R | ||||||||||||||||||||
| Tonsil | P | 2 | 0 | 2 | 1 | 0 | 0 | Seminal Vesicle | P | 2 | 0 | 2 | 0 | 0 | 1 | ||||||
| R | R | ||||||||||||||||||||
| Spleen | P | 0 | 0 | 0 | 0 | 0 | 0 | Fallopian Tube | P | 2 | 0 | 1 | 0 | 0 | 1 | ||||||
| R | 214 | 3 | 0 | 0 | 5 | 0 | 1 | 0 | 42 | R | 19 | 9 | 2 | 0 | 4 | 0 | 5 | 0 | 45 | ||
| Heart Muscle | P | 1 | 0 | 2 | 1 | 0 | 1 | Breast | P | 1 | 0 | 3 | 1 | 0 | 1 | ||||||
| R | 5 | 4 | 4 | 0 | 3 | 0 | 0 | 0 | 13 | R | 18 | 17 | 0 | 0 | 4 | 0 | 2 | 15 | 26 | ||
| Skeletal Muscle | P | 1 | 1 | 2 | 0 | 0 | 1 | Vagina | P | 1 | 0 | 0 | 0 | 0 | 0 | ||||||
| R | 1 | 2 | 0 | 0 | 0 | 0 | 0 | 0 | 3 | R | 16 | 14 | 4 | 0 | 3 | 0 | 1 | 0 | 37 | ||
| Smooth Muscle | P | 1 | 0 | 0 | 0 | 0 | 1 | Cervix, Uterine | P | 2 | 0 | 1 | 1 | 0 | 1 | ||||||
| R | R | 11 | 10 | 2 | 0 | 3 | 0 | 1 | 0 | 45 | |||||||||||
| Lung | P | 1 | 0 | 2 | 1 | 0 | 1 | Endometrium | P | 1 | 0 | 2 | 1 | 0 | 1 | ||||||
| R | 57 | 13 | 1 | 0 | 2 | 1 | 1 | 0 | 23 | R | 8 | 7 | 0 | 0 | 1 | 0 | 0 | 3 | 47 | ||
| Nasopharynx | P | 2 | 0 | 2 | 0 | 1 | Ovary | P | 1 | 0 | 1 | 0 | 0 | 0 | |||||||
| R | R | 5 | 2 | 1 | 0 | 1 | 0 | 0 | 1 | 49 | |||||||||||
| Bronchus | P | 3 | 0 | 2 | 0 | 0 | 1 | Placenta | P | 2 | 0 | 2 | 1 | 0 | 1 | ||||||
| R | R | ||||||||||||||||||||
| Liver | P | 2 | 0 | 2 | 0 | 0 | 0 | Soft Tissue | P | 1 | 0 | 0 | 1 | 0 | 1 | ||||||
| R | 6 | 1 | 0 | 0 | 1 | 1 | 0 | 0 | 3 | R | |||||||||||
| Gall Bladder | P | 2 | 0 | 3 | 0 | 0 | 0 | Adipose Tissue | P | ||||||||||||
| R | R | 21 | 13 | 0 | 0 | 1 | 0 | 2 | 0 | 20 | |||||||||||
| Pancreas | P | 2 | 3 | 2 | 0 | 0 | 0 | Skin | P | 2 | 0 | 2 | 1 | 0 | 1 | ||||||
| R | 3 | 11 | 3 | 0 | 0 | 1 | 0 | 0 | 6 | R | 5 | 27 | 3 | 0 | 3 | 0 | 0 | 0 | 17 | ||
| Salivary Gland | P | 2 | 0 | 2 | 0 | 0 | 0 | Sum RNA | 748 | 442 | 51 | 7 | 72 | 12 | 26 | 30 | 1057 | ||||
| R | 14 | 23 | 3 | 1 | 1 | 0 | 2 | 0 | 17 | Sum Protein | n/a | 78 | n/a | 10 | 70 | 23 | 2 | n/a | 31 |
© 2019 by the authors. Licensee MDPI, Basel, Switzerland. This article is an open access article distributed under the terms and conditions of the Creative Commons Attribution (CC BY) license (http://creativecommons.org/licenses/by/4.0/).
Share and Cite
Albrecht, H.; Kübler, E. Systematic Meta-Analysis Identifies Co-Expressed Kinases and GPCRs in Ovarian Cancer Tissues Revealing a Potential for Targeted Kinase Inhibitor Delivery. Pharmaceutics 2019, 11, 454. https://doi.org/10.3390/pharmaceutics11090454
Albrecht H, Kübler E. Systematic Meta-Analysis Identifies Co-Expressed Kinases and GPCRs in Ovarian Cancer Tissues Revealing a Potential for Targeted Kinase Inhibitor Delivery. Pharmaceutics. 2019; 11(9):454. https://doi.org/10.3390/pharmaceutics11090454
Chicago/Turabian StyleAlbrecht, Hugo, and Eric Kübler. 2019. "Systematic Meta-Analysis Identifies Co-Expressed Kinases and GPCRs in Ovarian Cancer Tissues Revealing a Potential for Targeted Kinase Inhibitor Delivery" Pharmaceutics 11, no. 9: 454. https://doi.org/10.3390/pharmaceutics11090454