Co-Crystal Formation of Antibiotic Nitrofurantoin Drug and Melamine Co-Former Based on a Vibrational Spectroscopic Study


Abstract
:
1. Introduction
2. Materials and Methods
2.1. Chemicals and Sample Preparation
2.2. THz and Raman Spectroscopic Characterization
2.3. Theorectical Calculations
3. Results and Discussion
3.1. THz Spectral Characterization and Analysis of NF, MELA and Hydrated Co-Crystal
3.2. Raman Spectral Characterization and Analysis of NF, MELA, Physical Mixture and Hydrated Co-Crystal
4. Conclusions
Author Contributions
Funding
Conflicts of Interest
References
- Watari, N.; Funaki, T.; Aizawa, K.; Kaneniwa, N. Nonlinear assessment of nitrofurantoin bioavailability in rabbits. J. Pharm. Biopharm. 1983, 11, 529–545. [Google Scholar] [CrossRef]
- Marshall, V.P.; York, P. Crystallization solvent induced solid-state and particulate modifications of nitrofurantoin. Int. J. Pharm. 1989, 55, 257–263. [Google Scholar] [CrossRef]
- Kasim, N.A.; Whitehouse, M.; Ramachandran, C.; Bermejo, M.; Lennernäs, H.; Hussain, A.S.; Junginger, H.E.; Stavchansky, S.A.; Midha, K.K.; Shah, V.P.; et al. Molecular properties of WHO essential drugs and provisional biopharmaceutical classification. Mol. Pharm. 2004, 1, 85–96. [Google Scholar] [CrossRef] [PubMed]
- Otsuka, M.; Teraoka, R.; Matsuda, Y. Rotating-disk dissolution kinetics of nitrofurantoin anhydrate and monohydrate at various temperatures. Pharm. Res. 1992, 9, 307–311. [Google Scholar] [CrossRef]
- Otsuka, M.; Teraoka, R.; Matsuda, Y. Physicochemical properties of nitrofurantoin anhydrate and monohydrate and their dissolution. Chem. Pharm. Bull. 1991, 39, 1667–1670. [Google Scholar] [CrossRef]
- Edhlund, B.L.; Arnold, W.A.; Mcneill, K. Aquatic photochemistry of nitrofuran antibiotics. Environ. Sci. Technol. 2006, 40, 5422–5427. [Google Scholar] [CrossRef] [PubMed]
- Chamberlain, R.E. Chemotherapeutic properties of prominent nitrofurans. J. Antimicrob. Chemother. 1976, 2, 325–336. [Google Scholar] [CrossRef]
- Muth, P.; Metz, R.; Siems, B.; Bolten, W.W.; Vergin, H. Sensitive determination of nitrofurantoin in human plasma and urine by high-performance liquid chromatography. J. Chromatogr. A 1996, 729, 251–258. [Google Scholar] [CrossRef]
- Ertan, G.; Karasulu, Y.; Guneri, T. Degradation and gastrointestinal stability of nitrofurantoin in acidic and alkaline media. Int. J. Pharm. 1993, 96, 243–248. [Google Scholar] [CrossRef]
- Bak, A.; Gore, A.; Yanez, E.; Stanton, M.; Tufekcic, S.; Syed, R.; Akrami, A.; Rose, M.; Surapaneni, S.; Bostick, T.; et al. The co-crystal approach to improve the exposure of a water-insoluble compound: AMG 517 sorbic acid co-crystal characterization and pharmacokinetics. J. Pharm. Sci. 2008, 97, 3942–3956. [Google Scholar] [CrossRef]
- Caira, M.R. Sulfa drugs as model cocrystal formers. Mol. Pharm. 2007, 4, 310–316. [Google Scholar] [CrossRef] [PubMed]
- Basavoju, S.; Bostrom, D.; Velaga, S.P. Indomethacin-saccharin cocrystal: Design, synthesis and preliminar pharmaceutical characterization. Pharm. Res. 2008, 25, 530–541. [Google Scholar] [CrossRef] [PubMed]
- Childs, S.L.; Stahly, G.P.; Park, A. The salt-cocrystal continuum: The influence of crystal structure on ionization state. Mol. Pharm. 2007, 4, 323–338. [Google Scholar] [CrossRef]
- Bond, A.D. What is a co-crystal? CrystEngComm 2007, 9, 833–834. [Google Scholar] [CrossRef]
- Schultheiss, N.; Newman, N. Pharmaceutical cocrystal and their physicochemical properties. Cryst. Growth Des. 2009, 9, 2950–2967. [Google Scholar] [CrossRef] [PubMed]
- McNamara, D.P.; Childs, S.L.; Giordano, J.; Iarriccio, A.; Cassidy, J.; Shet, M.S.; Mannion, R.; O’donnell, E.; Park, A. Use of glutaric acid cocrystal to improve oral bioavailability of a low solubility API. Pharm. Res. 2006, 23, 1888–1897. [Google Scholar] [CrossRef] [PubMed]
- Jones, W.; Motherwell, W.D.S.; Trask, A.V. Pharmaceutical cocrystals: An emerging approach to physical property enhancement. MRS Bull. 2006, 31, 875–879. [Google Scholar] [CrossRef]
- Fischer, B.M.; Jones, W. Benefits of cocrystallisation in pharmaceutical materials science: An update. J. Pharm. Pharmacol. 2010, 62, 1547–1559. [Google Scholar]
- Babu, N.J.; Nangia, A. Solubility advantage of amorphous drugs and pharmaceutical cocrystals. Cryst. Growth Des. 2011, 11, 2662–2679. [Google Scholar] [CrossRef]
- Suryanarayan, C.; Jagadeesh, B.N.; Ashwini, N. Nitrofurantoin-p-aminobenzoic acid cocrystal: Hydration stability and dissolution rate studies. J. Pharm. Sci. 2011, 100, 3233. [Google Scholar]
- Vangala, V.R.; Chow, P.S.; Tan, R.B.H. Co-crystals and co-crystal hydrates of the antibiotic nitrofurantoin: Structural studies and physicochemical properties. Cryst. Growth Des. 2012, 12, 5925–5938. [Google Scholar] [CrossRef]
- Du, Y.; Cai, Q.; Xue, J.; Zhang, Q. Raman and terahertz spectroscopic investigation of cocrystal formation involving antibiotic nitrofurantoin drug and coformer 4-aminobenzoic acid. Crystals 2016, 6, 164. [Google Scholar] [CrossRef]
- Brittain, H.G. Vibrational spectroscopic studies of cocyrstal and salts 1: Benzamide-benzoic acid system. Cryst. Growth Des. 2009, 9, 2492–2499. [Google Scholar] [CrossRef]
- Du, Y.; Fang, H.X.; Zhang, Q.; Zhang, H.L.; Hong, Z. Spectroscopic investigation on cocrystal formation between adenine and fumaric acid based on infrared and Raman techniques. Spectrochim. Acta Part A Mol. Biomol. Spectrosc. 2016, 153, 580–585. [Google Scholar] [CrossRef] [PubMed]
- Du, Y.; Cai, Q.; Xue, J.; Zhang, Q.; Qin, D. Structural investigation of the cocrystal formed between 5-fluorocytosine and fumaric acid based on vibrational spectroscopic technique. Spectrochim. Acta Part A Mol. Biomol. Spectrosc. 2017, 178, 251–257. [Google Scholar] [CrossRef] [PubMed]
- Yang, J.; Li, S.; Zhao, H.; Song, B.; Zhang, G.; Zhang, J.; Zhu, Y.; Han, J. Molecular recognition and interaction between uracil and urea in solid-state studied by terahertz time-domain spectroscopy. J. Phys. Chem. A 2014, 118, 10927–10933. [Google Scholar] [CrossRef] [PubMed]
- Becke, A.D. Density-functional thermochemistry. III. The role of exact exchange. J. Chem. Phys. 1993, 98, 5648–5652. [Google Scholar] [CrossRef]
- Anthony, P.; Scott Leo, R. Harmonic vibrational frequencies: An evaluation of Hartree−Fock, Møller−Plesset, quadratic configuration interaction, density functional theory, and semiempirical scale factors. J. Chem. Phys. 1996, 100, 16502–16513. [Google Scholar]
- Lee, C.; Yang, W.; Parr, R.G. Development of the Colle-Salvetti correlation-energy formula into a functional of the electron density. Phys. Rev. B 1988, 37, 785–789. [Google Scholar] [CrossRef]
- Janoschek, R. Quantum chemical B3LYP/cc-pvqz computation of ground-state structures and properties of small molecules with atoms of Z ≤ 18 (hydrogen to argon) (IUPAC Technical Report). Pure Appl. Chem. 2001, 73, 1521–1553. [Google Scholar] [CrossRef]
- Frisch, M.J.; Trucks, G.W.; Schlegel, H.B.; Scuseria, G.E.; Robb, M.A.; Cheeseman, J.R.; Montgomery, J.A.; Vreven, T.; Kudin, K.N.; Burant, J.C.; et al. Gaussian 03; Revision E.01; Gaussian, Inc.: Wallingford, CT, USA, 2004. [Google Scholar]
- Siegrist, K.; Bucher, C.R.; Mandelbaum, I.; Hight Walker, A.R.; Balu, R.; Gregurick, S.K.; Plusquellic, D.F. High-resolution terahertz spectroscopy of crystalline trialanine: Extreme sensitivity to beta-sheet structure and cocrystallized water. J. Am. Chem. Soc. 2006, 128, 5764–5775. [Google Scholar] [CrossRef] [PubMed]
- King, M.D.; Korter, T.M. Noncovalent interactions between modified cytosine and guanine DNA base pair mimics investigated by terahertz spectroscopy and solid-state density functional theory. J. Phys. Chem. A 2011, 115, 14391–14396. [Google Scholar] [CrossRef] [PubMed]
- Fischer, B.M.; Walther, M.; Jepsen, P.U. Far-infrared vibrational modes of DNA components studies by terahertz time-domain spectroscopy. Phys. Med. Biol. 2002, 47, 3807–3814. [Google Scholar] [CrossRef]
- Shen, Y.C.; Upadhya, P.C.; Linfield, E.H. Temperature-dependent low-frequency vibrational spectra of purine and adenine. Appl. Phys. Lett. 2003, 82, 2350–2352. [Google Scholar] [CrossRef]


| Compound | Experimental Result (THz) | Theoretical Calculation (THz) | Vibrational Mode Assignment |
|---|---|---|---|
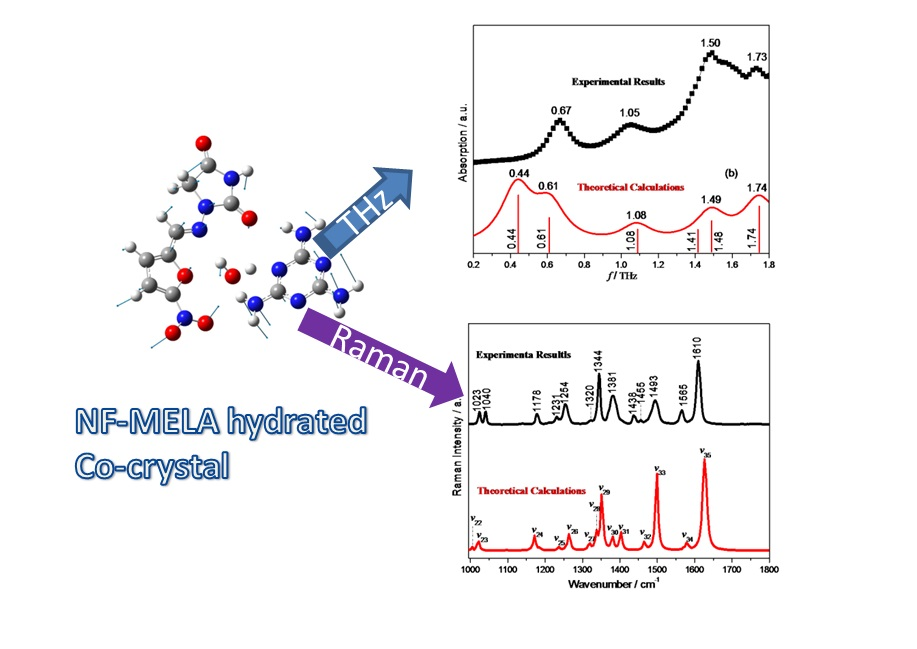
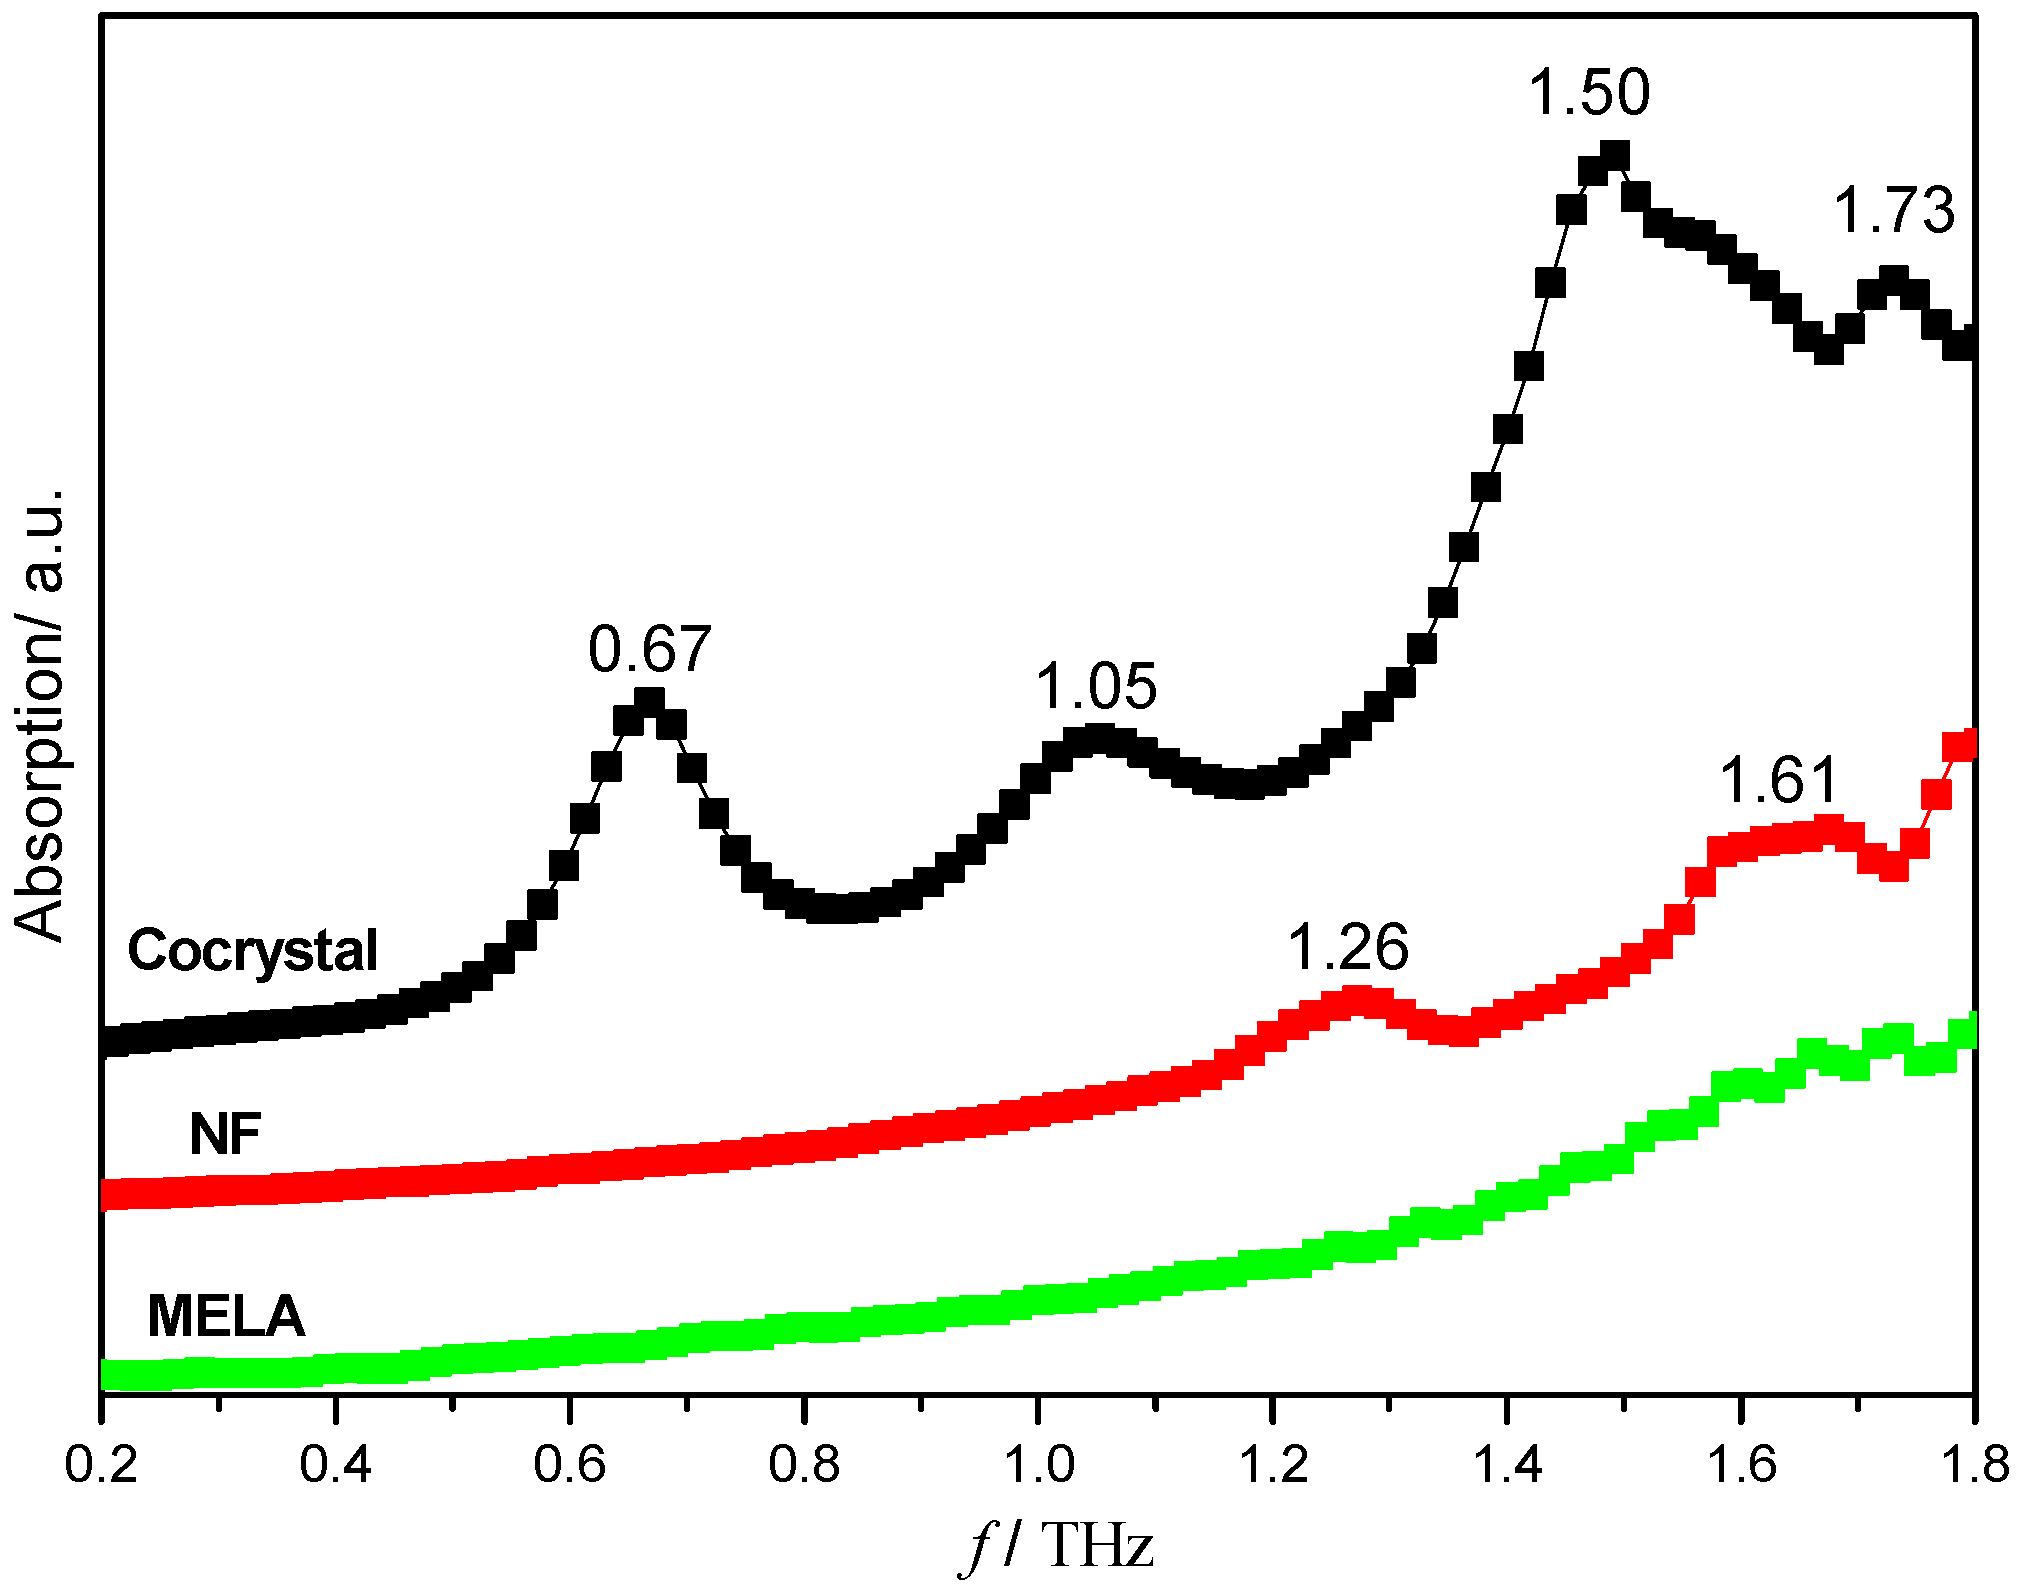
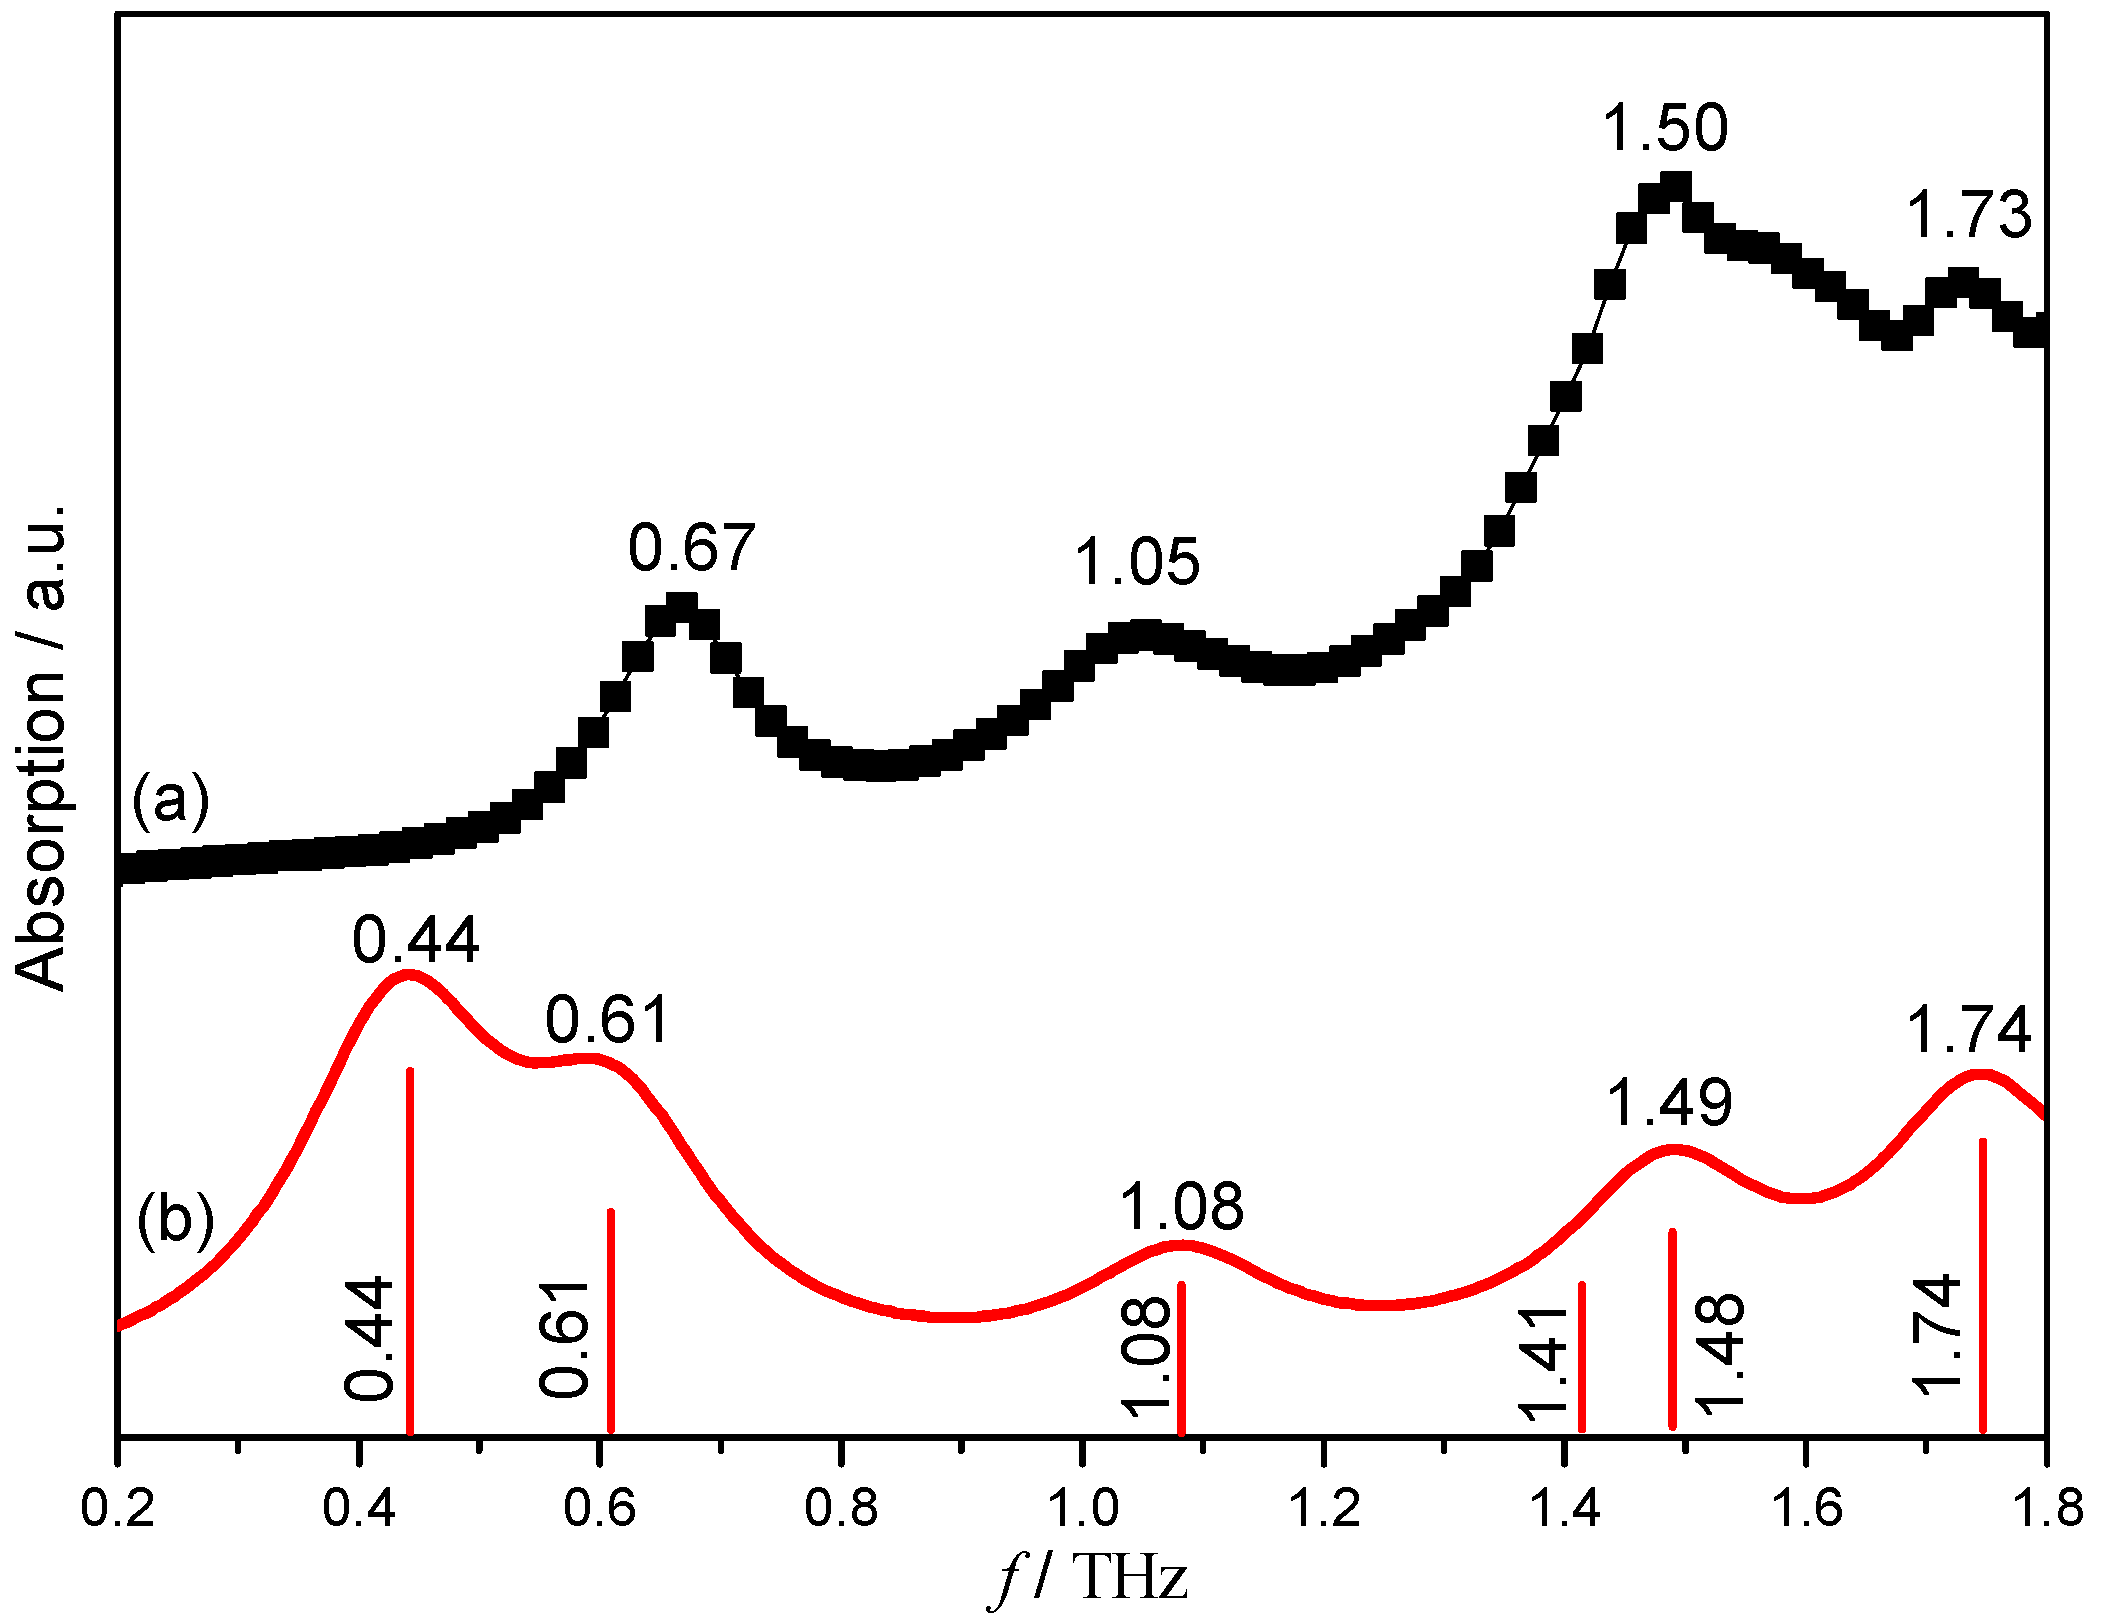
| NF–MELA-hydrated co-crystal | 0.67 | 0.44 | out-of-plane bending of NF and MELA; translation of H2O. |
| 0.61 | out-of-plane bending of MELA; torsion of NF; translation of H2O. | ||
| 1.08 | 1.05 | out-of-plane bending of NF and MELA; translation of H2O. | |
| 1.50 | 1.41 | out-of-plane bending of NF and MELA; translation of H2O. | |
| 1.49 | out-of-plane bending of NF and MELA; translation of H2O. | ||
| 1.73 | 1.74 | in-plane bending of NF; out-of-plane bending of MELA. |
| Mode | Theoretical/cm−1 | Experimental/cm−1 | Vibrational Mode Assignment |
|---|---|---|---|
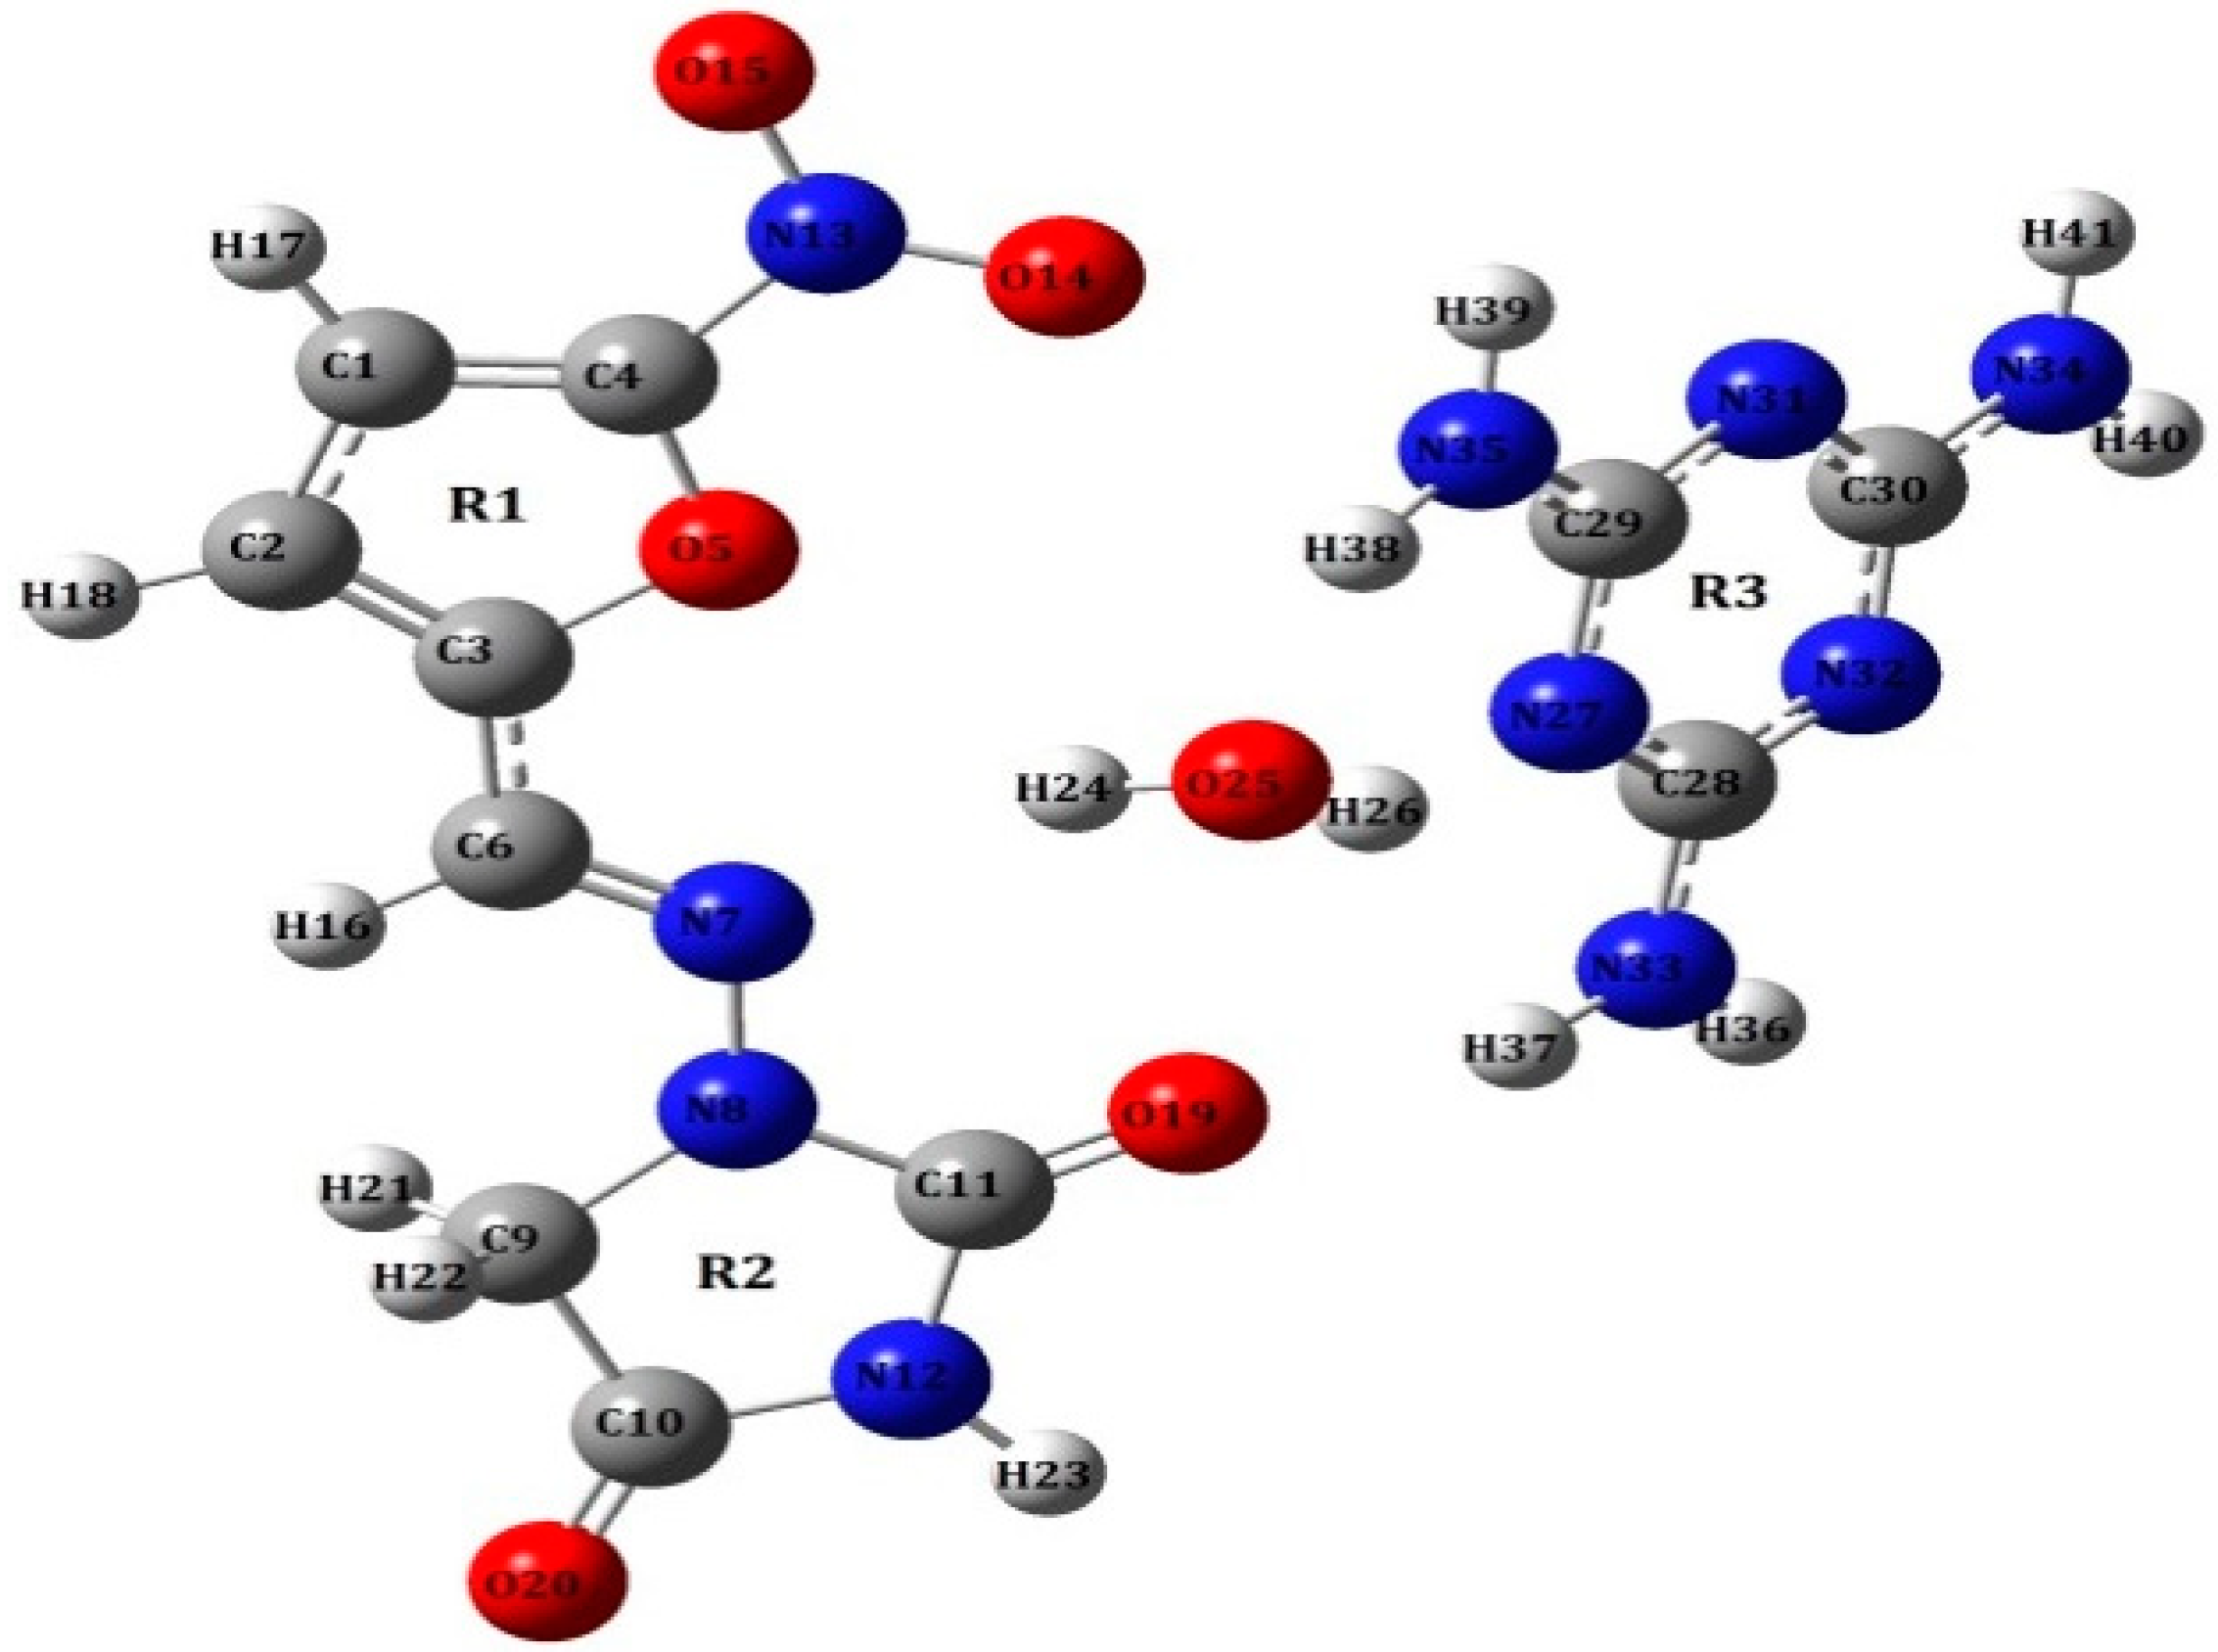
| ν1 | 219 | 227 | ρ(–NO2, R1) |
| ν2 | 294 | 305 | τ(H2O), ρ(R2), ω(N33H36H37) |
| ν3 | 345 | — | ρ(N33H36H37, N34H40H41, N35H38H39) |
| ν4 | 373 | 383 | Def R1, ω(C6H16), ρ(H2O, N33H36H37, N34H40H41, N35H38H39) |
| ν5 | 399 | 417 | ω(N34H40H41) |
| ν6 | 410 | ω(N35H38H39) | |
| ν7 | 450 | 470 | ω(O25H24, N33H36), Def R1 |
| ν8 | 495 | — | τ(N34H40H41) |
| ν9 | 541 | 549 | ρ(–NO2, R1, R2, C9H2122), ω(N12H23) |
| ν10 | 570 | 584 | Def R3 |
| ν11 | 585 | — | Def R2, R1 |
| ν12 | 597 | 624 | Def R2, ρ(C11O19, N12H23), ω(C9H21H22) |
| ν13 | 664 | 678 | Def R3, ω(O25H26) |
| ν14 | 725 | 740 | Def R1, ρ(–NO2), ω(N35H38, C1H17) |
| ν15 | 764 | 788 | Def R1, R2, ρ(C6H16, N12H23) |
| ν16 | 795 | 815 | δ(-NO2), Def R1 |
| ν17 | 864 | 882 | Def R1, R2, ρ(N12H23), ω(C9H21H22) |
| ν18 | 873 | 896 | ω(C1H17, C2H18, C6H16) |
| ν19 | 893 | 919 | ω(C6H16, C1H17, C2H18) |
| ν20 | 962 | 966 | Def R3, R1 |
| ν21 | 986 | 977 | Def R1, ρ(C1H17, C2H18, C6H16) |
| ν22 | 1008 | 1023 | Def R3, ω(O25H26), ρ(N33H36H37, N34H40H41, N35H38H39) |
| ν23 | 1020 | 1040 | ρ(C1H17, C2H18, C6H16) |
| ν24 | 1172 | 1178 | ρ(C1H17, C2H18, C6H16), Def R1 |
| ν25 | 1237 | 1231 | Def R1, ω(C9H21H22), θ(N7N8) |
| ν26 | 1265 | 1254 | Def R1, ρ(C1H17, C2H18, C6H16), θ(–NO2) |
| ν27 | 1318 | 1320 | ρ(N12H23, C6H16), ω(C9H21H22) |
| ν28 | 1338 | 1344 | ρ(N12H23, C1H17, C2H18, C6H16) |
| ν29 | 1352 | θ(–NO2), Def R1, R2, ρ(N12H23, C6H16), ω(C9H21H22) | |
| ν30 | 1380 | 1381 | θ(–NO2), Def R1, R2, ρ(N12H23, C6H16, C1H17, C2H18), ω(C9H21H22) |
| ν31 | 1403 | Def R1, ρ(C6H16, C1H17, C2H18) | |
| ν32 | 1466 | 1455 | ρ(C9H21H22) |
| ν33 | 1499 | 1493 | Def R1, R3, ρ(C1H17, C2H18), δ( N33H36H37, N34H40H41, N35H38H39) |
| ν34 | 1579 | 1565 | δ(N33H36H37, N34H40H41, N35H38H39), Def R1, R3, θ(–NO2) |
| ν35 | 1627 | 1610 | ω(C3C6N7), ρ(C6H16), δ(N33H36H37, N34H40H41, N35H38H39) |
© 2019 by the authors. Licensee MDPI, Basel, Switzerland. This article is an open access article distributed under the terms and conditions of the Creative Commons Attribution (CC BY) license (http://creativecommons.org/licenses/by/4.0/).
Share and Cite
Zhang, Z.; Cai, Q.; Xue, J.; Qin, J.; Liu, J.; Du, Y. Co-Crystal Formation of Antibiotic Nitrofurantoin Drug and Melamine Co-Former Based on a Vibrational Spectroscopic Study. Pharmaceutics 2019, 11, 56. https://doi.org/10.3390/pharmaceutics11020056
Zhang Z, Cai Q, Xue J, Qin J, Liu J, Du Y. Co-Crystal Formation of Antibiotic Nitrofurantoin Drug and Melamine Co-Former Based on a Vibrational Spectroscopic Study. Pharmaceutics. 2019; 11(2):56. https://doi.org/10.3390/pharmaceutics11020056
Chicago/Turabian StyleZhang, Ziming, Qiang Cai, Jiadan Xue, Jianyuan Qin, Jianjun Liu, and Yong Du. 2019. "Co-Crystal Formation of Antibiotic Nitrofurantoin Drug and Melamine Co-Former Based on a Vibrational Spectroscopic Study" Pharmaceutics 11, no. 2: 56. https://doi.org/10.3390/pharmaceutics11020056