
Virus Pop—Expanding Viral Databases by Protein Sequence Simulation
 , , , , , and
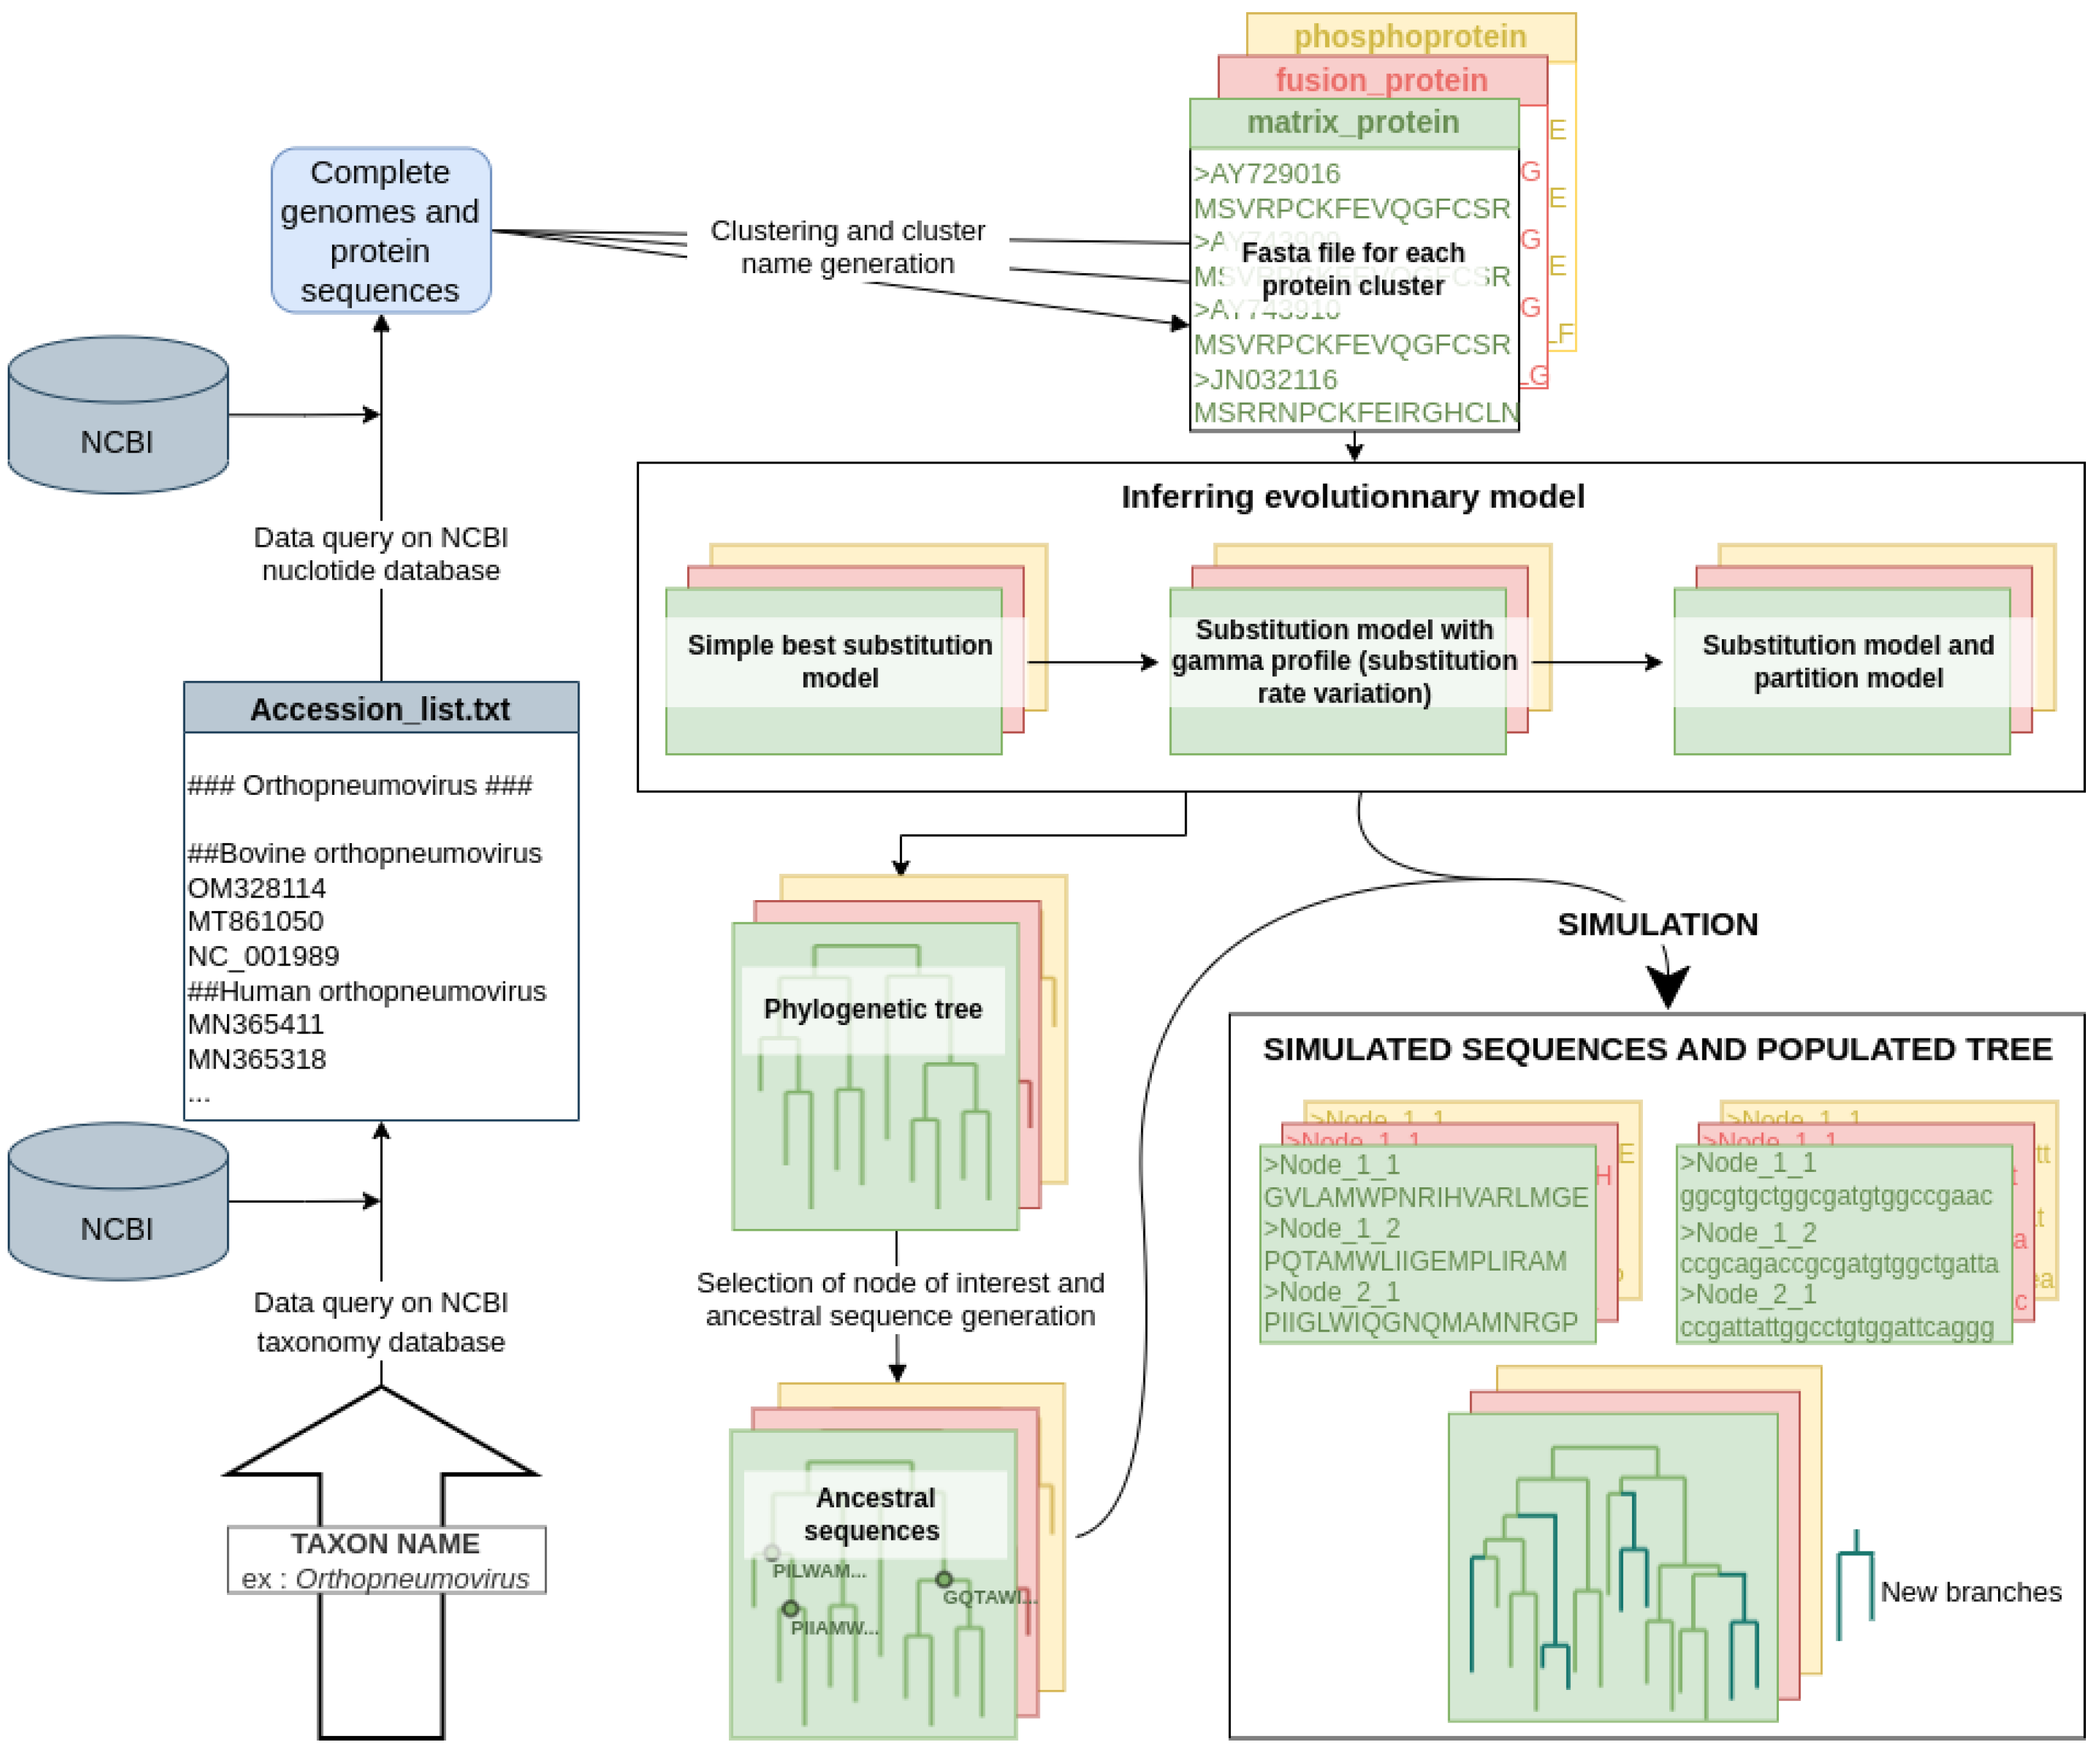
Abstract
:1. Introduction
2. Materials and Methods
2.1. The Virus Pop Pipeline
- Building the starting dataset. Many options are provided to offer convenient ways for the user to quickly build a dataset. At the end of this step, Virus Pop will have one or multiple fasta files, each representing a protein type and containing homologous sequences;
- Finding the best evolutionary model and phylogenetic tree for each set of homologous proteins;
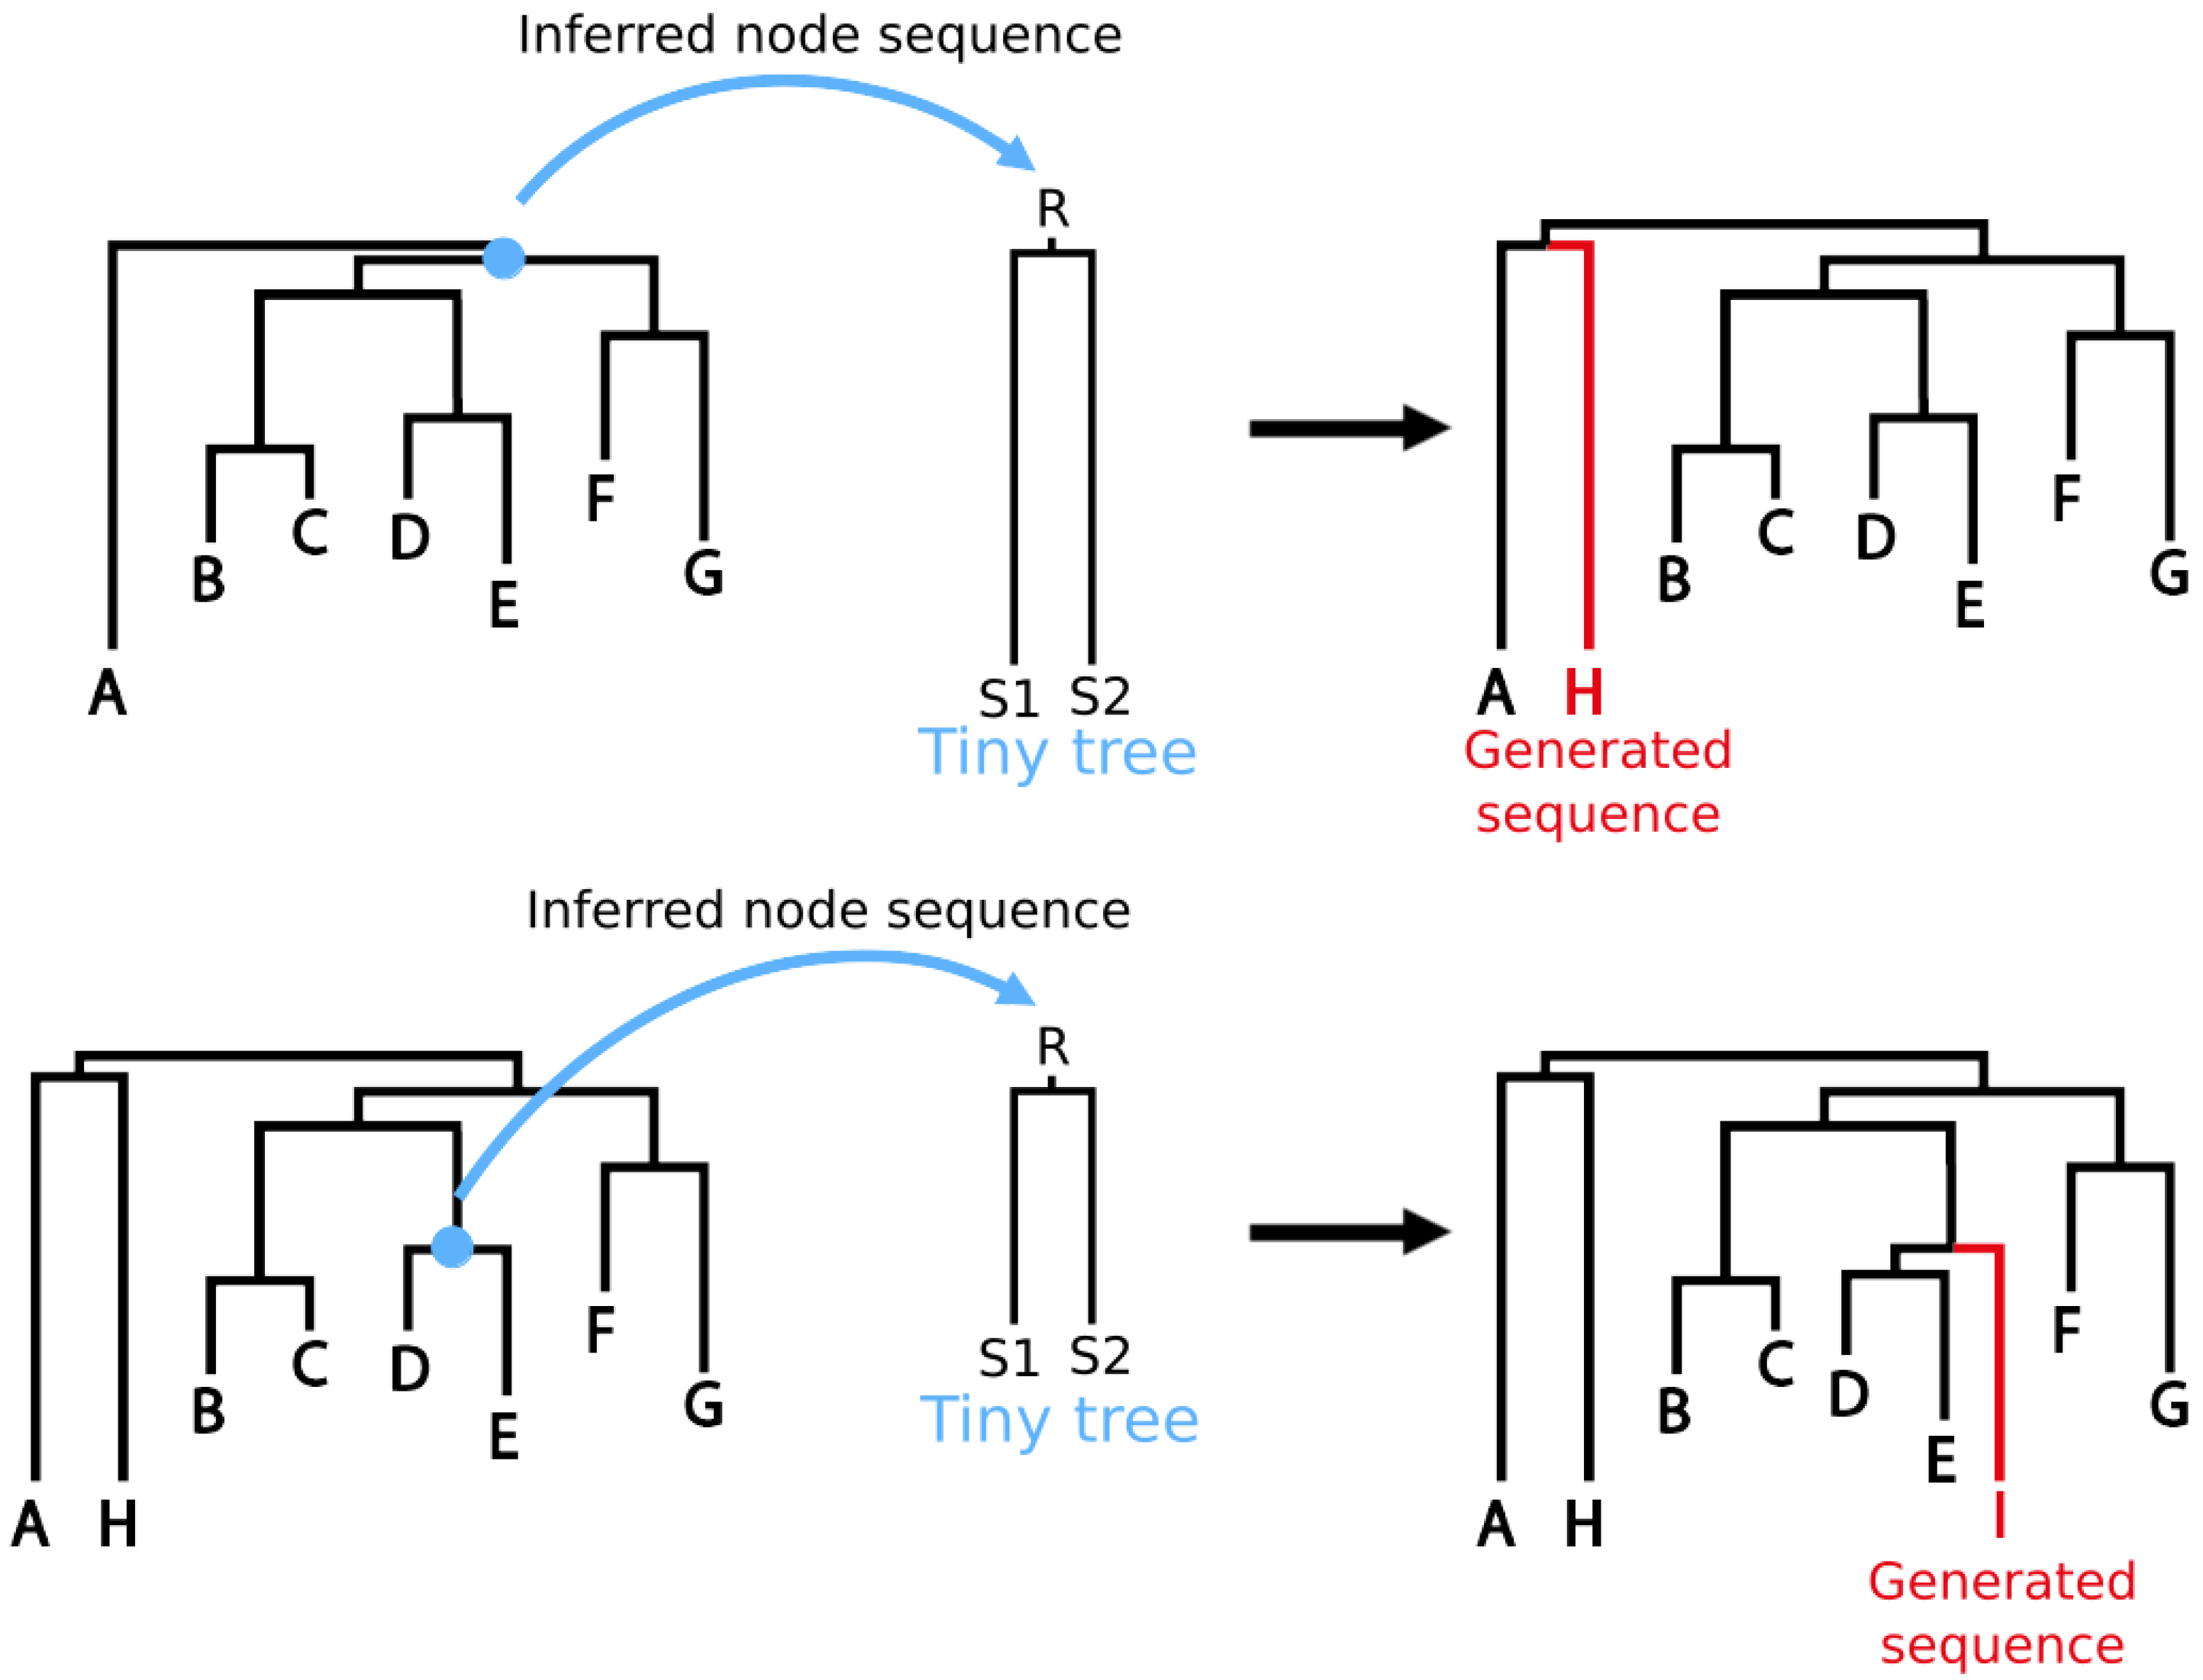
- Choosing nodes (automatically or manually) in the phylogenetic tree and reconstructing ancestral sequences at these node positions;
- Simulating the evolution of the reconstructed ancestral sequences (retro-translated nucleotide sequences are also provided).
2.1.1. Building the Starting Homologous Protein Dataset
- Parsing the NCBI taxonomy tree to extract all species belonging to the taxonomic group entered;
- Requesting, from NCBI, the number and identifier of available complete genomes in each species and selecting randomly a list of identifiers within each species;
- Fetching the selected genomes;
- Clustering proteins: running BLASTp [16], then extracting from the results clusters of homologous protein sequences with SILIX [17]. SILIX is run with the following parameters: 20% minimum identity and 60% minimum overlap; and BLAST is run with a cost of 1 and 9 to open and close gaps, respectively;
- Aligning the sequences in each cluster with MAFFT [18] (with default parameters);
- Generating a descriptive protein name for each cluster, based on word frequency in the protein annotations.
2.1.2. Finding the Best Evolutionary Model
- The Model Finder tool is used in basic mode (no rate variation and no invariant site), to find in a limited amount of time the substitution model best representing the alignment. Let M be the best model found.
- The Model Finder tool is used again, but constrained so that it will fit a 5-discretized gamma profile with the M model: . A 5-discretized gamma profile is an evolutionary model that differentiates five substitution rate categories. Each locus in the protein considered is associated to one category. This is outputted in the form of a file which indicates, for each locus, the mean substitution rate corresponding to the category to which it belongs. Although the optimal number of bins is dependent on the dataset, we used five as it yields good results in most cases [20].
- The mean substitution rate distribution is retrieved and turned into a partition description file. Originally, partition files were meant to define different segments along an alignment that will follow different substitution models. Here, we use this option but only the substitution rate varies. Tweaking with partition models is a way to simulate site-dependent substitution rates without fully implementing a new method.
- Using Model Finder one last time, constrained with the partition file, a phylogenetic tree is inferred with the ancestral sequence statistics. This consists of a file with, for each internal tree node and each site, the probabilistic amino acid distribution.
2.2. Choosing Internal Node of Interest and Building Ancestral Sequences
2.2.1. Evolutionary Distance, Simulation and Gaps
2.2.2. Retro-Translation
- for each site i with amino acid AA
- while no corresponding codon usage is found
- look for coding of in sites
- draw a codon amongst found codons
2.3. Datasets
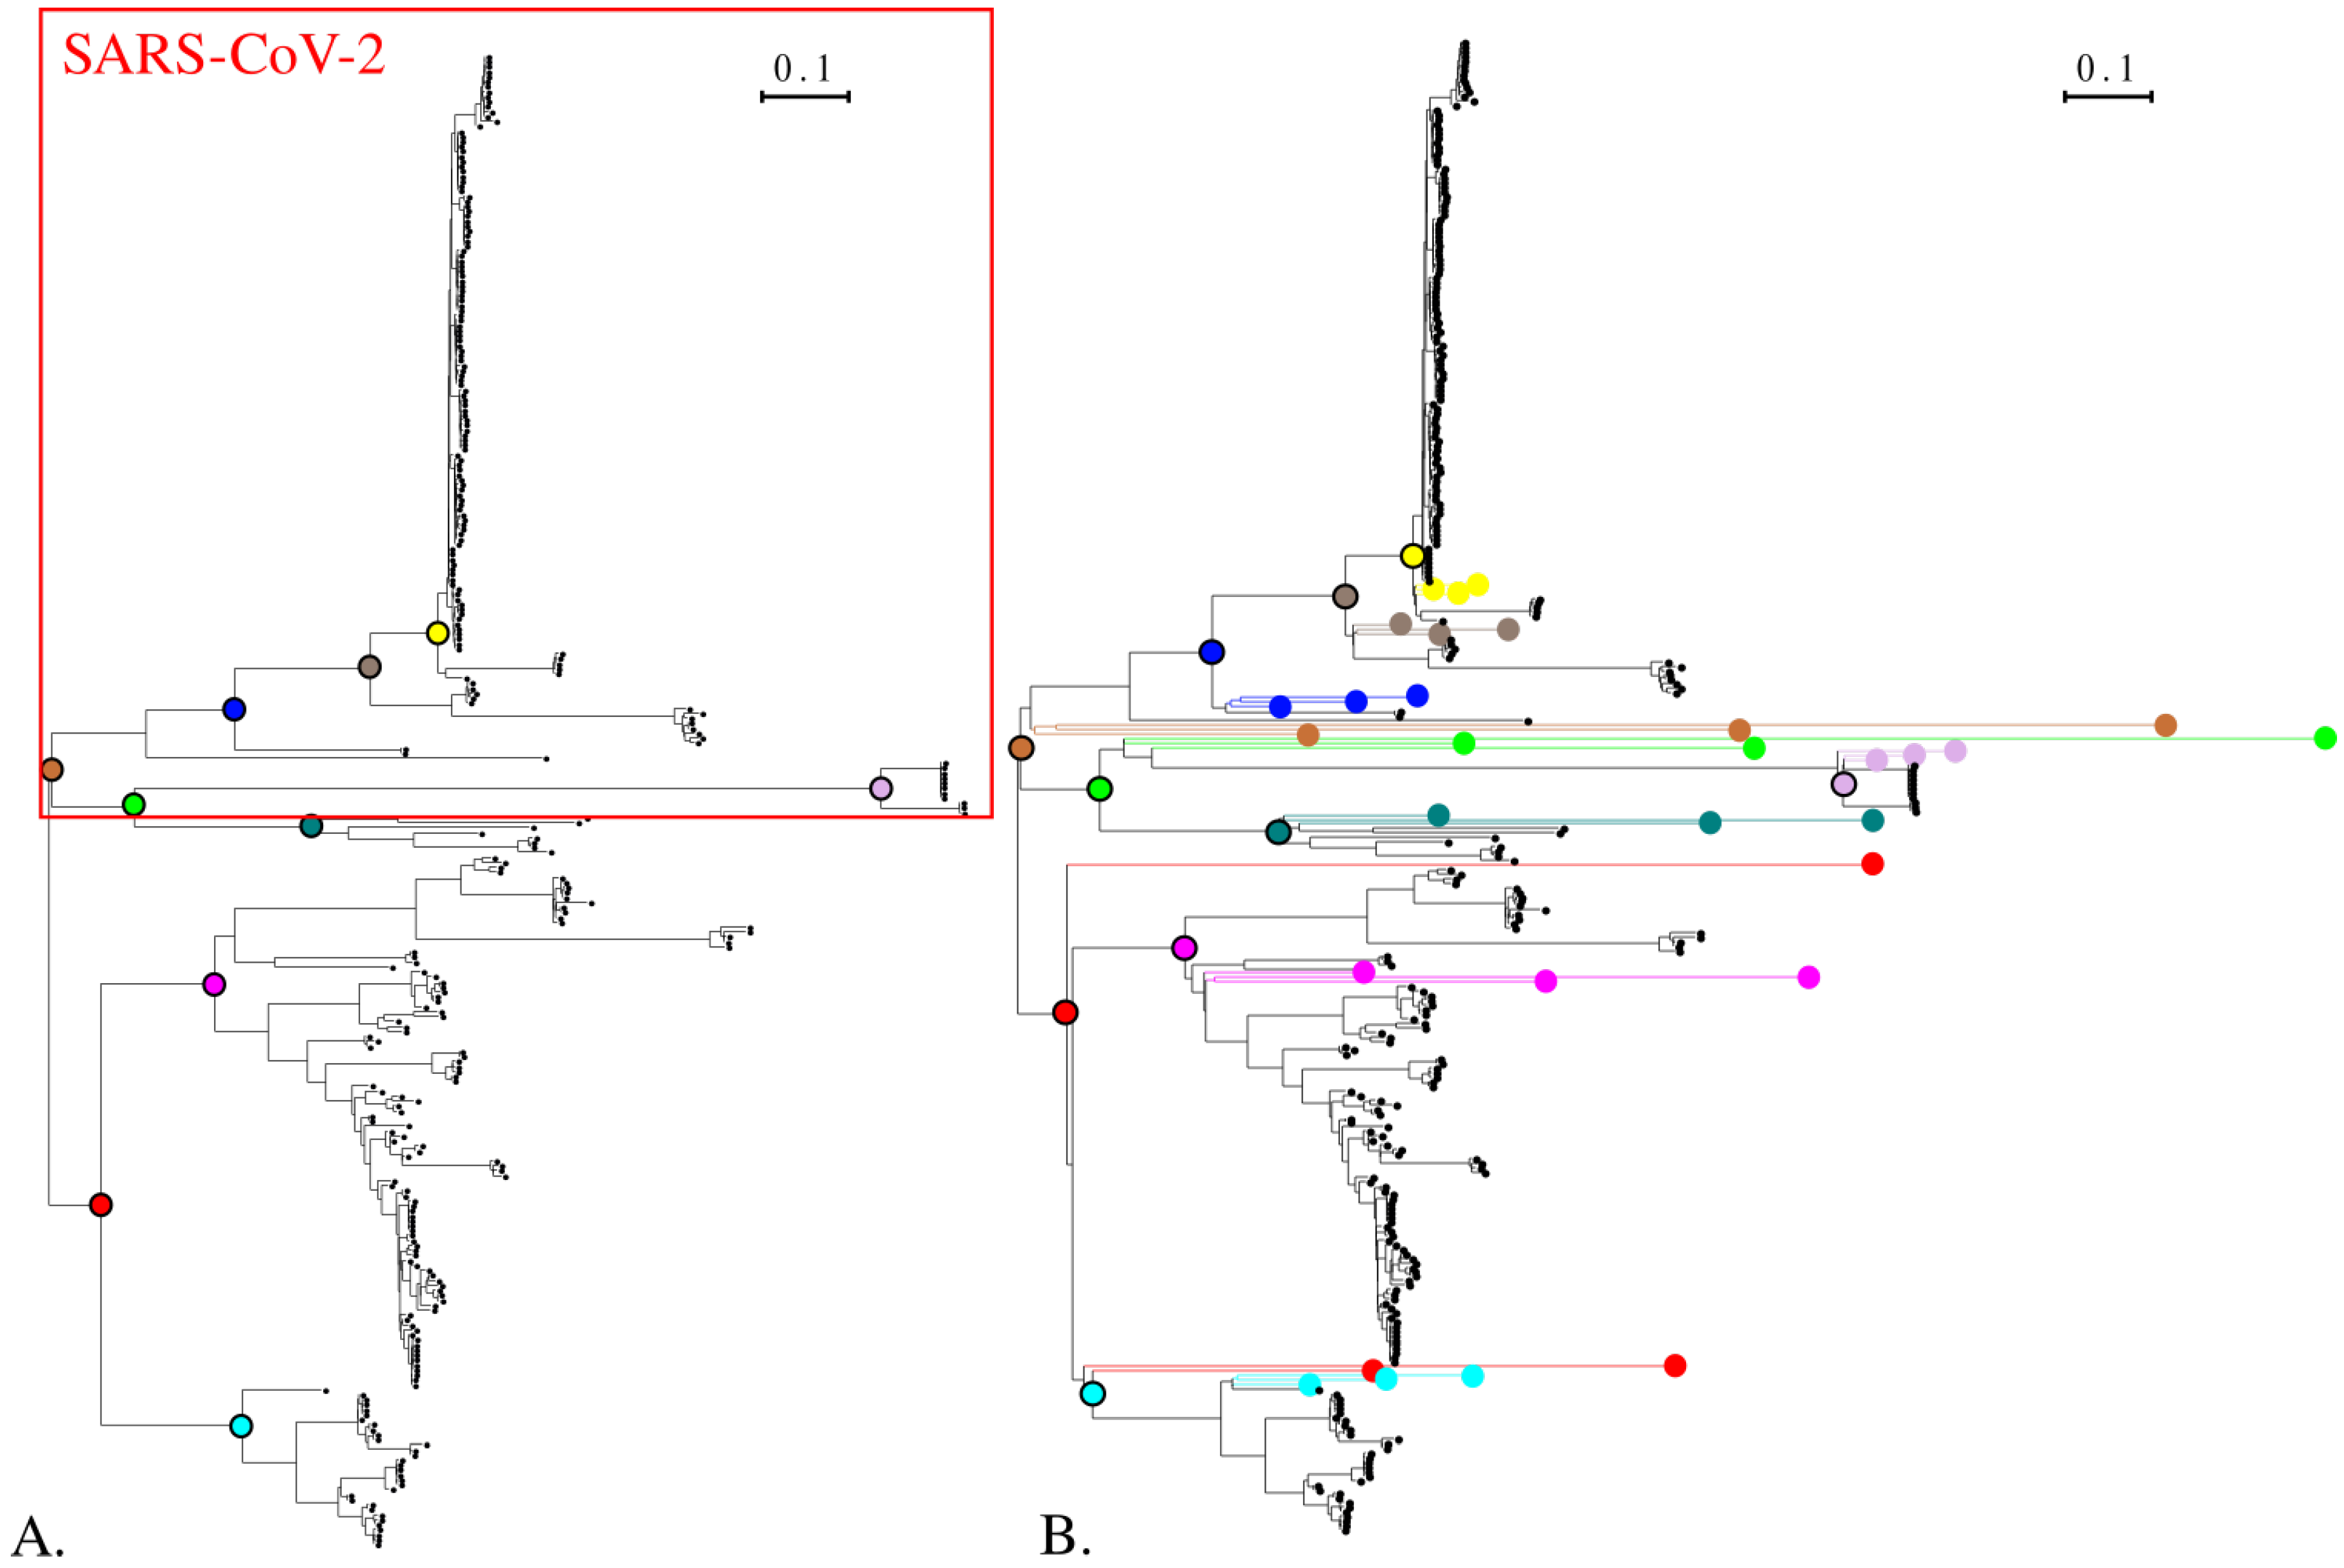
2.3.1. Sarbecovirus Spike Protein Dataset
2.3.2. The Circovirus Capsid Protein Dataset
2.4. Performances
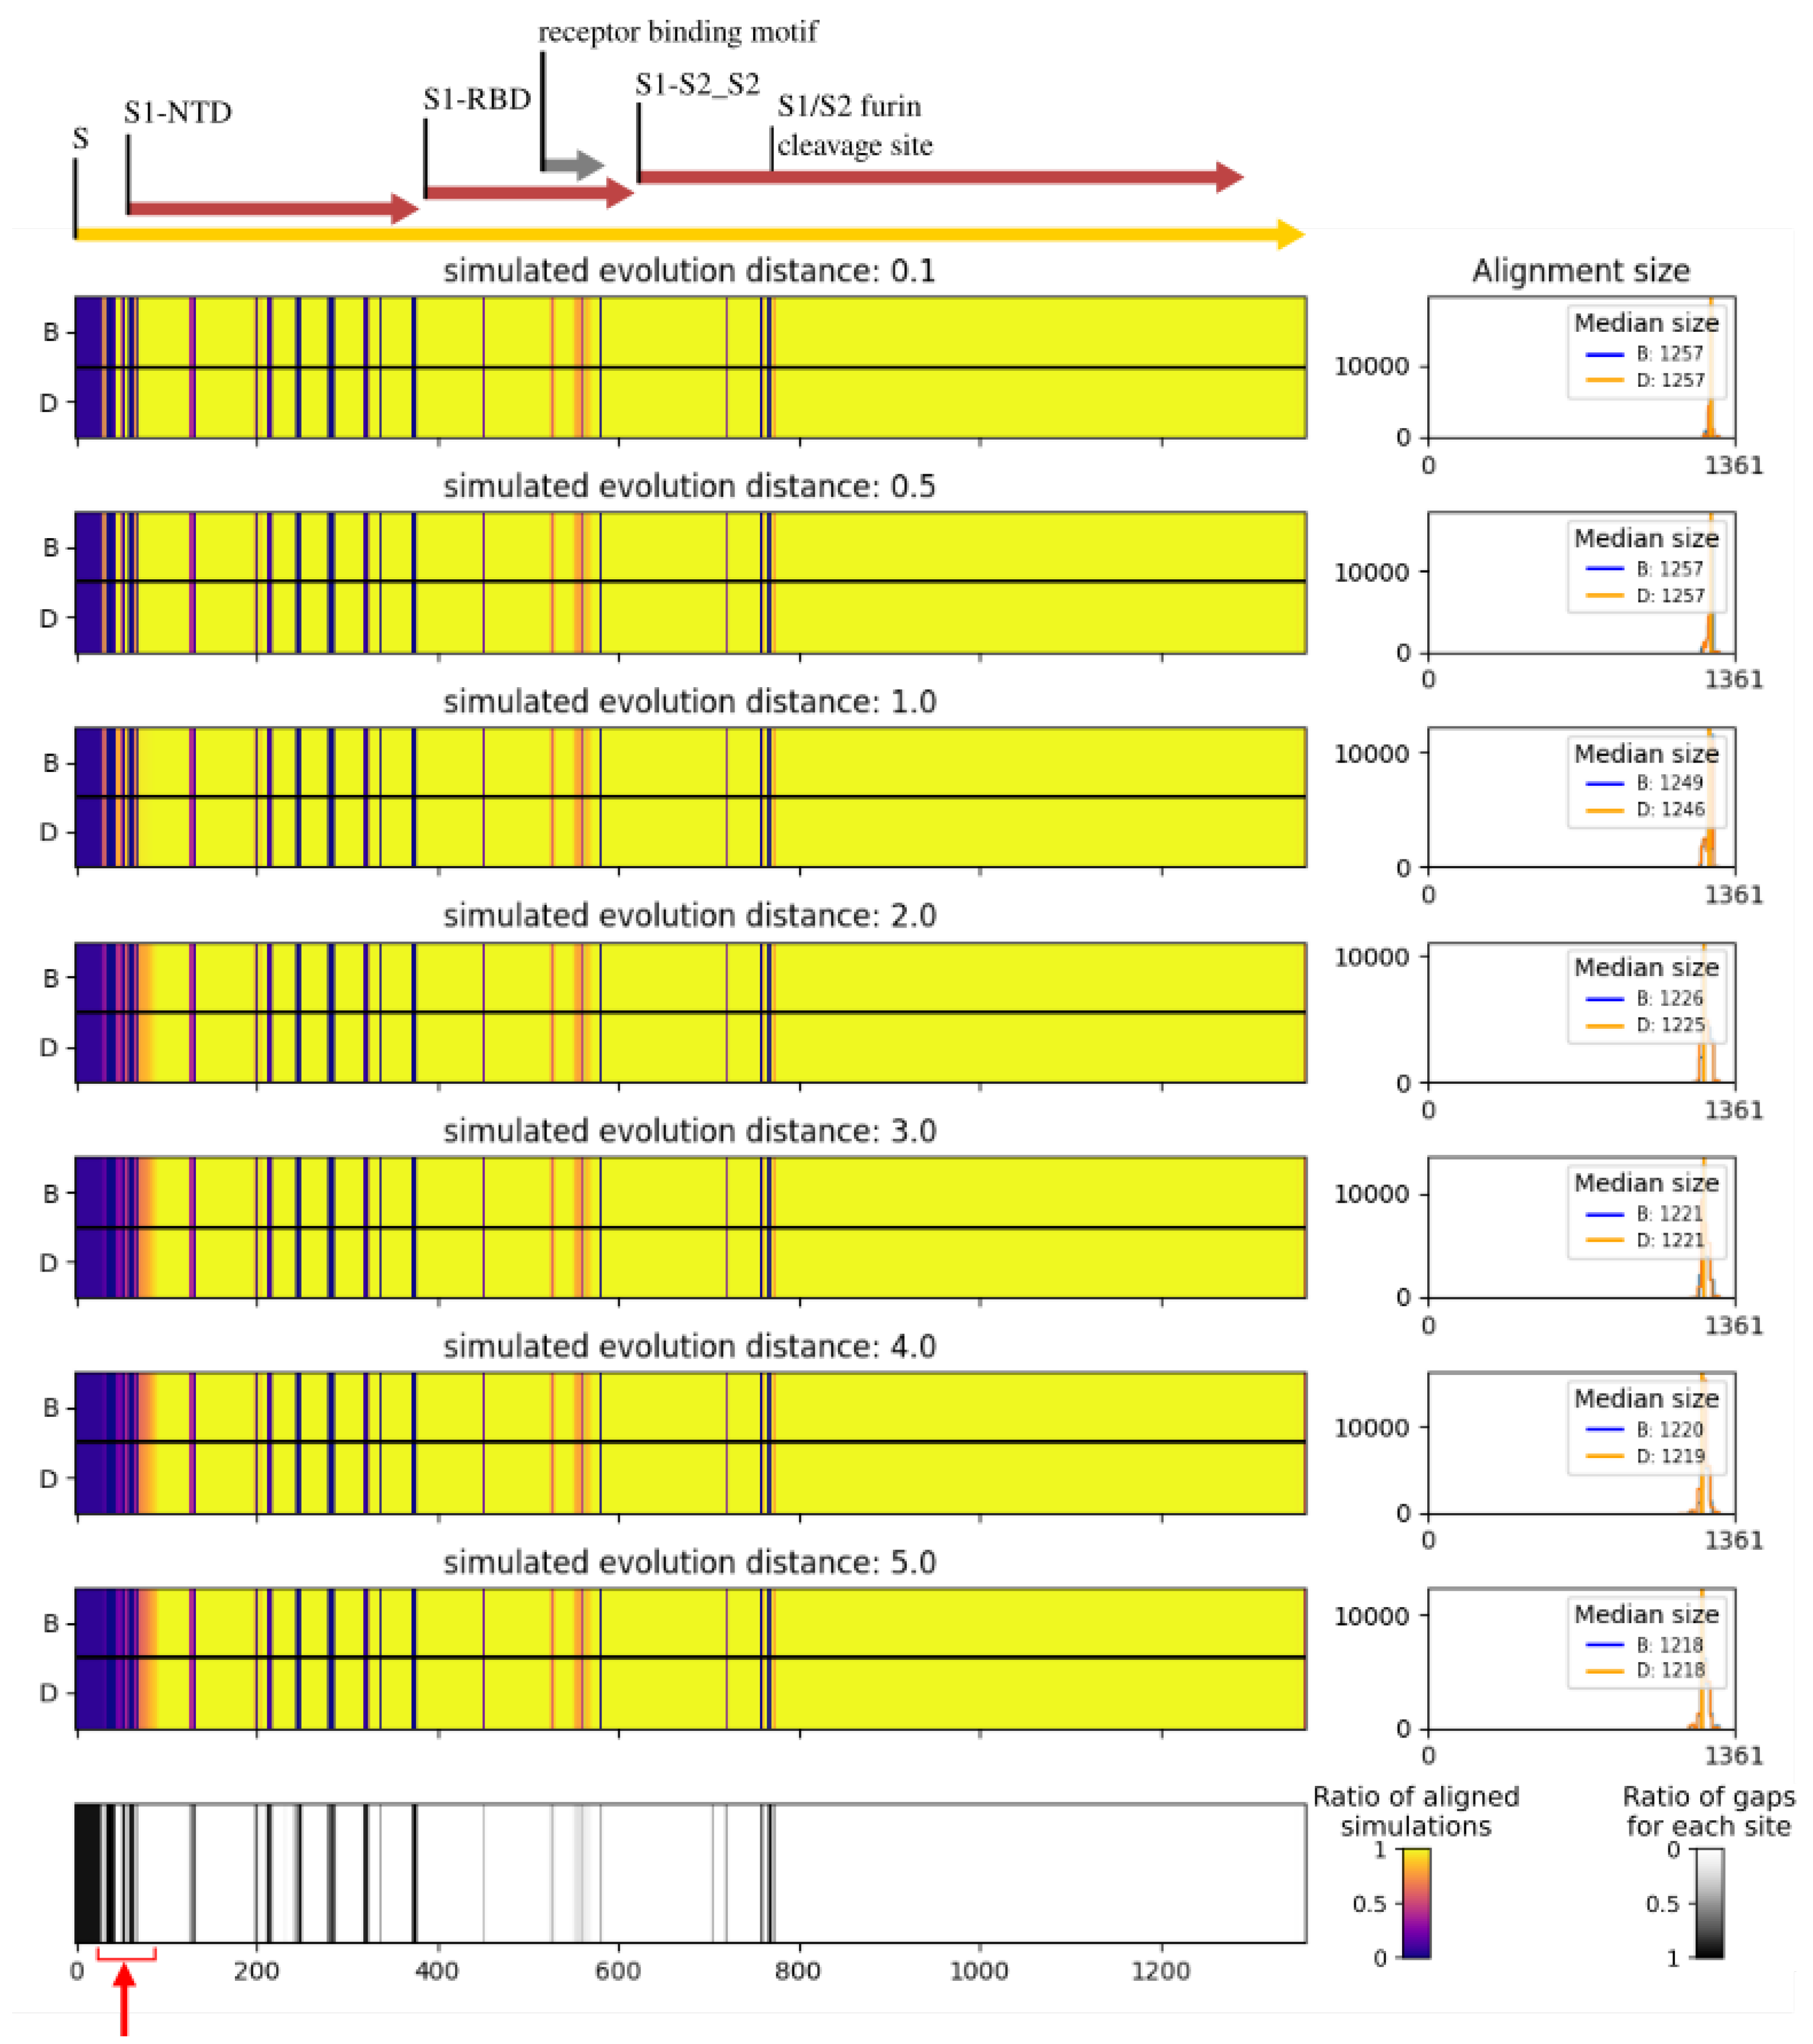
2.5. Structure of the Simulated Spike Protein Receptor Binding Domain
- We used AlphaFold2 [25] to build structural models of the hACE2 and of the spike RBD of each simulated sequence.
- We created models of the hACE2-RBD complex using a local installation of HADDOCK [26]. hACE2 and RBD were first docked into a complex guided by inter-subunits distance restraints extracted from the X-ray structure of the SARS-CoV-2 RBD bound to hACE2 (PDB code 6M0J; [27]). The models were then refined by short MD simulations in explicit solvent during the last step of the HADDOCK modelling pipeline. For each RBD sequence, we created 200 models of the hACE2-RBD complex.
- The empirical scoring function FoldX v. 5 [28] was used to estimate the RBD-hACE2 binding free energy.
3. Results
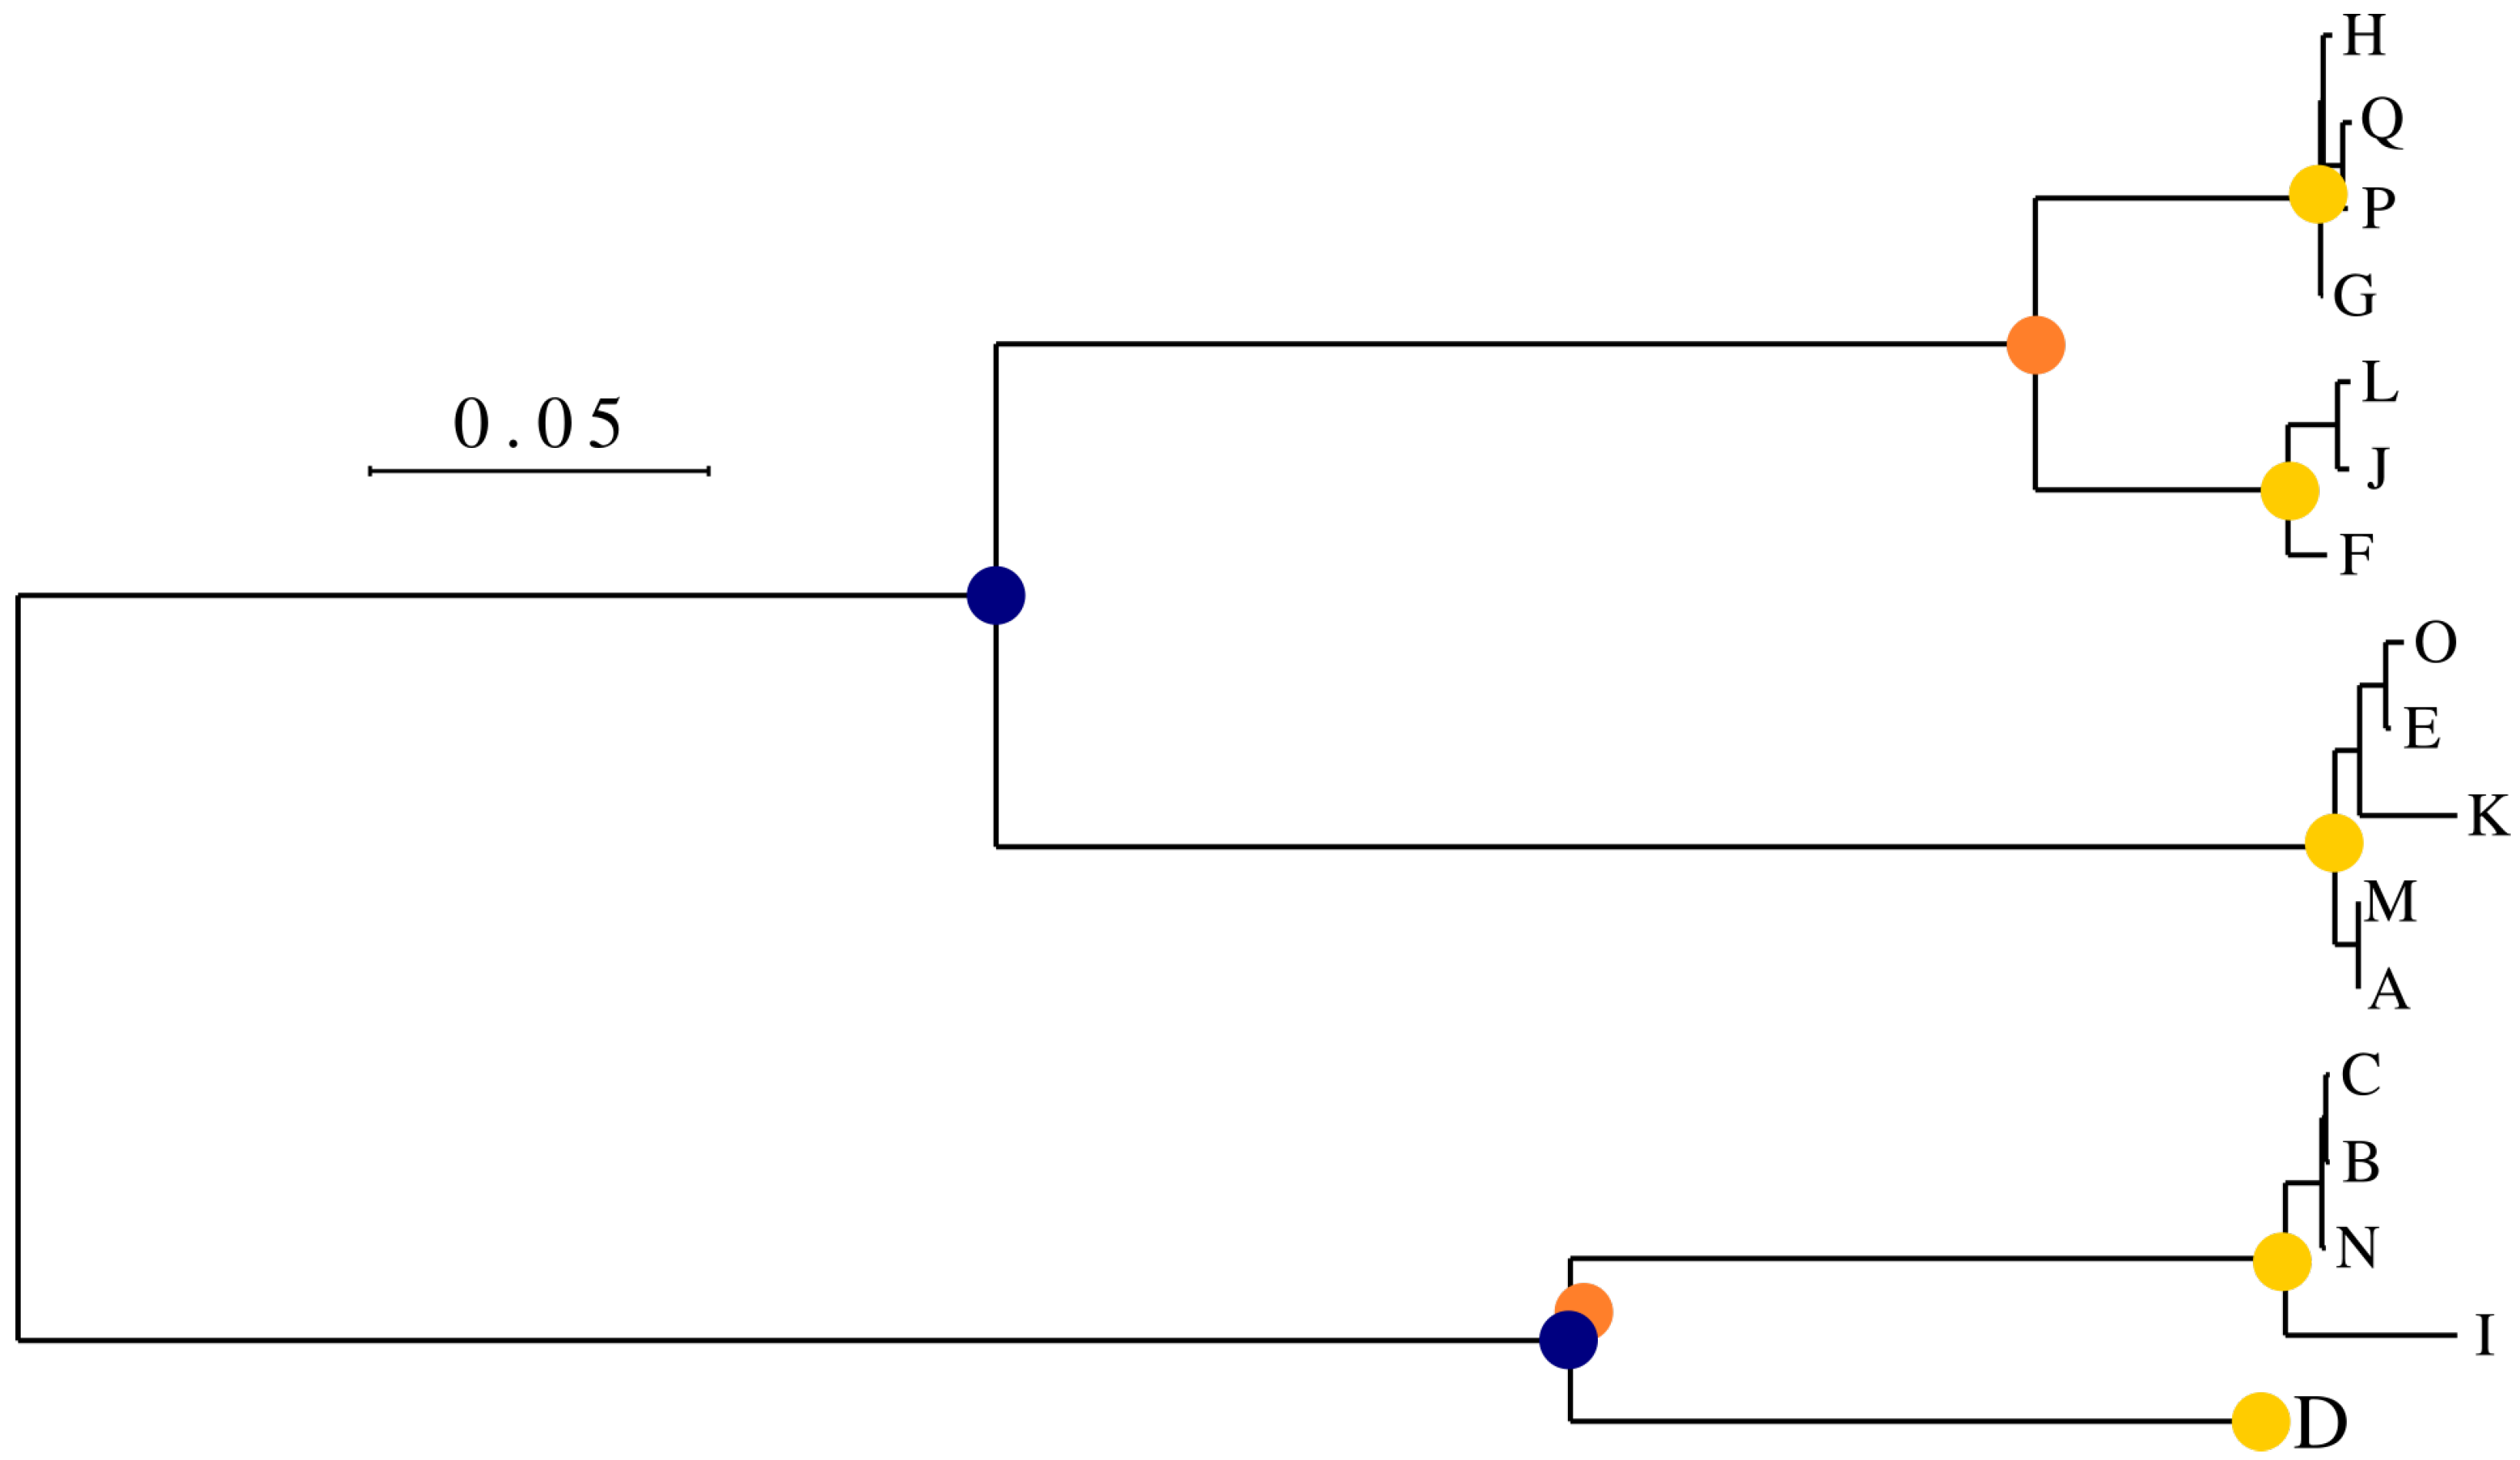
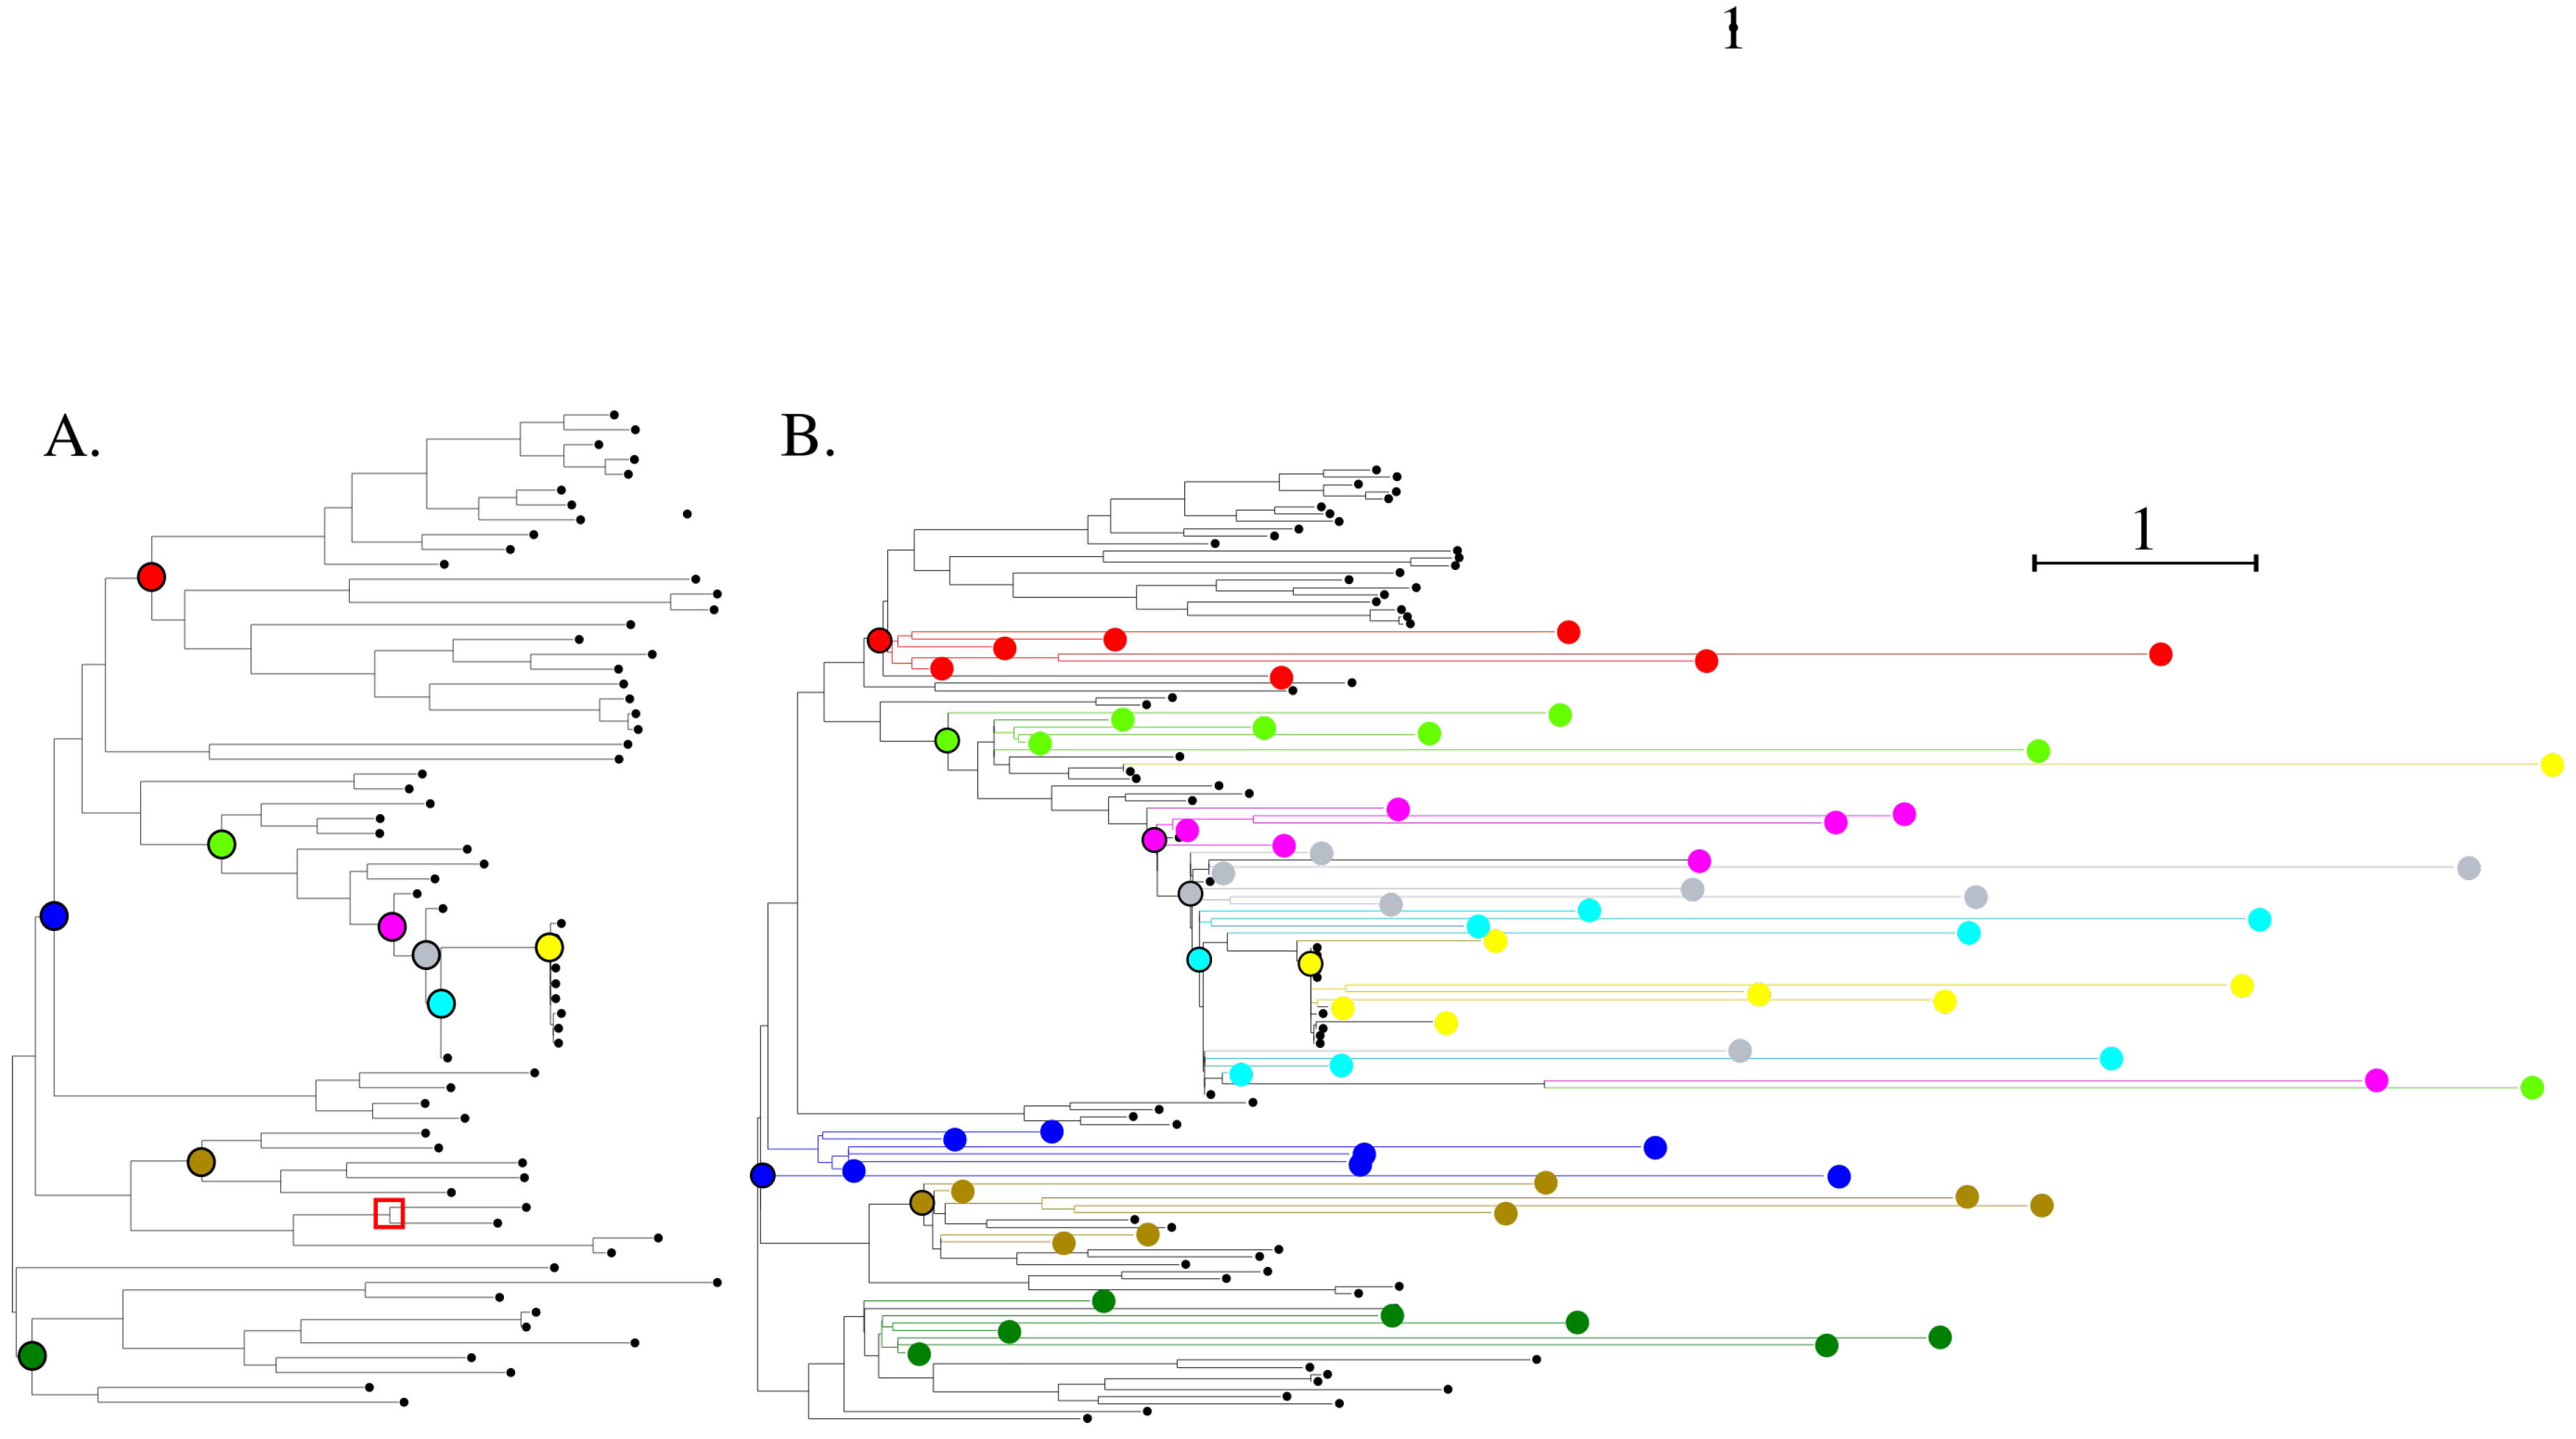
3.1. Phylogeny of Simulated Sequences
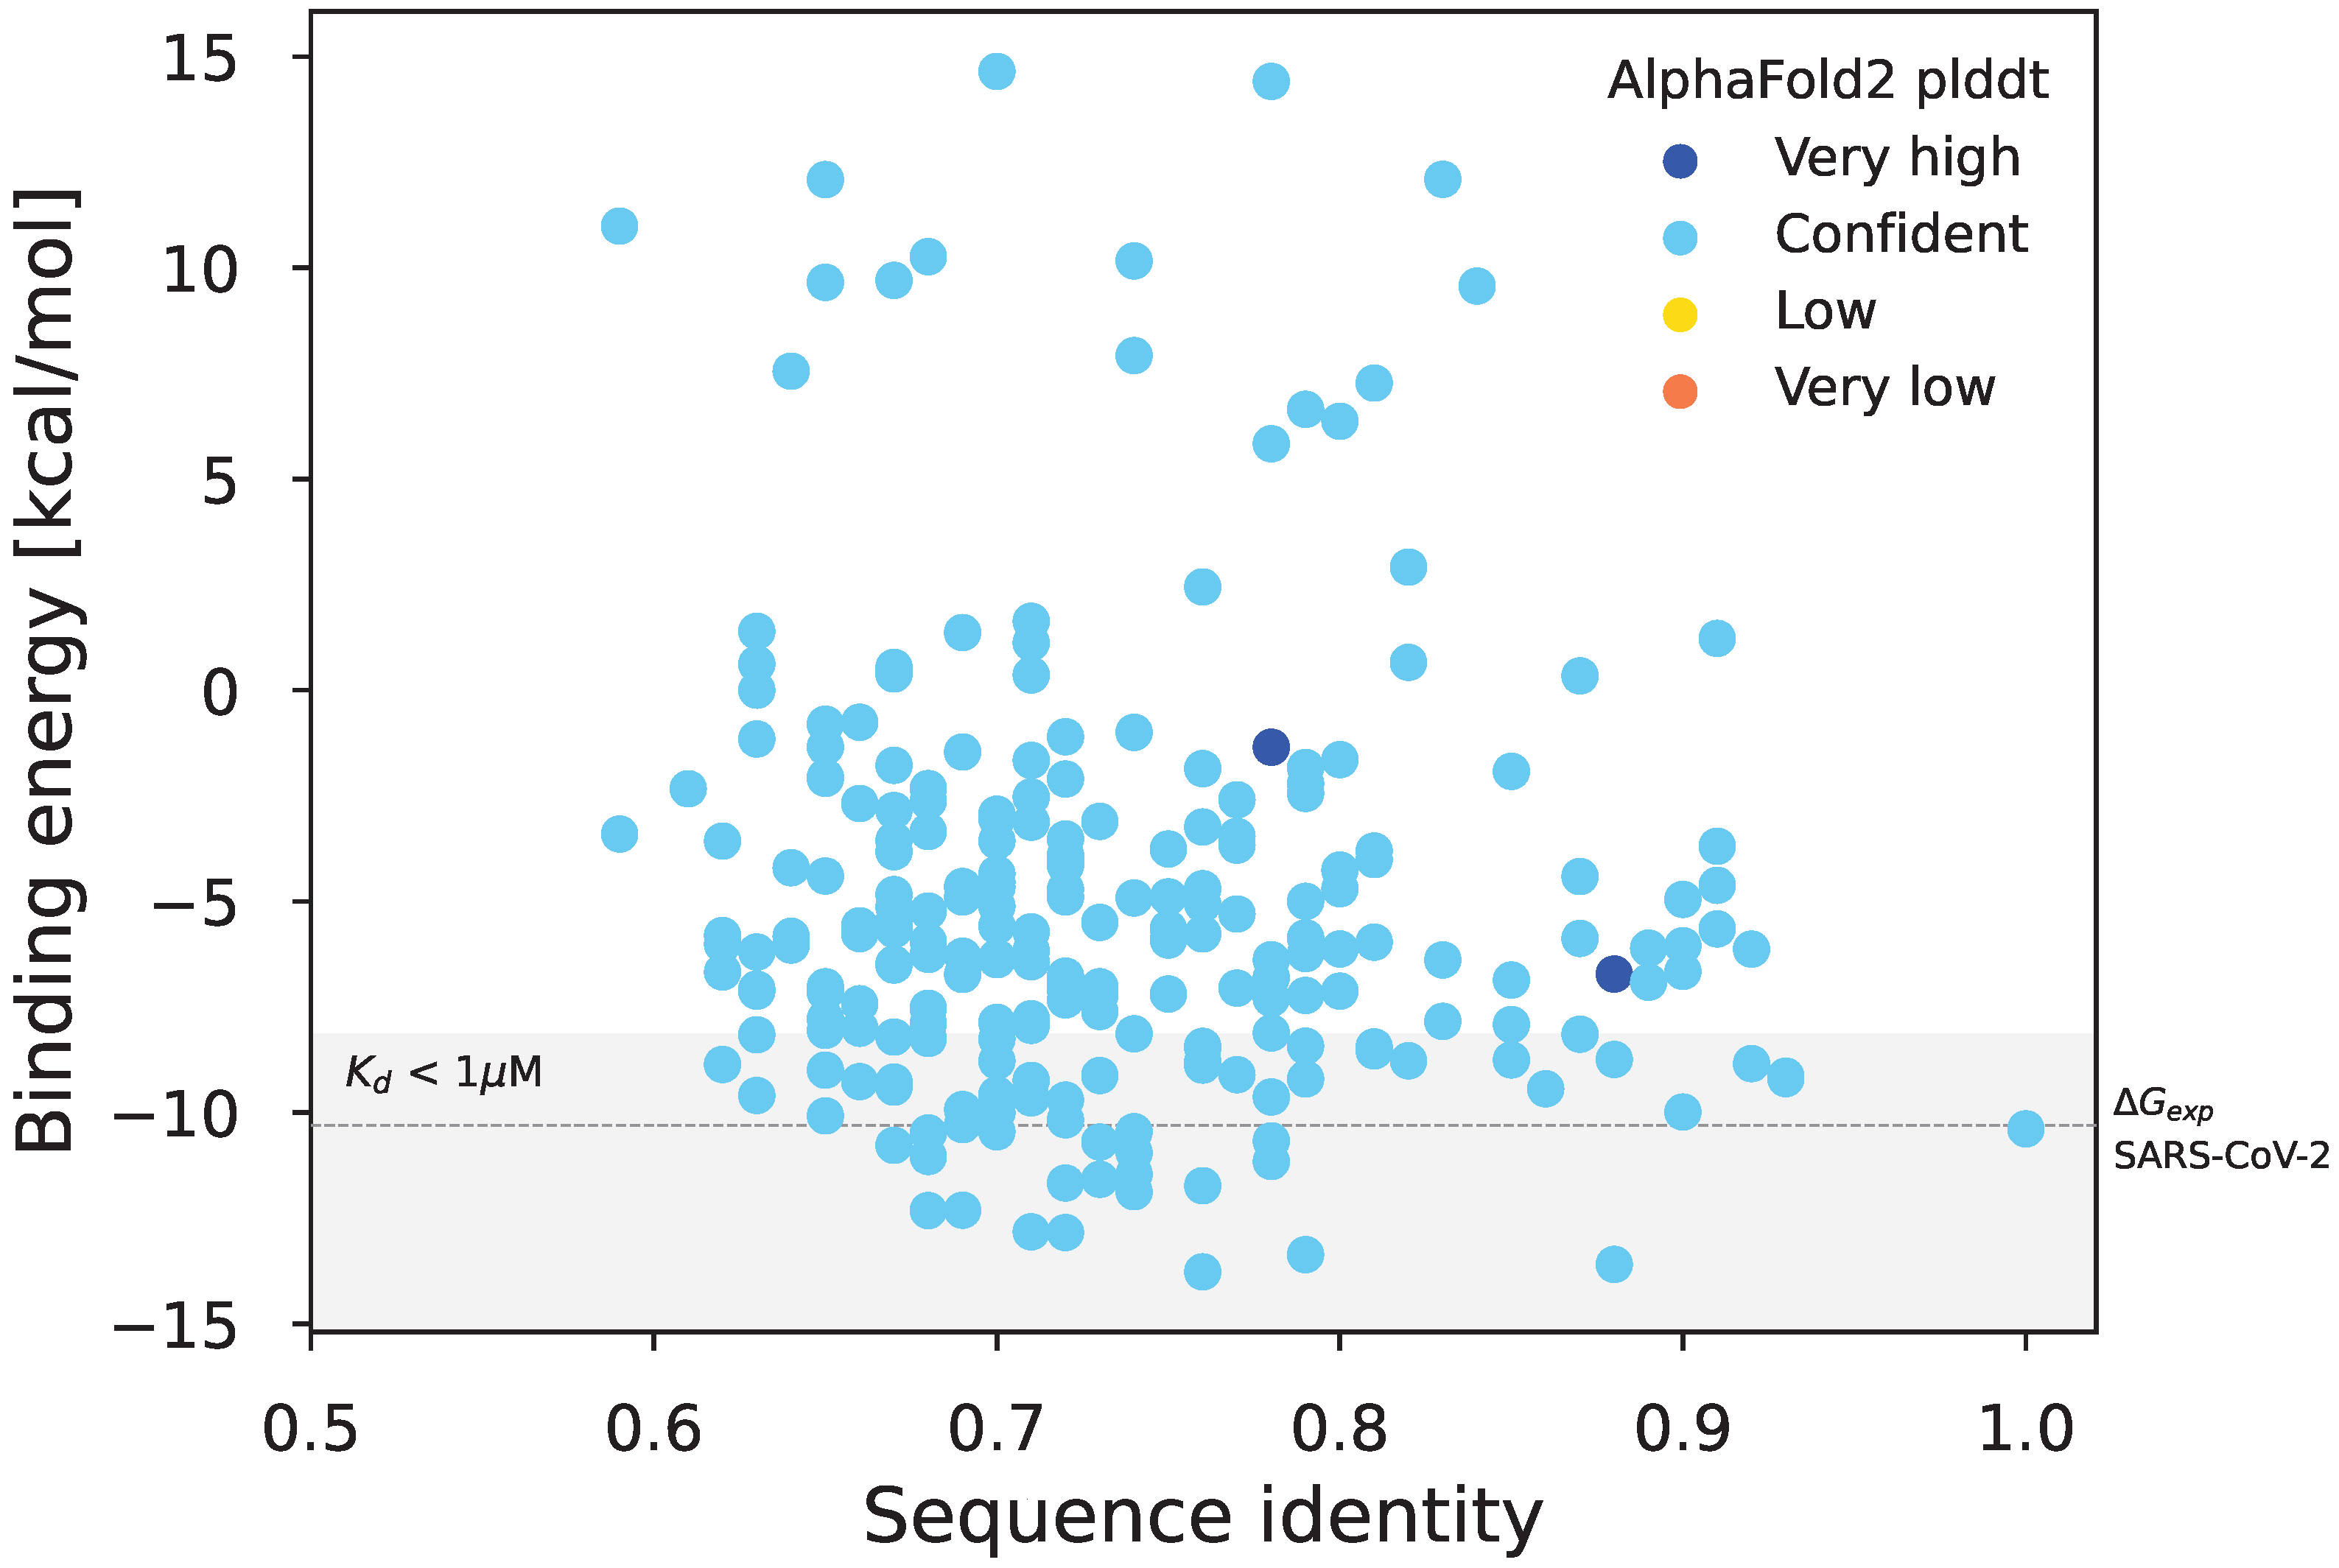
3.2. Biological Significance of Simulations: Structural Evaluation of the Sarbecovirus Spike Dataset
3.3. Virus Pop for Tools and Pipeline Testing
3.4. Improving Taxonomic Tool Sensibility by Expanding Reference Databases
3.5. Database
4. Discussion
- Generating simulations with substitution rate variations depending on sites and inferred from the input dataset. Existing tools do allow to simulate substitution rate variations. For instance, IQ-TREE and Seq-gen both give the possibility to generate rate heterogeneity based on a gamma-model [34]. However, they are implemented without the possibility for the user to constrain which site will be in which gamma-rate category. As a result, for instance, if 20% of the amino acid sites evolve slowly, simulations will statistically reproduce this parameter. However, the 20% of slowly evolving sites will be randomly spread over the alignment and conserved segments may be lost. Other methods for rate heterogeneity simulations exist but, so far, no tool provides an easy way to analyze the rate heterogeneity in real dataset and to reproduce it.
- Inferring ancestral sequences corresponding to multiple internal nodes of the input data phylogenetic tree. This allows Virus Pop to generate new sequences that will be branched at various points of interest in the group studied, and not only new sub-tree deriving from a leaf sequence.
- Adapting the simulated evolutionary distances so that the new sequences will be inserted within the input phylogenetic tree at realistic distances compared to surrounding real sequences. Alternatively, the user may manually choose any distance.
Supplementary Materials
Author Contributions
Funding
Data Availability Statement
Acknowledgments
Conflicts of Interest
Appendix A. Evolutionary Scenario and Simulation—Basic Principle
Appendix A.1. Characterizing Protein Sequence Evolution
Appendix A.2. Monte-Carlo Simulation of Protein Sequence Evolution
References
- Kalantar, K.L.; Carvalho, T.; de Bourcy, C.F.A.; Dimitrov, B.; Dingle, G.; Egger, R.; Han, J.; Holmes, O.B.; Juan, Y.F.; King, R.; et al. IDseq—An open source cloud-based pipeline and analysis service for metagenomic pathogen detection and monitoring. GigaScience 2020, 9, giaa111. [Google Scholar] [CrossRef]
- Pérot, P.; Bigot, T.; Temmam, S.; Regnault, B.; Eloit, M. Microseek: A Protein-Based Metagenomic Pipeline for Virus Diagnostic and Discovery. Viruses 2022, 14, 1990. [Google Scholar] [CrossRef] [PubMed]
- Plyusnin, I.; Vapalahti, O.; Sironen, T.; Kant, R.; Smura, T. Enhanced Viral Metagenomics with Lazypipe 2. Viruses 2023, 15, 431. [Google Scholar] [CrossRef] [PubMed]
- Huelsenbeck, J.P. Performance of phylogenetic methods in simulations. Syst. Biol. 1995, 4, 32. [Google Scholar] [CrossRef]
- Garland, T.; Janis, C.M.; Jones, J.A. Phylogenetic analysis of covariance by computer simulation. Syst. Biol. 1993, 42, 28. [Google Scholar] [CrossRef]
- Suvorov, A.; Hochuli, J.; Schrider, D.R. Accurate Inference of Tree Topologies from Multiple Sequence Alignments Using Deep Learning. Syst. Biol. 2020, 69, 221–233. [Google Scholar] [CrossRef] [PubMed]
- Schöniger, M.; von Haeseler, A. Toward Assigning Helical Regions in Alignments of Ribosomal RNA and Testing the Appropriateness of Evolutionary Models. J. Mol. Evol. 1999, 49, 691–698. [Google Scholar] [CrossRef] [PubMed]
- Rambaut, A.; Grass, N.C. Seq-Gen: An application for the Monte Carlo simulation of DNA sequence evolution along phylogenetic trees. Bioinformatics 1997, 13, 235–238. [Google Scholar] [CrossRef]
- Minh, B.Q.; Schmidt, H.A.; Chernomor, O.; Schrempf, D.; Woodhams, M.D.; von Haeseler, A.; Lanfear, R. IQ-TREE 2: New Models and Efficient Methods for Phylogenetic Inference in the Genomic Era. Mol. Biol. Evol. 2020, 37, 1530–1534. [Google Scholar] [CrossRef] [PubMed]
- Ly-Trong, N.; Naser-Khdour, S.; Lanfear, R.; Minh, B.Q. AliSim: A Fast and Versatile Phylogenetic Sequence Simulator For the Genomic Era. BioRxiv 2021. [Google Scholar] [CrossRef] [PubMed]
- Mölder, F.; Jablonski, K.P.; Letcher, B.; Hall, M.B.; Tomkins-Tinch, C.H.; Sochat, V.; Forster, J.; Lee, S.; Twardziok, S.O.; Kanitz, A.; et al. Sustainable data analysis with Snakemake. F1000Research 2021, 10, 33. [Google Scholar] [CrossRef] [PubMed]
- Sukumaran, J.; Holder, M.T. DendroPy: A Python library for phylogenetic computing. Bioinformatics 2010, 26, 1569–1571. [Google Scholar] [CrossRef]
- Huerta-Cepas, J.; Serra, F.; Bork, P. ETE 3: Reconstruction, Analysis, and Visualization of Phylogenomic Data. Mol. Biol. Evol. 2016, 33, 1635–1638. [Google Scholar] [CrossRef] [PubMed]
- Cock, P.J.A.; Antao, T.; Chang, J.T.; Chapman, B.A.; Cox, C.J.; Dalke, A.; Friedberg, I.; Hamelryck, T.; Kauff, F.; Wilczynski, B.; et al. Biopython: Freely available Python tools for computational molecular biology and bioinformatics. Bioinformatics 2009, 25, 1422–1423. [Google Scholar] [CrossRef]
- Letunic, I.; Bork, P. Interactive Tree Of Life (iTOL): An online tool for phylogenetic tree display and annotation. Bioinformatics 2006, 23, 127–128. [Google Scholar] [CrossRef] [PubMed]
- Camacho, C.; Coulouris, G.; Avagyan, V.; Ma, N.; Papadopoulos, J.; Bealer, K.; Madden, T.L. BLAST+: Architecture and applications. BMC Bioinform. 2009, 10, 421. [Google Scholar] [CrossRef]
- Miele, V.; Penel, S.; Duret, L. Ultra-fast sequence clustering from similarity networks with SiLiX. BMC Bioinform. 2011, 12, 116. [Google Scholar] [CrossRef]
- Katoh, K. MAFFT: A novel method for rapid multiple sequence alignment based on fast Fourier transform. Nucleic Acids Res. 2002, 30, 3059–3066. [Google Scholar] [CrossRef]
- Kalyaanamoorthy, S.; Minh, B.Q.; Wong, T.K.F.; von Haeseler, A.; Jermiin, L.S. ModelFinder: Fast model selection for accurate phylogenetic estimates. Nat. Methods 2017, 14, 587–589. [Google Scholar] [CrossRef]
- Yang, Z. Maximum likelihood phylogenetic estimation from DNA sequences with variable rates over sites: Approximate methods. J. Mol. Evol. 1994, 39, 306–314. [Google Scholar] [CrossRef]
- Khare, S.; Gurry, C.; Freitas, L.; Schultz, M.B.; Bach, G.; Diallo, A.; Akite, N.; Ho, J.; Lee, R.T.; Yeo, W.; et al. GISAID’s Role in Pandemic Response. China CDC Wkly. 2021, 3, 1049–1051. [Google Scholar] [CrossRef]
- Clark, K.; Karsch-Mizrachi, I.; Lipman, D.J.; Ostell, J.; Sayers, E.W. GenBank. Nucleic Acids Res. 2015, 44, D67–D72. [Google Scholar] [CrossRef] [PubMed]
- Pérot, P.; Fourgeaud, J.; Rouzaud, C.; Regnault, B.; Rocha, N.D.; Fontaine, H.; Pavec, J.L.; Dolidon, S.; Garzaro, M.; Chrétien, D.; et al. Circovirus Hepatitis Infection in Heart-Lung Transplant Patient, France. Emerg. Infect. Dis. 2023, 29, 286–293. [Google Scholar] [CrossRef]
- Li, Y.; Cao, L.; Ye, M.; Xu, R.; Chen, X.; Ma, Y.; Tian, R.R.; Liu, F.L.; Zhang, P.; Kuang, Y.Q.; et al. Plasma Virome Reveals Blooms and Transmission of Anellovirus in Intravenous Drug Users with HIV-1, HCV, and/or HBV Infections. Microbiol. Spectr. 2022, 10, e01447-22. [Google Scholar] [CrossRef] [PubMed]
- Jumper, J.; Evans, R.; Pritzel, A.; Green, T.; Figurnov, M.; Ronneberger, O.; Tunyasuvunakool, K.; Bates, R.; Žídek, A.; Potapenko, A.; et al. Highly accurate protein structure prediction with AlphaFold. Nature 2021, 596, 583–589. [Google Scholar] [CrossRef]
- van Zundert, G.; Rodrigues, J.; Trellet, M.; Schmitz, C.; Kastritis, P.; Karaca, E.; Melquiond, A.; van Dijk, M.; de Vries, S.; Bonvin, A. The HADDOCK2.2 Web Server: User-Friendly Integrative Modeling of Biomolecular Complexes. J. Mol. Biol. 2016, 428, 720–725. [Google Scholar] [CrossRef]
- Lan, J.; Ge, J.; Yu, J.; Shan, S.; Zhou, H.; Fan, S.; Zhang, Q.; Shi, X.; Wang, Q.; Zhang, L.; et al. Structure of the SARS-CoV-2 spike receptor-binding domain bound to the ACE2 receptor. Nature 2020, 581, 215–220. [Google Scholar] [CrossRef]
- Delgado, J.; Radusky, L.G.; Cianferoni, D.; Serrano, L. FoldX 5.0: Working with RNA, small molecules and a new graphical interface. Bioinformatics 2019, 35, 4168–4169. [Google Scholar] [CrossRef]
- Temmam, S.; Vongphayloth, K.; Baquero, E.; Munier, S.; Bonomi, M.; Regnault, B.; Douangboubpha, B.; Karami, Y.; Chrétien, D.; Sanamxay, D.; et al. Bat coronaviruses related to SARS-CoV-2 and infectious for human cells. Nature 2022, 604, 330–336. [Google Scholar] [CrossRef] [PubMed]
- Buchfink, B.; Xie, C.; Huson, D.H. Fast and sensitive protein alignment using DIAMOND. Nat. Methods 2015, 12, 59–60. [Google Scholar] [CrossRef] [PubMed]
- Pearson, W.R. An introduction to sequence similarity (“homology”) searching. Curr. Protoc. Bioinform. 2013, 3, 3.1.1–3.1.8. [Google Scholar] [CrossRef] [PubMed]
- Hulo, C.; de Castro, E.; Masson, P.; Bougueleret, L.; Bairoch, A.; Xenarios, I.; Mercier, P.L. ViralZone: A knowledge resource to understand virus diversity. Nucleic Acids Res. 2010, 39, D576–D582. [Google Scholar] [CrossRef] [PubMed]
- Fletcher, W.; Yang, Z. INDELible: A Flexible Simulator of Biological Sequence Evolution. Mol. Biol. Evol. 2009, 26, 1879–1888. [Google Scholar] [CrossRef]
- Yang, Z. Phylogenetic analysis using parsimony and likelihood methods. J. Mol. Evol. 1996, 42, 294–307. [Google Scholar] [CrossRef]
- Brinkmann, H.; van der Giezen, M.; Zhou, Y.; de Raucourt, G.P.; Philippe, H. An Empirical Assessment of Long-Branch Attraction Artefacts in Deep Eukaryotic Phylogenomics. Syst. Biol. 2005, 54, 743–757. [Google Scholar] [CrossRef] [PubMed]
- Parisi, G.; Echave, J. Generality of the Structurally Constrained Protein Evolution model: Assessment on representatives of the four main fold classes. Gene 2005, 345, 45–53. [Google Scholar] [CrossRef]
- Rodrigue, N.; Philippe, H.; Lartillot, N. Assessing Site-Interdependent Phylogenetic Models of Sequence Evolution. Mol. Biol. Evol. 2006, 23, 1762–1775. [Google Scholar] [CrossRef]
- Dayhoff, M.; Schwartz, R.; Orcutt, B. A model of evolutionary change in proteins. In Atlas of Protein Sequence and Structure; Dayhoff, M., Ed.; National Biomedical Research Foundation: Washington, DC, USA, 1978; Volume 5, pp. 345–352. [Google Scholar]
- Whelan, S.; Goldman, N. A General Empirical Model of Protein Evolution Derived from Multiple Protein Families Using a Maximum-Likelihood Approach. Mol. Biol. Evol. 2001, 18, 691–699. [Google Scholar] [CrossRef]
- Jones, D.T.; Taylor, W.R.; Thornton, J.M. The rapid generation of mutation data matrices from protein sequences. Bioinformatics 1992, 8, 275–282. [Google Scholar] [CrossRef]
- Henikoff, S.; Henikoff, J.G. Amino acid substitution matrices from protein blocks. Proc. Natl. Acad. Sci. USA 1992, 89, 10915–10919. [Google Scholar] [CrossRef]
- Dang, C.C.; Le, Q.S.; Gascuel, O.; Le, V.S. FLU, an amino acid substitution model for influenza proteins. BMC Evol. Biol. 2010, 10, 99. [Google Scholar] [CrossRef] [PubMed]
- Dimmic, M.W.; Rest, J.S.; Mindell, D.P.; Goldstein, R.A. rtREV: An Amino Acid Substitution Matrix for Inference of Retrovirus and Reverse Transcriptase Phylogeny. J. Mol. Evol. 2002, 55, 65–73. [Google Scholar] [CrossRef] [PubMed]
- Perrière, G.; Brochier-Armanet, C. Concepts et Méthodes en Phylogénie Moléculaire; Springer: Paris, France, 2010. [Google Scholar]


Disclaimer/Publisher’s Note: The statements, opinions and data contained in all publications are solely those of the individual author(s) and contributor(s) and not of MDPI and/or the editor(s). MDPI and/or the editor(s) disclaim responsibility for any injury to people or property resulting from any ideas, methods, instructions or products referred to in the content. |
© 2023 by the authors. Licensee MDPI, Basel, Switzerland. This article is an open access article distributed under the terms and conditions of the Creative Commons Attribution (CC BY) license (https://creativecommons.org/licenses/by/4.0/).
Share and Cite
Kende, J.; Bonomi, M.; Temmam, S.; Regnault, B.; Pérot, P.; Eloit, M.; Bigot, T. Virus Pop—Expanding Viral Databases by Protein Sequence Simulation. Viruses 2023, 15, 1227. https://doi.org/10.3390/v15061227
Kende J, Bonomi M, Temmam S, Regnault B, Pérot P, Eloit M, Bigot T. Virus Pop—Expanding Viral Databases by Protein Sequence Simulation. Viruses. 2023; 15(6):1227. https://doi.org/10.3390/v15061227
Chicago/Turabian StyleKende, Julia, Massimiliano Bonomi, Sarah Temmam, Béatrice Regnault, Philippe Pérot, Marc Eloit, and Thomas Bigot. 2023. "Virus Pop—Expanding Viral Databases by Protein Sequence Simulation" Viruses 15, no. 6: 1227. https://doi.org/10.3390/v15061227