
Comparing Clinical Outcomes of COVID-19 and Influenza-Induced Acute Respiratory Distress Syndrome: A Propensity-Matched Analysis
 , ,
, ,
Abstract
:1. Introduction
2. Materials and Methods
2.1. Data Source
2.2. Study Population
- The primary outcome was in-hospital mortality.
- Secondary outcomes included:
- Invasive and non-invasive mechanical ventilation, i.e., continuous positive pressure ventilation (CPAP) and bilevel positive pressure ventilation (BIPAP);
- Complications including vasopressor requirement, sudden cardiac arrest, mechanical circulatory support, venous thromboembolism, cardiogenic shock, hemodialysis need, cardiac arrest, acute liver failure, acute kidney injury, and HD requirement;
- Length of stay, mean total hospitalization charge, and patient disposition.
2.3. Statistical Analysis
3. Results
3.1. In-Hospital Outcomes
3.2. In-Hospital Mortality
3.3. In-Hospital Complications
3.4. In-Hospital Quality Measures and Disposition
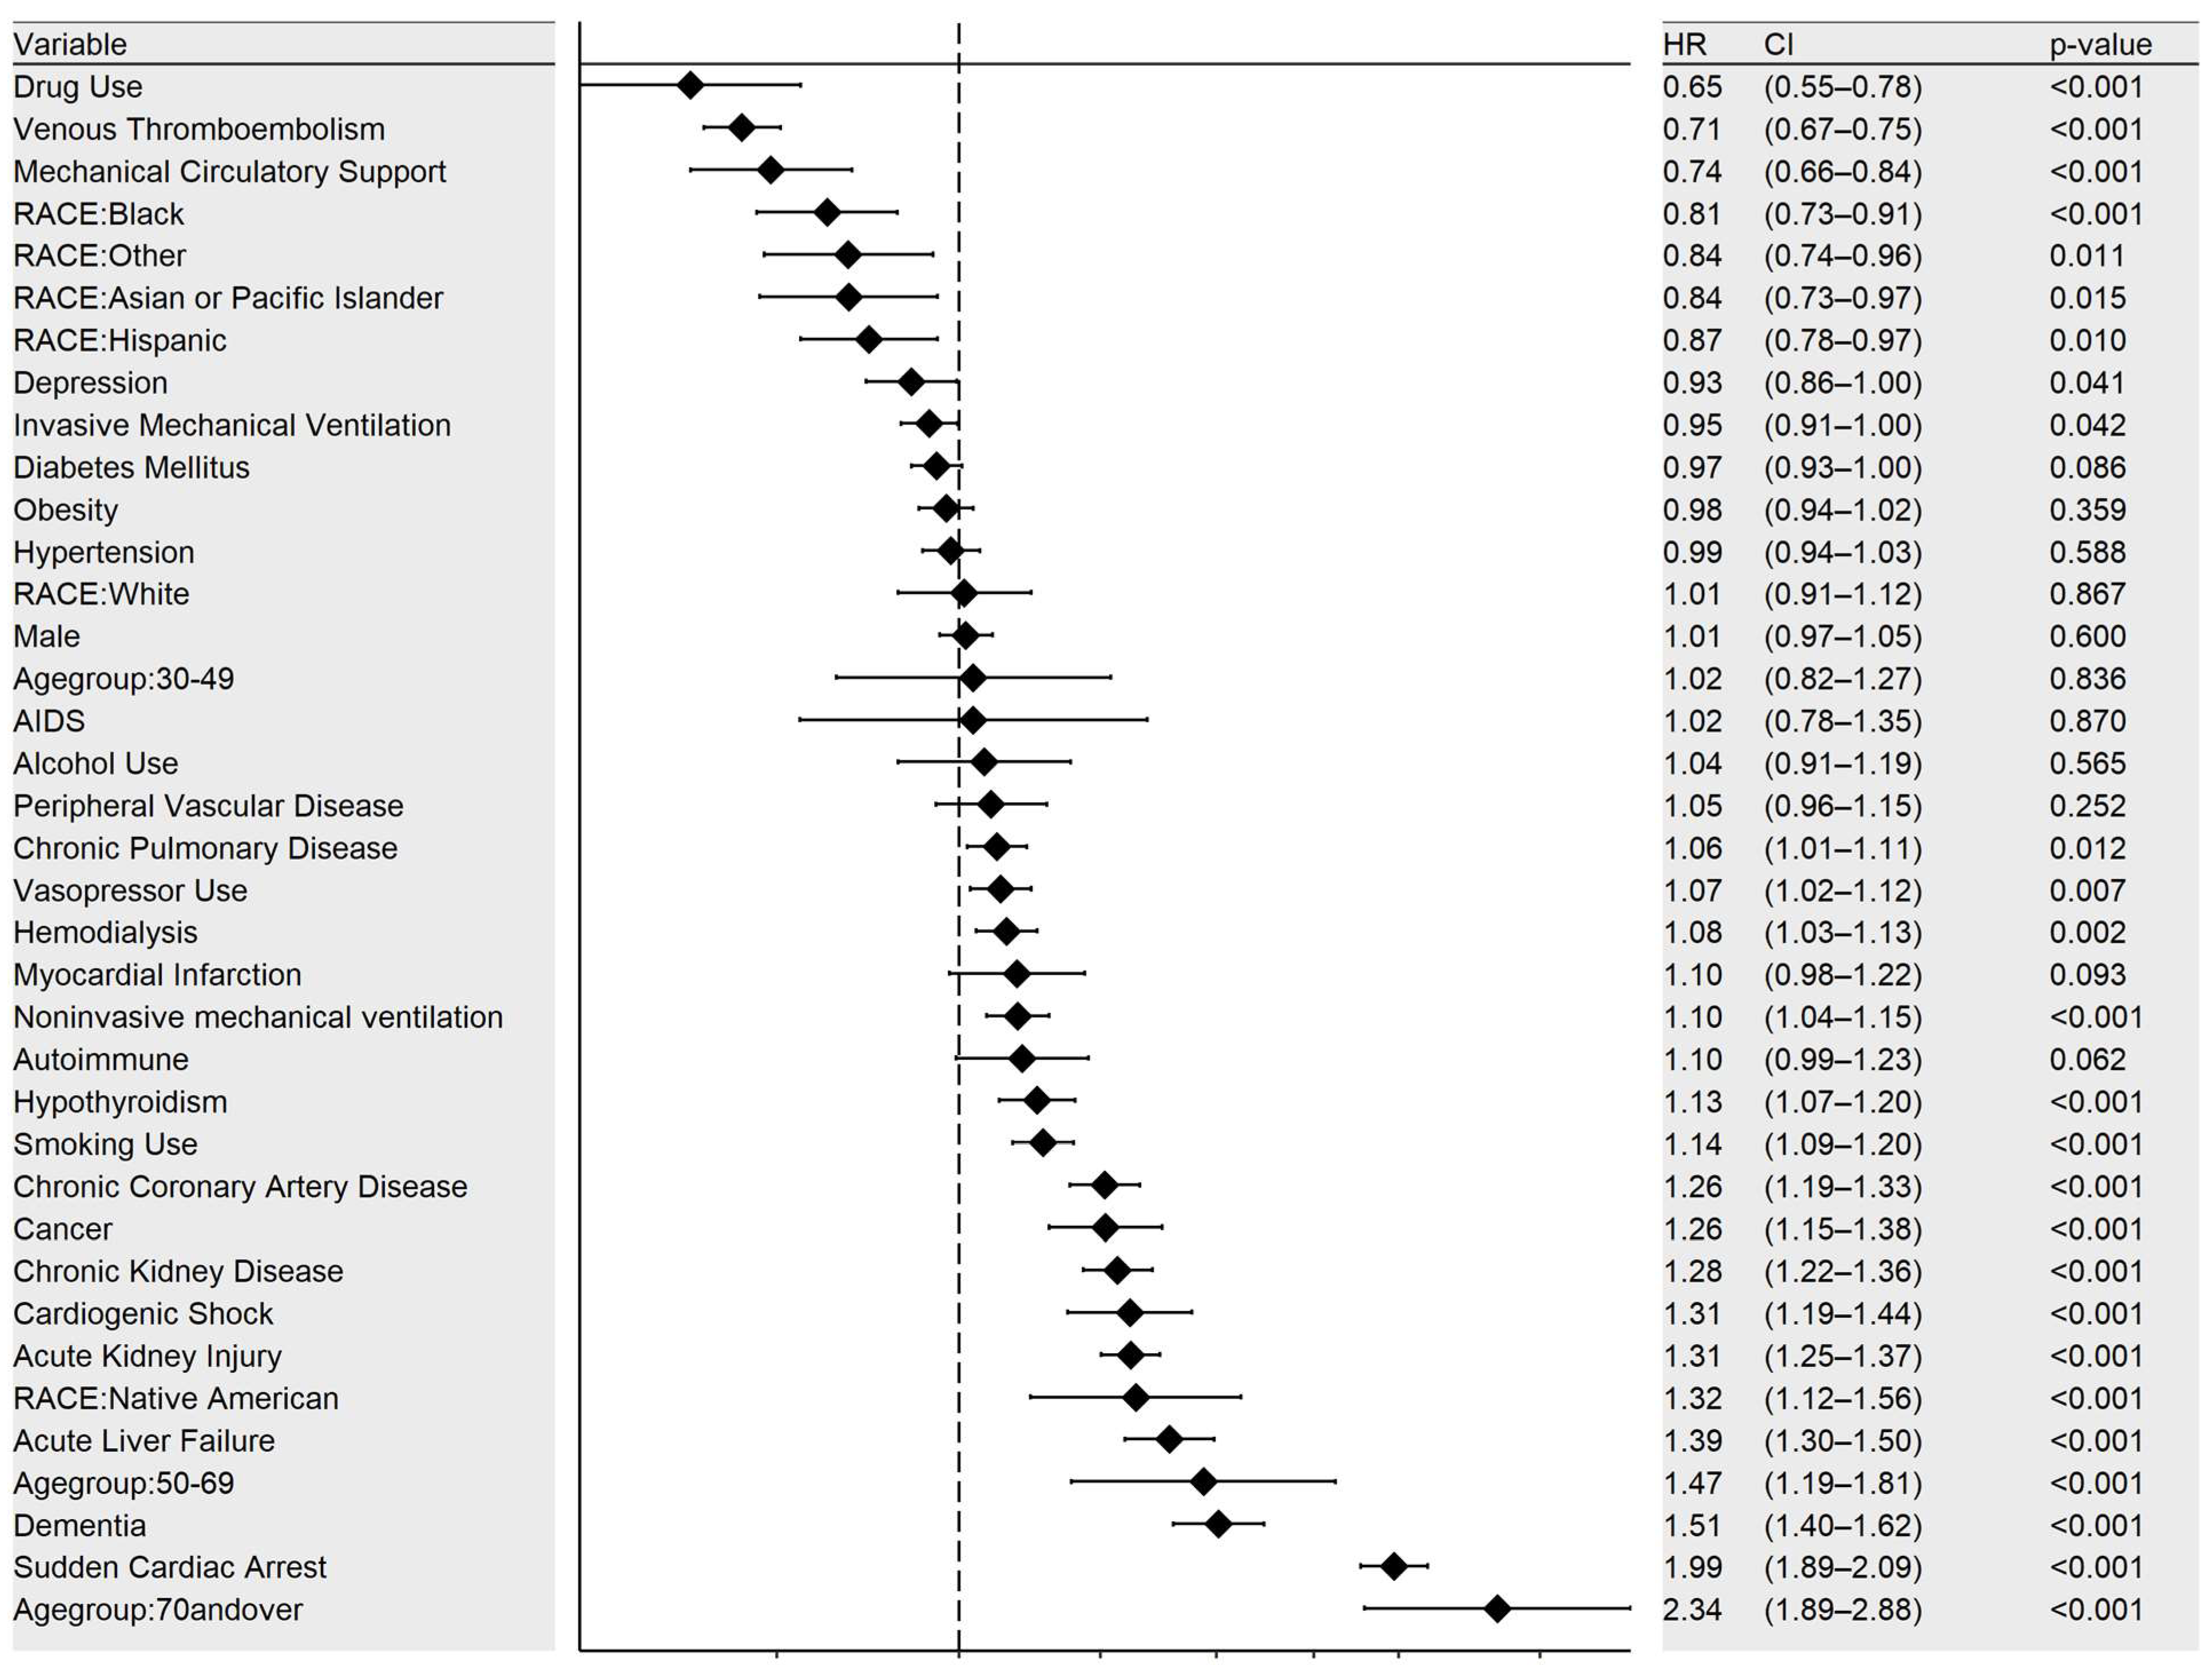
3.5. Mortality Predictors in COVID-Positive ARDS
4. Discussion
5. Limitations
6. Conclusions
Supplementary Materials
Author Contributions
Funding
Institutional Review Board Statement
Informed Consent Statement
Data Availability Statement
Acknowledgments
Conflicts of Interest
References
- CDC COVID Data Tracker. Available online: https://covid.cdc.gov/covid-data-tracker/#trends_totalcases_select_00 (accessed on 2 March 2023).
- Solomon, D.A.; Sherman, A.C.; Kanjilal, S. Influenza in the COVID-19 Era. JAMA 2020, 324, 1342–1343. [Google Scholar] [CrossRef] [PubMed]
- NIS Database Documentation. Available online: https://hcup-us.ahrq.gov/db/nation/nis/nisdbdocumentation.jsp (accessed on 25 November 2022).
- Tzotzos, S.J.; Fischer, B.; Fischer, H.; Zeitlinger, M. Incidence of ARDS and outcomes in hospitalized patients with COVID-19: A global literature survey. Crit. Care 2020, 24, 516. [Google Scholar] [CrossRef] [PubMed]
- Christie, A.; Henley, S.J.; Mattocks, L.; Fernando, R.; Lansky, A.; Ahmad, F.B.; Adjemian, J.; Anderson, R.N.; Binder, A.M.; Carey, K.; et al. Decreases in COVID-19 Cases, Emergency Department Visits, Hospital Admissions, and Deaths Among Older Adults Following the Introduction of COVID-19 Vaccine—United States, September 6, 2020–May 1, 2021. Morb. Mortal. Wkly. Rep. 2021, 70, 858–864. [Google Scholar] [CrossRef] [PubMed]
- Pandemic Influenza. Pandemic Influenza (Flu) CDC. Available online: https://www.cdc.gov/flu/pandemic-resources/index.htm (accessed on 2 March 2023).
- CDC. 2020–2021 Flu Season Summary. Available online: https://www.cdc.gov/flu/season/faq-flu-season-2020-2021.htm (accessed on 2 March 2023).
- Rubin, R. Influenza’s Unprecedented Low Profile During COVID-19 Pandemic Leaves Experts Wondering What This Flu Season Has in Store. JAMA 2021, 326, 899–900. [Google Scholar] [CrossRef]
- Flu Vaccination Coverage, United States, 2020–2021 Influenza Season. Available online: https://www.cdc.gov/flu/fluvaxview/coverage-2021estimates.htm (accessed on 2 March 2023).
- Cobb, N.L.; Sathe, N.A.; Duan, K.I.; Seitz, K.P.; Thau, M.R.; Sung, C.C.; Morrell, E.D.; Mikacenic, C.; Kim, H.N.; Liles, W.C.; et al. Comparison of Clinical Features and Outcomes in Critically Ill Patients Hospitalized with COVID-19 versus Influenza. Ann. Am. Thorac. Soc. 2021, 18, 632–640. [Google Scholar] [CrossRef]
- Torres Acosta, M.A.; Singer, B.D. Pathogenesis of COVID-19-induced ARDS: Implications for an ageing population. Eur. Respir. J. 2020, 56, 2002049. [Google Scholar] [CrossRef]
- Chiumello, D.; Modafferi, L.; Fratti, I. Risk Factors and Mortality in Elderly ARDS COVID-19 Compared to Patients without COVID-19. J. Clin. Med. 2022, 11, 5180. [Google Scholar] [CrossRef]
- Valkenburg, S.A.; Poon, L.L.M. Exploring the landscape of immune responses to influenza infection and vaccination. Nat. Med. 2022, 28, 239–240. [Google Scholar] [CrossRef]
- Kronibus, N.; Seiler, F.; Danziger, G.; Muellenbach, R.M.; Reyher, C.; Becker, A.P.; Kamphorst, M.; Rixecker, T.M.; Metz, C.; Bals, R.; et al. Respiratory Physiology of COVID-19 and Influenza Associated Acute Respiratory Distress Syndrome. J. Clin. Med. 2022, 11, 6237. [Google Scholar] [CrossRef]
- Bray, L.; Meznikova, K.; James, D.; Mason, P.; Rislan, R.; Shah, R.; Staniland, T.; Lillie, P.; Barlow, G.; Easom, N. 36 Misdiagnoses in the context of suspected pandemic influenza or COVID-19: A systematic review. Clin. Infect. Pract. 2022, 15, 100197. [Google Scholar] [CrossRef]
- Shi, C.; Wang, L.; Ye, J.; Gu, Z.; Wang, S.; Xia, J.; Xie, Y.; Li, Q.; Xu, R.; Lin, N. Predictors of mortality in patients with coronavirus disease 2019: A systematic review and meta-analysis. BMC Infect. Dis. 2021, 21, 663. [Google Scholar] [CrossRef]
- Musshafen, L.A.; El-Sadek, L.; Lirette, S.T.; Summers, R.L.; Compretta, C.; Dobbs, T.E. In-Hospital Mortality Disparities Among American Indian and Alaska Native, Black, and White Patients With COVID-19. JAMA Netw. Open 2022, 5, e224822. [Google Scholar] [CrossRef]
- American Indians and Alaska Natives Are Dying of COVID-19 at Shocking Rates. Available online: https://www.brookings.edu/research/american-indians-and-alaska-natives-are-dying-of-covid-19-at-shocking-rates/ (accessed on 2 March 2023).
- Bhimraj, A.; Morgan, R.L.; Shumaker, A.H.; Lavergne, V.; Baden, L.; Cheng, V.C.-C.; Edwards, K.M.; Gandhi, R.; Muller, W.J.; O’Horo, J.C.; et al. Infectious Diseases Society of America Guidelines on the Treatment and Management of Patients with COVID-19. Clin. Infect. Dis. 2020, 72, 1103–1104. [Google Scholar] [CrossRef]
- Inciardi, R.M.; Lupi, L.; Zaccone, G.; Italia, L.; Raffo, M.; Tomasoni, D.; Cani, D.S.; Cerini, M.; Farina, D.; Gavazzi, E.; et al. Cardiac Involvement in a Patient With Coronavirus Disease 2019 (COVID-19). JAMA Cardiol. 2020, 5, 819–824. [Google Scholar] [CrossRef] [Green Version]
- Llitjos, J.-F.; Leclerc, M.; Chochois, C.; Monsallier, J.-M.; Ramakers, M.; Auvray, M.; Merouani, K. High incidence of venous thromboembolic events in anticoagulated severe COVID-19 patients. J. Thromb. Haemost. 2020, 18, 1743–1746. [Google Scholar] [CrossRef]
- Silversides, J.A.; Major, E.; Ferguson, A.J.; Mann, E.E.; McAuley, D.F.; Marshall, J.C.; Blackwood, B.; Fan, E. Conservative fluid management or deresuscitation for patients with sepsis or acute respiratory distress syndrome following the resuscitation phase of critical illness: A systematic review and meta-analysis. Intensive Care Med. 2017, 43, 155–170. [Google Scholar] [CrossRef] [Green Version]
- Grohskopf, L.A.; Blanton, L.H.; Ferdinands, J.M.; Chung, J.R.; Broder, K.R.; Talbot, H.K.; Morgan, R.L.; Fry, A.M. Prevention and Control of Seasonal Influenza with Vaccines: Recommendations of the Advisory Committee on Immunization Practices—United States, 2022–2023 Influenza Season. MMWR Recomm. Rep. 2022, 71, 1–28. [Google Scholar] [CrossRef]
- Grapsa, E.; Adamos, G.; Andrianopoulos, I.; Tsolaki, V.; Giannakoulis, V.G.; Karavidas, N.; Giannopoulou, V.; Sarri, K.; Mizi, E.; Gavrielatou, E.; et al. Association Between Vaccination Status and Mortality Among Intubated Patients With COVID-19-Related Acute Respiratory Distress Syndrome. JAMA Netw. Open 2022, 5, e2235219. [Google Scholar] [CrossRef]
- Chow, E.J.; Doyle, J.D.; Uyeki, T.M. Influenza virus-related critical illness: Prevention, diagnosis, treatment. Crit. Care 2019, 23, 214. [Google Scholar] [CrossRef] [Green Version]
- CDC. Routine and Influenza Immunization Services During the COVID-19 Pandemic: Interim Guidance. Available online: https://www.cdc.gov/vaccines/pandemic-guidance/index.html#:~:text=For%20the%202021%E2%80%932022%20influenza,during%20the%20COVID%2D19%20pandemic (accessed on 2 March 2023).
- Zhou, Y.; Fu, X.; Liu, X.; Huang, C.; Tian, G.; Ding, C.; Wu, J.; Lan, L.; Yang, S. Use of corticosteroids in influenza-associated acute respiratory distress syndrome and severe pneumonia: A systemic review and meta-analysis. Sci. Rep. 2020, 10, 3044. [Google Scholar] [CrossRef] [Green Version]
- Recovery Collaborative Group; Horby, P.; Lim, W.S.; Emberson, J.R.; Mafham, M.; Bell, J.L.; Linsell, L.; Staplin, N.; Brightling, C.; Ustianowski, A.; et al. Dexamethasone In Hospitalized Patients With Covid-19. N. Engl. J. Med. 2021, 384, 693–704. [Google Scholar] [CrossRef] [PubMed]


| Characteristics | C-ARDS, n (%) | I-ARDS, n (%) | p Value |
|---|---|---|---|
| n = 106,720 | 103,845 (97.3) | 2875 (2.70) | |
| Gender (%) | <0.001 | ||
| Female | 40,720 (39.2) | 1400 (48.6) | |
| Male | 63,125 (60.7) | 1475 (51.3) | |
| Mean Age Years (SD 1) | |||
| Female | 64.34 (14.5) | 58.66 (17.1) | |
| Male | 63.56 (13.8) | 54.91 (14.0) | |
| AGE Groups Years (%) | <0.001 | ||
| ≥18–29 | 1850 (1.8) | 130 (4.5) | |
| 30–49 | 14,575 (14.0) | 744 (25.9) | |
| 50–69 | 48,366 (46.5) | 1369 (47.6) | |
| ≥70 | 39,053 (37.6) | 630 (21.9) | |
| RACE (%) | <0.001 | ||
| White | 43,727 (43.6) | 1748 (62.4) | |
| Asian or Pacific Islander | 4365 (4.4) | 70 (2.5) | |
| Black | 18,339 (18.2) | 494 (17.7) | |
| Hispanic | 26,650 (26.5) | 378 (13.5) | |
| Native American | 2039 (2.03) | 64 (2.3) | |
| Other | 5165 (5.2) | 40 (1.4) | |
| MEDIAN HOUSEHOLD INCOME (%) | 0.118 | ||
| ≤USD 49,999 | 34,801 (34.1) | 969 (34.5) | |
| USD 50,000–64,999 | 27,869 (27.3) | 824 (29.3) | |
| USD 65,000–85,999 | 22,870 (22.4) | 517 (18.3) | |
| ≥USD 86,000 | 16,490 (16.1) | 500 (17.7) | |
| INSURANCE STATUS (%) | <0.001 | ||
| Medicaid | 15,565 (15.0) | 579 (20.1) | |
| Medicare | 51,376 (49.5) | 1211 (42.0) | |
| No charge | 190 (0.18) | 25 (8.9) | |
| Other | 4835 (4.7) | 76 (2.6) | |
| Private Insurance | 28,205 (27.2) | 814 (28.3) | |
| Self-pay | 3444 (3.3) | 170 (5.9) | |
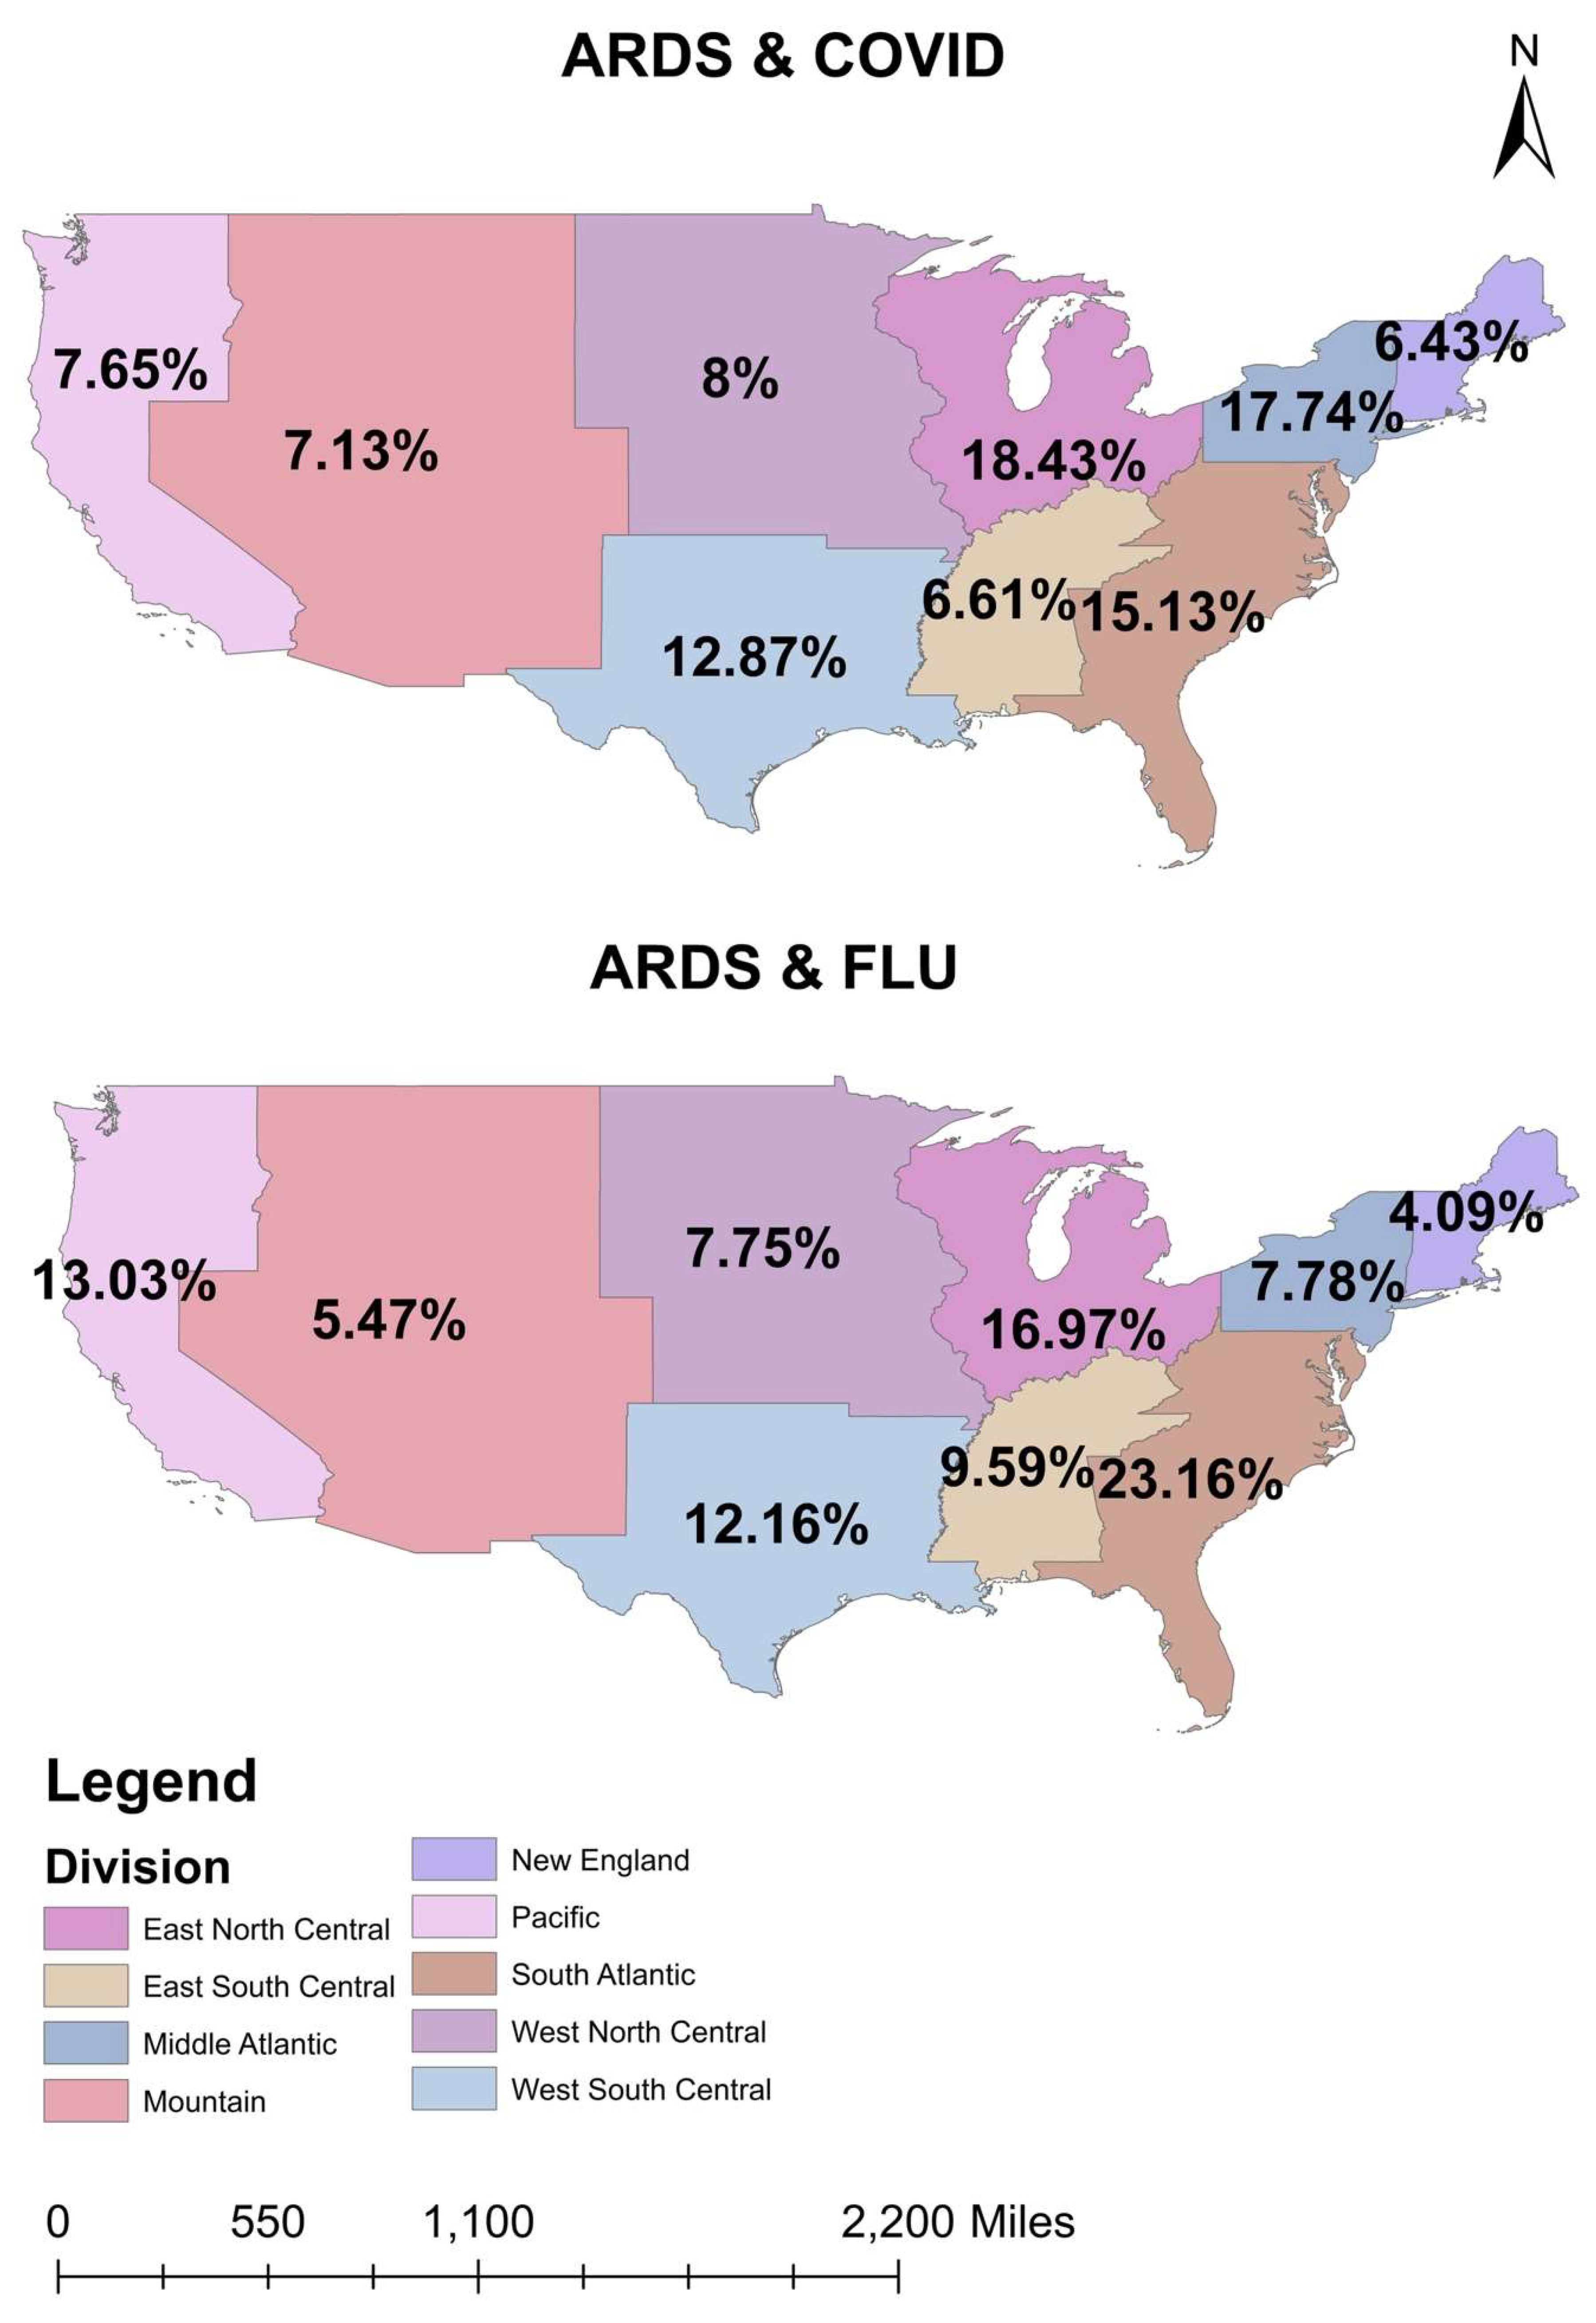
| HOSPITAL DIVISION (%) | <0.001 | ||
| East North Central | 16,095 (15.4) | 469 (16.3) | |
| East South Central | 5434 (5.2) | 265 (9.2) | |
| Middle Atlantic | 16,677 (16.0) | 215 (7.5) | |
| Mountain | 9451 (9.1) | 151 (5.2) | |
| New England | 4964 (4.8) | 113 (4.0) | |
| Pacific | 12,435 (11.9) | 360 (12.5) | |
| South Atlantic | 17,459 (16.8) | 640 (22.2) | |
| West North Central | 7984 (7.7) | 214 (7.5) | |
| West South Central | 13,346 (12.8) | 336 (15.4) | |
| HOSPITAL BED SIZE (%) | 0.510 | ||
| Large | 54,390 (52.4) | 1555 (54.0) | |
| Medium | 28,500 (27.4) | 795 (27.6) | |
| Small | 20,955 (20.2) | 525 (18.2) | |
| HOSPITAL TEACHING STATUS (%) | 0.131 | ||
| Rural | 6330 (6.09) | 220 (7.7) | |
| Urban nonteaching | 15,210 (14.6) | 470 (16.3) | |
| Urban teaching | 82,305 (79.2) | 2185 (76.0) | |
| COMORBIDITIES (%) | |||
| CAD 2 | 16,770 (83.8) | 525 (81.7) | 0.175 |
| Myocardial Infarction | 3455 (3.3) | 110 (3.8) | 0.511 |
| Hypertension | 69,689 (67.1) | 1871 (65.0) | 0.298 |
| Diabetes Mellitus | 49,944 (48.0) | 1131 (39.4) | <0.001 |
| Cancer | 4000 (3.9) | 170 (5.9) | 0.01 |
| Obesity | 39,540 (38.0) | 820 (28.5) | <0.001 |
| Drug Abuse | 1870 (1.8) | 165 (5.7) | <0.001 |
| Smoking | 22,425 (21.5) | 1010 (35.1) | <0.001 |
| Alcohol | 2214 (2.1) | 156 (5.4) | <0.001 |
| Chronic Pulmonary Disease | 23,177 (22.3) | 978 (34.0) | <0.001 |
| HIV 3 | 534 (0.5) | 16 (0.5) | 0.982 |
| Peripheral Vascular Disease | 4469 (4.3) | 101 (3.5) | 0.334 |
| CKD 4 | 13,330 (12.8) | 255 (8.9) | 0.004 |
| Hypothyroidism | 11,760 (11.3) | 350 (12.1) | 0.526 |
| Autoimmune | 3394 (3.3) | 151 (5.2) | 0.010 |
| Depression | 9190 (8.8) | 291 (10.0) | 0.303 |
| Dementia | 7002 (6.7) | 102 (3.5) | 0.001 |
| Variable | C-ARDS (%) | I-ARDS (%) | p Value |
|---|---|---|---|
| n = 106,720 | 103,845 (97.30) | 2875 (2.70) | -- |
| In-hospital mortality (N = 52,800) | 52,190 (50.25) | 610 (21.21) | <0.001 |
| Adjusted odds ratio 1 | 4.07 (95% CI 3.28–5.09) | ||
| Acute Liver Failure | 5770 (5.55) | 180 (6.26) | 0.429 |
| Adjusted odds ratio 1 | 0.86 (95% CI 0.62–1.24) | ||
| Sudden Cardiac Arrest | 10,221 (9.84) | 229 (8.00) | 0.258 |
| Adjusted odds ratio 1 | 1.19 (95% CI 0.88–1.64) | ||
| Vasopressor requirement | 18,079 (17.41) | 321 (11.13) | 0.004 |
| Adjusted odds ratio 1 | 1.45 (95% CI 1.12–1.92) | ||
| Mechanical Circulatory Support | 2696 (2.59) | 219 (7.65) | <0.001 |
| Adjusted odds ratio 1 | 4.68 (95% CI 3.30–6.78) | ||
| Acute Kidney Injury | 60,825 (58.57) | 1520 (52.86) | 0.703 |
| Adjusted odds ratio 1 | 0.96 (95% CI 0.81–1.15) | ||
| VTE 2 | 12,230 (11.77) | 315 (10.95) | 0.382 |
| Adjusted odds ratio 1 | 1.12 (95% CI 0.86–1.49) | ||
| Cardiogenic shock | 3013 (2.89) | 127 (4.52) | 0.023 |
| Adjusted odds ratio 1 | 0.60 (95% CI 0.41–0.93) | ||
| Hemodialysis | 17,630 (16.97) | 525 (18.26) | 0.119 |
| Adjusted odds ratio 1 | 0.83 (95% CI 0.67–1.04) | ||
| Invasive Mechanical Ventilation | 61,955 (59.66) | 1390 (48.34) | <0.001 |
| Adjusted odds ratio 1 | 1.53 (95% CI 1.29–1.81) | ||
| Non-Invasive Mechanical Ventilation | 17,280 (16.64) | 545 (18.95) | 0.049 |
| Adjusted odds ratio 1 | 0.80 (95% CI 0.64–1.00) | ||
| Mean total hospitalization charge (USD) | USD 314,910.79 | USD 293,528.42 | 0.203 |
| Adjusted total charge 1 | USD 22,379.6 higher | ||
| Mean length of stay (days) | 19.11 | 14.53 | <0.001 |
| Adjusted length of stay 1 | 4.62 days higher | ||
| Disposition | <0.001 | ||
| Routine | 15,974 (15.38) | 811 (28.17) | |
| Home Health Care | 9645 (9.29) | 350 (12.17) | |
| Against Medical Advice | 383 (0.37) | 37 (1.21) | |
| Transfer other (SNF/LTAC) | 20,474 (19.71) | 801 (28.00) | |
| Transfer to short-term hospital | 5090 (4.90) | 265 (9.21) | |
| Died in Hospital | 52,190 (50.27) | 610 (21.21) | |
| Discharged alive unknown destination | 55 (0.05) | 0 (0) |
| Variable | C-ARDS (%) | I-ARDS (%) | p Value |
|---|---|---|---|
| n = 5750 | 2875 | 2875 | -- |
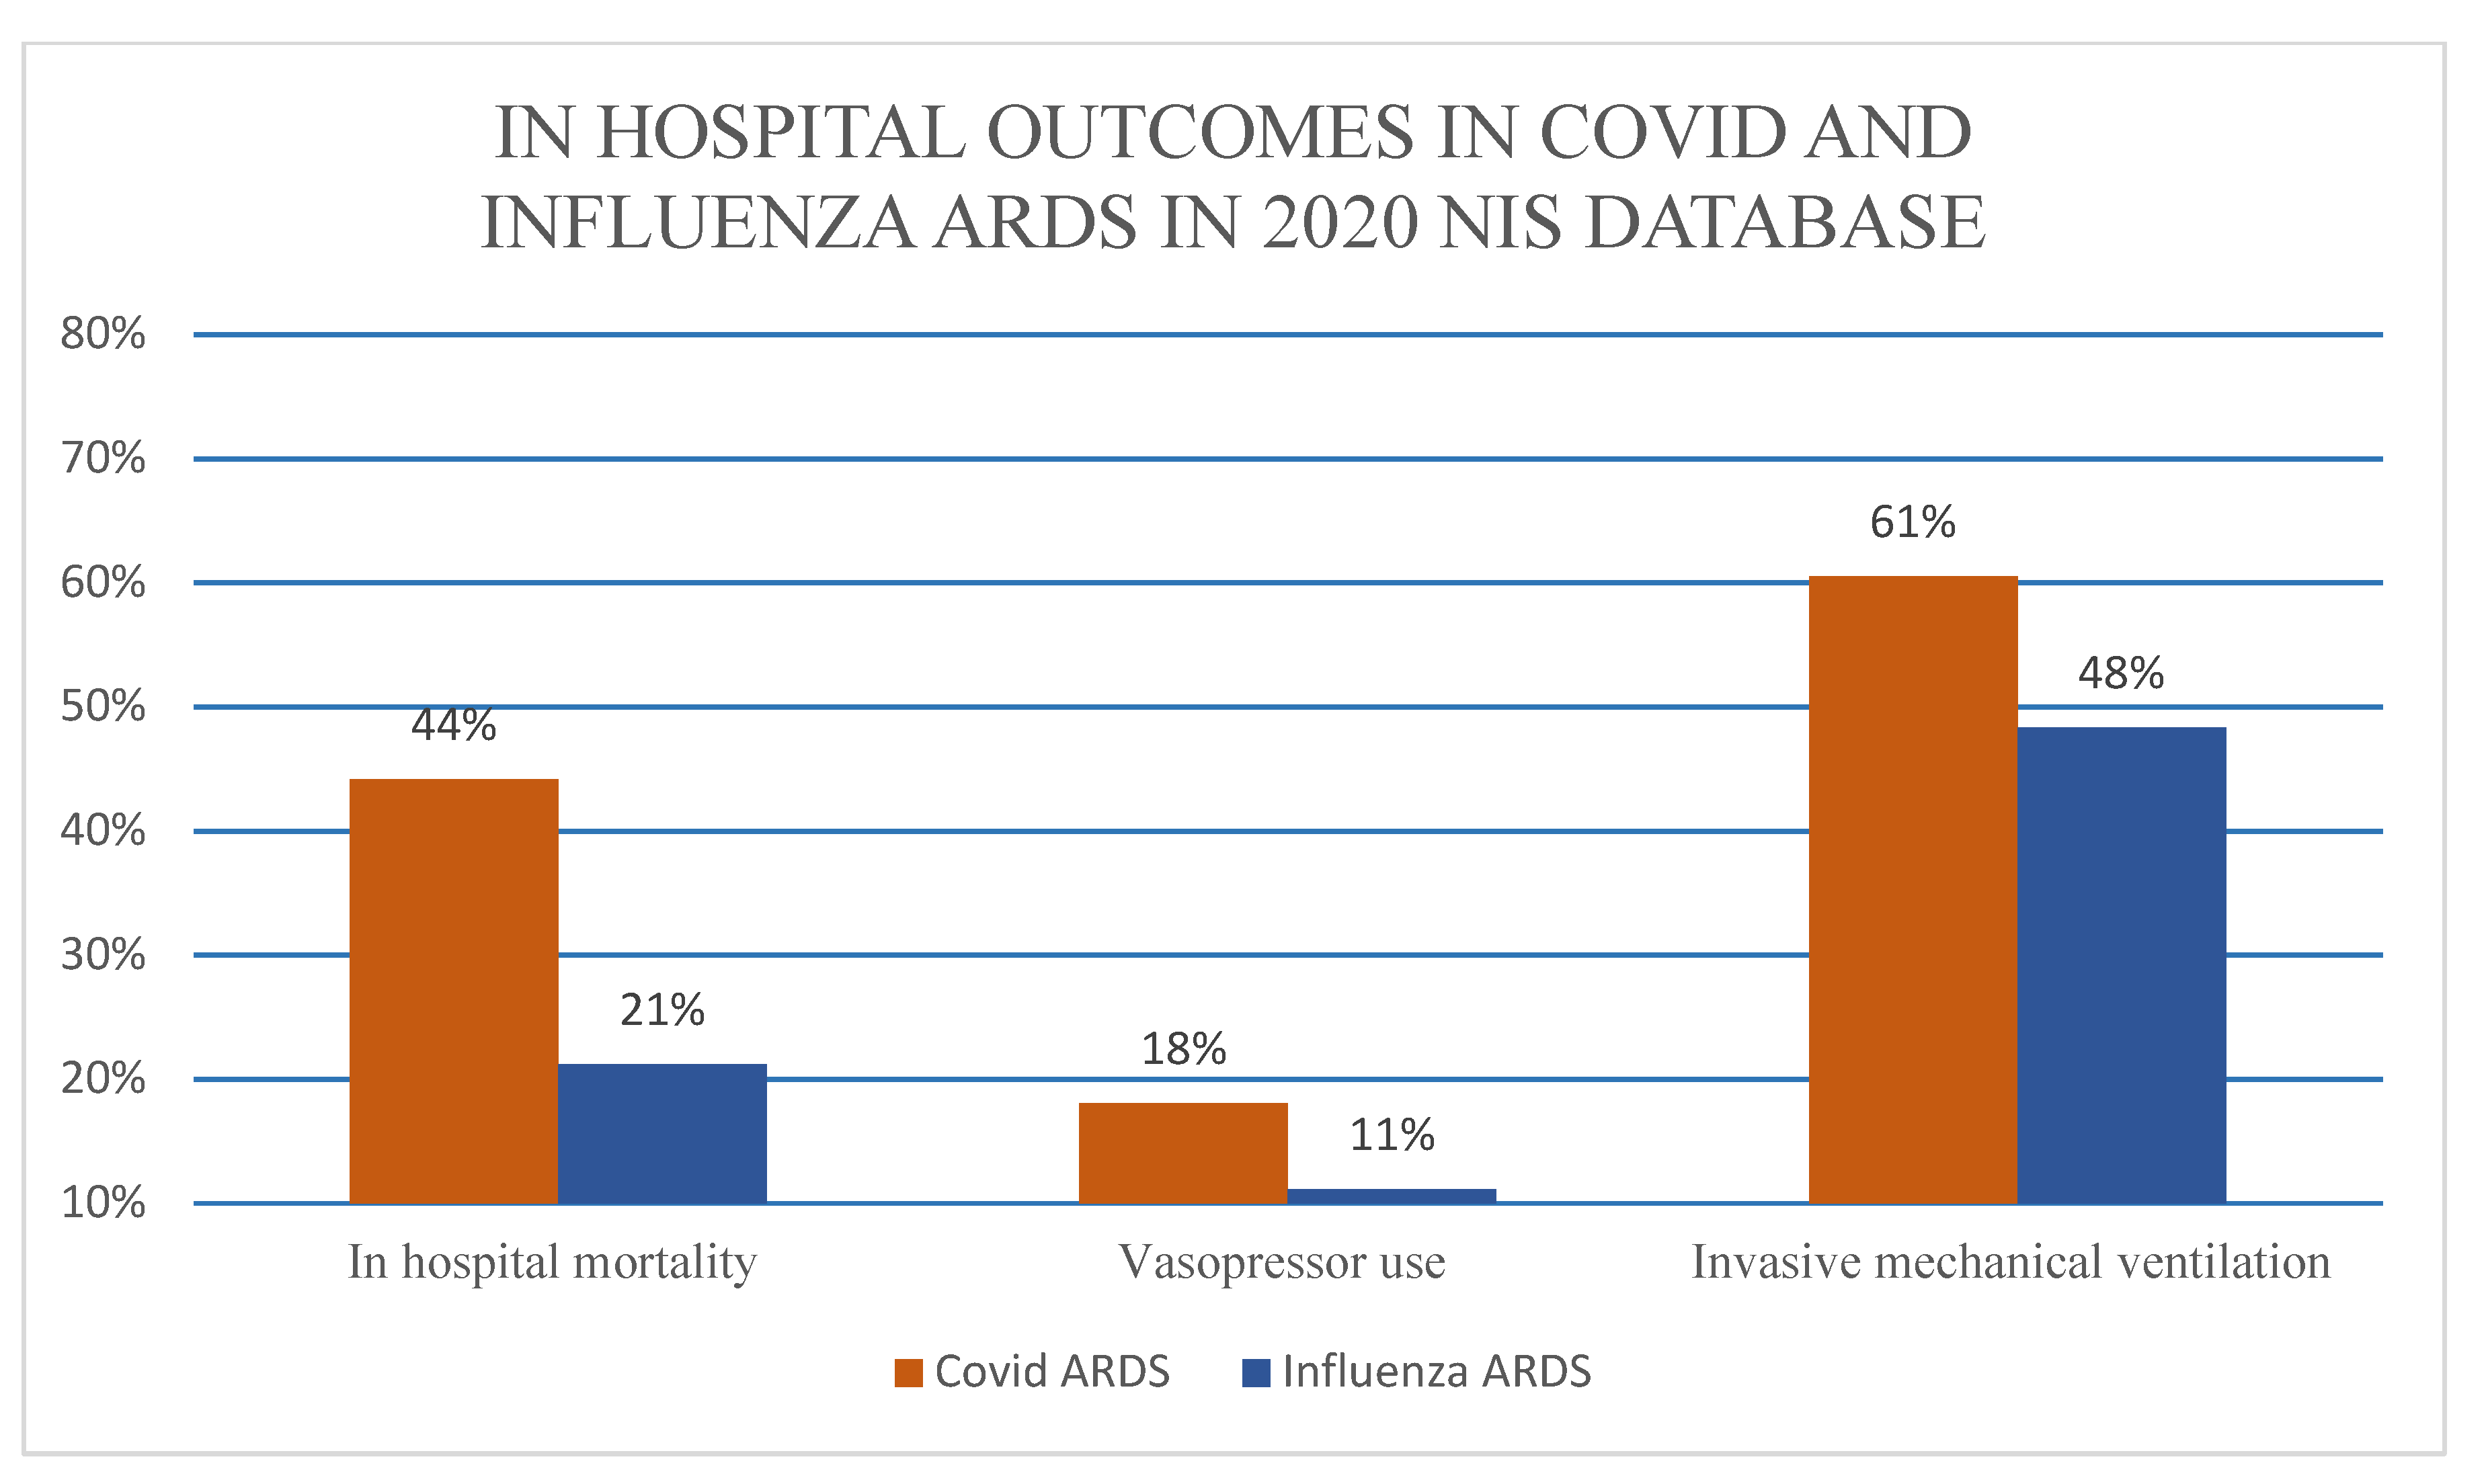
| In-hospital mortality (N = 1880) | 1270 (44.17) | 610 (21.21) | <0.001 |
| Adjusted odds ratio 1 | 3.21 (95% CI 2.46–4.22) | ||
| Acute Liver Failure | 215 (7.47) | 180 (6.26) | 0.449 |
| Adjusted odds ratio 1 | 1.19 (95% CI 0.75–1.91) | ||
| Sudden Cardiac Arrest | 285 (9.91) | 229 (8.00) | 0.254 |
| Adjusted odds ratio 1 | 1.27 (95% CI 0.84–1.93) | ||
| Vasopressor requirement | 520 (18.08) | 321 (11.13) | 0.003 |
| Adjusted odds ratio 1 | 1.68 (95% CI 1.18–2.41) | ||
| Mechanical Circulatory Support | 115 (4.00) | 219 (7.65) | 0.043 |
| Adjusted odds ratio 1 | 0.54 (95% CI 0.30–0.98) | ||
| Acute Kidney Injury | 1525 (53.04) | 1520 (52.86) | 0.955 |
| Adjusted odds ratio 1 | 0.99 (95% CI 0.77–1.27) | ||
| Venous Thromboemolism | 330 (11.47) | 315 (10.95) | 0.770 |
| Adjusted odds ratio 1 | 1.05 (95% CI 0.72–1.54) | ||
| Cardiogenic shock | 105 (3.65) | 127 (4.52) | 0.516 |
| Adjusted odds ratio 1 | 0.81 (95% CI 0.43–1.51) | ||
| Hemodialysis | 445 (15.47) | 525 (18.26) | 0.148 |
| Adjusted odds ratio 1 | 0.78 (95% CI 0.56–1.08) | ||
| Invasive Mechanical Ventilation | 1740 (60.52) | 1390 (48.34) | <0.001 |
| Adjusted odds ratio 1 | 1.63 (95% CI 1.27–2.08) | ||
| Non-Invasive Mechanical Ventilation | 385 (13.39) | 545 (18.95) | 0.024 |
| Adjusted odds ratio 1 | 0.68 (95% CI 0.49–0.95) | ||
| Mean total hospitalization charge (USD) | USD 331,233.49 Adjusted total charge 1 | USD 293,528.42 = USD 46,097 higher | 0.143 |
| Mean length of stay (days) | 18.79 Adjusted length of stay 1 | 14.53 = 3.94 days higher | <0.001 |
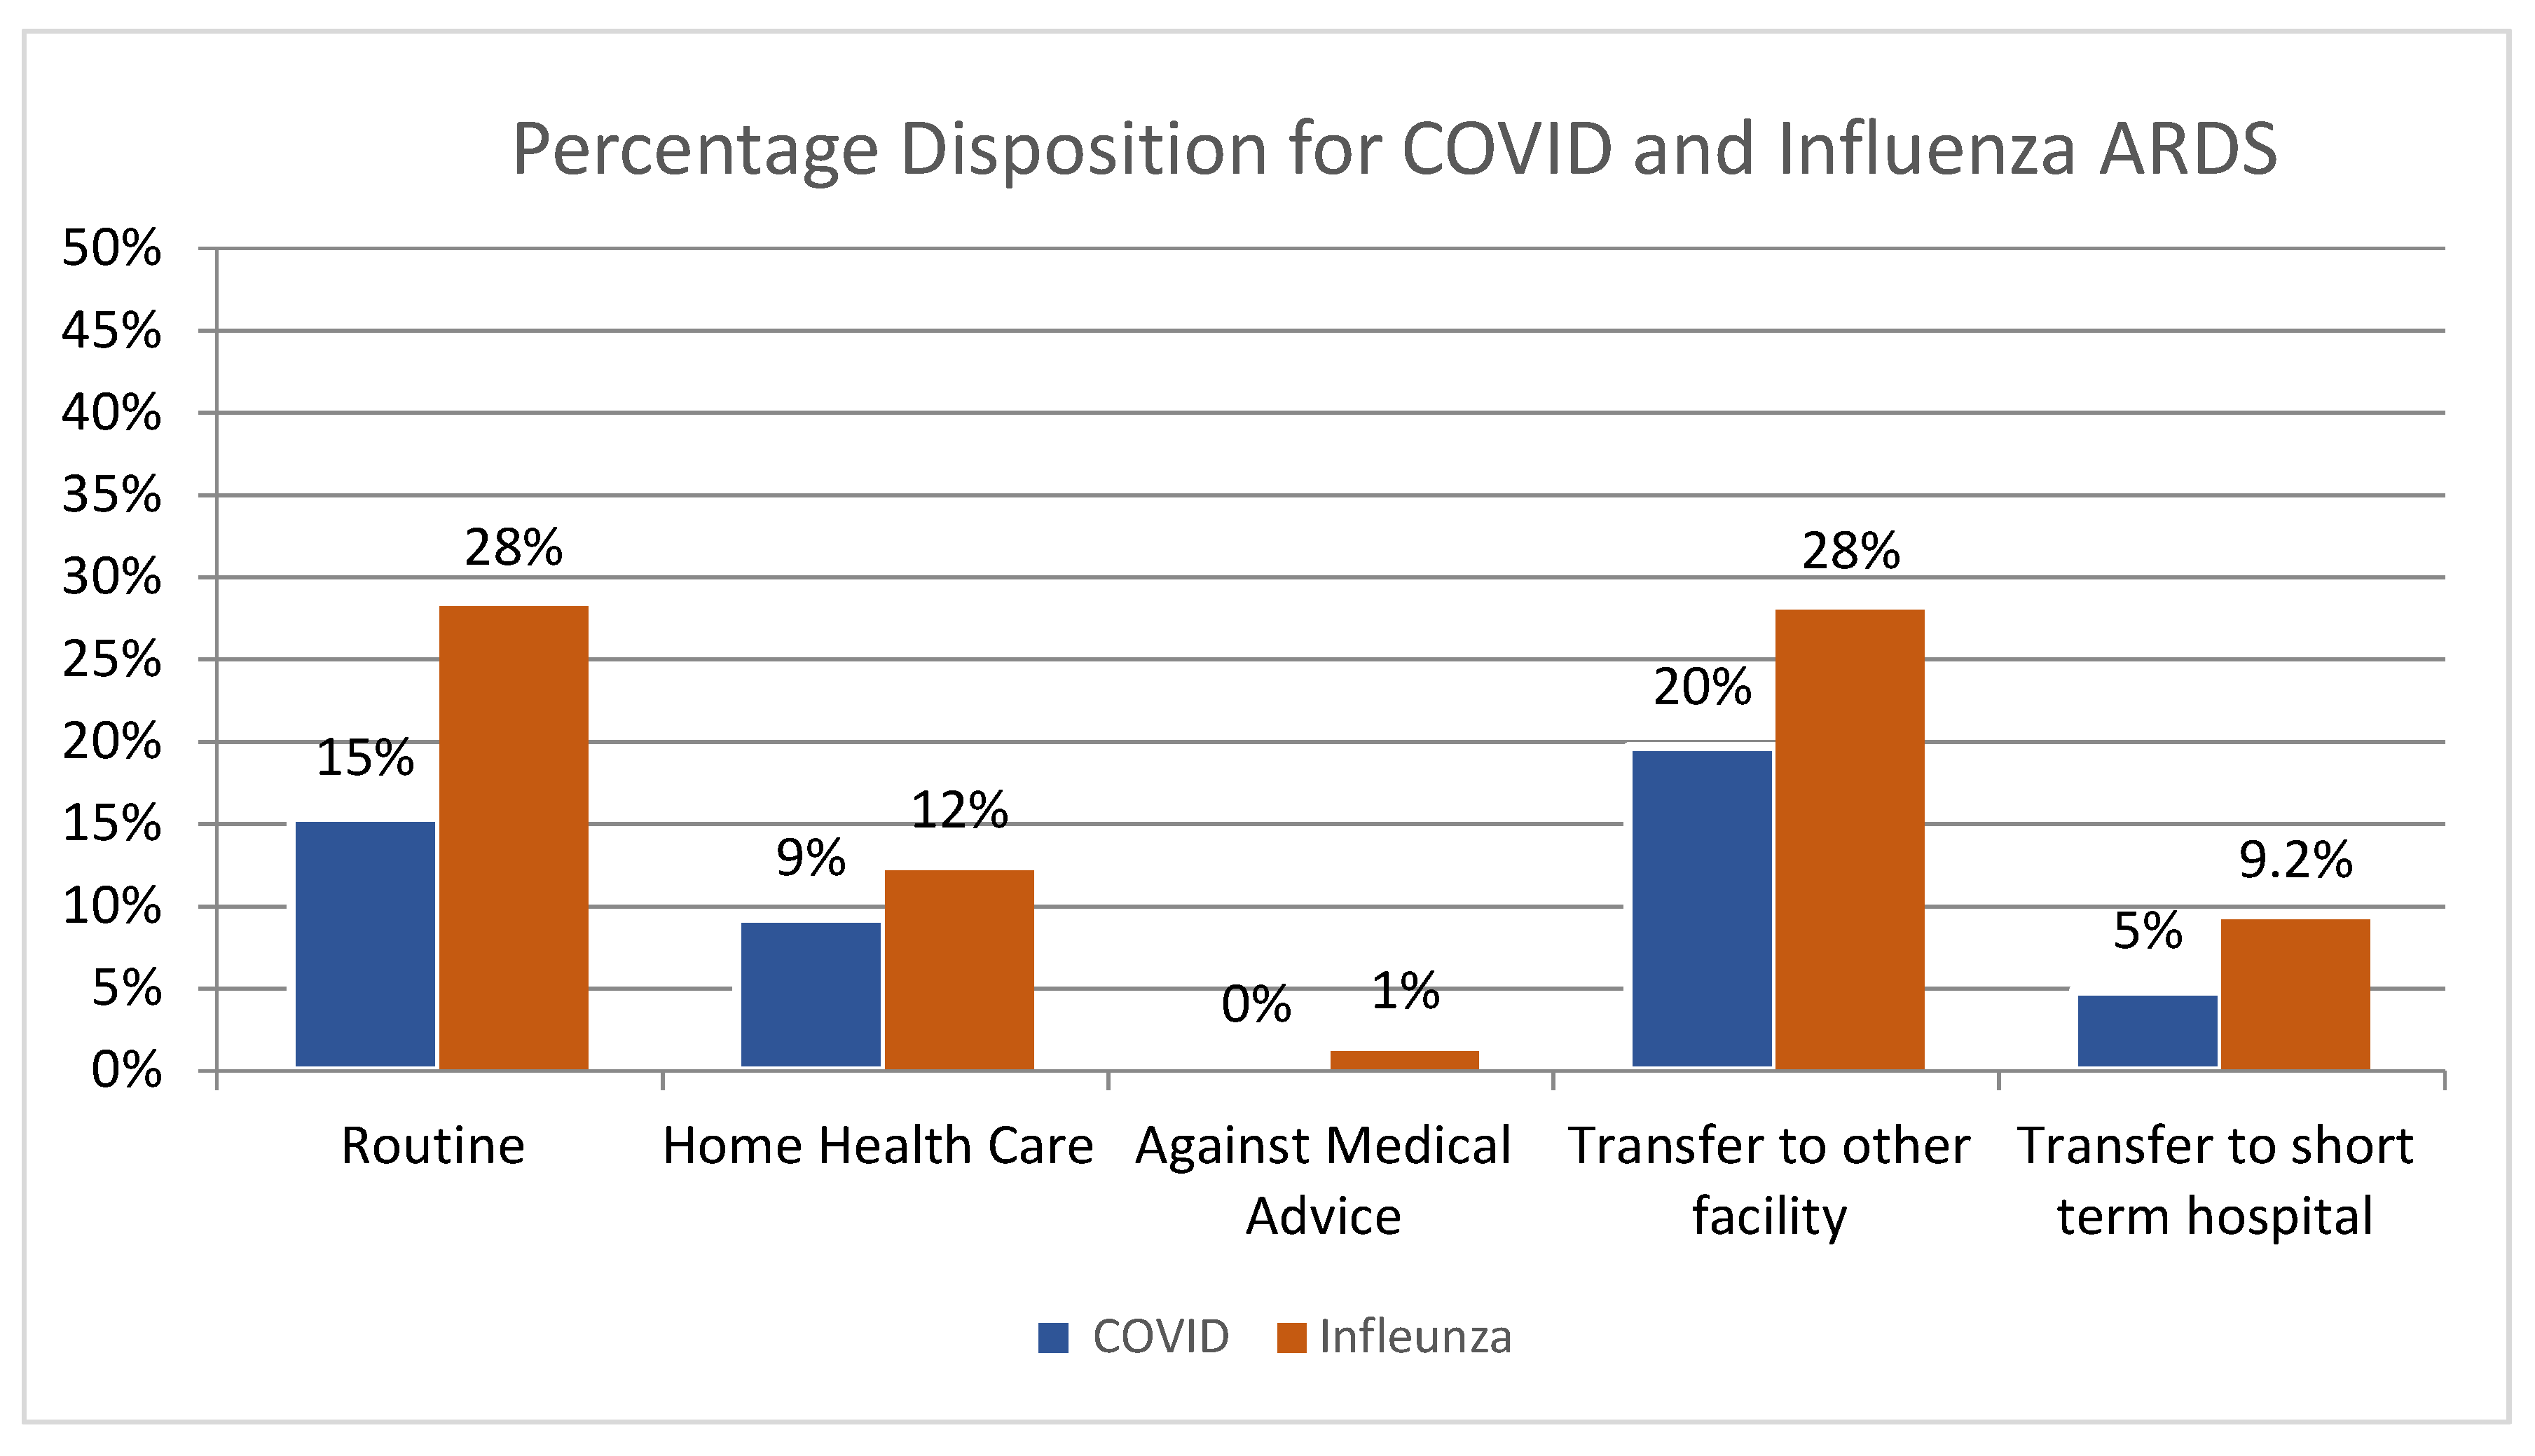
| Disposition | <0.001 | ||
| Routine | 590 (20.52) | 811 (28.17) | |
| Home Health Care | 290 (10.08) | 350 (12.17) | |
| Against Medical Advice | 25 (0.86) | 37 (1.21) | |
| Transfer other | 485 (16.86) | 801 (28.00) | |
| Transfer to short-term hospital | 215 (7.47) | 265 (9.21) |
Disclaimer/Publisher’s Note: The statements, opinions and data contained in all publications are solely those of the individual author(s) and contributor(s) and not of MDPI and/or the editor(s). MDPI and/or the editor(s) disclaim responsibility for any injury to people or property resulting from any ideas, methods, instructions or products referred to in the content. |
© 2023 by the authors. Licensee MDPI, Basel, Switzerland. This article is an open access article distributed under the terms and conditions of the Creative Commons Attribution (CC BY) license (https://creativecommons.org/licenses/by/4.0/).
Share and Cite
Virk, S.; Quazi, M.A.; Nasrullah, A.; Shah, A.; Kudron, E.; Chourasia, P.; Javed, A.; Jain, P.; Gangu, K.; Cheema, T.; et al. Comparing Clinical Outcomes of COVID-19 and Influenza-Induced Acute Respiratory Distress Syndrome: A Propensity-Matched Analysis. Viruses 2023, 15, 922. https://doi.org/10.3390/v15040922
Virk S, Quazi MA, Nasrullah A, Shah A, Kudron E, Chourasia P, Javed A, Jain P, Gangu K, Cheema T, et al. Comparing Clinical Outcomes of COVID-19 and Influenza-Induced Acute Respiratory Distress Syndrome: A Propensity-Matched Analysis. Viruses. 2023; 15(4):922. https://doi.org/10.3390/v15040922
Chicago/Turabian StyleVirk, Shiza, Mohammed A. Quazi, Adeel Nasrullah, Aaisha Shah, Evan Kudron, Prabal Chourasia, Anam Javed, Priyanka Jain, Karthik Gangu, Tariq Cheema, and et al. 2023. "Comparing Clinical Outcomes of COVID-19 and Influenza-Induced Acute Respiratory Distress Syndrome: A Propensity-Matched Analysis" Viruses 15, no. 4: 922. https://doi.org/10.3390/v15040922