
Comparative Epidemiology of Rabbit Haemorrhagic Disease Virus Strains from Viral Sequence Data
 , , , and
Abstract
:1. Introduction
2. Methods
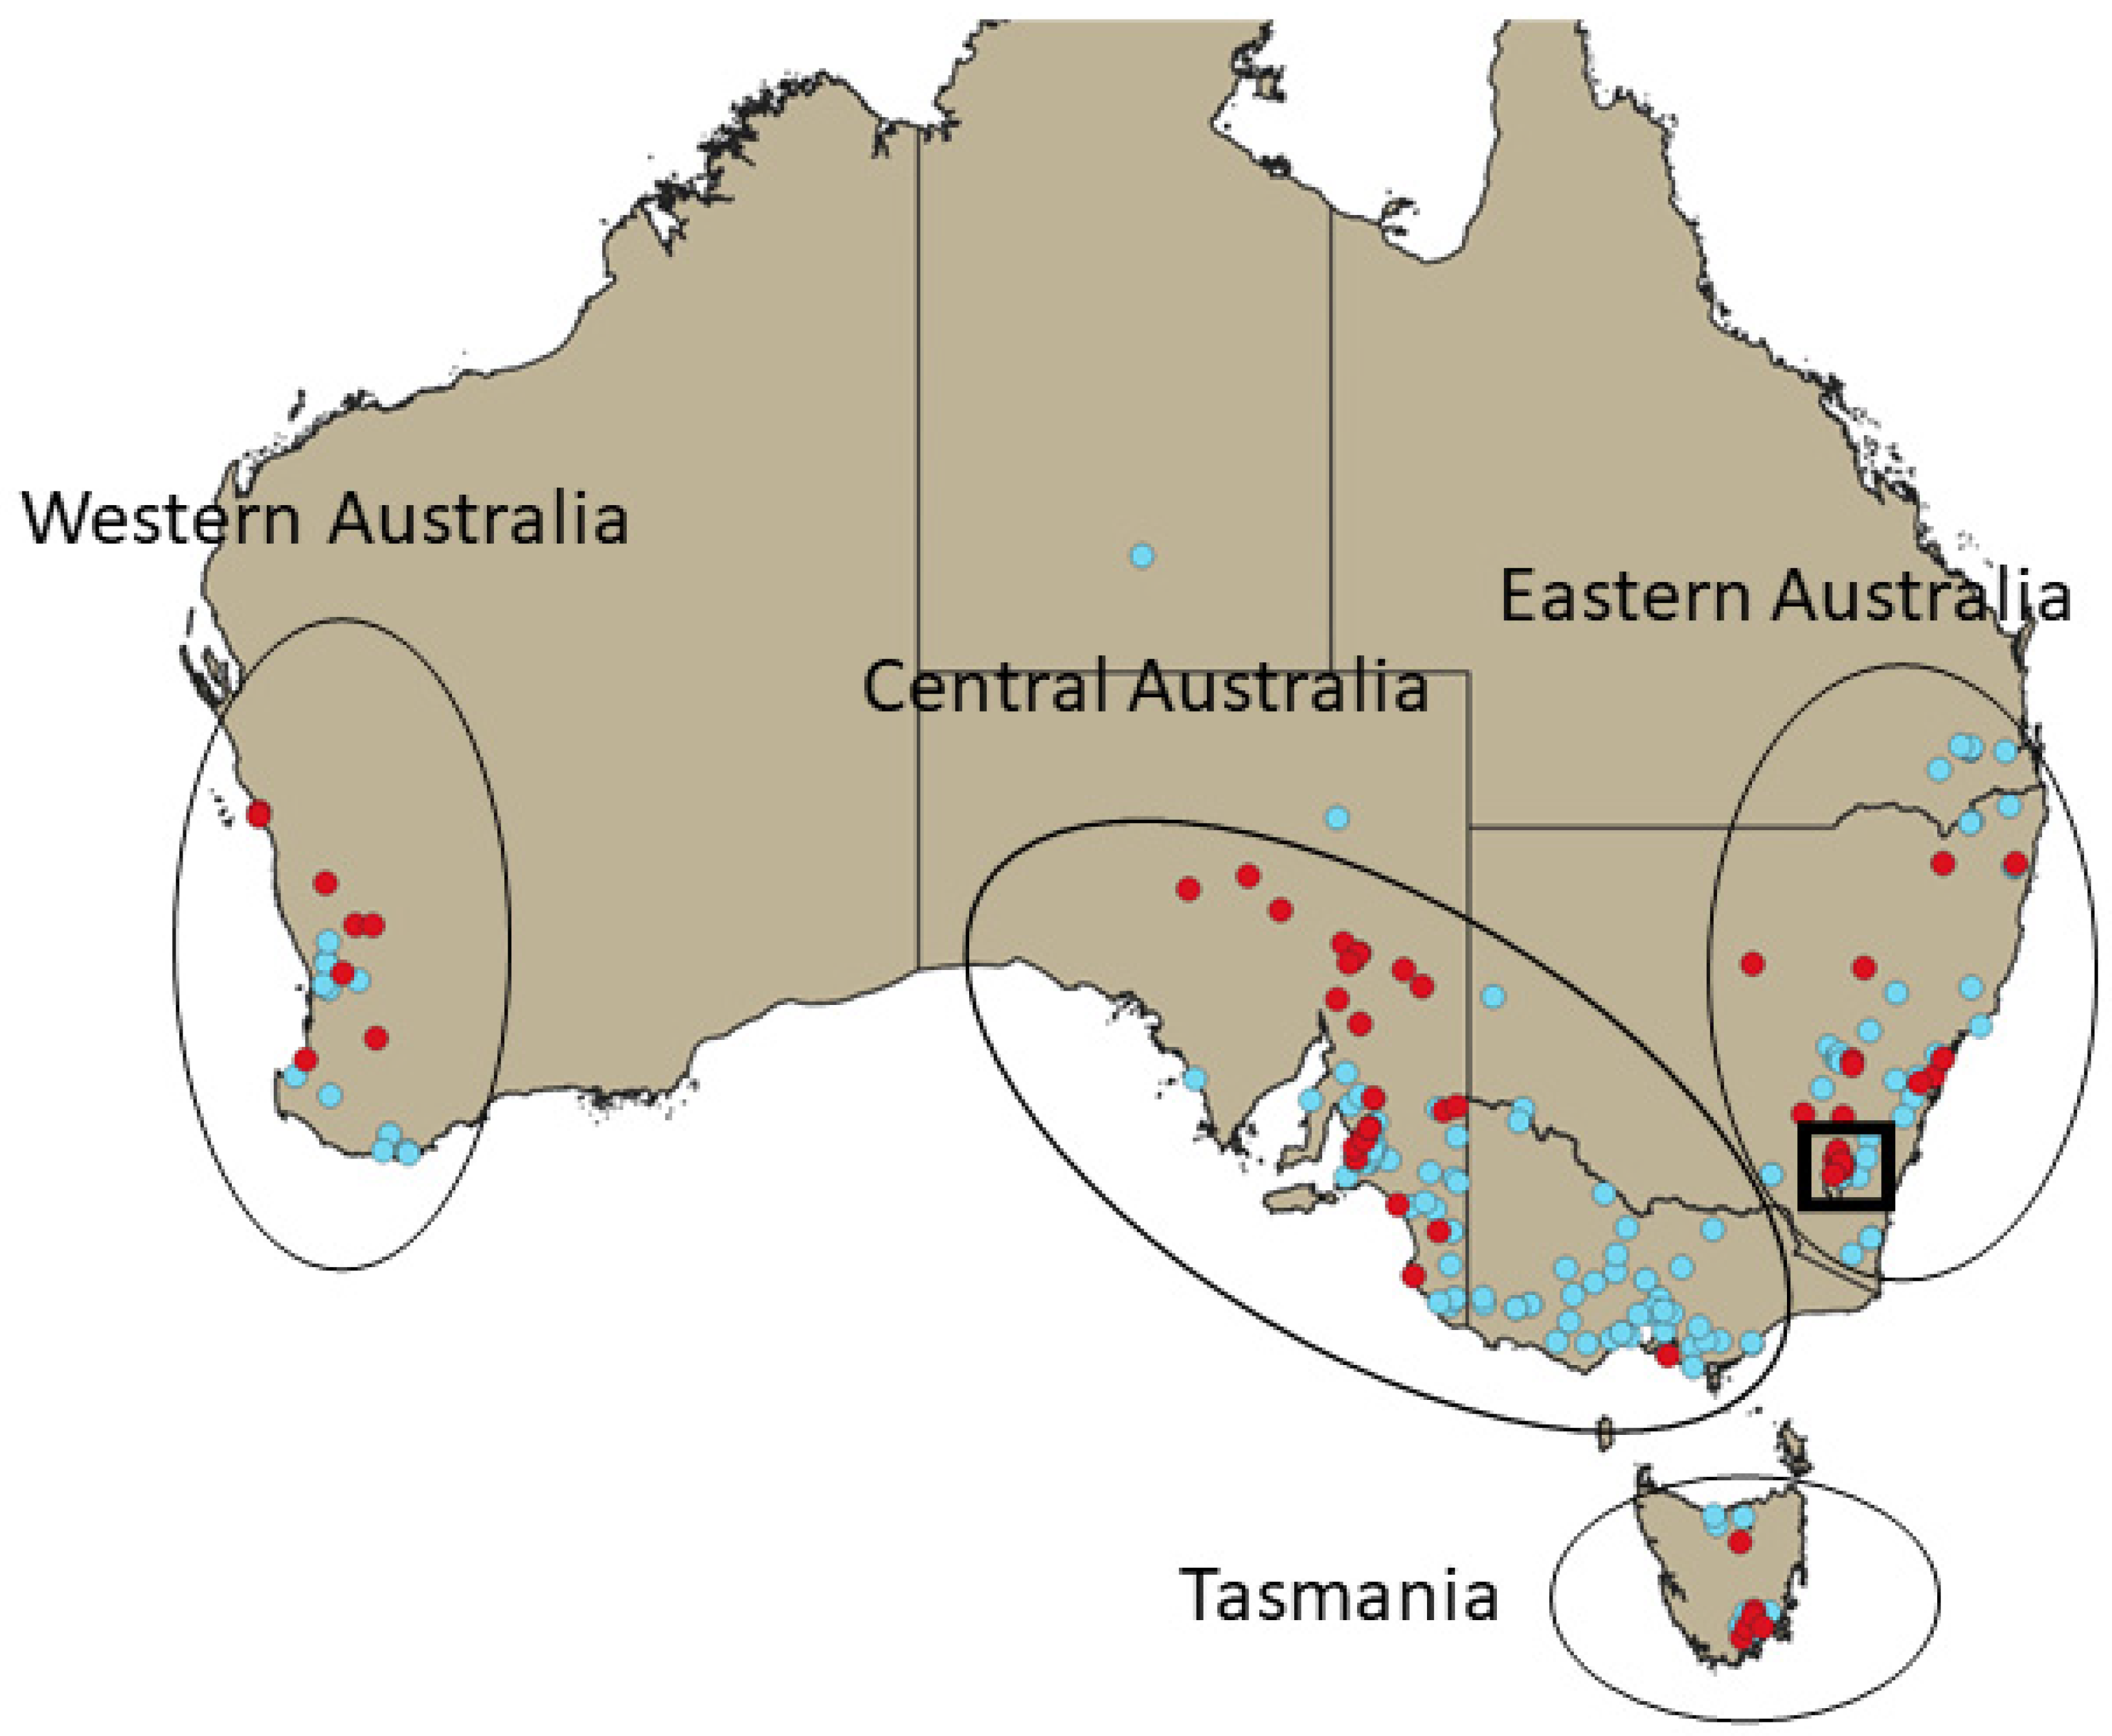
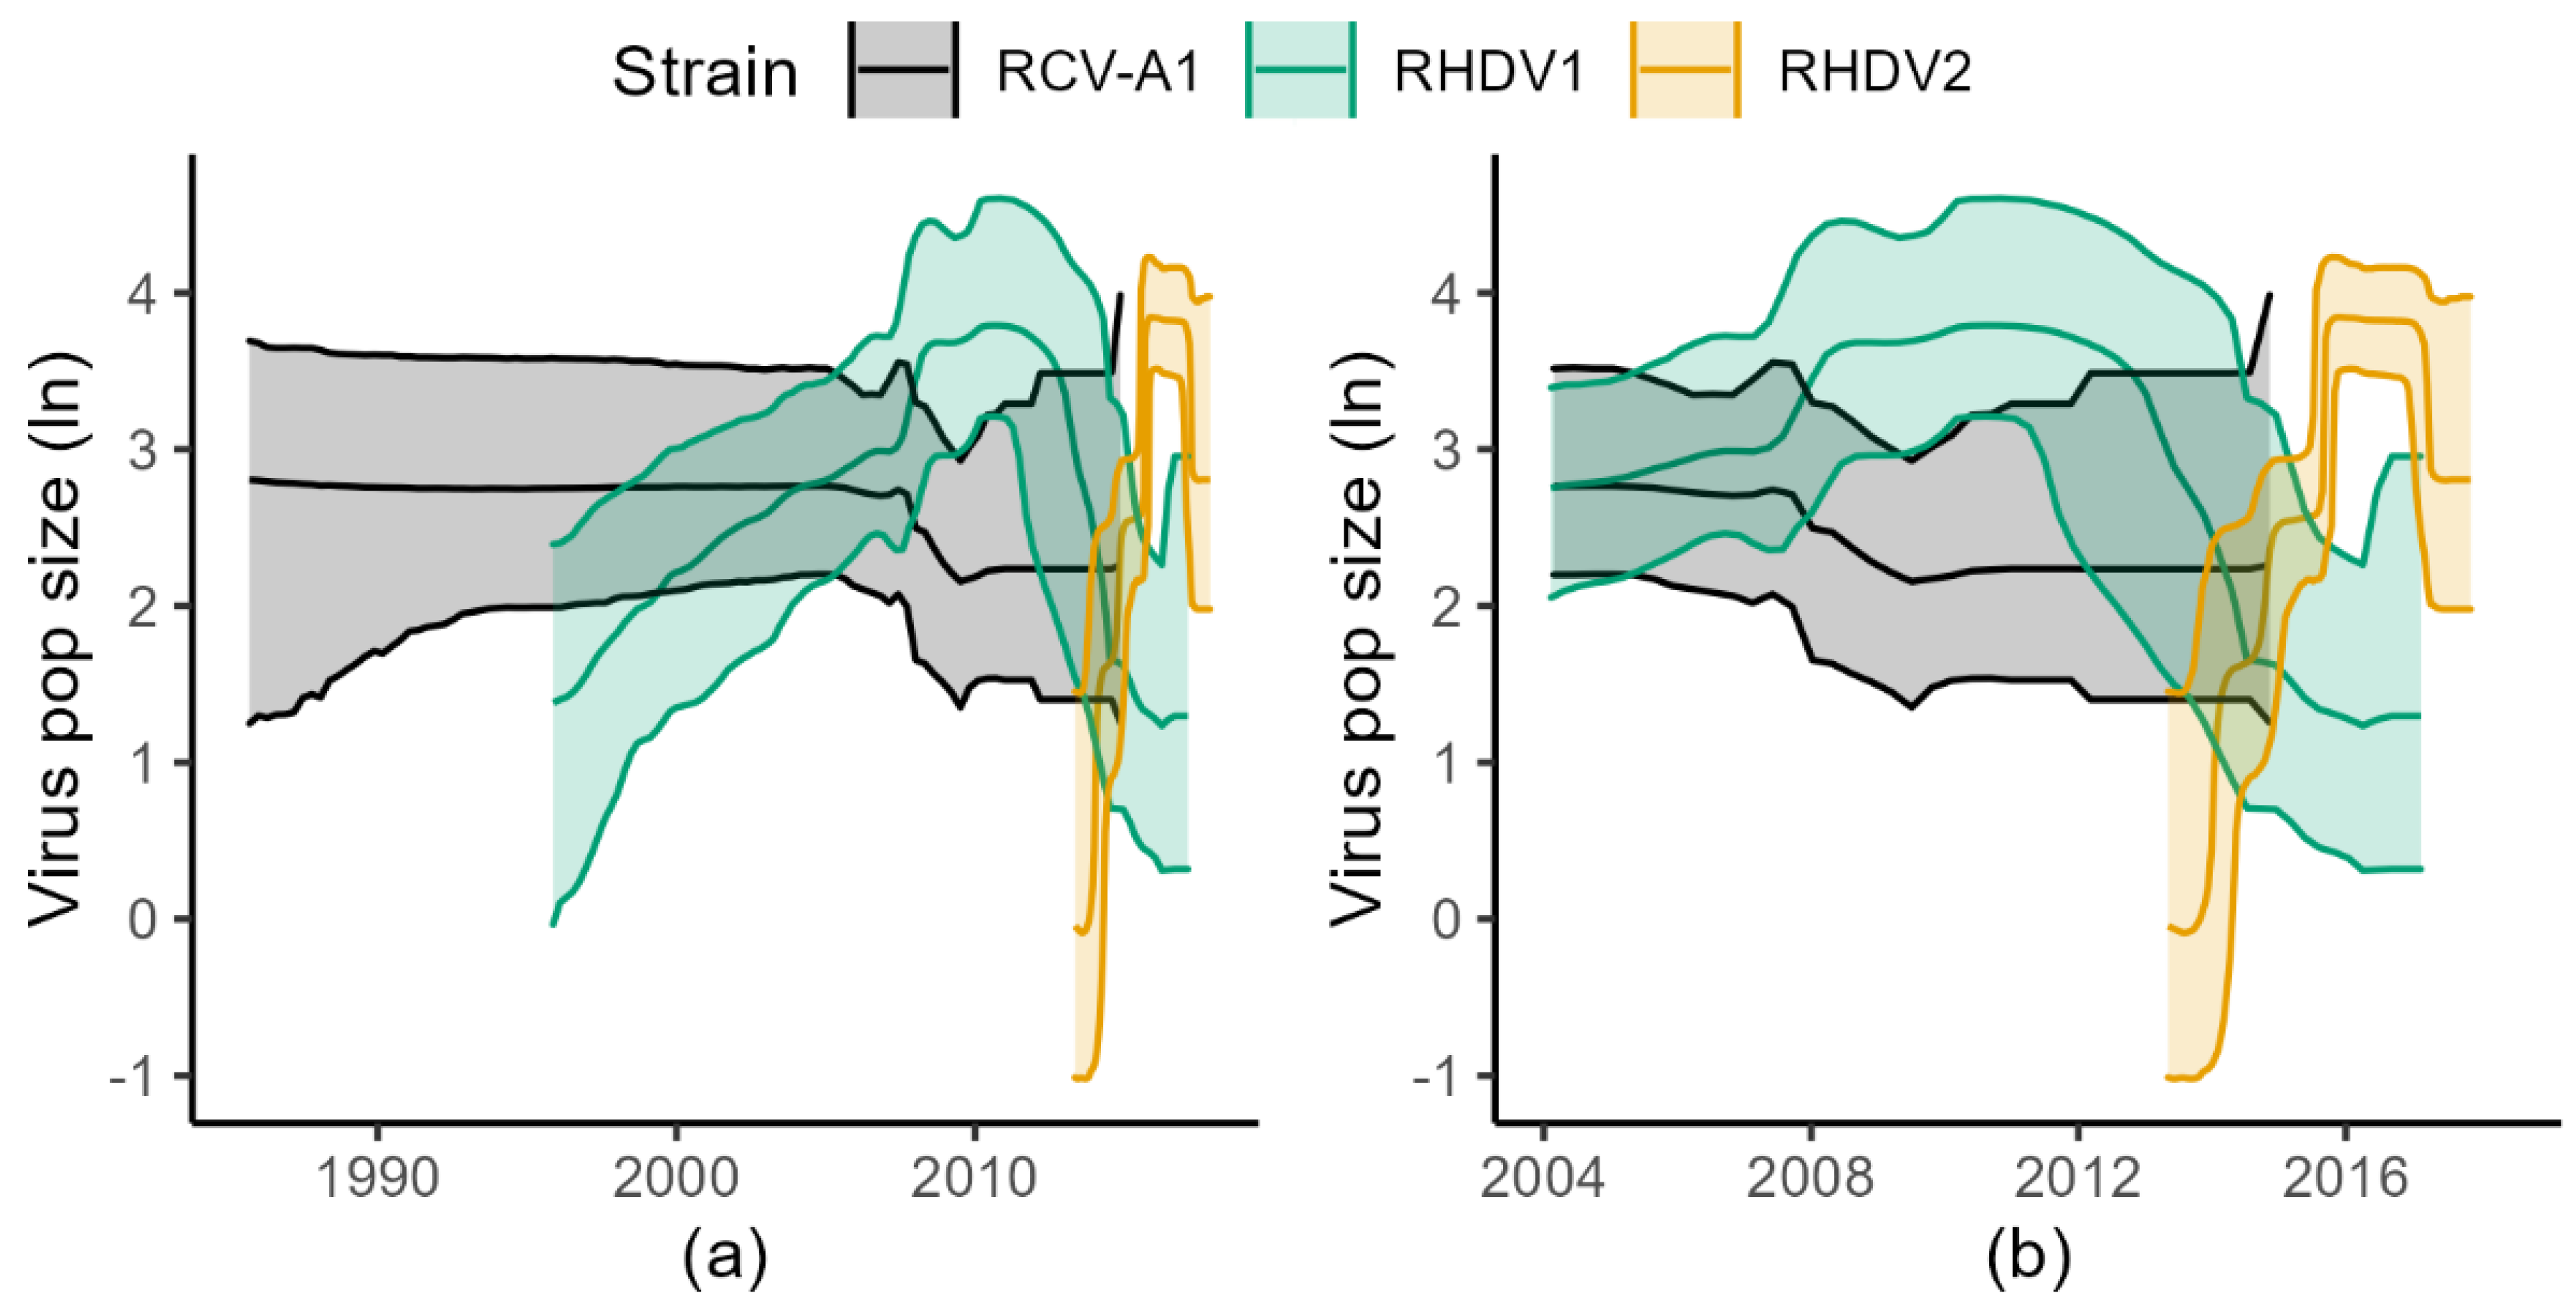
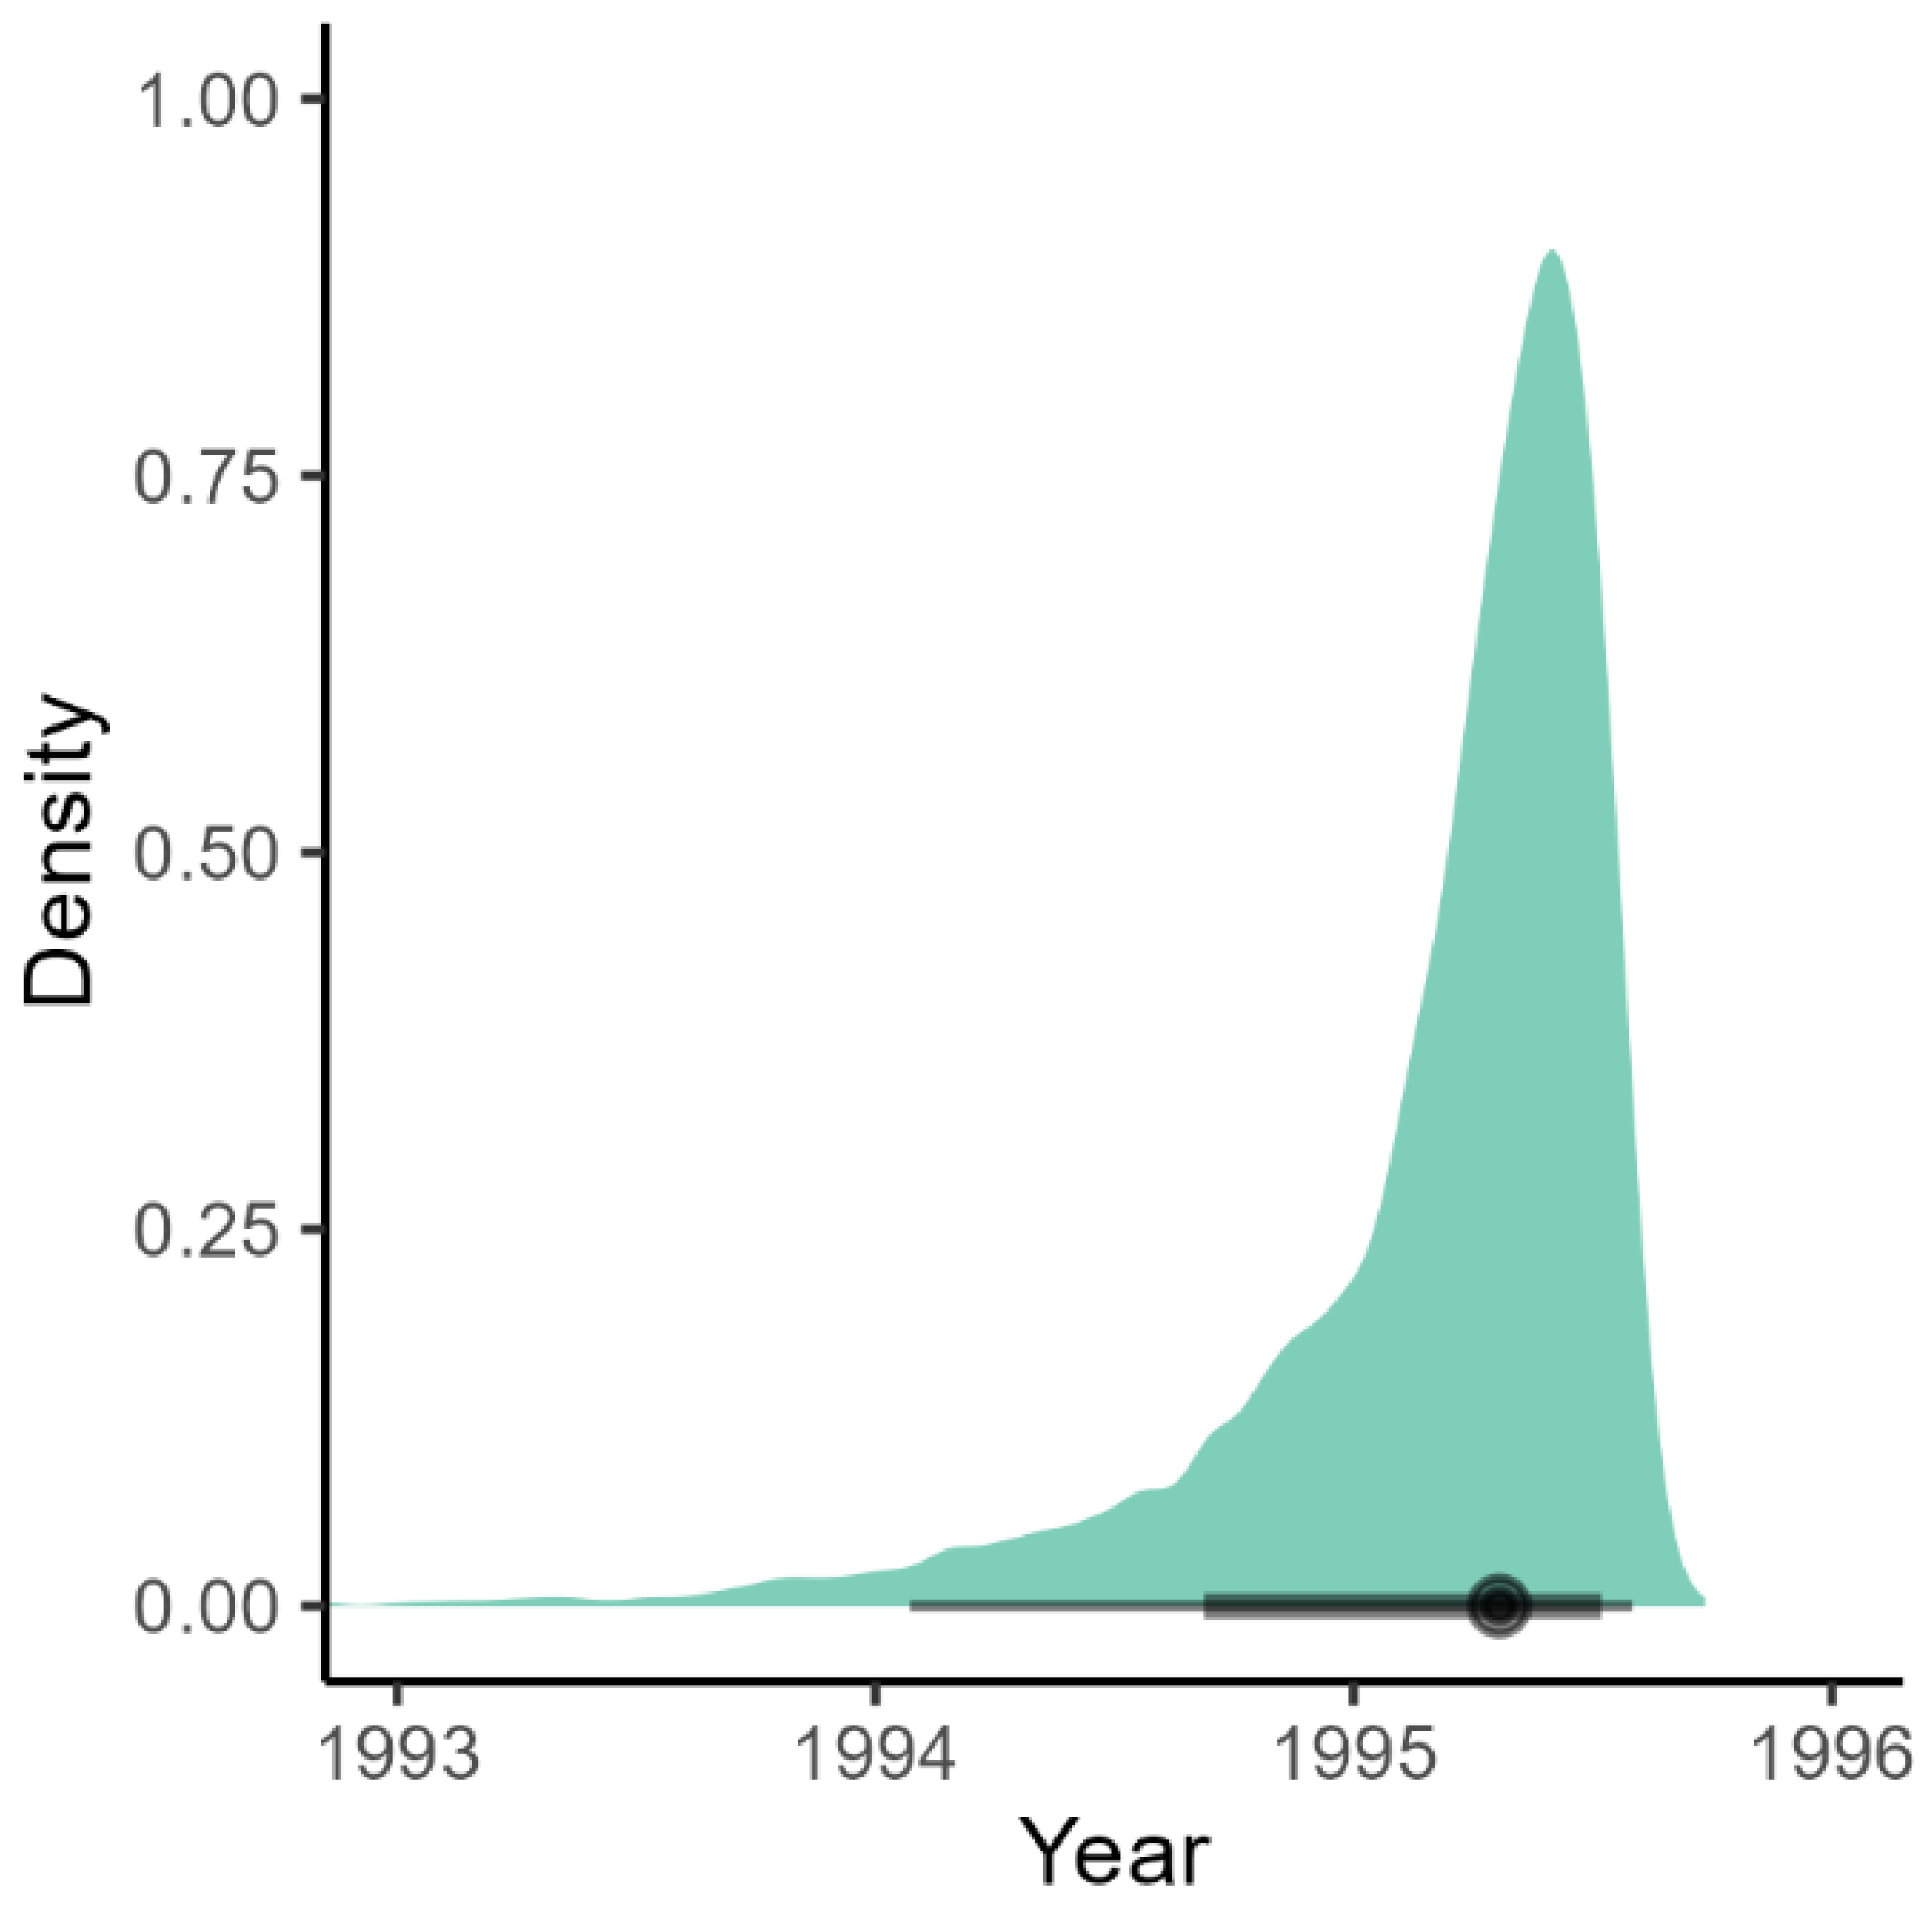
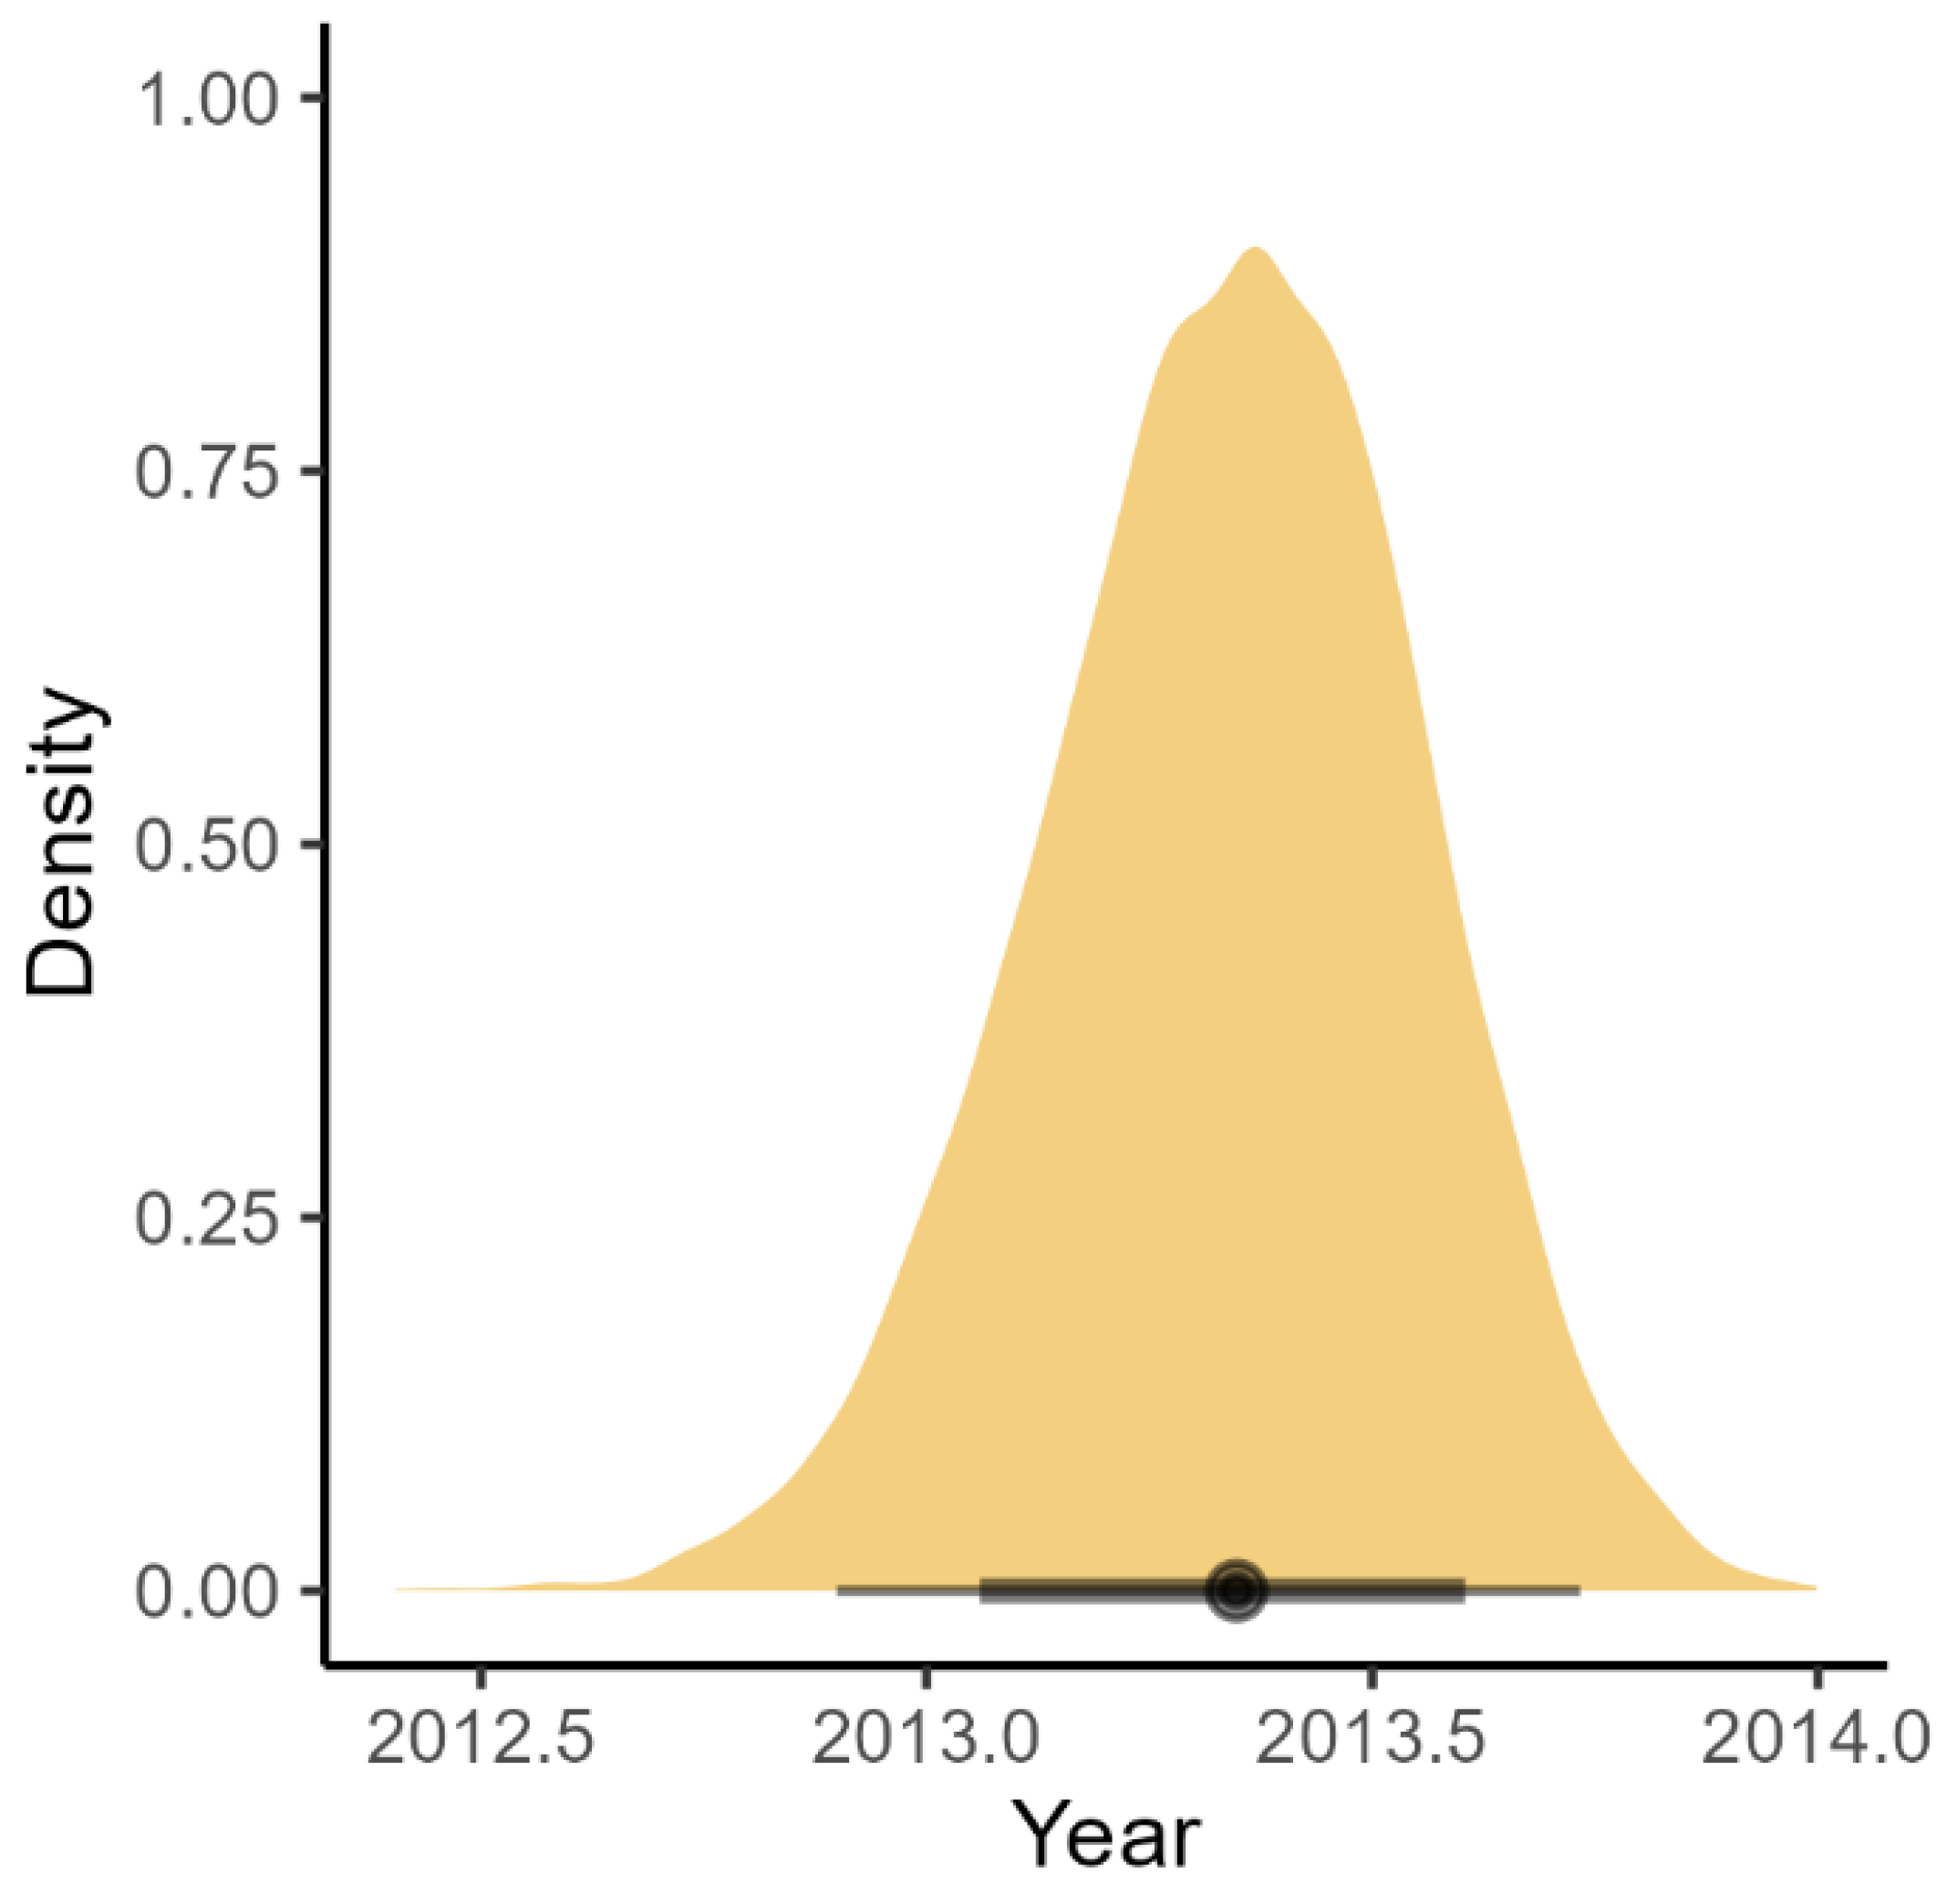
3. Results
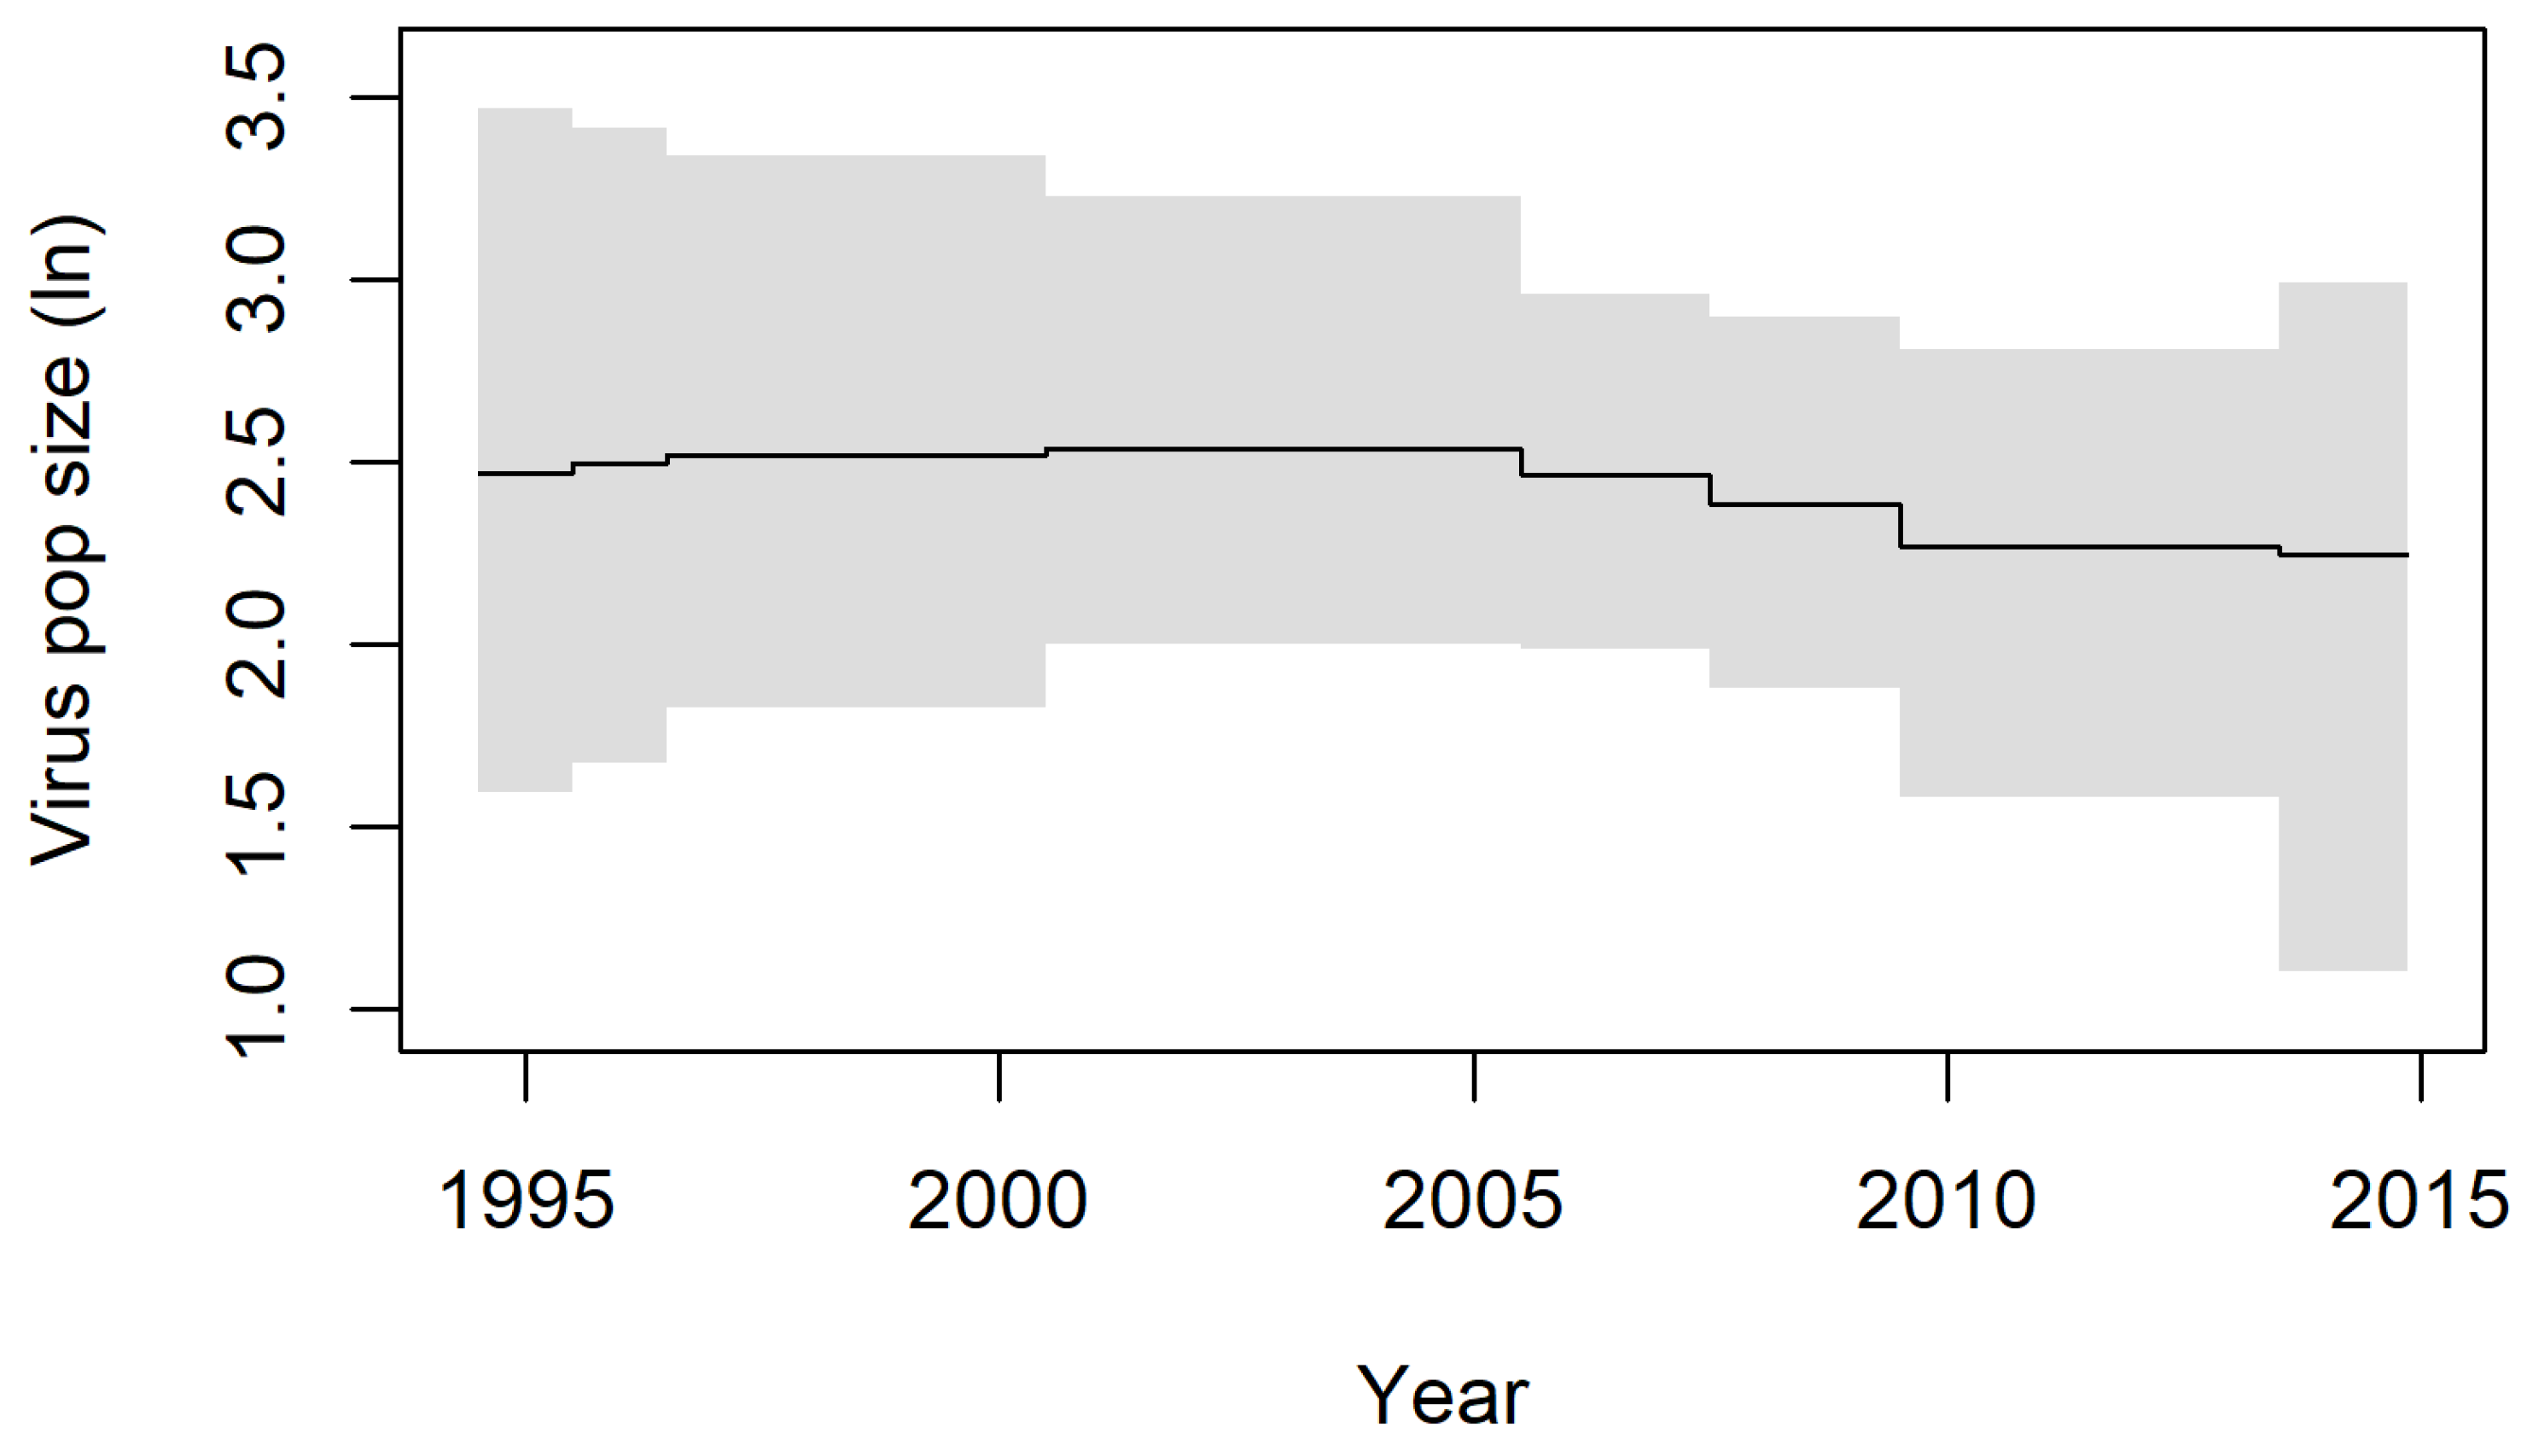
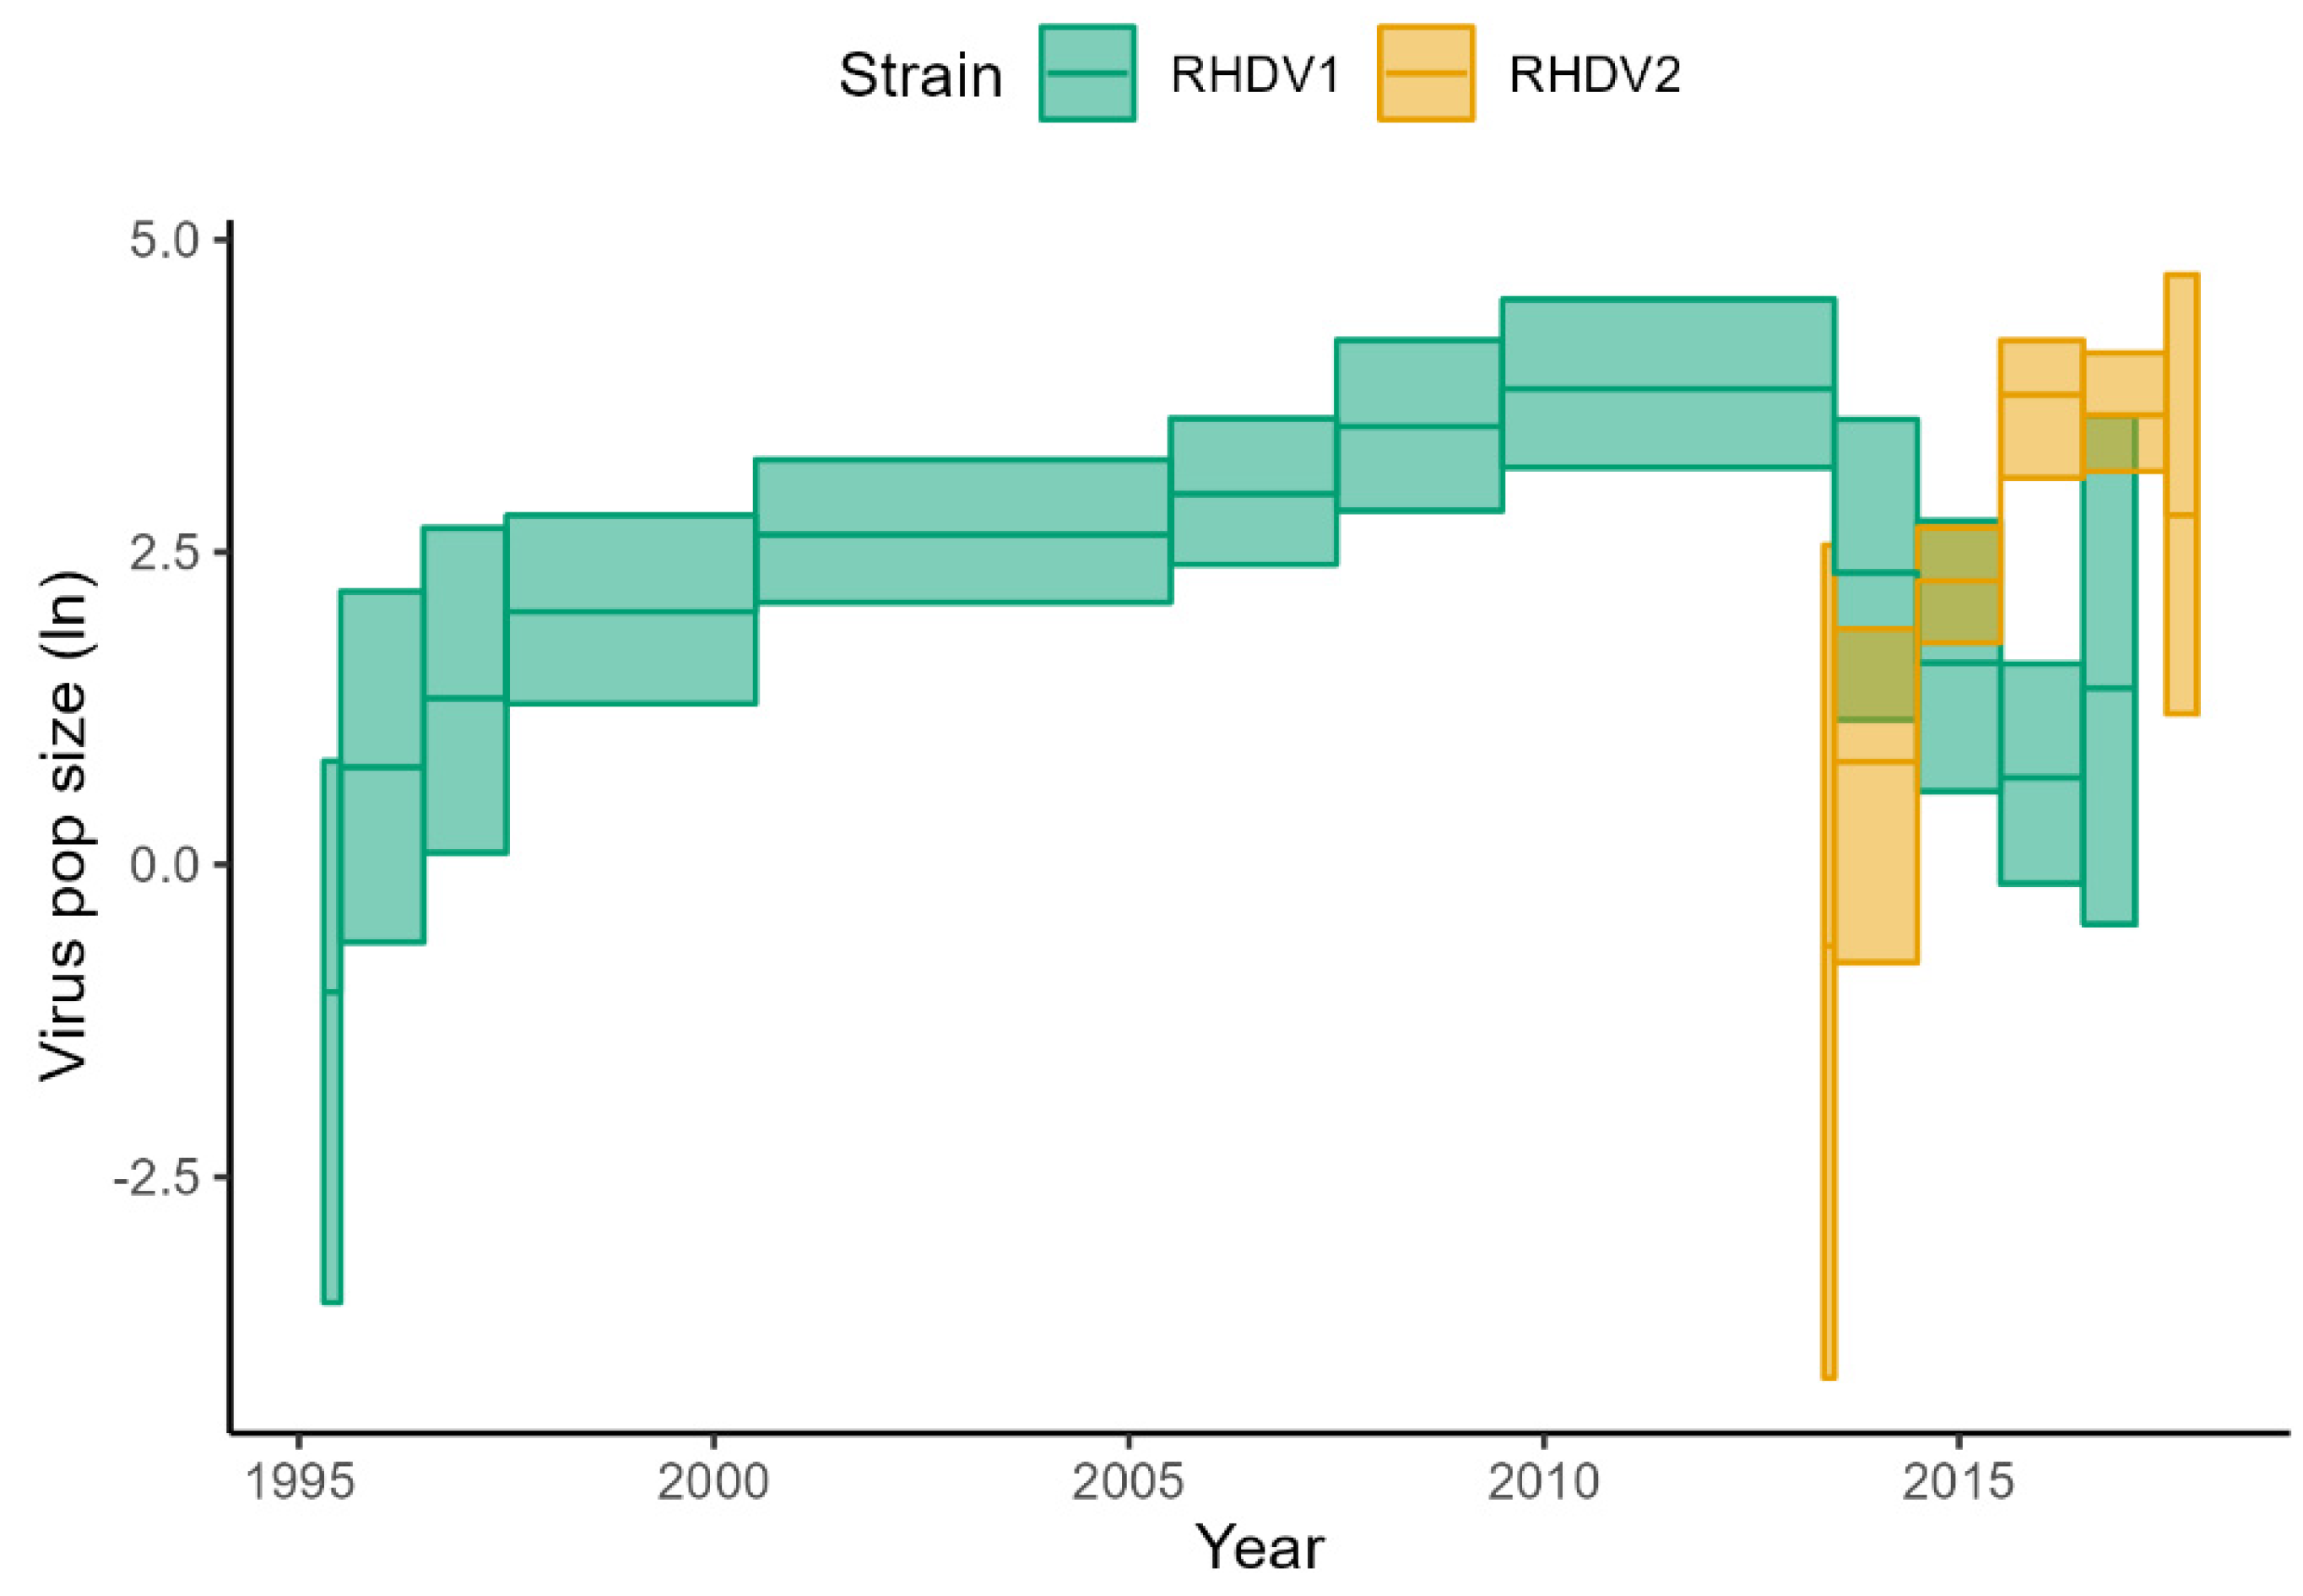
3.1. BSP Analyses
3.2. Skygrid Analyses
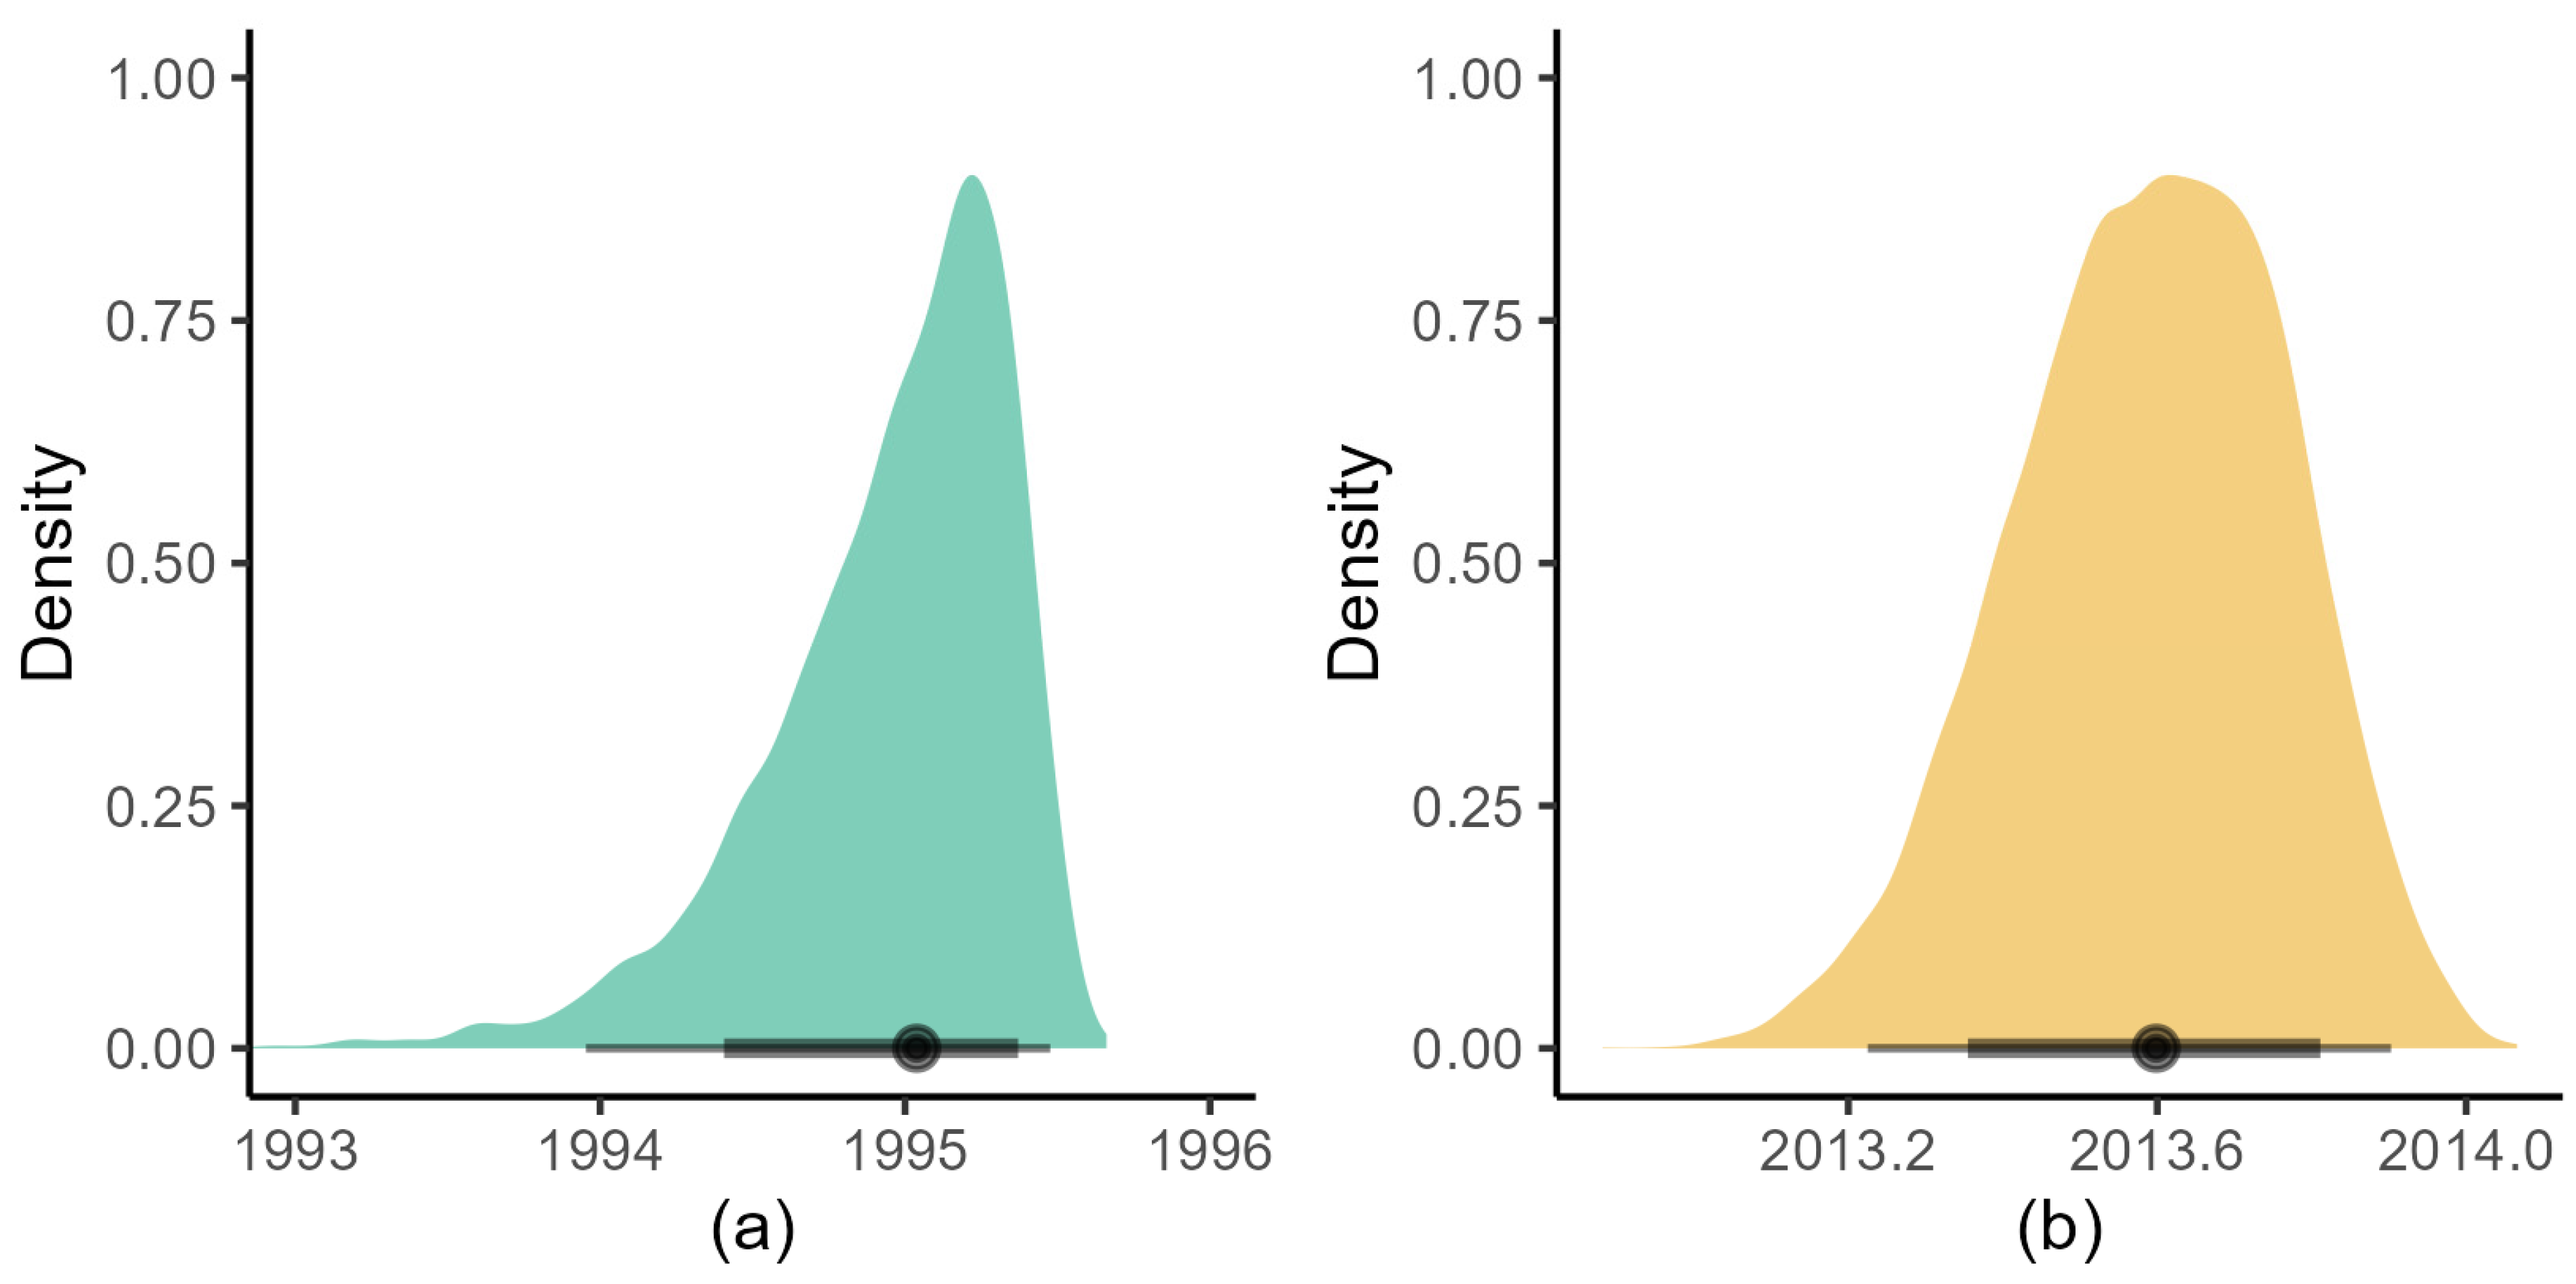
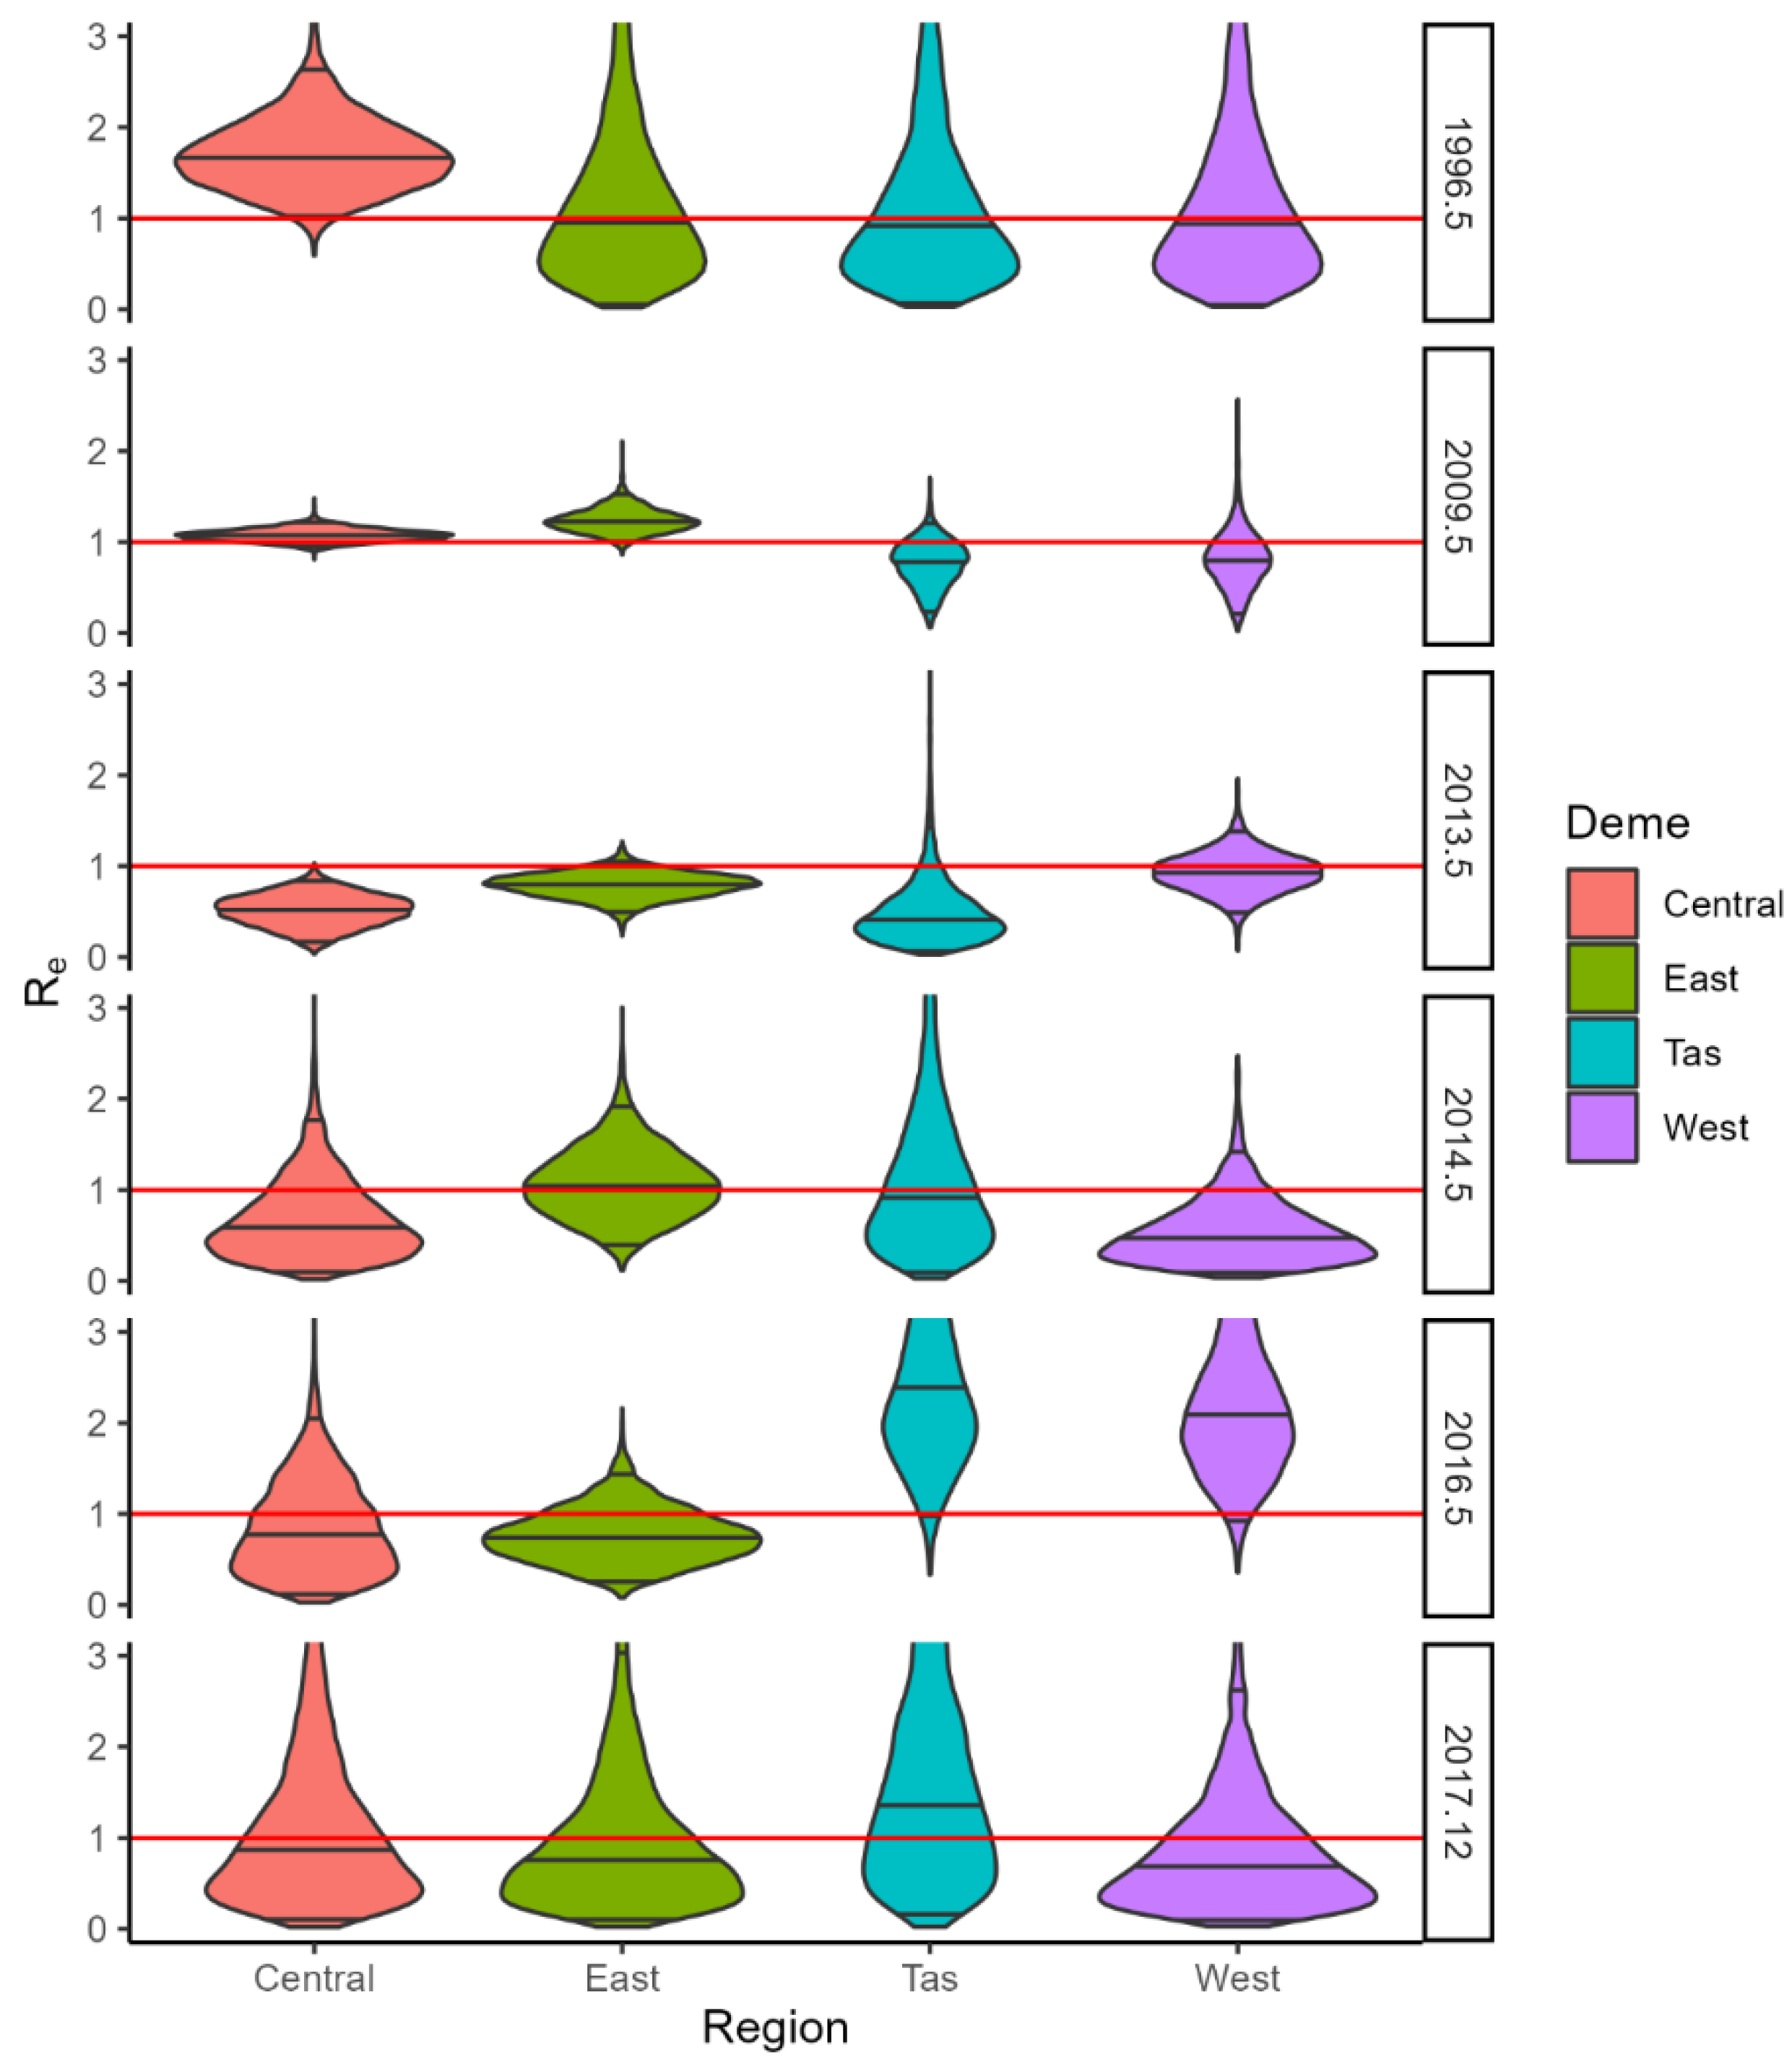
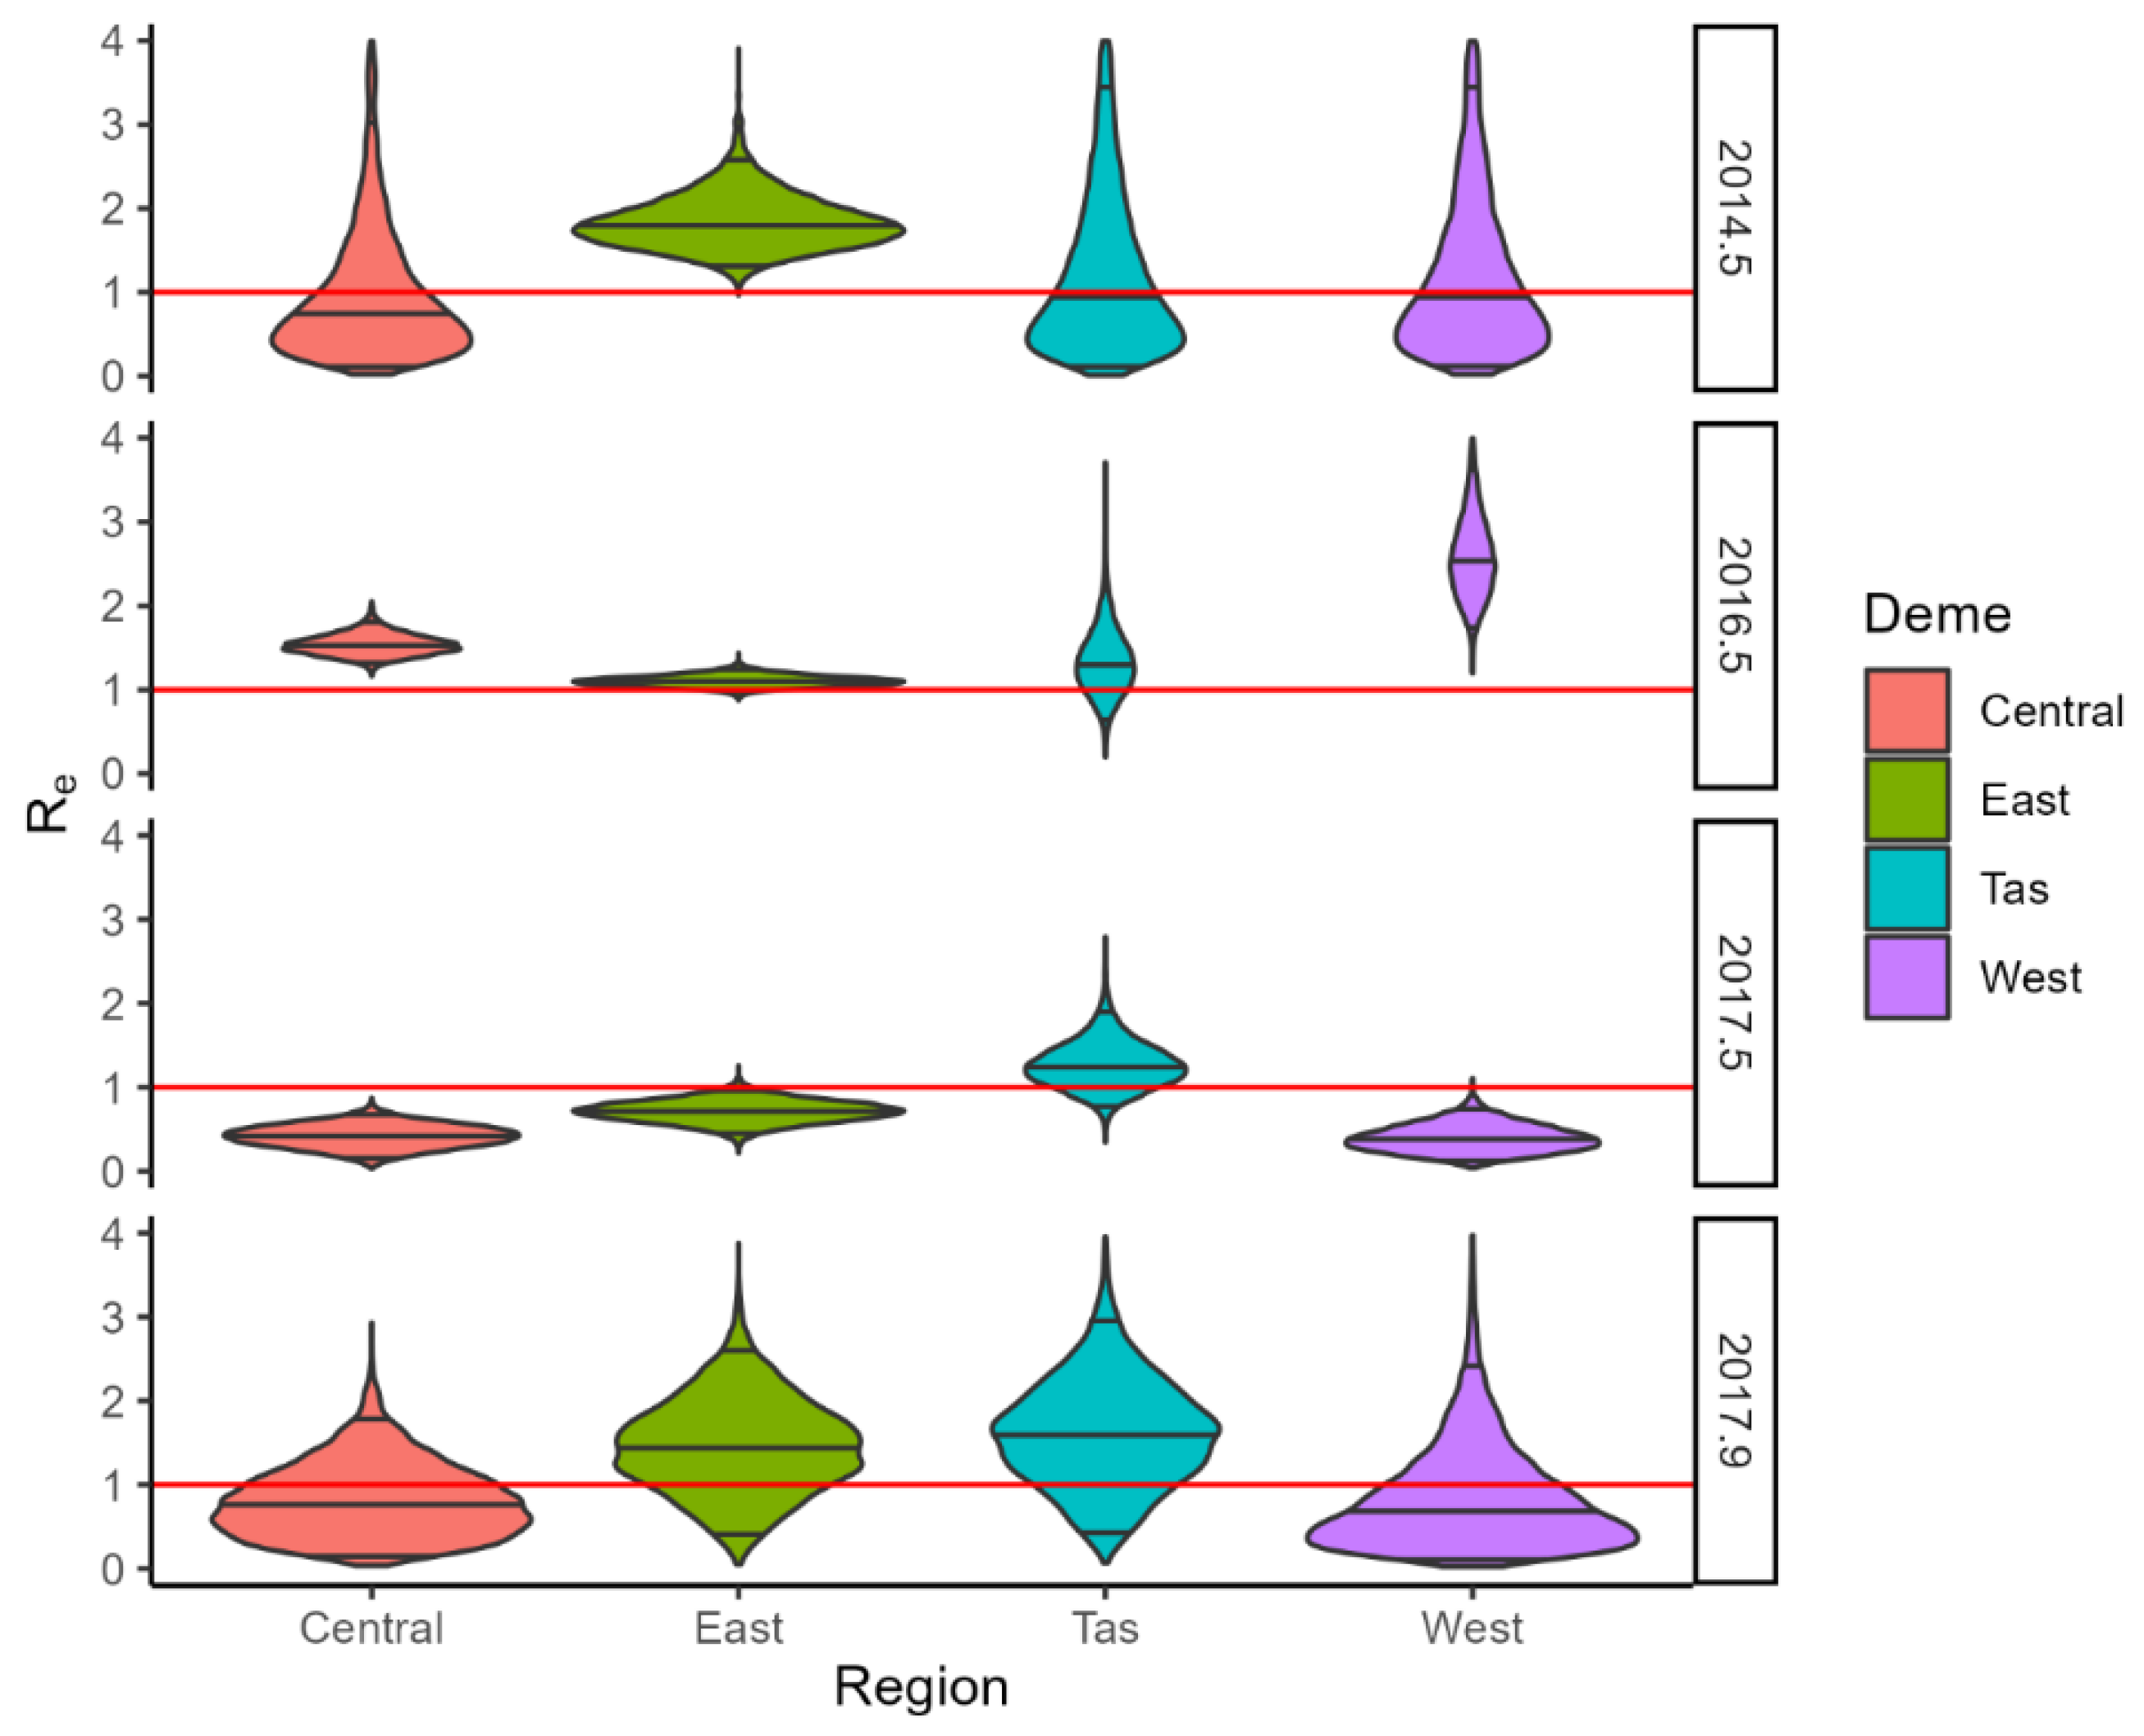
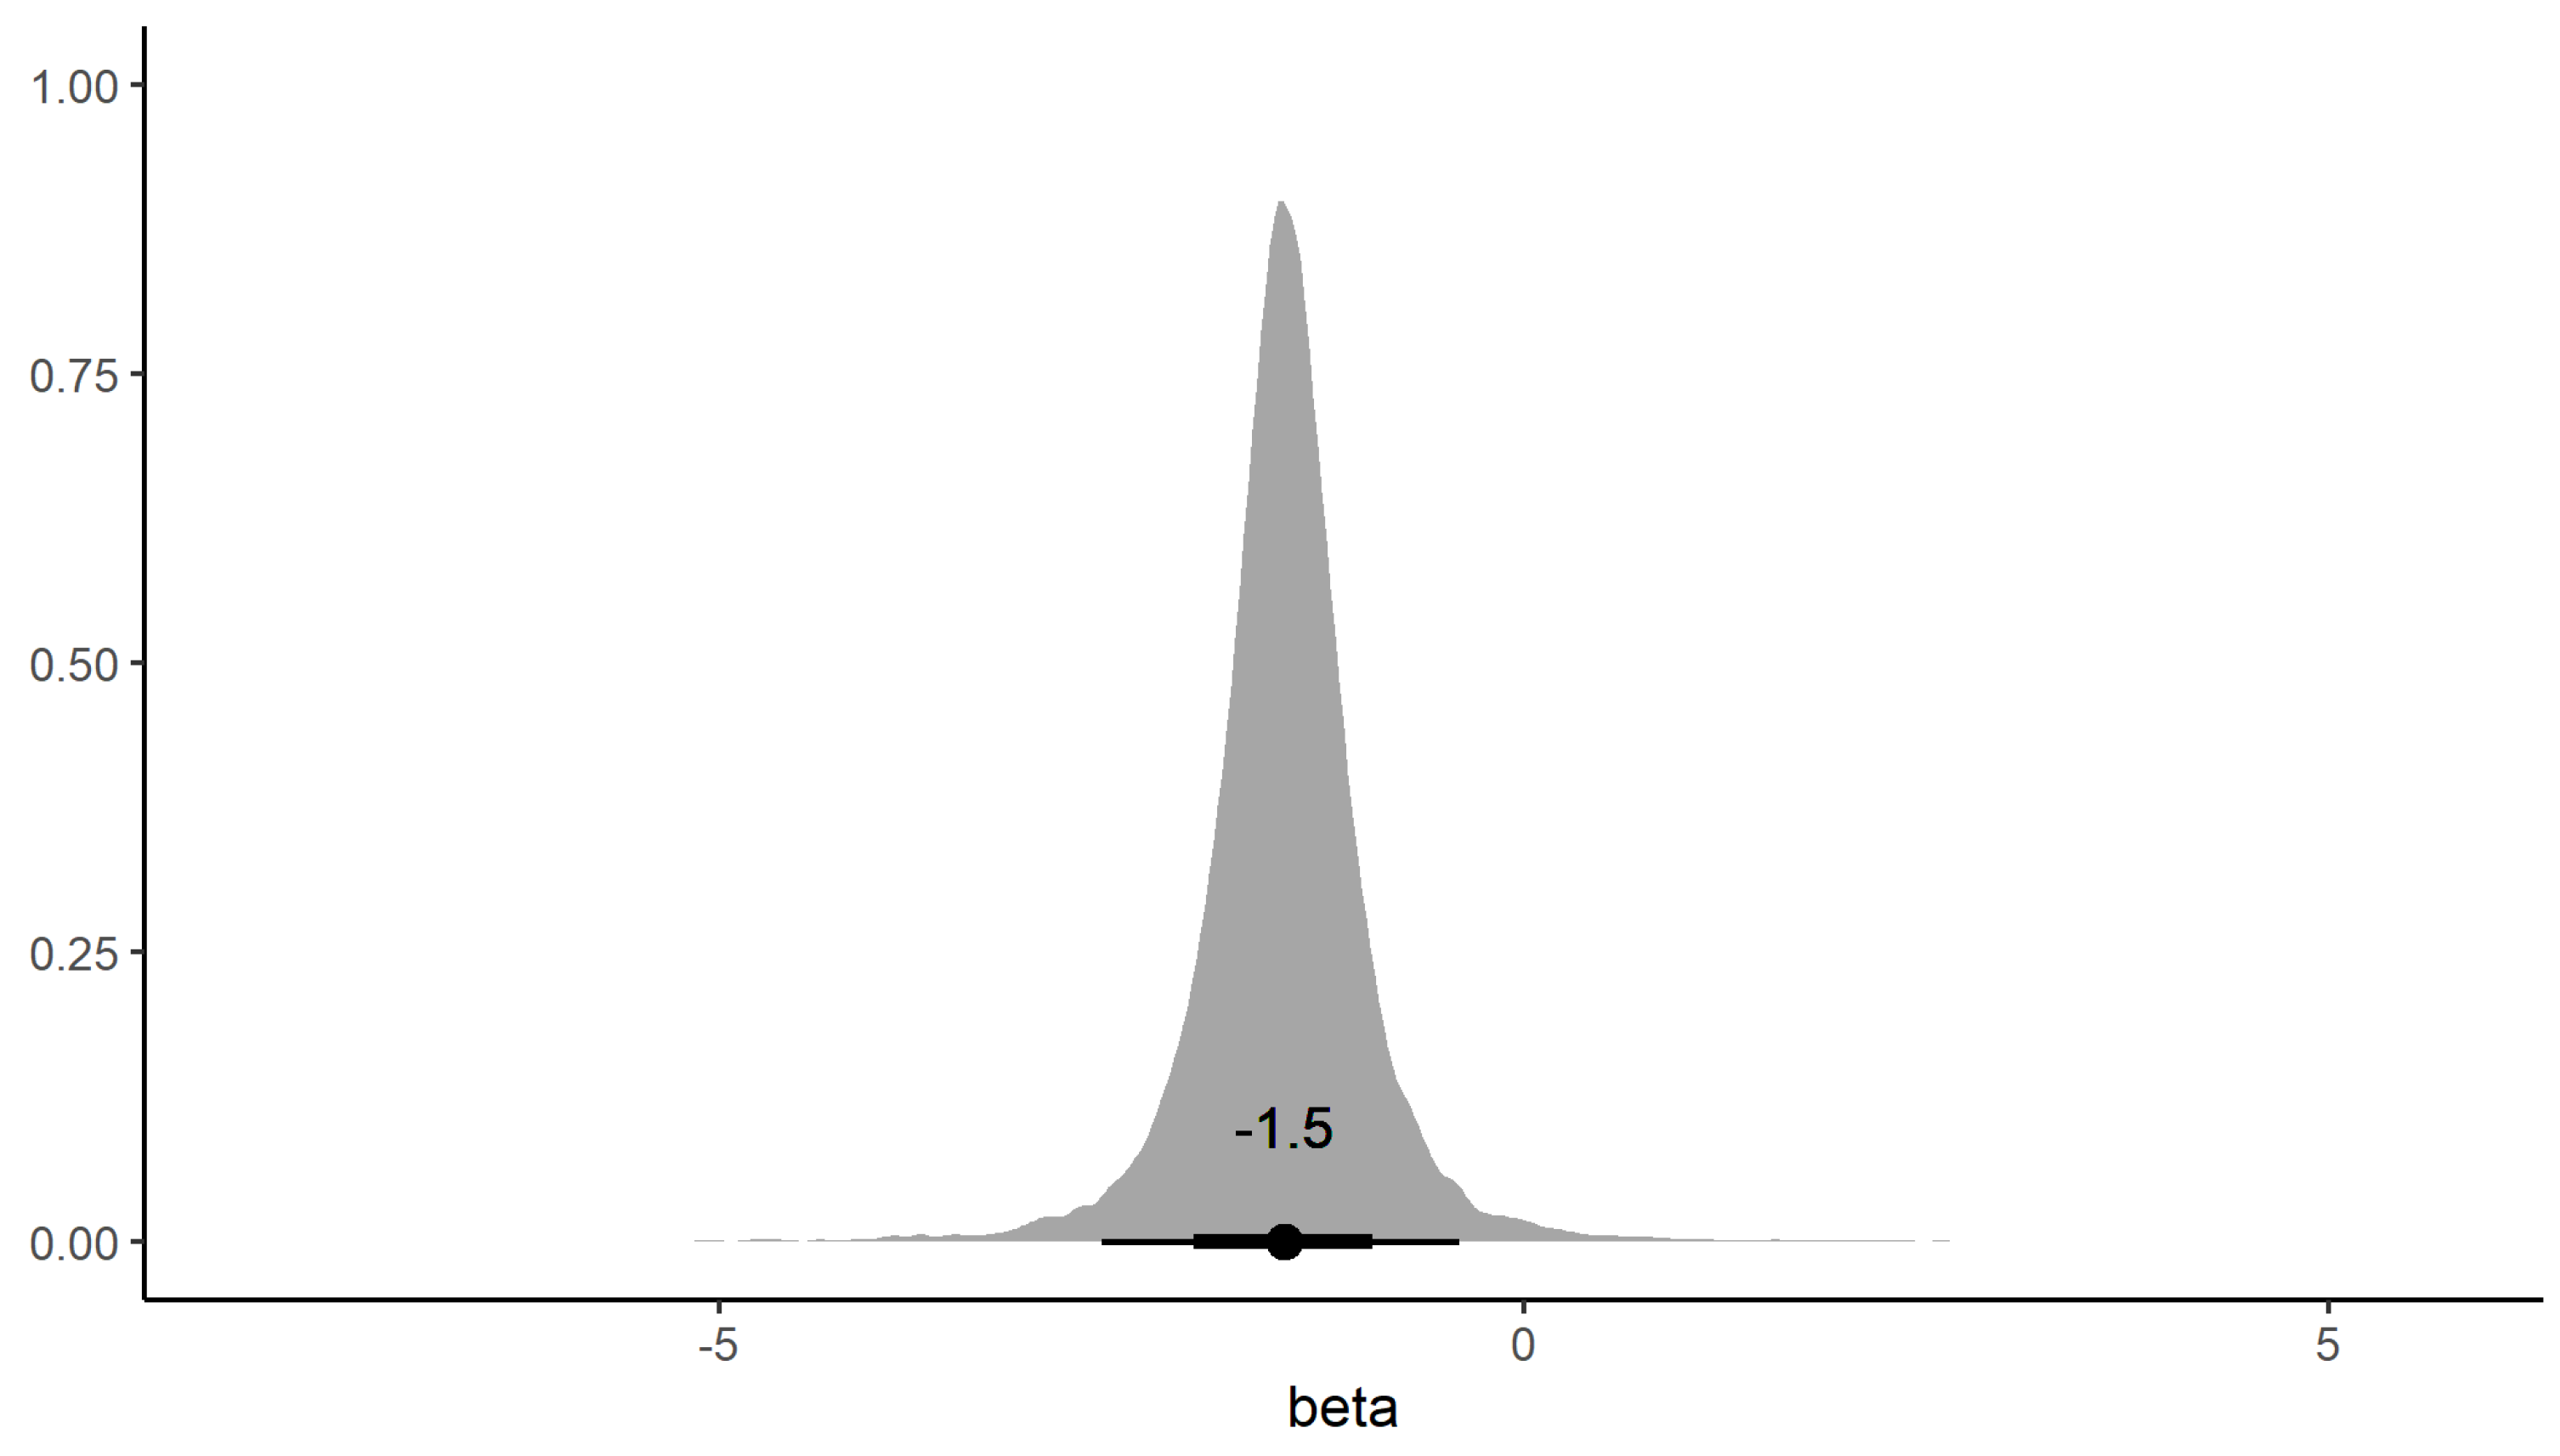
3.3. BDMM-Prime
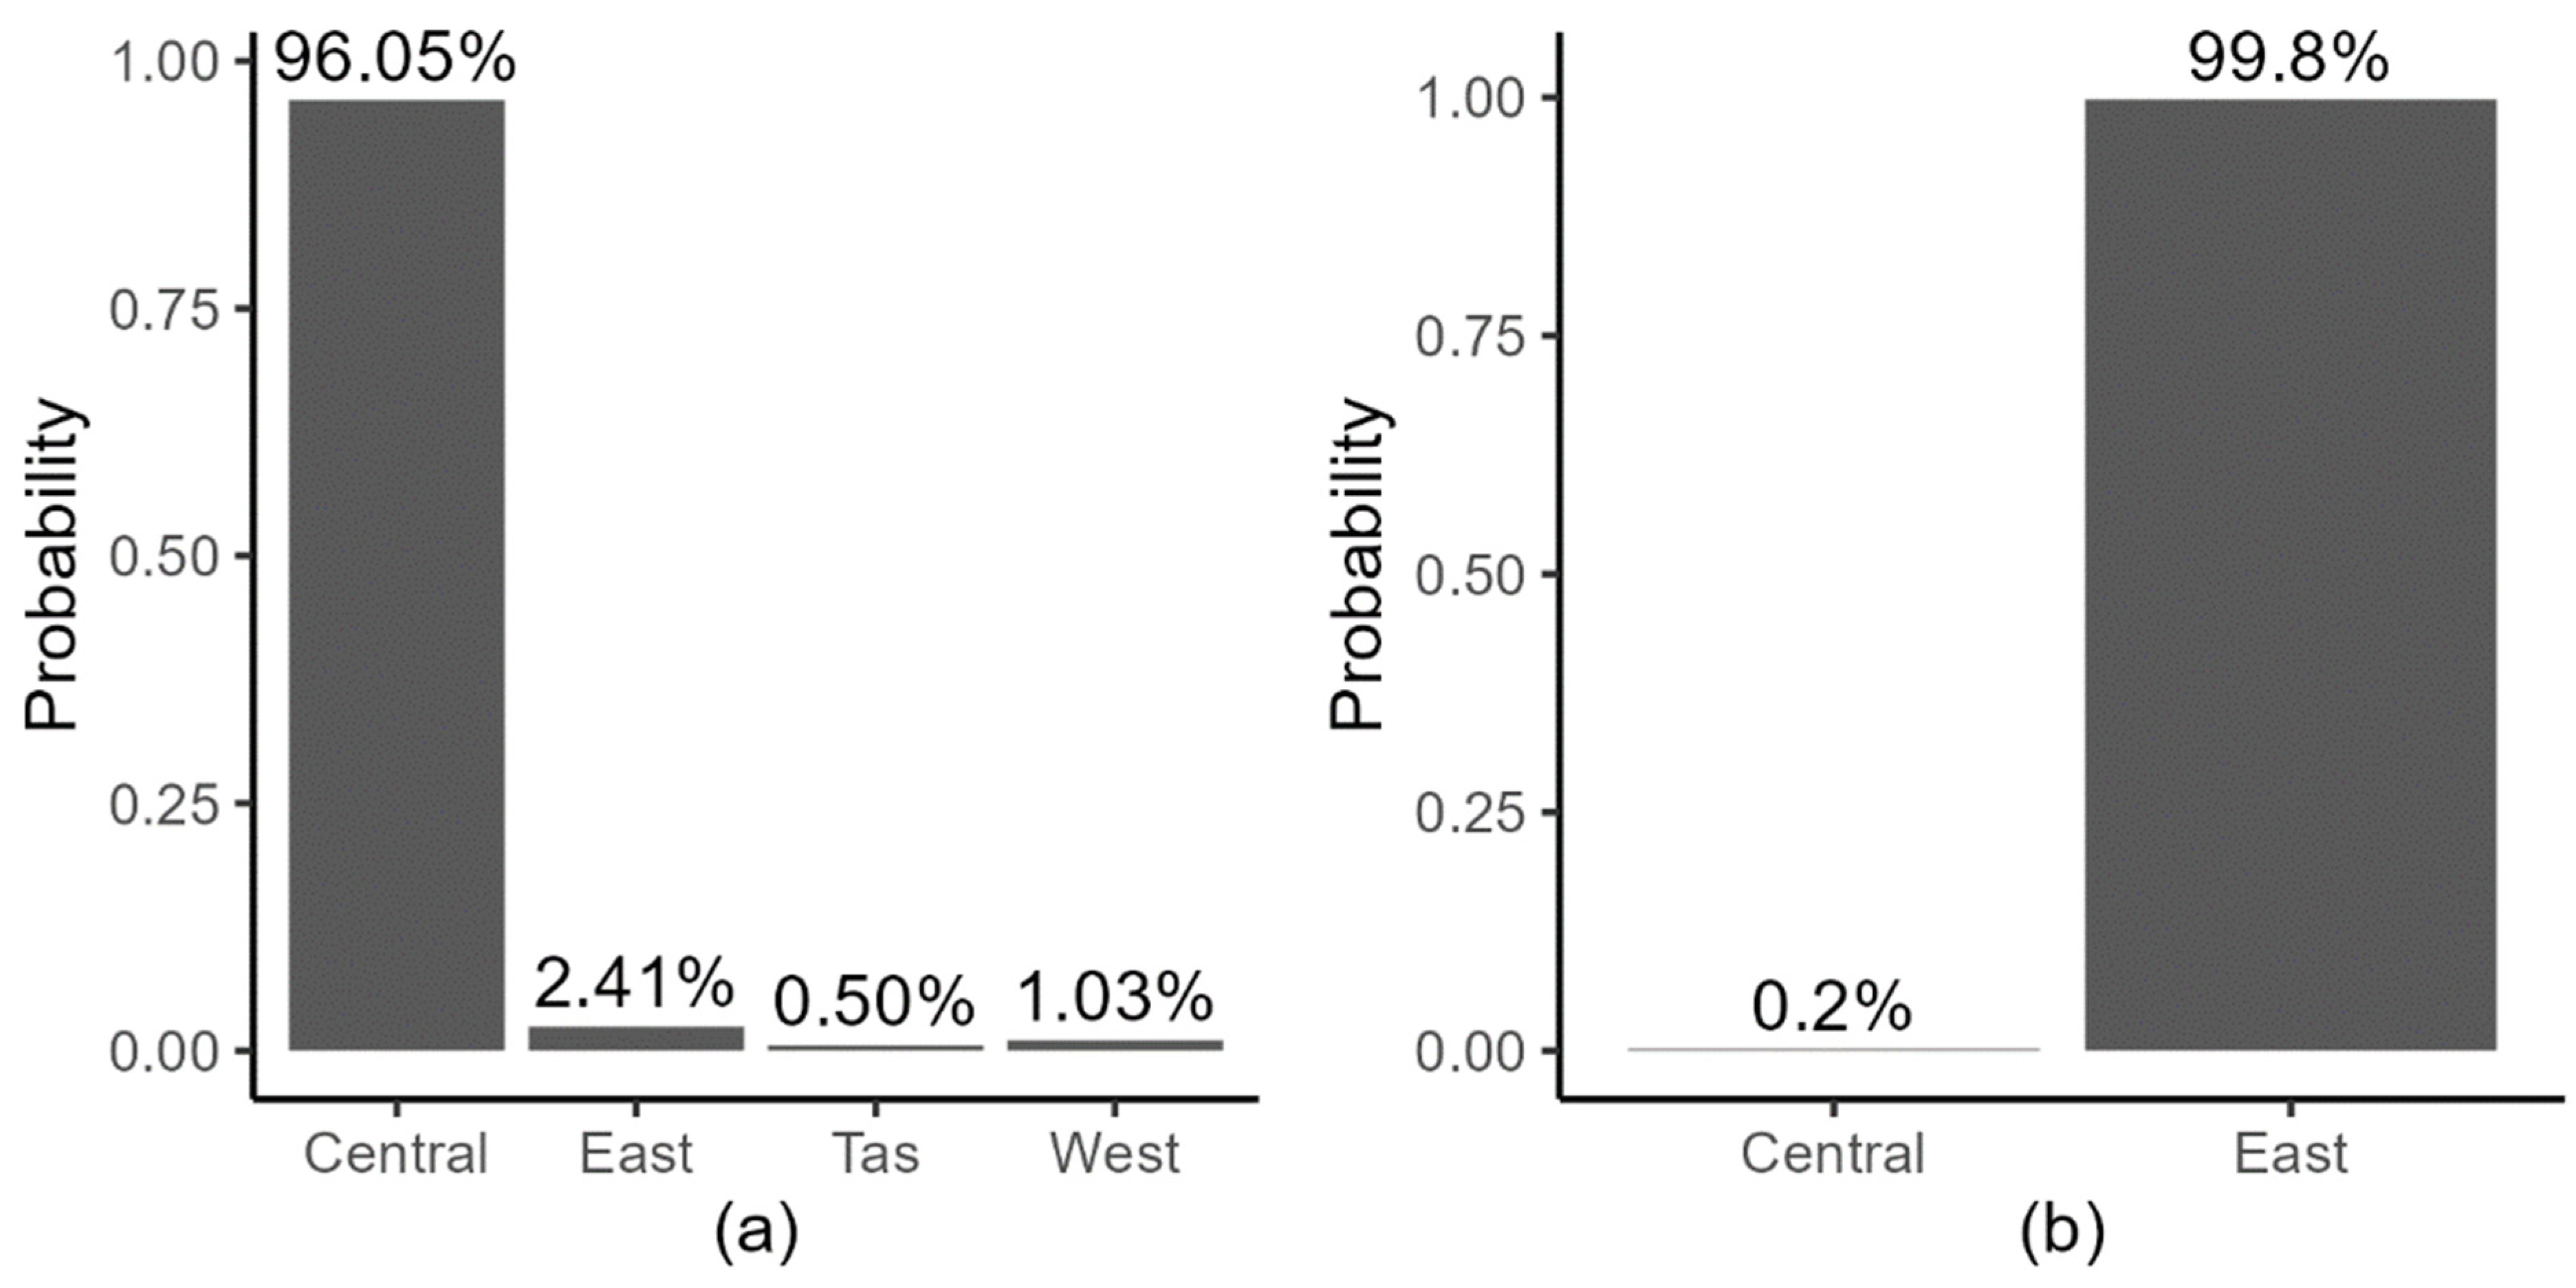
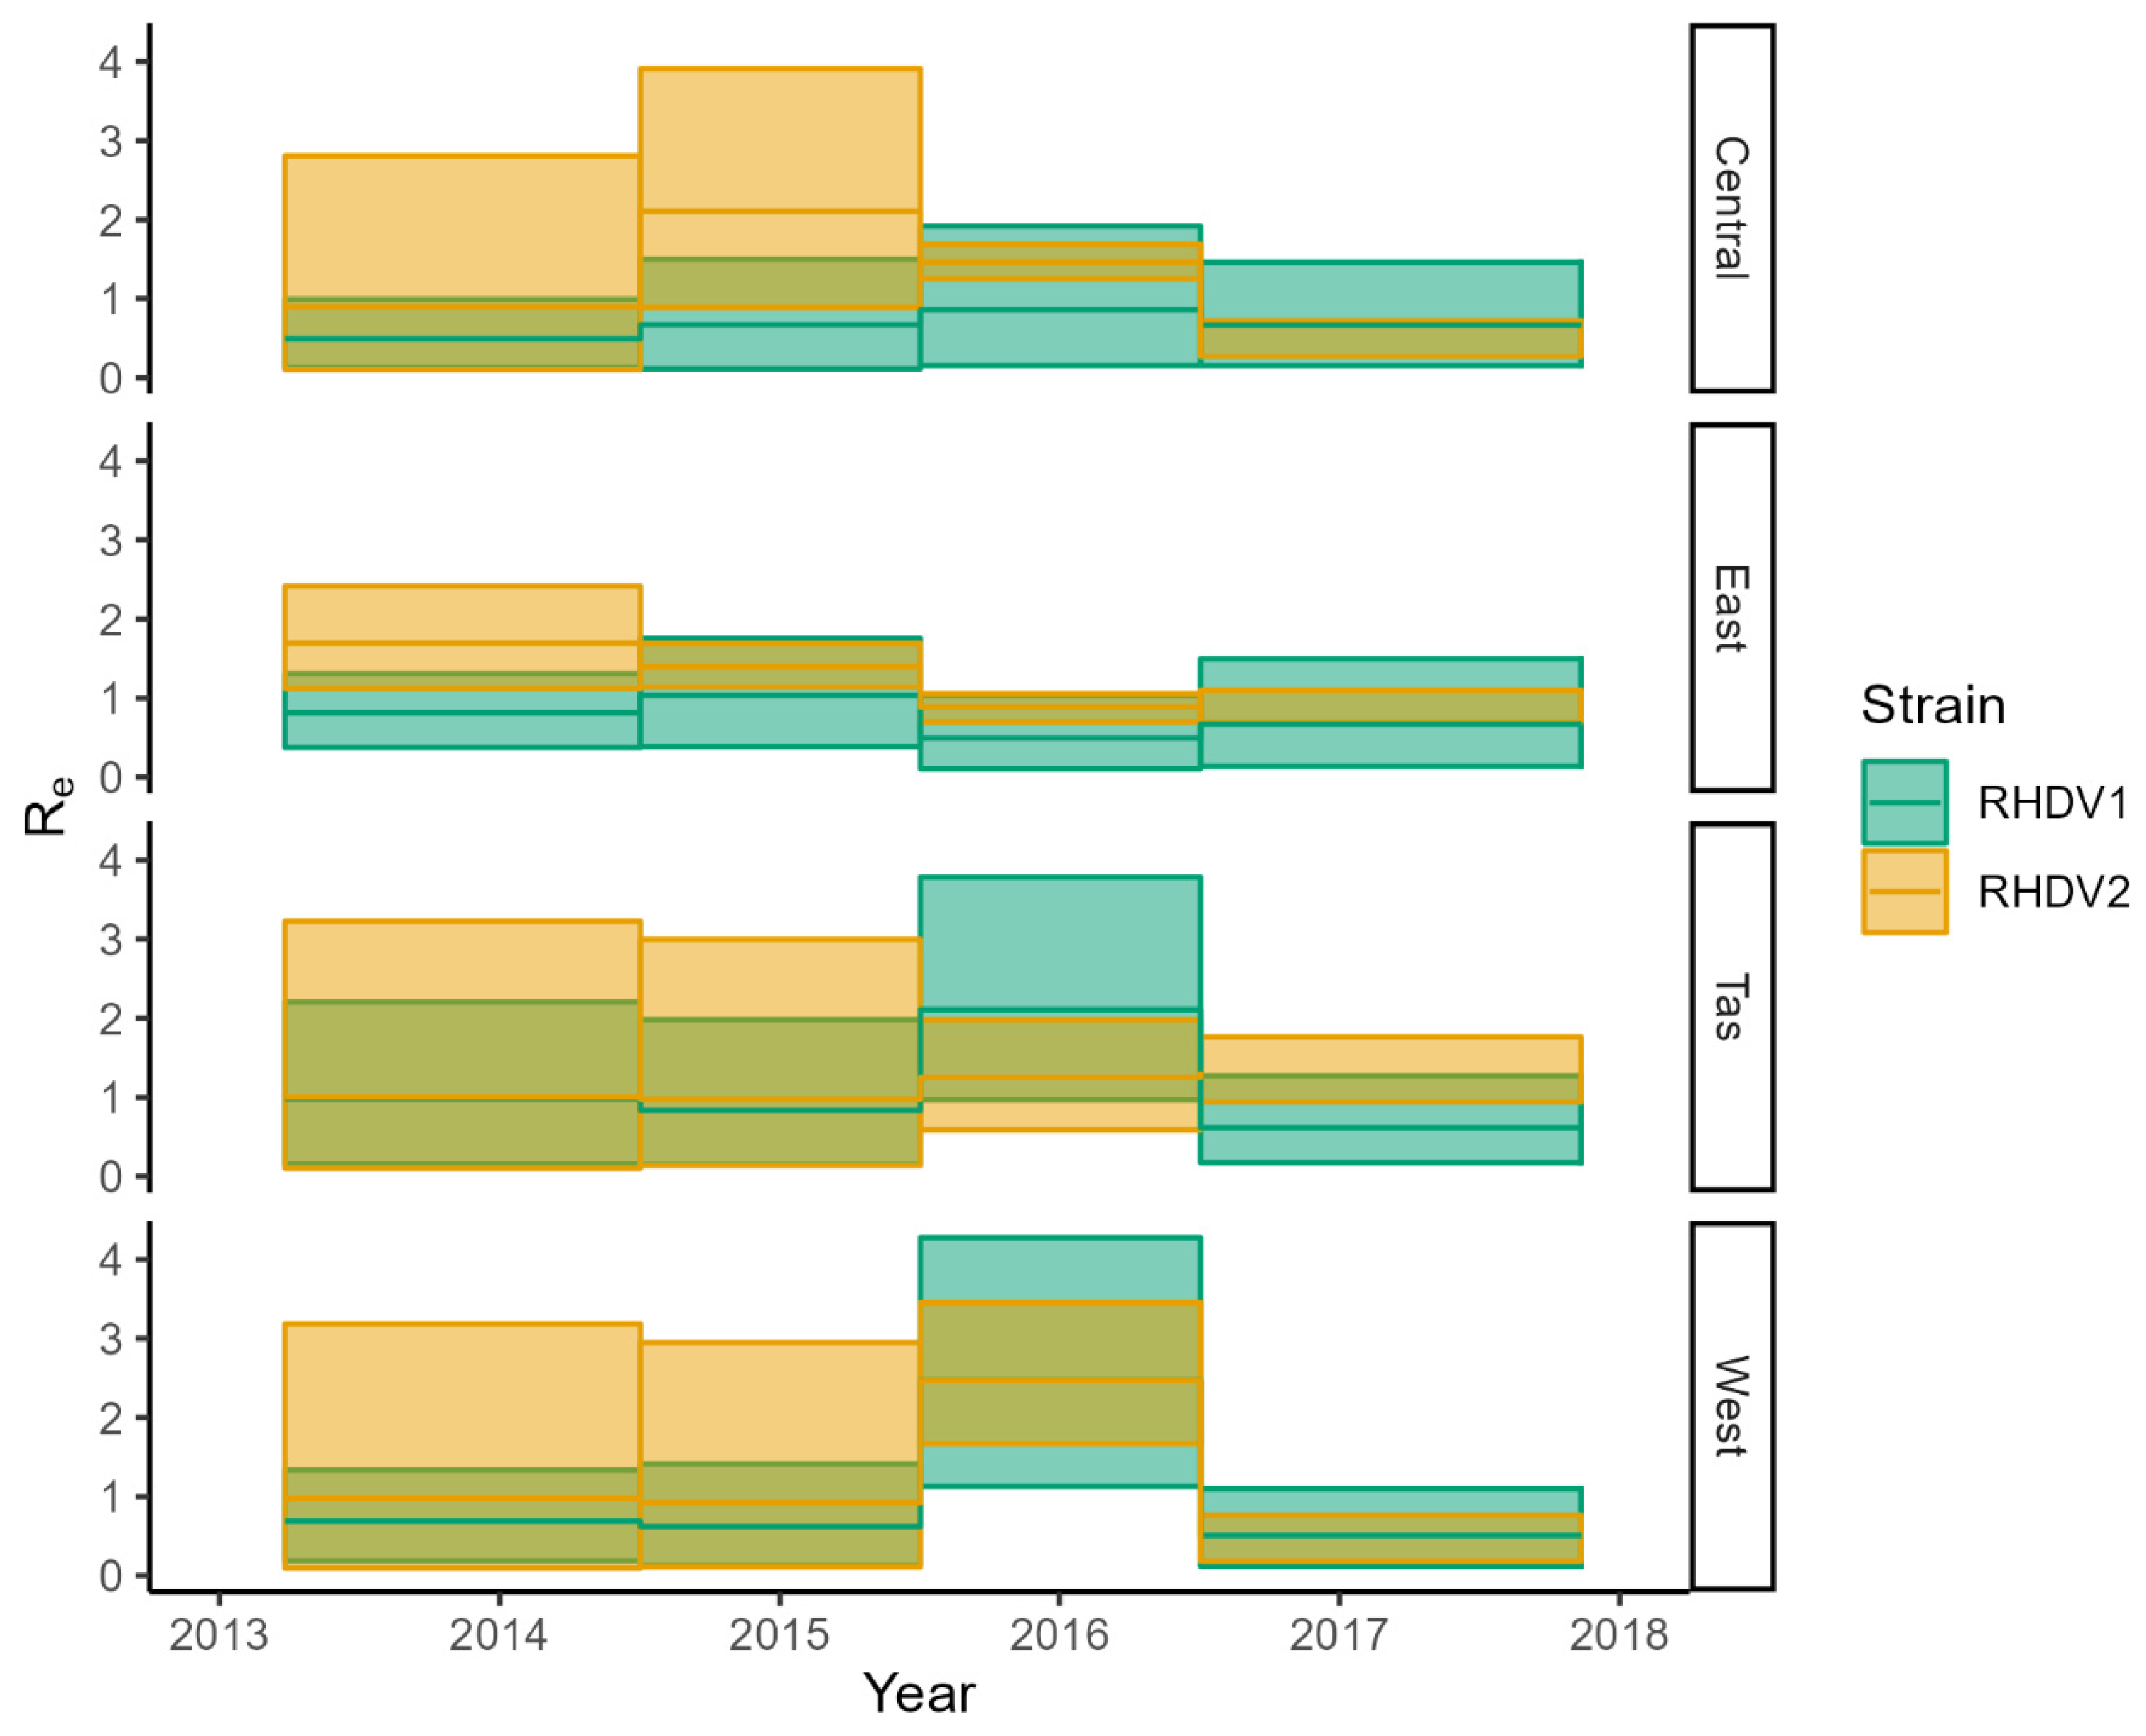
3.4. RHDV Genotype Competitive Exclusion
4. Discussion
Supplementary Materials
Author Contributions
Funding
Institutional Review Board Statement
Informed Consent Statement
Data Availability Statement
Acknowledgments
Conflicts of Interest
References
- Le Pendu, J.; Abrantes, J.; Bertagnoli, S.; Guitton, J.S.; Le Gall-Reculé, G.; Lopes, A.M.; Marchandeau, S.; Alda, F.; Almeida, T.; Célio, A.P.; et al. Proposal for a unified classification system and nomenclature of lagoviruses. J. Gen. Virol. 2017, 98, 1658–1666. [Google Scholar] [CrossRef] [PubMed]
- Kovaliski, J. Monitoring the spread of rabbit hemorrhagic disease virus as a new biological agent for control of wild European rabbits in Australia. J. Wildl. Dis. 1998, 34, 421–428. [Google Scholar] [CrossRef] [PubMed]
- Mutze, G.; Cooke, B.; Alexander, P. The initial impact of rabbit hemorrhagic disease on European rabbit populations in South Australia. J. Wildl. Dis. 1998, 34, 221–227. [Google Scholar] [CrossRef] [PubMed] [Green Version]
- Bruce, J.S.; Twigg, L.E. The reintroduction, and subsequent impact, of rabbit haemorrhagic disease virus in a population of wild rabbits in south-western Australia. Wildl. Res. 2005, 32, 139–150. [Google Scholar] [CrossRef]
- Bruce, J.S.; Twigg, L.E.; Gray, G.S. The epidemiology of rabbit haemorrhagic disease, and its impact on rabbit populations, in south-western Australia. Wildl. Res. 2004, 31, 31–49. [Google Scholar] [CrossRef]
- Cooke, B.D.; McPhee, S.; Robinson, A.J.; Capucci, L. Rabbit haemorrhagic disease: Does a pre-existing RHDV-like virus reduce the effectiveness of RHD as a biological control in Australia? Wildl. Res. 2002, 29, 673–682. [Google Scholar] [CrossRef]
- Cox, T.; Strive, T.; Mutze, G.; West, P.; Saunders, G. Benefits of Rabbit Biocontrol in Australia; Invasive Animals Cooperative Research Centre: Canberra, Australia, 2013. [Google Scholar]
- Mutze, G.; Bird, P.; Kovaliski, J.; Peacock, D.; Jennings, S.; Cooke, B. Emerging epidemiological patterns in rabbit haemorrhagic disease, its interaction with myxomatosis, and their effects on rabbit populations in South Australia. Wildl. Res. 2002, 29, 577–590. [Google Scholar] [CrossRef]
- Robinson, A.J.; Kirkland, P.; Forrester, R.; Capucci, L.; Cooke, B.D.; Philbey, A. Serological evidence for the presence of a calicivirus in Australian wild rabbits, Oryctolagus cuniculus, before the introduction of rabbit haemorrhagic disease virus (RHDV): Its potential influence on the specificity of a competitive ELISA for RHDV. Wildl. Res. 2002, 29, 655–662. [Google Scholar] [CrossRef]
- Nagesha, H.; McColl, K.; Collins, B.; Morrissy, C.; Wang, L.F.; Westbury, H. The presence of cross-reactive antibodies to rabbit haemorrhagic disease virus in Australian wild rabbits prior to the escape of virus from quarantine. Arch. Virol. 2000, 145, 749–757. [Google Scholar] [CrossRef]
- Strive, T.; Wright, J.D.; Robinson, A.J. Identification and partial characterisation of a new lagovirus in Australian wild rabbits. Virology 2009, 384, 97–105. [Google Scholar] [CrossRef]
- Strive, T.; Wright, J.; Kovaliski, J.; Botti, G.; Capucci, L. The non-pathogenic Australian lagovirus RCV-A1 causes a prolonged infection and elicits partial cross-protection to rabbit haemorrhagic disease virus. Virology 2010, 398, 125–134. [Google Scholar] [CrossRef] [Green Version]
- Strive, T.; Elsworth, P.; Liu, J.; Wright, J.D.; Kovaliski, J.; Capucci, L. The non-pathogenic Australian rabbit calicivirus RCV-A1 provides temporal and partial cross protection to lethal rabbit haemorrhagic disease virus infection which is not dependent on antibody titres. Vet. Res. 2013, 44, 51. [Google Scholar] [CrossRef] [Green Version]
- Hall, R.N.; Mahar, J.E.; Haboury, S.; Stevens, V.; Holmes, E.C.; Strive, T. Emerging rabbit hemorrhagic disease virus 2 (RHDVb), Australia. Emerg. Infect. Dis. 2015, 21, 2276–2278. [Google Scholar] [CrossRef]
- Ramsey, D.S.L.; Cox, T.; Strive, T.; Forsyth, D.M.; Stuart, I.; Hall, R.; Elsworth, P.; Campbell, S. Emerging RHDV2 suppresses the impact of endemic and novel strains of RHDV on wild rabbit populations. J. Appl. Ecol. 2020, 57, 630–641. [Google Scholar] [CrossRef]
- Mahar, J.E.; Hall, R.N.; Peacock, D.; Kovaliski, J.; Piper, M.; Mourant, R.; Huang, N.; Campbell, S.; Gu, X.; Read, A.; et al. Rabbit Hemorrhagic Disease Virus 2 (RHDV2; GI.2) Is Replacing Endemic Strains of RHDV in the Australian Landscape within 18 Months of Its Arrival. J. Virol. 2018, 92, e01374-17. [Google Scholar] [CrossRef] [Green Version]
- Strive, T.; Cox, T.E. Lethal biological control of rabbits—The most powerful tools for landscape-scale mitigation of rabbit impacts in Australia. Aust. Zool. 2019, 40, 118–128. [Google Scholar] [CrossRef]
- Mahar, J.E.; Read, A.J.; Gu, X.; Urakova, N.; Mourant, R.; Piper, M.; Haboury, S.; Holmes, E.C.; Strive, T.; Hall, R.N. Detection and Circulation of a Novel Rabbit Hemorrhagic Disease Virus in Australia. Emerg. Infect. Dis. 2018, 24, 22. [Google Scholar] [CrossRef]
- Mahar, J.E.; Jenckel, M.; Huang, N.; Smertina, E.; Holmes, E.C.; Strive, T.; Hall, R.N. Frequent intergenotypic recombination between the non-structural and structural genes is a major driver of epidemiological fitness in caliciviruses. Virus Evol. 2021, 7, veab080. [Google Scholar] [CrossRef]
- Hall, R.N.; Mahar, J.E.; Read, A.J.; Mourant, R.; Piper, M.; Huang, N.; Strive, T. A strain-specific multiplex RT-PCR for Australian rabbit haemorrhagic disease viruses uncovers a new recombinant virus variant in rabbits and hares. Transbound. Emerg. Dis. 2018, 65, e444–e456. [Google Scholar] [CrossRef]
- Pacioni, C.; Vaughan, T.G.; Strive, T.; Campbell, S.; Ramsey, D.S. Field validation of phylodynamic analytical methods for inference on epidemiological processes in wildlife. Transbound. Emerg. Dis. 2022, 69, 1020–1029. [Google Scholar] [CrossRef]
- Drummond, A.J.; Rambaut, A.; Shapiro, B.; Pybus, O.G. Bayesian coalescent inference of past population dynamics from molecular sequences. Mol. Biol. Evol. 2005, 22, 1185–1192. [Google Scholar] [CrossRef] [Green Version]
- Gavryushkina, A.; Welch, D.; Stadler, T.; Drummond, A.J. Bayesian inference of sampled ancestor trees for epidemiology and fossil calibration. PLoS Comput. Biol. 2014, 10, e1003919. [Google Scholar] [CrossRef] [Green Version]
- Gill, M.S.; Lemey, P.; Faria, N.R.; Rambaut, A.; Shapiro, B.; Suchard, M.A. Improving Bayesian Population Dynamics Inference: A Coalescent-Based Model for Multiple Loci. Mol. Biol. Evol. 2013, 30, 713–724. [Google Scholar] [CrossRef] [Green Version]
- Kühnert, D.; Stadler, T.; Vaughan, T.G.; Drummond, A.J. Phylodynamics with migration: A computational framework to quantify population structure from genomic data. Mol. Biol. Evol. 2016, 33, 2102–2116. [Google Scholar] [CrossRef] [Green Version]
- Bouckaert, R.; Vaughan, T.G.; Barido-Sottani, J.; Duchêne, S.; Fourment, M.; Gavryushkina, A.; Heled, J.; Jones, G.; Kühnert, D.; De Maio, N.; et al. BEAST 2.5: An advanced software platform for Bayesian evolutionary analysis. PLoS Comput. Biol. 2019, 15, e1006650. [Google Scholar] [CrossRef] [PubMed] [Green Version]
- Suchard, M.A.; Lemey, P.; Baele, G.; Ayres, D.L.; Drummond, A.J.; Rambaut, A. Bayesian phylogenetic and phylodynamic data integration using BEAST 1.10. Virus Evol. 2018, 4, vey016. [Google Scholar] [CrossRef] [Green Version]
- Drummond, A.J.; Ho, S.Y.W.; Phillips, M.J.; Rambaut, A. Relaxed Phylogenetics and Dating with Confidence. PLoS Biol. 2006, 4, e88. [Google Scholar] [CrossRef]
- Bouckaert, R.R.; Drummond, A.J. bModelTest: Bayesian phylogenetic site model averaging and model comparison. BMC Evol. Biol. 2017, 17, 42. [Google Scholar] [CrossRef] [PubMed] [Green Version]
- Biek, R.; Pybus, O.G.; Lloyd-Smith, J.O.; Didelot, X. Measurably evolving pathogens in the genomic era. Trends Ecol. Evol. 2015, 30, 306–313. [Google Scholar] [CrossRef] [PubMed] [Green Version]
- Gill, M.S.; Lemey, P.; Bennett, S.N.; Biek, R.; Suchard, M.A. Understanding past population dynamics: Bayesian coalescent-based modeling with covariates. Syst. Biol. 2016, 65, 1041–1056. [Google Scholar] [CrossRef] [PubMed]
- Rambaut, A.; Drummond, A.J.; Xie, D.; Baele, G.; Suchard, M.A. Posterior Summarization in Bayesian Phylogenetics Using Tracer 1.7. Syst. Biol. 2018, 67, 901–904. [Google Scholar] [CrossRef] [Green Version]
- Taggart, P.L.; Hall, R.N.; Cox, T.E.; Kovaliski, J.; McLeod, S.R.; Strive, T. Changes in virus transmission dynamics following the emergence of RHDV2 shed light on its competitive advantage over previously circulating variants. Transbound. Emerg. Dis. 2022, 69, 1118–1130. [Google Scholar] [CrossRef]
- Hall, R.N.; King, T.; O’Connor, T.; Read, A.J.; Arrow, J.; Trought, K.; Duckworth, J.; Piper, M.; Strive, T. Age and infectious dose significantly affect disease progression after RHDV2 infection in naïve domestic rabbits. Viruses 2021, 13, 1184. [Google Scholar] [CrossRef]


| Strains | Model | N Epochs | Epoch Time Changes |
|---|---|---|---|
| RHDV1 | BSP | 9 | Free |
| RHDV2 | BSP | 5 | Free |
| RCV-A1 | BSP | 5 | Free |
| RHDV1 | Skygrid | 12 | 2017.12, 2016.5, 2015.5, 2014.5, 2013.5, 2009.5, 2007.5, 2005.5, 2000.5, 1997.5, 1996.5, 1995.5, Root |
| RHDV2 | Skygrid | 6 | 2017.863, 2017.5, 2016.5, 2015.5, 2014.5, 2013.5, Root |
| RCV-A1 | Skygrid | 8 | 2014.86, 2012.5, 2010.5, 2009.5, 2008.5, 2007.5, 2005.5, 2000.5, Root |
| RHDV1 | BDMM | 6 | 2017.12, 2016.5, 2014.5, 2013.23, 2009.5, 1996.5, Root |
| RHDV2 | BDMM | 4 | 2017.863, 2017.5, 2016.5, 2014.5, Root |
| RHDV1&RHDV2 | BDMM | 5 | 2017.863, 2015.5, 2014.5, 2013.23, 1996.5, Root |
| Parameter | Genotype | 2.75% | 50% | 97.50% |
|---|---|---|---|---|
| Infectious period | RHDV1 | 1.06 | 0.7 | 0.44 |
| Infectious period | RHDV2 | 0.17 | 0.25 | 0.35 |
Disclaimer/Publisher’s Note: The statements, opinions and data contained in all publications are solely those of the individual author(s) and contributor(s) and not of MDPI and/or the editor(s). MDPI and/or the editor(s) disclaim responsibility for any injury to people or property resulting from any ideas, methods, instructions or products referred to in the content. |
© 2022 by the authors. Licensee MDPI, Basel, Switzerland. This article is an open access article distributed under the terms and conditions of the Creative Commons Attribution (CC BY) license (https://creativecommons.org/licenses/by/4.0/).
Share and Cite
Pacioni, C.; Hall, R.N.; Strive, T.; Ramsey, D.S.L.; Gill, M.S.; Vaughan, T.G. Comparative Epidemiology of Rabbit Haemorrhagic Disease Virus Strains from Viral Sequence Data. Viruses 2023, 15, 21. https://doi.org/10.3390/v15010021
Pacioni C, Hall RN, Strive T, Ramsey DSL, Gill MS, Vaughan TG. Comparative Epidemiology of Rabbit Haemorrhagic Disease Virus Strains from Viral Sequence Data. Viruses. 2023; 15(1):21. https://doi.org/10.3390/v15010021
Chicago/Turabian StylePacioni, Carlo, Robyn N. Hall, Tanja Strive, David S. L. Ramsey, Mandev S. Gill, and Timothy G. Vaughan. 2023. "Comparative Epidemiology of Rabbit Haemorrhagic Disease Virus Strains from Viral Sequence Data" Viruses 15, no. 1: 21. https://doi.org/10.3390/v15010021