
Using Wastewater Surveillance to Compare COVID-19 Outbreaks during the Easter Holidays over a 2-Year Period in Cape Town, South Africa
 , , , , , and
Abstract
:1. Introduction
2. Materials and Methods
2.1. Wastewater Sample Collection and Processing
2.2. SARS-CoV-2 Quantification by RT-qPCR
2.3. Data Analysis
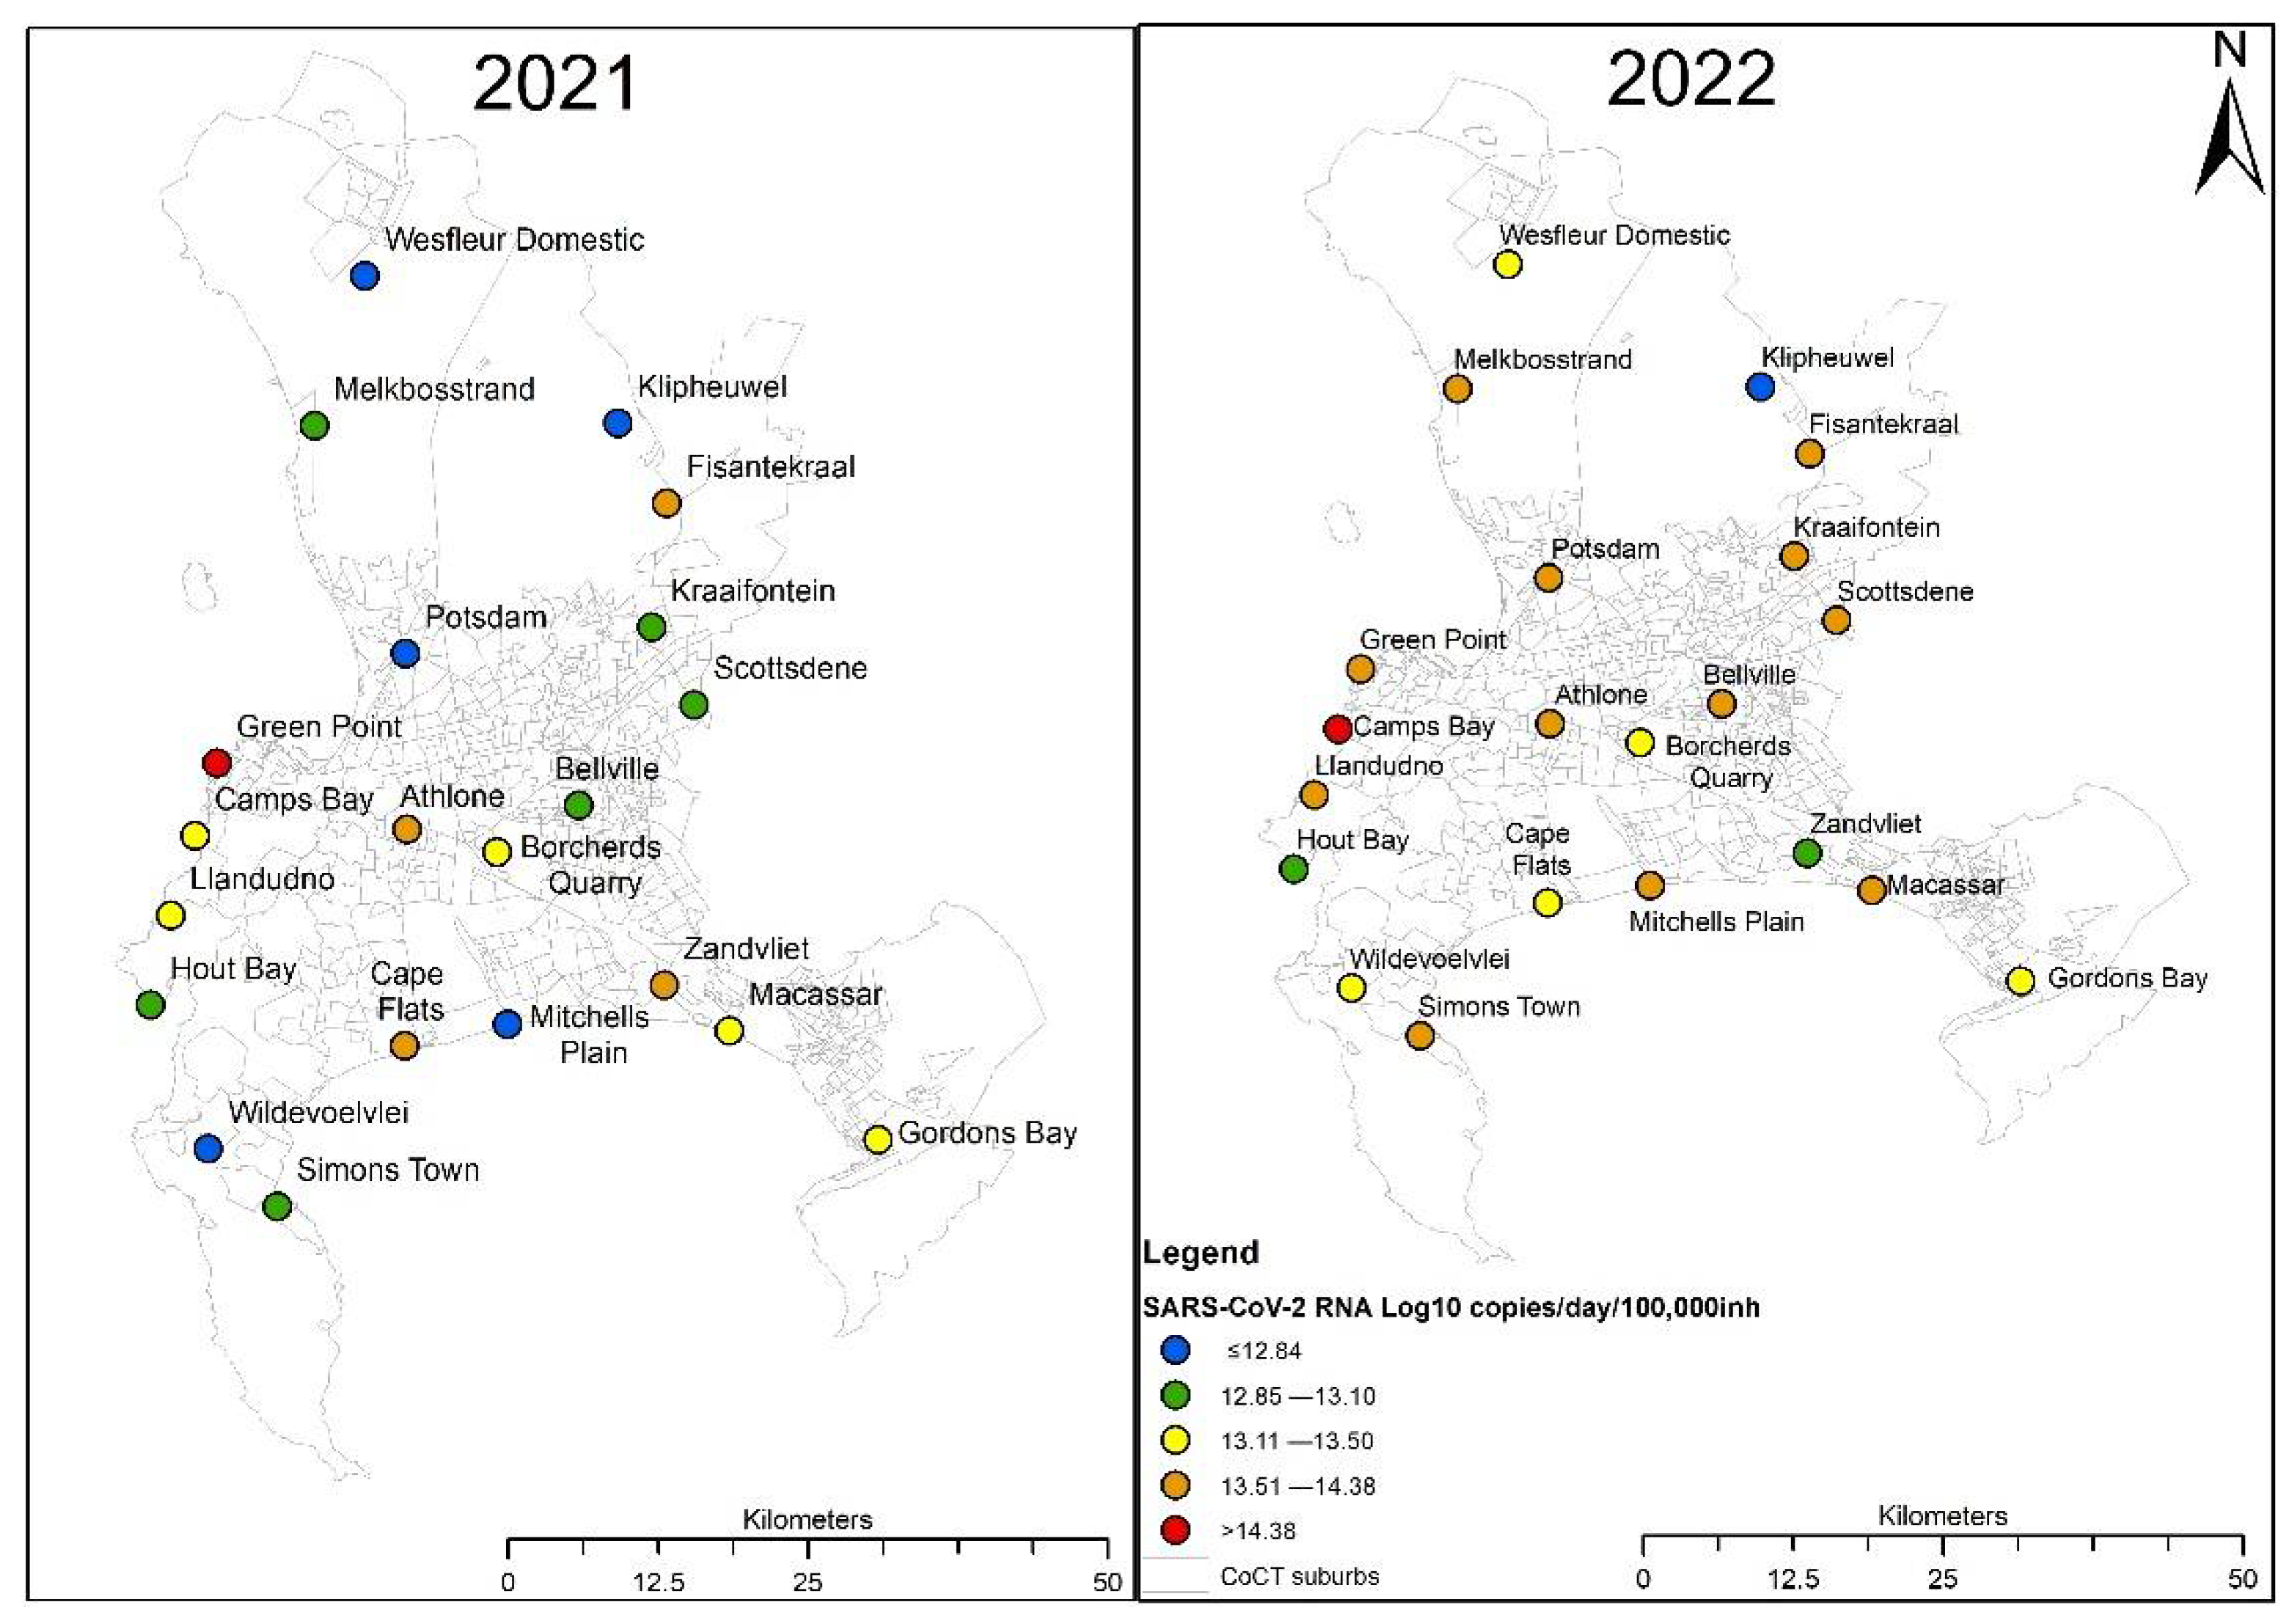
2.4. Spatial Data
3. Results
4. Discussion
5. Conclusions
Supplementary Materials
Author Contributions
Funding
Institutional Review Board Statement
Informed Consent Statement
Data Availability Statement
Acknowledgments
Conflicts of Interest
References
- Agrawal, S.; Orschler, L.; Schubert, S.; Zachmann, K.; Heijnen, L.; Tavazzi, S.; Gawlik, B.M.; de Graaf, M.; Medema, G.; Lackner, S. Prevalence and circulation patterns of SARS-CoV-2 variants in European sewage mirror clinical data of 54 European cities. Water Res. 2022, 214, 118162. [Google Scholar] [CrossRef] [PubMed]
- Ai, Y.; Davis, A.; Jones, D.; Lemeshow, S.; Tu, H.; He, F.; Ru, P.; Pan, X.; Bohrerova, Z.; Lee, J. Wastewater SARS-CoV-2 monitoring as a community-level COVID-19 trend tracker and variants in Ohio, United States. Sci. Total Environ. 2021, 801, 149757. [Google Scholar] [CrossRef] [PubMed]
- Johnson, R.; Sharma, J.R.; Ramharack, P.; Mangwana, N.; Kinnear, C.; Viraragavan, A.; Glanzmann, B.; Louw, J.; Abdelatif, N.; Reddy, T.; et al. Tracking the circulating SARS-CoV-2 variant of concern in South Africa using wastewater-based epidemiology. Sci. Rep. 2022, 12, 1182. [Google Scholar] [CrossRef] [PubMed]
- Shao, W.; Zhang, W.; Fang, X.; Yu, D.; Wang, X. Challenges of SARS-CoV-2 Omicron variant and appropriate countermeasures. J. Microbiol. Immunol. Infect. 2022, 55, 387–394. [Google Scholar] [CrossRef]
- Smyth, D.S.; Trujillo, M.; Gregory, D.A.; Cheung, K.; Gao, A.; Graham, M.; Guan, Y.; Guldenpfennig, C.; Hoxie, I.; Kannoly, S.; et al. Tracking cryptic SARS-CoV-2 lineages detected in NYC wastewater. Nat. Commun. 2022, 13, 635. [Google Scholar] [CrossRef]
- Johnson, R.; Mangwana, N.; Sharma, J.R.; Muller, C.J.F.; Malemela, K.; Mashau, F.; Dias, S.; Ramharack, P.; Kinnear, C.; Glanzmann, B.; et al. Delineating the spread and prevalence of SARS-CoV-2 Omicron sublineages (BA.1–BA.5) and Deltacron using wastewater in the Western Cape, South Africa. J. Infect. Dis. 2022, 226, 1418–1427. [Google Scholar] [CrossRef]
- Ahmed, W.; Angel, N.; Edson, J.; Bibby, K.; Bivins, A.; O’Brien, J.W.; Choi, P.M.; Kitajima, M.; Simpson, S.L.; Li, J.; et al. First confirmed detection of SARS-CoV-2 in untreated wastewater in Australia: A proof of concept for the wastewater surveillance of COVID-19 in the community. Sci. Total Environ. 2020, 728, 138764. [Google Scholar] [CrossRef]
- Medema, G.; Heijnen, L.; Elsinga, G.; Italiaander, R.; Brouwer, A. Presence of SARS-Coronavirus-2 RNA in Sewage and Correlation with Reported COVID-19 Prevalence in the Early Stage of the Epidemic in The Netherlands. Environ. Sci. Technol. Lett. 2020, 7, 511–516. [Google Scholar] [CrossRef]
- Wurtzer, S.; Marechal, V.; Mouchel, J.M.; Maday, Y.; Teyssou, R.; Richard, E.; Almayrac, J.L.; Moulin, L. Evaluation of lockdown effect on SARS-CoV-2 dynamics through viral genome quantification in waste water, Greater Paris, France, 5 March to 23 April 2020. Eurosurveillance 2020, 25, 2000776. [Google Scholar] [CrossRef]
- Duvallet, C.; Wu, F.; McElroy, K.A.; Imakaev, M.; Endo, N.; Xiao, A.; Zhang, J.; Floyd-O’Sullivan, R.; Powell, M.M.; Mendola, S.; et al. Nationwide trends in COVID-19 cases and SARS-CoV-2 RNA wastewater concentrations in the United States. ACS ES&T Water 2022, 2, 1899–1909. [Google Scholar] [CrossRef]
- Guerrero-Latorre, L.; Collado, N.; Abasolo, N.; Anzaldi, G.; Bofill-Mas, S.; Bosch, A.; Bosch, L.; Busquets, S.; Caimari, A.; Canela, N.; et al. The Catalan Surveillance Network of SARS-CoV-2 in sewage: Design, implementation, and performance. Sci. Rep. 2022, 12, 16704. [Google Scholar] [CrossRef] [PubMed]
- de Freitas Bueno, R.; Claro, I.C.M.; Augusto, M.R.; Duran, A.F.A.; Camillo, L.d.M.B.; Cabral, A.D.; Sodré, F.F.; Brandão, C.C.S.; Vizzotto, C.S.; Silveira, R.; et al. Wastewater-based epidemiology: A Brazilian SARS-CoV-2 surveillance experience. J. Environ. Chem. Eng. 2022, 10, 108298. [Google Scholar] [CrossRef] [PubMed]
- Kumar, M.; Joshi, M.; Shah, A.V.; Srivastava, V.; Dave, S. Wastewater surveillance-based city zonation for effective COVID-19 pandemic preparedness powered by early warning: A perspectives of temporal variations in SARS-CoV-2-RNA in Ahmedabad, India. Sci. Total Environ. 2021, 792, 148367. [Google Scholar] [CrossRef] [PubMed]
- Maida, C.M.; Amodio, E.; Mazzucco, W.; La Rosa, G.; Lucentini, L.; Suffredini, E.; Palermo, M.; Andolina, G.; Iaia, F.R.; Merlo, F.; et al. Wastewater-based epidemiology for early warning of SARS-CoV-2 circulation: A pilot study conducted in Sicily, Italy. Int. J. Hyg. Environ. Health 2022, 242, 113948. [Google Scholar] [CrossRef]
- Randazzo, W.; Truchado, P.; Cuevas-Ferrando, E.; Simón, P.; Allende, A.; Sánchez, G. SARS-CoV-2 RNA in wastewater anticipated COVID-19 occurrence in a low prevalence area. Water Res. 2020, 181, 115942. [Google Scholar] [CrossRef] [PubMed]
- Gonçalves, J.; Koritnik, T.; Mioč, V.; Trkov, M.; Bolješič, M.; Berginc, N.; Prosenc, K.; Kotar, T.; Paragi, M. Detection of SARS-CoV-2 RNA in hospital wastewater from a low COVID-19 disease prevalence area. Sci. Total Environ. 2021, 755 (Pt 2), 143226. [Google Scholar] [CrossRef]
- Wu, F.; Xiao, A.; Zhang, J.; Moniz, K.; Endo, N.; Armas, F.; Bonneau, R.; Brown, M.A.; Bushman, M.; Chai, P.R.; et al. SARS-CoV-2 RNA concentrations in wastewater foreshadow dynamics and clinical presentation of new COVID-19 cases. Sci. Total Environ. 2022, 805, 150121. [Google Scholar] [CrossRef]
- Li, L.; Mazurowski, L.; Dewan, A.; Carine, M.; Haak, L.; Guarin, T.C.; Dastjerdi, N.G.; Gerrity, D.; Mentzer, C.; Pagilla, K.R. Longitudinal monitoring of SARS-CoV-2 in wastewater using viral genetic markers and the estimation of unconfirmed COVID-19 cases. Sci. Total Environ. 2022, 817, 152958. [Google Scholar] [CrossRef]
- Mehta, S.H.; Clipman, S.J.; Wesolowski, A.; Solomon, S.S. Holiday gatherings, mobility and SARS-CoV-2 transmission: Results from 10 US states following Thanksgiving. Sci. Rep. 2021, 11, 17328. [Google Scholar] [CrossRef]
- Iacus, S.A.-O.; Santamaria, C.; Sermi, F.; Spyratos, S.; Tarchi, D.; Vespe, M. Human mobility and COVID-19 initial dynamics. Nonlinear Dyn. 2020, 101, 1901–1919. [Google Scholar] [CrossRef]
- Alessandretti, L. What human mobility data tell us about COVID-19 spread. Nat. Rev. Phys. 2022, 4, 12–13. [Google Scholar] [CrossRef] [PubMed]
- CDC. COVD-19: Activities, Gatherings & Holidays. Available online: https://www.cdc.gov/coronavirus/2019-ncov/your-health/gatherings.html (accessed on 12 November 2021).
- Evans, J. COVID-19: Gauteng Govt Worried about Risk of Easter Travel Infections. Available online: https://www.news24.com/news24/southafrica/news/covid-19-gauteng-govt-worried-about-risk-of-easter-travel-infections-20210319 (accessed on 8 December 2021).
- Ntsabo, M.; Persen, L. GP, WC Govts Warn COVID 3rd Wave Looming with Easter Long Weekend Approaching. Available online: https://ewn.co.za/2021/03/20/gp-wc-govts-warn-covid-3rd-wave-looming-as-country-enters-vacation-period (accessed on 8 December 2021).
- Department of Health: South Africa. Latest Vaccine Statistics. Available online: https://sacoronavirus.co.za/latest-vaccine-statistics/ (accessed on 11 May 2022).
- Johnson, R.; Muller, C.J.F.; Ghoor, S.; Louw, J.; Archer, E.; Surujlal-Naicker, S.; Berkowitz, N.; Volschenk, M.; Bröcker, L.H.L.; Wolfaardt, G.; et al. Qualitative and quantitative detection of SARS-CoV-2 RNA in untreated wastewater in Western Cape Province, South Africa. S. Afr. Med. J. 2021, 111, 198. [Google Scholar] [CrossRef] [PubMed]
- Peccia, J.; Zulli, A.; Brackney, D.E.; Grubaugh, N.D.; Kaplan, E.H.; Casanovas-Massana, A.; Ko, A.I.; Malik, A.A.; Wang, D.; Wang, M.; et al. Measurement of SARS-CoV-2 RNA in wastewater tracks community infection dynamics. Nat. Biotechnol. 2020, 38, 1164–1167. [Google Scholar] [CrossRef] [PubMed]
- Street, R.; Mathee, A.; Mangwana, N.; Dias, S.; Sharma, J.R.; Ramharack, P.; Louw, J.; Reddy, T.; Brocker, L.; Surujlal-Naicker, S.; et al. Spatial and Temporal Trends of SARS-CoV-2 RNA from Wastewater Treatment Plants over 6 Weeks in Cape Town. Int. J. Environ. Res. Public Health 2021, 18, 12085. [Google Scholar] [CrossRef]
- CDC. 2019-Novel Coronavirus (2019-nCov) Real-Time rRT-PCR Panel Primers and Probes. Available online: https://www.cdc.gov/coronavirus/2019-ncov/downloads/rt-pcr-panel-primer-probes.pdf (accessed on 16 October 2021).
- Western Cape Government. Western Cape COVID-19 Dashboard. Available online: https://coronavirus.westerncape.gov.za/covid-19-dashboard (accessed on 11 May 2022).
- Gonzalez, R.; Curtis, K.; Bivins, A.; Bibby, K.; Weir, M.H.; Yetka, K.; Thompson, H.; Keeling, D.; Mitchell, J.; Gonzalez, D. COVID-19 surveillance in Southeastern Virginia using wastewater-based epidemiology. Water Res. 2020, 186, 116296. [Google Scholar] [CrossRef]
- NGS-SA. Network for Genomic Surveillance in South Africa (NGS-SA), SARS-CoV-2 Sequencing Update 29 April 2022. Available online: https://www.nicd.ac.za/wp-content/uploads/2022/04/Update-of-SA-sequencing-data-from-GISAID-29-Apr-2022.pdf (accessed on 11 May 2022).
- Tegally, H.; Moir, M.; Everatt, J.; Giovanetti, M.; Scheepers, C.; Wilkinson, E.; Subramoney, K.; Moyo, S.; Amoako, D.G.; Baxter, C.; et al. Continued emergence and evolution of Omicron in South Africa: New BA.4 and BA.5 lineages. medRxiv 2022. [Google Scholar] [CrossRef]
- Baker, J.M.; Nakayama, J.Y.; O’Hegarty, M.; McGowan, A.; Teran, R.A.; Bart, S.M.; Mosack, K.; Roberts, N.; Campos, B.; Paegle, A.; et al. SARS-CoV-2 B.1.1.529 (Omicron) variant transmission within households—Four U.S. Jurisdictions, November 2021–February 2022. MMWR Morb. Mortal. Wkly. Rep. 2022, 71, 341–346. [Google Scholar] [CrossRef]
- Dyer, O. COVID-19: Omicron is causing more infections but fewer hospital admissions than delta, South African data show. BMJ 2021, 375, n3104. [Google Scholar] [CrossRef]
- Yang, W.; Shaman, J. COVID-19 pandemic dynamics in South Africa and epidemiological characteristics of three variants of concern (Beta, Delta, and Omicron). medRxiv 2022. [Google Scholar] [CrossRef]
- Al-Duroobi, H.; Moghadam, S.V.; Phan, D.C.; Jafarzadeh, A.; Matta, A.; Kapoor, V. Wastewater surveillance of SARS-CoV-2 corroborates heightened community infection during the initial peak of COVID-19 in Bexar County, Texas. FEMS Microbes 2021, 2, xtab015. [Google Scholar] [CrossRef]
- Janssens, R.; Hanoteaux, S.; Maloux, H.; Klamer, S.; Laisnez, V.; Verhaegen, B.; Linard, C.; Lahousse, L.; Delputte, P.; Terwagne, M.; et al. SARS-CoV-2 surveillance in Belgian wastewaters. Viruses 2022, 14, 1950. [Google Scholar] [CrossRef] [PubMed]
- Cazelles, B.; Comiskey, C.; Nguyen-Van-Yen, B.; Champagne, C.; Roche, B. Parallel trends in the transmission of SARS-CoV-2 and retail/recreation and public transport mobility during non-lockdown periods. Int. J. Infect. Dis. 2021, 104, 693–695. [Google Scholar] [CrossRef] [PubMed]
- Nouvellet, P.; Bhatia, S.; Cori, A.; Ainslie, K.E.C.; Baguelin, M.; Bhatt, S.; Boonyasiri, A.; Brazeau, N.F.; Cattarino, L.; Cooper, L.V.; et al. Reduction in mobility and COVID-19 transmission. Nat. Commun. 2021, 12, 1090. [Google Scholar] [CrossRef] [PubMed]


| Dates | Paired Differences (Log10 gc/Day/100,000 inh) | Standard Deviation | p-Value | |
|---|---|---|---|---|
| Study week 1 | 1 March 2021 and 28 February 2022 | −0.1667 | 0.5001 | 0.1424 |
| Study week 2 | 8 March 2021 and 7 March 2022 | −0.6215 | 0.6104 | <0.001 |
| Study week 3 | 15 March 2021 and 14 March 2022 | −0.5486 | 0.4373 | <0.001 |
| Study week 4 | 22 March 2021 and 21 March 2022 | −0.4350 | 0.5211 | 0.1936 |
| Study week 5 | 29 March 2021 and 28 March 2022 | −0.9105 | 0.5522 | <0.001 |
| Study week 6 | 5 April 2021 and 4 April 2022 | −0.3168 | 0.6036 | 0.0345 |
| Study week 7 | 12 April 2021 and 11 April 2022 | −0.8657 | 0.5038 | <0.001 |
| Study week 8 | 19 April 2021 and 18 April 2022 | −0.5838 | 0.4106 | <0.001 |
| Study week 9 | 26 April 2021 and 25 April 2022 | −0.5920 | 0.6052 | <0.001 |
Disclaimer/Publisher’s Note: The statements, opinions and data contained in all publications are solely those of the individual author(s) and contributor(s) and not of MDPI and/or the editor(s). MDPI and/or the editor(s) disclaim responsibility for any injury to people or property resulting from any ideas, methods, instructions or products referred to in the content. |
© 2023 by the authors. Licensee MDPI, Basel, Switzerland. This article is an open access article distributed under the terms and conditions of the Creative Commons Attribution (CC BY) license (https://creativecommons.org/licenses/by/4.0/).
Share and Cite
Mahlangeni, N.; Street, R.; Horn, S.; Mathee, A.; Mangwana, N.; Dias, S.; Sharma, J.R.; Ramharack, P.; Louw, J.; Reddy, T.; et al. Using Wastewater Surveillance to Compare COVID-19 Outbreaks during the Easter Holidays over a 2-Year Period in Cape Town, South Africa. Viruses 2023, 15, 162. https://doi.org/10.3390/v15010162
Mahlangeni N, Street R, Horn S, Mathee A, Mangwana N, Dias S, Sharma JR, Ramharack P, Louw J, Reddy T, et al. Using Wastewater Surveillance to Compare COVID-19 Outbreaks during the Easter Holidays over a 2-Year Period in Cape Town, South Africa. Viruses. 2023; 15(1):162. https://doi.org/10.3390/v15010162
Chicago/Turabian StyleMahlangeni, Nomfundo, Renée Street, Suranie Horn, Angela Mathee, Noluxabiso Mangwana, Stephanie Dias, Jyoti Rajan Sharma, Pritika Ramharack, Johan Louw, Tarylee Reddy, and et al. 2023. "Using Wastewater Surveillance to Compare COVID-19 Outbreaks during the Easter Holidays over a 2-Year Period in Cape Town, South Africa" Viruses 15, no. 1: 162. https://doi.org/10.3390/v15010162