Article

The Isolation and Characterization of a Broad Host Range Bcep22-like Podovirus JC1

Department of Biological Sciences, University of Alberta, CW 405 Biological Sciences Building, Edmonton, AB T6G 2E9, Canada
*
Author to whom correspondence should be addressed.
Viruses 2022, 14(5), 938; https://doi.org/10.3390/v14050938
Submission received: 2 April 2022 / Revised: 25 April 2022 / Accepted: 26 April 2022 / Published: 29 April 2022
(This article belongs to the Special Issue Bacteriophages from Biology to Therapy for the 21st Century)

Abstract

:
Bacteriophage JC1 is a Podoviridae phage with a C1 morphotype, isolated on host strain Burkholderia cenocepacia Van1. Phage JC1 is capable of infecting an expansive range of Burkholderia cepacia complex (Bcc) species. The JC1 genome exhibits significant similarity and synteny to Bcep22-like phages and to many Ralstonia phages. The genome of JC1 was determined to be 61,182 bp in length with a 65.4% G + C content and is predicted to encode 76 proteins and 1 tRNA gene. Unlike the other Lessieviruses, JC1 encodes a putative helicase gene in its replication module, and it is in a unique organization not found in previously analyzed phages. The JC1 genome also harbours 3 interesting moron genes, that encode a carbon storage regulator (CsrA), an N-acetyltransferase, and a phosphoadenosine phosphosulfate (PAPS) reductase. JC1 can stably lysogenize its host Van1 and integrates into the 5′ end of the gene rimO. This is the first account of stable integration identified for Bcep22-like phages. JC1 has a higher global virulence index at 37 °C than at 30 °C (0.8 and 0.21, respectively); however, infection efficiency and lysogen stability are not affected by a change in temperature, and no observable temperature-sensitive switch between lytic and lysogenic lifestyle appears to exist. Although JC1 can stably lysogenize its host, it possesses some desirable characteristics for use in phage therapy. Phage JC1 has a broad host range and requires the inner core of the bacterial LPS for infection. Bacteria that mutate to evade infection by JC1 may develop a fitness disadvantage as seen in previously characterized LPS mutants lacking inner core.

1. Introduction

Antibiotic resistance is a serious global concern, and it is predicted that multi-drug resistant (MDR) bacterial infections will cause over 10 million deaths worldwide annually by 2050 if left unchecked [1]. In 2018 there were just under 1 million bacterial infections in Canada, with a quarter being resistant to frontline antimicrobials [2]. Of these infections, 14,000 people died, and 4 out of 10 deaths would not have occurred if these infections had been susceptible to frontline antimicrobials [2].
Individuals with cystic fibrosis (CF) constantly battle microbial infections and are already experiencing the negative impacts of MDR infections, casting a light on the severity of what lies ahead with MDR infections. Burkholderia cenocepacia is a Gram-negative opportunistic pathogen that colonizes the lungs of CF patients. B. cenocepacia also has extreme MDR and is associated with poor prognosis and severe patient-to-patient transmission for CF patients [3]. Though infections with B. cenocepacia remain relatively low (3.7% of CF patients), they pose a significant threat because of their intrinsic and adaptive resistance to antibiotics and ability to cause life threatening “cepacia syndrome” [3,4,5].
An alternative treatment option for MDR bacteria is the therapeutic use of bacteriophages. Their use as a therapy in North America declined after the discovery of antibiotics, but the increase in antimicrobial resistance has renewed phage therapy as a promising alternative treatment option [6]. Phages are viruses that specifically target and lyse bacterial cells via adsorption to cells using a cellular receptor, injecting their genetic material, and replicating themselves until the cell bursts [6]. Given that the mechanism of action for phages are drastically different from antibiotics, they are an effective tool against MDR bacteria [6]. Additionally, the combined use of antibiotics and phage against bacteria can increase the killing activity of one or both agents, exceeding activity of solo treatment [7,8,9,10]. In this study, we have isolated and characterized JC1, a novel member of the Bcep22-like Podoviridae phages. We have shown that JC1 has a broad host range and confirmed the LPS inner core of B. cenocepacia strain K56-2 as its receptor. As a first account for this phage group, we have shown JC1 is able to stably lysogenize its host B. cenocepacia strain Van1 and that a growth difference exists between wildtype Van1 and the JC1 lysogen.

2. Materials and Methods

2.1. Bacterial Strains and Growth Conditions

Bacterial strains used in this study are listed in Table 1. B. cenocepacia clinical isolate from Vancouver was named Van1 and used for isolation of phages from soil samples. Van1 and the JC1 lysogen were grown aerobically overnight at 37 °C on full-strength Lennox (LB; 10 g/L tryptone, 5 g/L yeast extract, 5 g/L NaCl) solid medium or in LB broth with shaking at 225 RPM unless stated otherwise. All other strains were grown at 30 °C on half-strength LB. Media was supplemented with 50–150 µg/mL tetracycline (Tc) antibiotic for plasmid maintenance when necessary. Suspension media (SM; 50 mM Tris-HCl [pH 7.5], 100 mM NaCl, 10 mM MgSC4) was used for all phage work. Any statistical analysis was conducted using GraphPad Prism 9 (Graph-Pad Software Inc., San Diego, CA, USA).

2.2. Phage Isolation, Propagation, Host Range Analysis, and Electron Microscopy

Phage JC1 (vB_BceP_JC1) was isolated from potting soil in Edmonton, AB, Canada as previously described [11] with B. cenocepacia clinical isolate Van1. Briefly, soil was mixed with 1/2 LB broth, SM, and B. cenocepacia Van1 liquid culture and incubated at 30 °C overnight with aeration. The soil slurry was then pelleted by centrifugation and the supernatant was filter sterilized using a Millex-HA 0.45 µM syringe-driven filter unit (Millipore, Billerica, MA, USA). A double agar overlay with Van1 and the supernatant was incubated overnight at 30 °C. A single plaque was isolated using a sterile Pasteur pipette and suspended in 500 µL of SM with 20 µL chloroform to generate a JC1 stock.
Propagation of JC1 was performed at 30 °C using double agar overlays as previously described [11,12], or in liquid. For liquid propagation, 150 µL of a Van1 overnight culture was mixed with 150 µL of JC1 lysate (1010 PFU/mL) and incubated for 30 min. After the brief incubation 1.5 mL of SM and 15 mL of LB broth was added to the mixture and incubated overnight with aeration at 225 RPM. Bacterial cells were pelleted by centrifugation at 18,514× g for 3 min. The supernatant was collected, and filter sterilized using a Millex-HA 0.45 µM or 0.22 µM syringe-driven filter unit (Millipore, Billerica, MA, USA). JC1 phage stocks were serially diluted into SM and spotted onto soft agar overlays of Van1 to determine stock titer. Plaques were backlit and viewed under magnification using a New Brunswick Scientific colony counter (model C110). Average plaque size was determined from 10 plaques ± standard deviation measured using a digital caliper (Tresna, Guilin, China).
Host range analysis was performed using a collection of 85 phenotypically distinct clinical and environmental isolates listed in Table 1. A high titer JC1 phage stock (1 × 10¹⁰ PFU/mL) was serially diluted in SM and 5 µL of each dilution was spotted onto double agar overlays of each strain and incubated at 37 °C overnight. Efficiency of plating (EOP) was calculated by dividing the PFU/mL of JC1 on each strain by the actual PFU/mL determined on host Van1. EOP was only calculated for strains that JC1 could produce plaques on. Strains that showed lysis, but no plaques, were included in the host range but were scored using a range of 1 to 3 “+” signs instead of an EOP score.
For electron microscopy, phages were purified by cesium chloride density gradient ultracentrifugation and dialysis. CsCl was dissolved in high titer JC1 lysate to a density of 1.45 g/mL followed by ultracentrifugation at 35,000 RPM in a 50.2 Ti rotor for 20 h at 4 °C. The phage band was extracted into 12 kDa molecular weight cutoff dialysis tubing and dialyzed at 4 °C in 1.5 L SM for 4 days, with the SM buffer changed every 24 h. Ten µL purified phage lysate was loaded onto a carbon-coated copper grid for 2 min and stained with 4% uranyl acetate for 20 s, as previously described [43]. Transmission electron micrographs were captured using a Philips/FEI Morgagni transmission electron microscope with charge-coupled device camera at 80 kV (U. Alberta Dept. of Biological Sciences Advanced Microscopy Facility). The average capsid and tail dimensions ± standard deviation was calculated using Microsoft Excel based on measurements from 10 individual virions taken using ImageJ software (NIH, Bethesda, MD, USA).

2.3. Phage DNA Isolation and Sequencing

JC1 genomic DNA (gDNA) was isolated from a high titer phage stock using the Wizard Lambda DNA purification system (Promega Corp., Madison, WI, USA) with some modifications. A 1 mL aliquot of JC1 was incubated with 1 µL of 10 mg/mL DNase I (Thermo Scientific, Waltham, MA, USA), 10 µL DNase I buffer (1 M Tris-HCl, 0.25 M MgCl2, 10 mM CaCl2), and 0.6 µL of 10 mg/mL RNase A (Thermo Scientific) for 1 h at 37 °C. After incubation, 40 µL of 0.5 M EDTA (pH 8.5) was added to inactivate DNase I and 3.125 µL of 25 mg/mL proteinase K (Applied Biosystems, Carlsbad, CA, USA) and incubated at 55 °C for 1 h to degrade proteins and release phage DNA. The treated lysate was allowed to cool to room temperature and added to 0.84 g of guanidine thiocyanate and 1 mL of pre-warmed (37 °C) resuspended Wizard DNA Clean-Up Resin (Promega Corporation, Madison, WI, USA). This mixture was rocked at room temperature for 20 min, then transferred into a syringe attached to a Wizard Minicolumn (Promega Corporation) and pushed though the column. The column was then washed with 3 mL 80 % isopropanol and dried by centrifugation for 2 min at 10,000× g. JC1 phage DNA was then incubated for 1 min with 100 μL of 80 °C sterile milli-Q water (Integrated DNA Technologies, Coralville, IA, USA) and eluted from the column by centrifugation for 1 min at 10,000× g. A NanoDrop ND-1000 spectrophotometer (Thermo Scientific, Waltham, MA, USA) was used to determine purity and concentration of eluted DNA. JC1 gDNA was sent for sequencing at The Applied Genomics Core at the University of Alberta. A Nextera XT library prep kit was used to generate the DNA genomic library followed by paired-end sequencing on a MiSeq (Illumina, San Diego, CA, USA) platform using a MiSeq v3 reagent kit. 4.8.

2.4. Bioinformatic Analysis of JC1

Read quality was assessed using FastQC v0.11.9 (http://www.bioinformatics.babraham.ac.uk/projects/fastqc/ accessed on 19 January 2022) and trimmed using Trimmomatic v.0.39 with the following parameters: a four-base sliding window that cuts when the average quality per base drops below 20, removes leading and trailing low quality or N bases (below quality 3), and a minimum read length of 35 bp. Of 1,00,666 reads, 92.58% of both read pairs survived trimming and were assembled using SPAdes v3.13.0 [44], resulting in a final contig length of 61,191 bp contig with 1,711,139 reads mapping to 100% of the contig to give an average fold coverage of 3657. PCR and sanger sequencing was used to confirm the assembly by amplifying 13 different regions spanning areas of lower coverage and the “ends” of the contig. The product spanning the ends of the contig lacked a 9 bp repeat sequence, confirming a complete genome length of 61,182 bp. The JC1 genome was determined to be circularly permuted based on read coverage and assembly outputs.
Annotation of the contig was performed using three different annotation software: GLIMMER using the Bacteria and Archaea setting [45], Prodigal [46], and GeneMarkS for phage [47]. BLASTn was used to find related phages and BLASTp was used to identify predicted protein-coding genes and putative functions. Protein-protein BLAST was set to the Bacteria database (taxid:2) when no significant hits were found using the Viruses database (taxid:10239). NCBI non-redundant protein sequence and nucleotide collection databases (update date: 22 January 2022) were used. Hits with an E-value of 1 × 10⁻³ or greater were not considered significant, and annotations were recorded as hypothetical. Conserved domains were identified using Batch CD-Search against the CDD v3.19 58,235 PSSMs database with default settings [48]. TMHMM 2.0 [49], and SignalP 6.0 [50], were used for lysis protein analysis and prediction of lipoproteins, respectively. Aragorn (Galaxy Version 0.6) [51] was used to identify potential tRNA genes. Protein alignments were accomplished using MUSCLE [52]. Whole genome alignments and comparisons were done using MAFFT multiple aligner v1.4.0 [53] and Mauve v1.1.1 [54] plugins for Geneious. The complete genome sequence of JC1 was deposited in GenBank with the accession number OM283127.

2.5. Mass Spectrometry Analysis of JC1

JC1 was purified for proteomic analysis using a CsCl density gradient centrifugation. A 150 mL volume of JC1 lysate (1010 PFU/mL) was concentrated using ultracentrifugation at 28,700 RPM in a 50.2Ti rotor at 4 °C for 1.2 h. The JC1 pellets were resuspended with SM to a final volume of 16 mL and prepared for CsCl purification according to the manufacturer recommendations (Beckman Coulter 2008). The CsCl gradient was centrifuged at 30,000 RPM in a 50.2Ti rotor at 4 °C for 20 h. JC1 ghost band was removed and dialyzed thoroughly with SM. Phage were prepared for mass spectrometry analysis by boiling purified lysate for 5 min in Laemmli sample buffer (62.5 mM Tris-HCl [pH 6.8], 2% SDS, 10% glycerol, 5% β-mercaptoethanol, 0.001% bromophenol blue), and running on a 10% SDS-PAGE gel. PageRuler Plus Prestained Protein Ladder (Thermo Scientific) was used as a molecular weight standard and 30 µL of JC1 CsCl purified lysate (1010 PFU/mL) in 1× sample buffer was loaded into an adjacent well. The lane was excised for whole-lane mass spectrometry analysis at the Alberta Proteomics and Mass Spectrometry (APM) facility located at the University of Alberta. Proteins were considered virion associated if they were identified by two or more unique medium to high quality peptides.

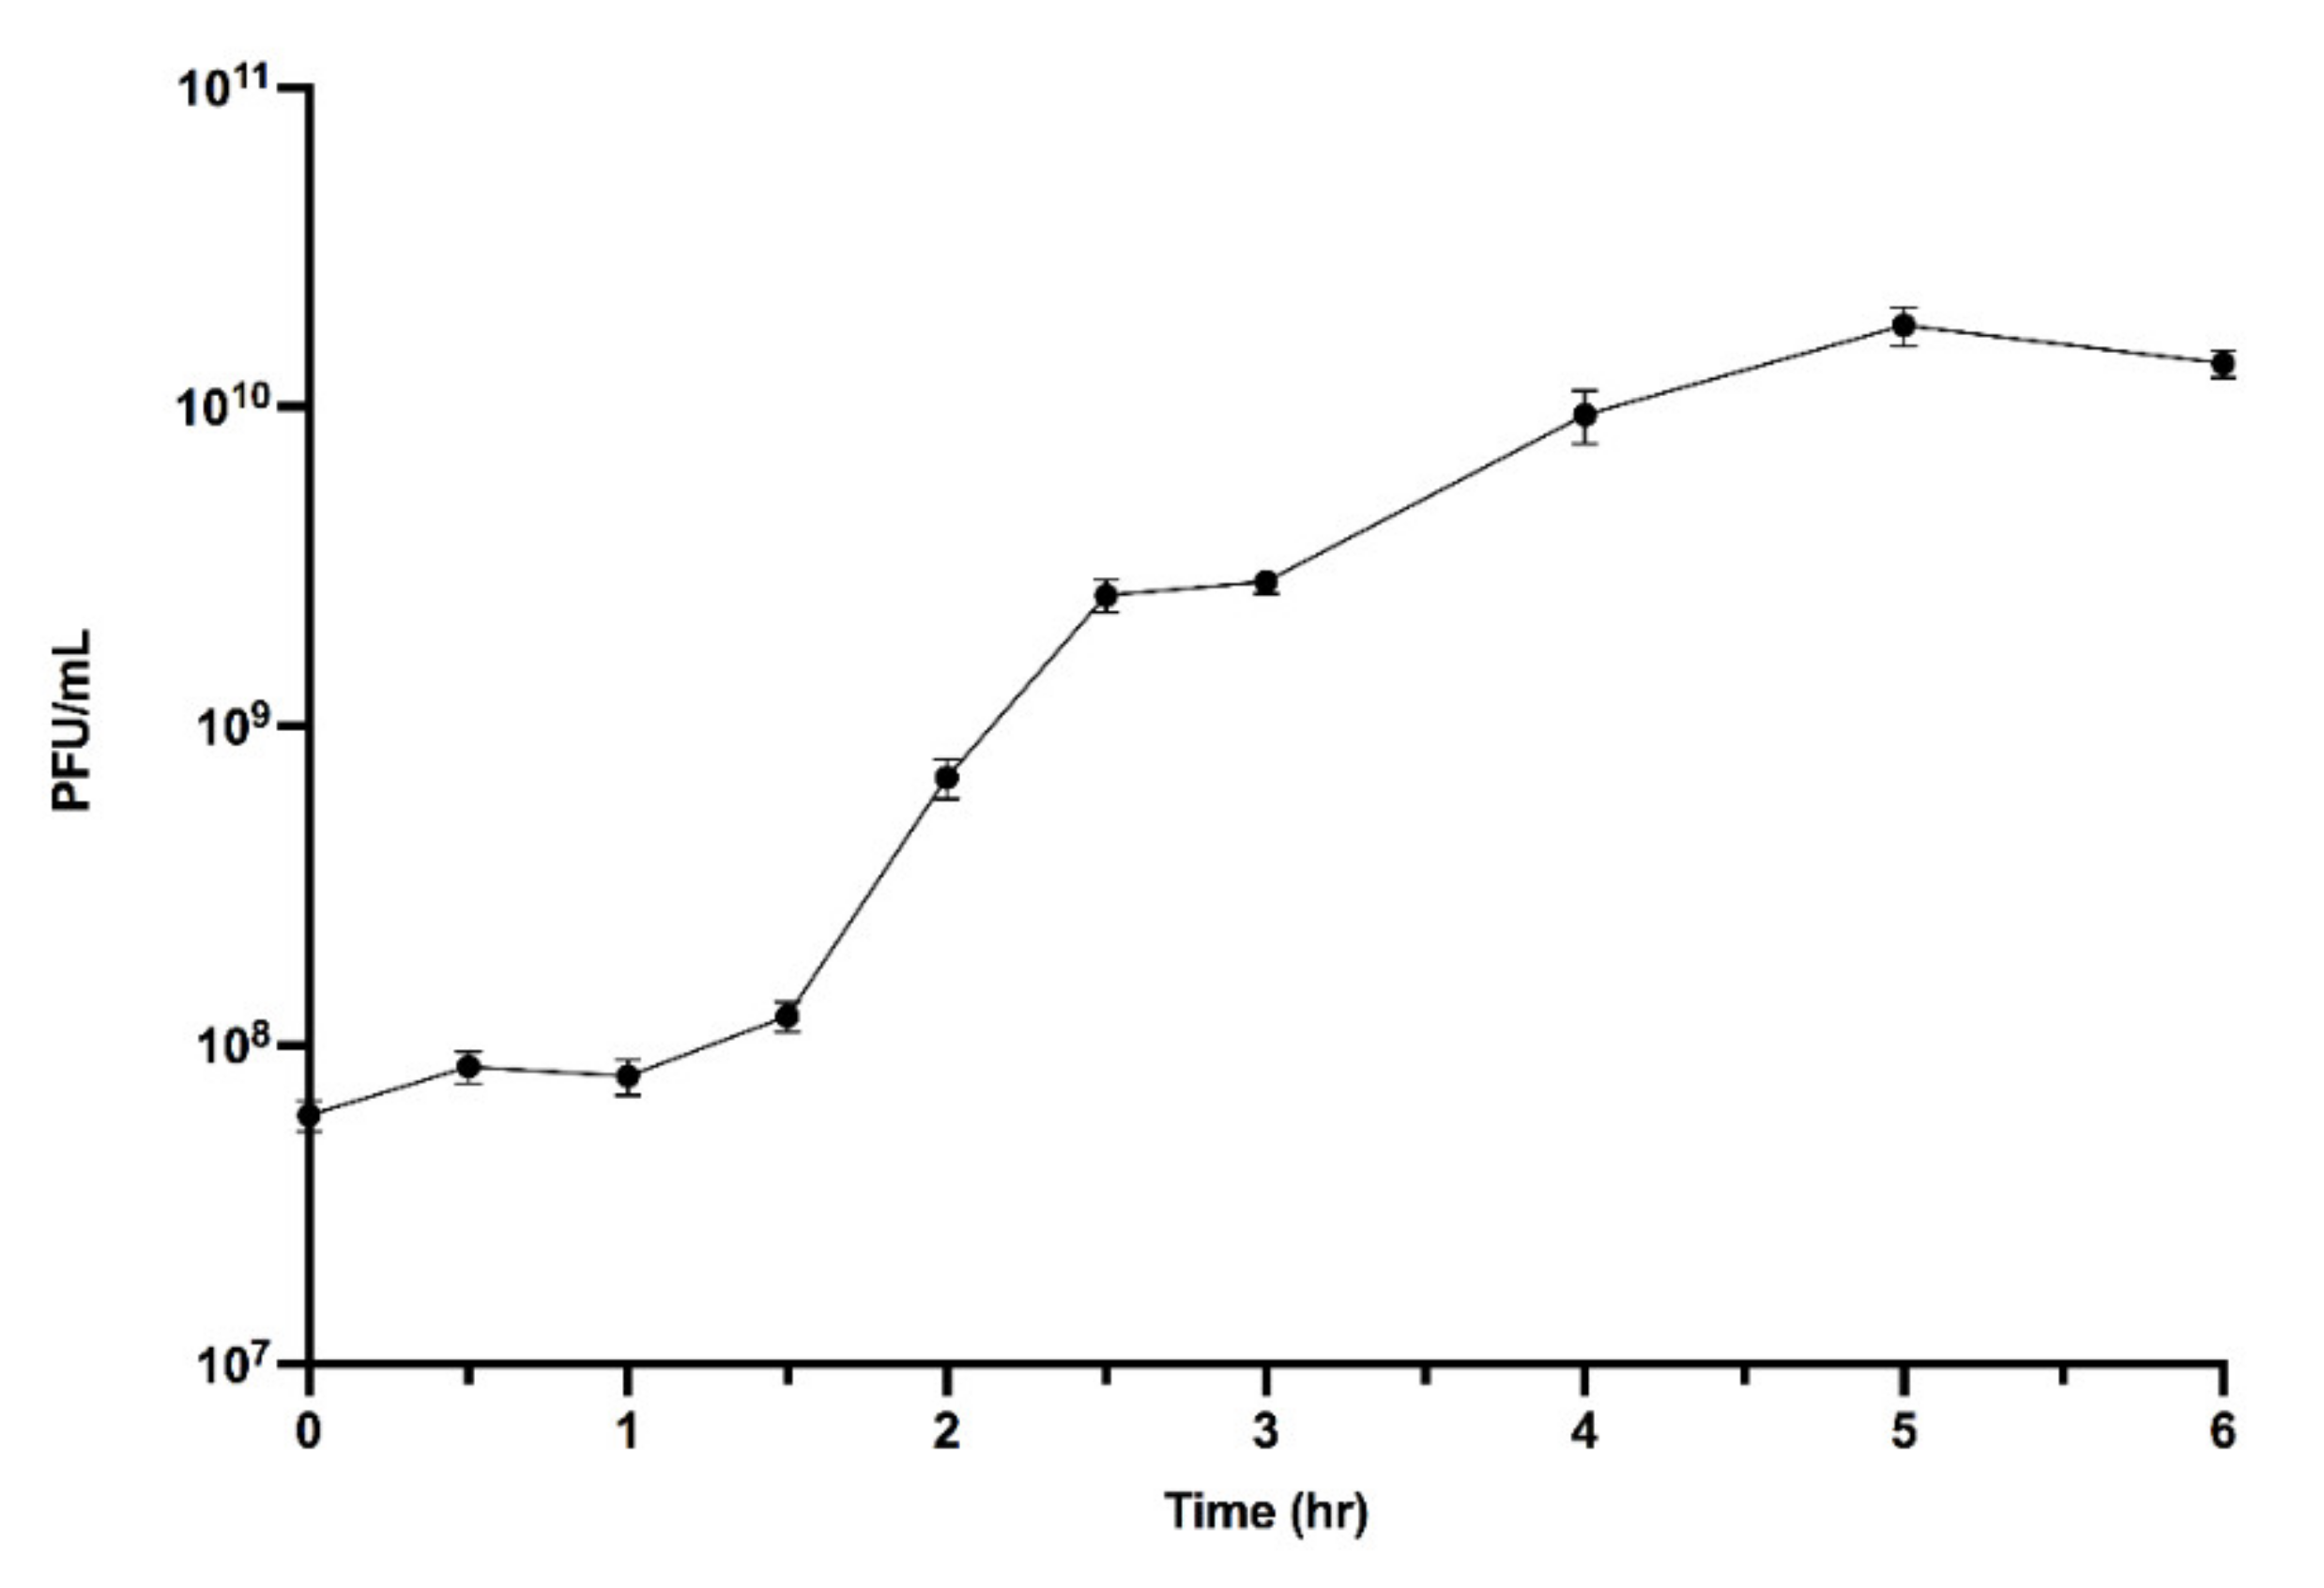
2.6. One-Step Growth Curve

One-step growth curve of JC1 on B. cenocepacia Van1 was conducted as previously described [7,55] with minor modifications. Overnight liquid cultures of Van1 were subcultured 1:100 and grown for approximately 2 h and 45 min to a CFU/mL of ~3 × 10⁷. JC1 lysate was added at an MOI of approximately 2 and incubated at 37 °C with aeration at 225 RPM. A volume of 10 μL was removed in triplicate every 30 min and immediately serially diluted in 1× PBS. Phage titers were determined by spotting 5 µL of each dilution on soft agar overlays containing Van1 culture. Burst size was calculated using the formula “burst size = P/I” where P is the maximum number of phages after lysis and I is the number of phages initially added to the culture. Resulting data from three replicates were analyzed using GraphPad Prism 9 (GraphPad Software Inc., San Diego, CA, USA).

2.7. Complementation of LPS Mutants

Plasmids used in this study are listed in Supplementary Table S1. The LPS genes for each of the seven mutants were amplified from B. cenocepacia K56-2 gDNA using primer pairs listed in Supplementary Table S2. Resulting PCR products were digested with XbaI and KpnI Fast Digest restriction endonucleases (Thermo Scientific), ligated with T4 DNA ligase (NEB) into the vector pSCrhaB2-Tc, and transformed into Escherichia coli DH5α. Each resulting construct was verified with Sanger sequencing and transformed into the desired electrocompetent K56-2 LPS mutant strain.

2.8. Identification of Phage Receptor

High titer JC1 (1010 PFU/mL) was spotted onto double agar overlays of wt K56-2 or LPS mutants carrying either an empty vector control or the complementation plasmid and observed for lysis. Receptor analysis was examined further as previously described [56]. Phage adsorption assays were performed with B. cenocepacia Van1 and K56-2 cultures treated with either periodate or proteinase K to destroy either LPS or cell surface proteins, respectively. For proteinase K treatment, 2 mL of culture was treated with 0.2 mg/mL proteinase K (Applied Biosystems, Carlsbad, CA, USA), incubated at 37 °C for 3 h, and washed 2× with LB. For periodate treatment, 2 mL of culture was centrifuged at 6000× g for 3 min, and the bacterial pellet was resuspended in 1.5 mL sodium acetate (50 mM; pH 5.2) or sodium acetate with 10 or 100 mM IO4 and incubated for 2 h (protected from light). The cells were then washed 2× with LB. Bacterial suspensions were standardized using OD600. A 100 µL volume of JC1 (1 × 10⁶ PFU/mL) was incubated with a 500 µL sample of each treated bacteria, as well as an LB negative control and an untreated bacterial control for 30 min at room temperature. These samples were then centrifuged at 13,523× g for 3 min and tittered to determine the PFU/mL. The phage titer in the negative control supernatants were set to 100%. Each assay was performed in technical and biological triplicate.

2.9. Determination of JC1 Lifestyle and Integration Site

A liquid propagation of JC1 and Van1 was set up as described above. Surviving cells were collected by centrifugation at 6000× g for 5 min, and the supernatant was discarded. Cells were washed 3× with LB broth to remove any extracellular phage and then resuspended in 5 mL LB broth. The washed cells were incubated again overnight at 37 °C with aeration at 225 RPM. The culture was then streaked onto LB solid media to obtain single colony isolates. Single colonies were then tested for superinfection resistance using overnight cultures of every isolate in a top agar overlay assay with Van1 spotted on top. Plates were incubated overnight at 37 °C and observed for zones of lysis. Colony PCR was also performed on each single colony to detect the presence or absence of the JC1 genome. Single colonies with no zone of lysis and a positive PCR result were retained for further analysis.
Stability was analyzed by streaking out 4 different JC1 lysogen isolates on to LB agar plates and incubating for 2 days at 37 °C. A single colony was picked from these plates and struck out onto a new plate to obtain a second streak out. This was then done a third time to obtain a third streak out. One colony from each streaked plate for each lysogen was tested for superinfection resistance to JC1 and the presence of the JC1 genome using PCR as described above.
Determination of JC1 integration site was conducted as previously described [57] with some modifications. Primers were made that flanked the 133 bp intergenic region upstream of the predicted serine recombinase (gp1) (Supplementary Table S2). Genomic DNA from a confirmed lysogen and pUCP22 were digested with SalI and ligated overnight with T4 DNA ligase (New England Biolabs) at 4 °C. 2.5 µL of the ligation mix was then used as a template in PCR using combinations of the primers that flank the upstream region of gp1 and M13 primers that flank the MCS of pUCP22. PCR products were sent for Sanger sequencing and analyzed using BLAST (https://blast.ncbi.nlm.nih.gov/Blast.cgi). The integration site was further confirmed with PCR using primer pairs that anneal to the Van1 genome flanking the identified integration site.

2.10. Growth Analysis of Van1 vs. JC1 Lysogen and JC1 Virulence Index

Potential growth differences between B. cenocepacia Van1 and JC1 lysogen were assessed in 3 complete medias: LB broth, Mueller Hinton (MH) broth, and tryptic soy broth (TSB). Overnight cultures of each strain were subcultured 1:100 in LB broth and incubated at 37 °C for 2 h and 45 min. Subcultures were further diluted 1:100 into their desired media to a final CFU/mL of 1 × 10⁶. A volume of 200 µL was added to each well of a 96-well plate and placed in an Epoch™ 2 Microplate Spectrophotometer (BioTek) at 37 °C with orbital shaking at 237 cpm. OD600 was measured every hour for 48 h. Growth rate was calculated for exponential growth with the averages from each trial using growth rate equation:
log10N − log10N0 = (μ/2.303) · (t − t0)
The JC1 kill curves were performed similarly as described above with modifications. Van1 was prepared in LB as described above and 100 µL was mixed with 100 µL of JC1 diluted in LB to reach each desired multiplicity of infection (MOI). The 96 well plate was measured in an Epoch™ 2 Microplate Spectrophotometer (BioTek) at 30 °C or 37 °C with orbital shaking at 237 cpm. OD600 was measured every hour for 48 h. Local virulence was calculated by dividing the area under the curve for each MOI by the area under the curve of the bacterial control and subtracting that from 1. Global virulence index was calculated by taking the area under the curve generated from plotting the local virulence at each MOI tested against log10 MOI and diving it by 6 (all the MOIs tested-1). It is important to emphasize that global virulence indexes can only be compared if MOIs tested in the experiment are the same. Results for growth and kill curves were collected in technical and biological triplicate and analyzed using GraphPad Prism 9 (GraphPad Software Inc., San Diego, CA, USA).

2.11. Virulence Assay Using Galleria mellonella

G. mellonella infections were performed as previously described [58] with some modifications. Overnight cultures of each strain were washed 3× with 1× PBS and serially diluted tenfold in 1× PBS. Scientific grade G. mellonella weighing between 300–320 mg were purchased from Serum Therapeutics Inc. (https://www.serumtherapeuticsinc.com/) and injected with 5 µL of bacterial culture or 1× PBS into the rear left proleg using a 250 µL Hamilton syringe. Injection with sterile 1× PBS was used as a negative control to show larvae were not dying because of injection. Ten larvae were injected for each group and statically incubated at 37 °C in the dark. Colony counts were used to determine the CFUs injected. Larvae were scored for death based off response to gentle touch every 24 h until 96 h post infection. Resulting data from three separate trials were plotted and analyzed using GraphPad Prism 9 (GraphPad Software Inc., San Diego, CA, USA).

2.12. Normal Human Serum (NHS) Percent Survival

Percent survival in NHS was based on previously published methods [59,60] with modifications. Overnight liquid cultures of Van1 and Van1::JC1 lysogen were subcultured 1:100 and grown for approximately 3 h and 15 min in LB at 37 °C with aeration at 225 RPM. 2 μL of each subculture (104–105 CFU) was inoculated into 198 μL of pooled normal human serum (NHS) purchased from BioIVT (Westbury, NY, USA) diluted in LB for final concentrations of 0–100% NHS. Inoculated NHS was statically incubated at 37 °C with humidity for 2 h followed by serial dilution to obtain CFU counts. The resulting data from three separate trials was normalized to the 0% NHS control and was analyzed using GraphPad Prism 9 (GraphPad Software Inc., San Diego, CA, USA).

3. Results and Discussion

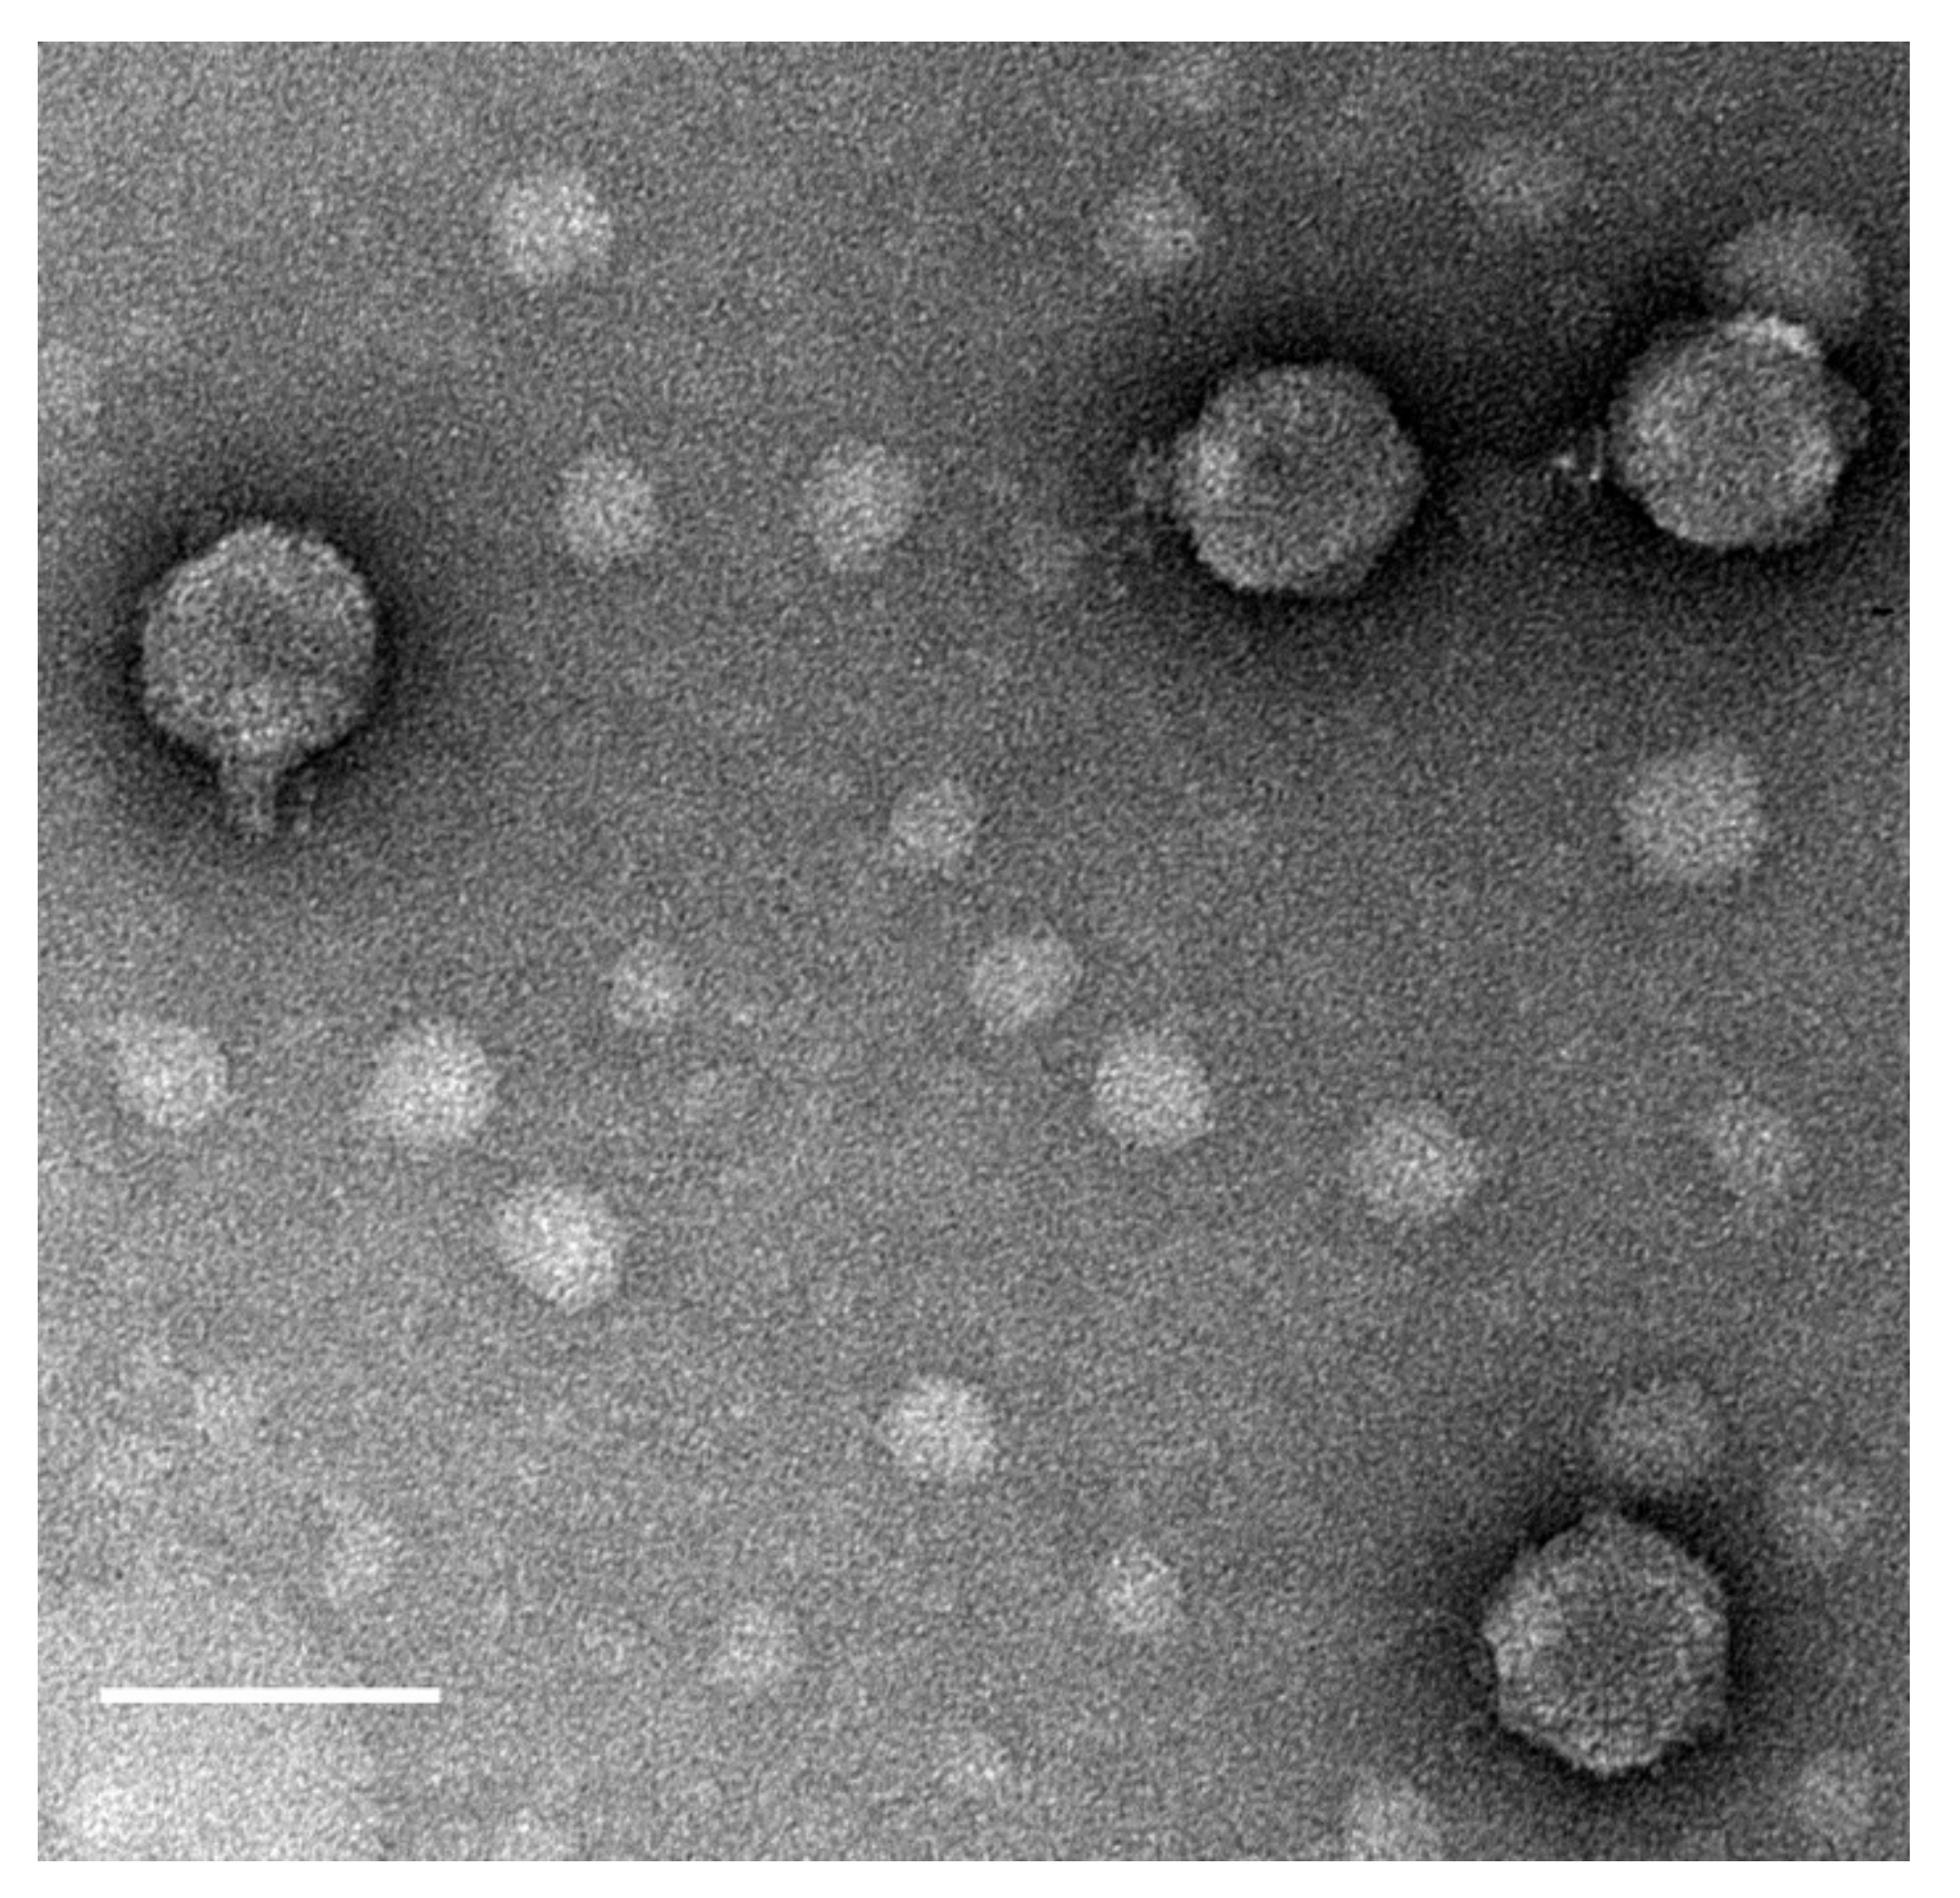
3.1. Isolation, Morphology, and Host Range

Burkholderia phage JC1 (vB_BceP_JC1) was isolated from potting soil containing geranium (Geranium dissectum) and petunia (Petunia exserta) annual flowers using cystic fibrosis clinical isolate Van1. JC1 produces clear plaques with a diameter of 1 to 2 mm with overnight incubation at 37 °C and forms slightly turbid plaques of the same size at 30 °C after a 2-day incubation. Transmission electron microscopy (TEM) was used to visualize JC1 and classify it as a Podoviridae phage with a C1 morphotype [61], having an average capsid diameter of 71 nm ± 1.24 nm and a short non-contractile tail with a length of 20 nm ± 0.91 nm and a width of 13 nm ± 0.67 nm. (Figure 1).
Tail fibers were not observable in the TEM images. JC1 morphology is similar to Bcep22, BcepIL01, and DC1 [62,63], suggesting it may be a member of the Bcep22-like phage group. A one-step growth curve of JC1 on host strain Van1 shows a latent period of 1.5 h and a burst size of 296 virions at 6 h (Figure 2).
The host range of JC1 was performed on a large panel of 85 Bcc clinical and environmental isolates revealing a very broad host range. JC1 is capable of infecting an impressive range of Burkholderia species including B. cepacia, B. multivorans, B. cenocepacia, B. stabilis, B. vietnamiensis, B. dolsa, B. ambifaria, B. anthina, Bcc Group K, Burkholderia sp., and Ralstonia pickettii, which possesses high similarity to Bcc [64]. JC1 showed lytic activity against 50 of the 85 strains, successfully forming plaques on 29 of the 50 (Table 1).

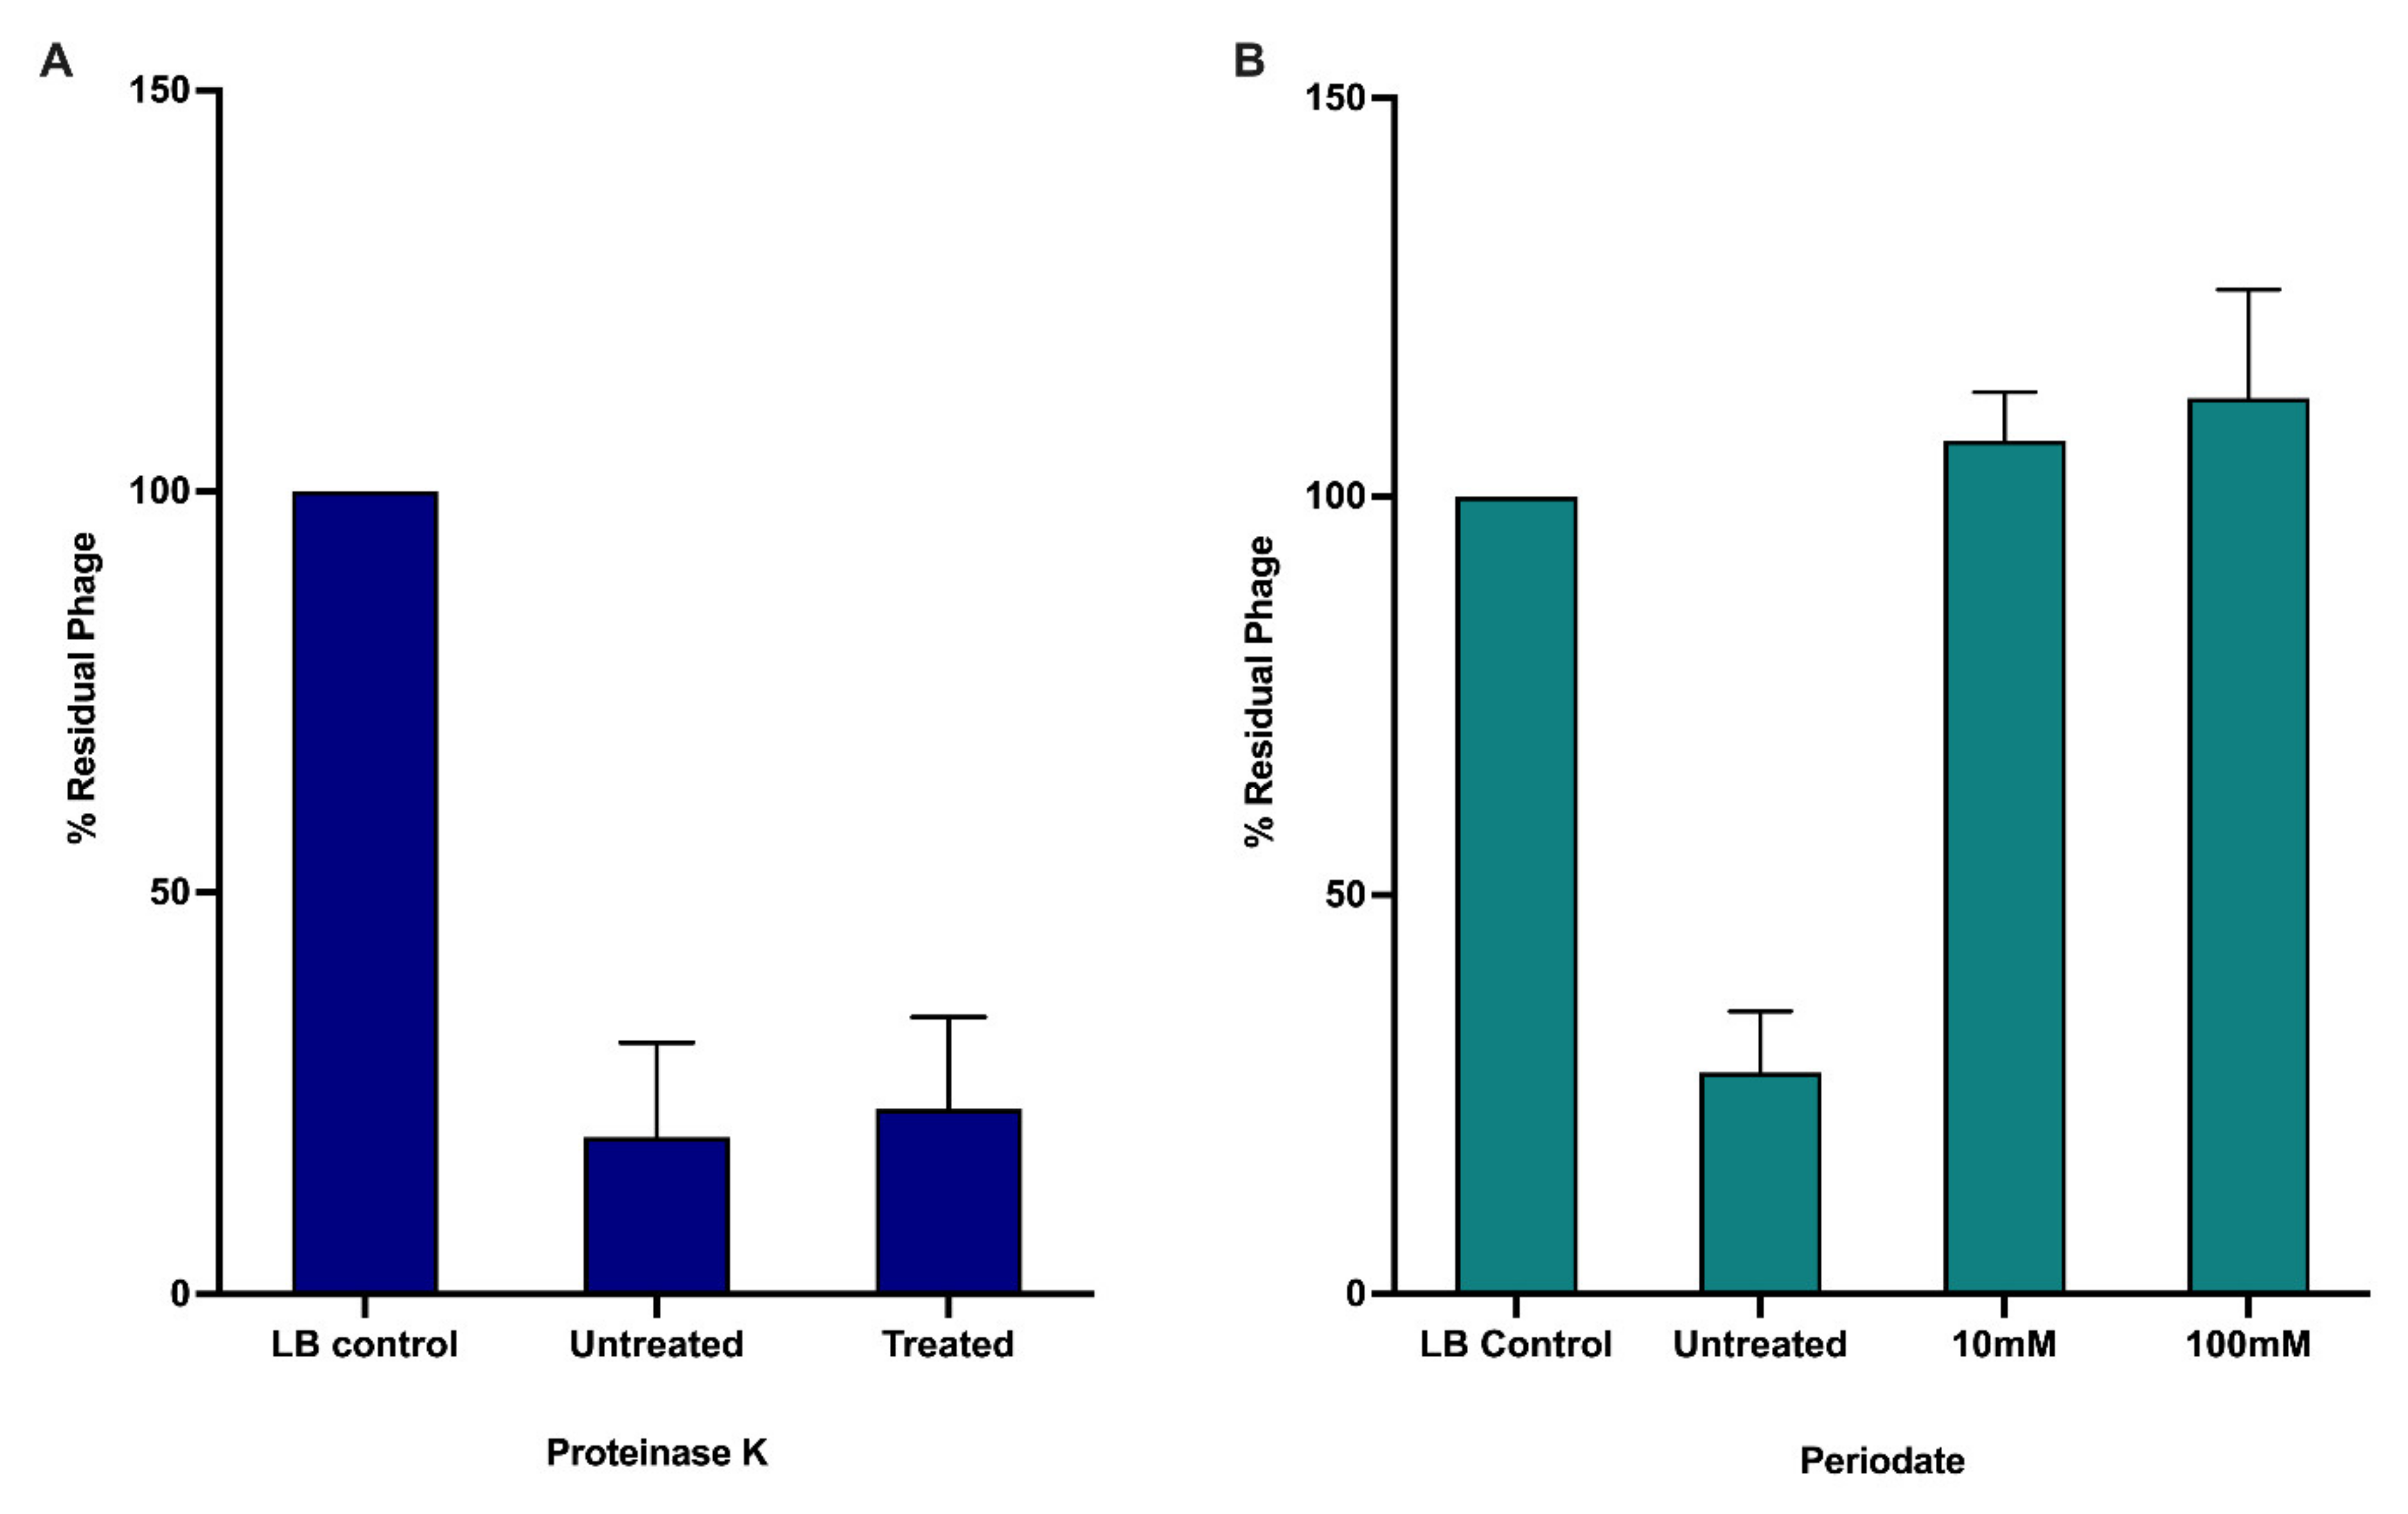
3.2. Receptor Binding

A significant number of Burkholderia phages likely use the LPS as their primary receptor for infection [65]. A collection of B. cenocepacia K56-2 LPS mutants have been previously constructed and characterized [66,67]. Plasmids complementing each LPS mutant were constructed and transformed into their designated strain. The collection of 7 LPS truncation mutants and their complemented strains were screened to determine if JC1 uses the LPS as its receptor. JC1 can infect K56-2 lacking an O-antigen and the outer core but is unable to infect mutants lacking varying degrees of the inner core (Table 2) [66,67]. Complementation of the three LPS truncation mutants restores JC1 infection. Since LPS make up a significant proportion of the outer membrane of Gram-negative bacteria, extreme truncations of the LPS may affect the organization of the membrane and may be indirectly affecting the ability of JC1 to infect SAL1, CCB1, and XOA8 [67]. To further investigate if the LPS is the primary receptor of JC1, we examined phage adsorption against Van1 treated with either proteinase K or periodate, which destroy surface proteins or carbohydrates, respectively. JC1 was able to adsorb to untreated and proteinase K treated cells, but JC1 was unable to adsorb to cells treated with periodate (Figure 3). These results paired with the screening of the LPS mutants confirm that LPS is the primary receptor for JC1.
Truncation of the LPS to evade infection by JC1, or other phages that require the inner core for infection, should increase sensitivity to antimicrobial peptides such as polymyxin B, melittin, and human neutrophil peptide 1 (HNP-1) and possibly affect survival in vivo as seen in previous work characterizing strains lacking a complete LPS core oligosaccharide [66,67]. Combination therapy with these antimicrobials and phage could therefore prove very effective at reducing resistance and increasing sensitivity to both killing agents.

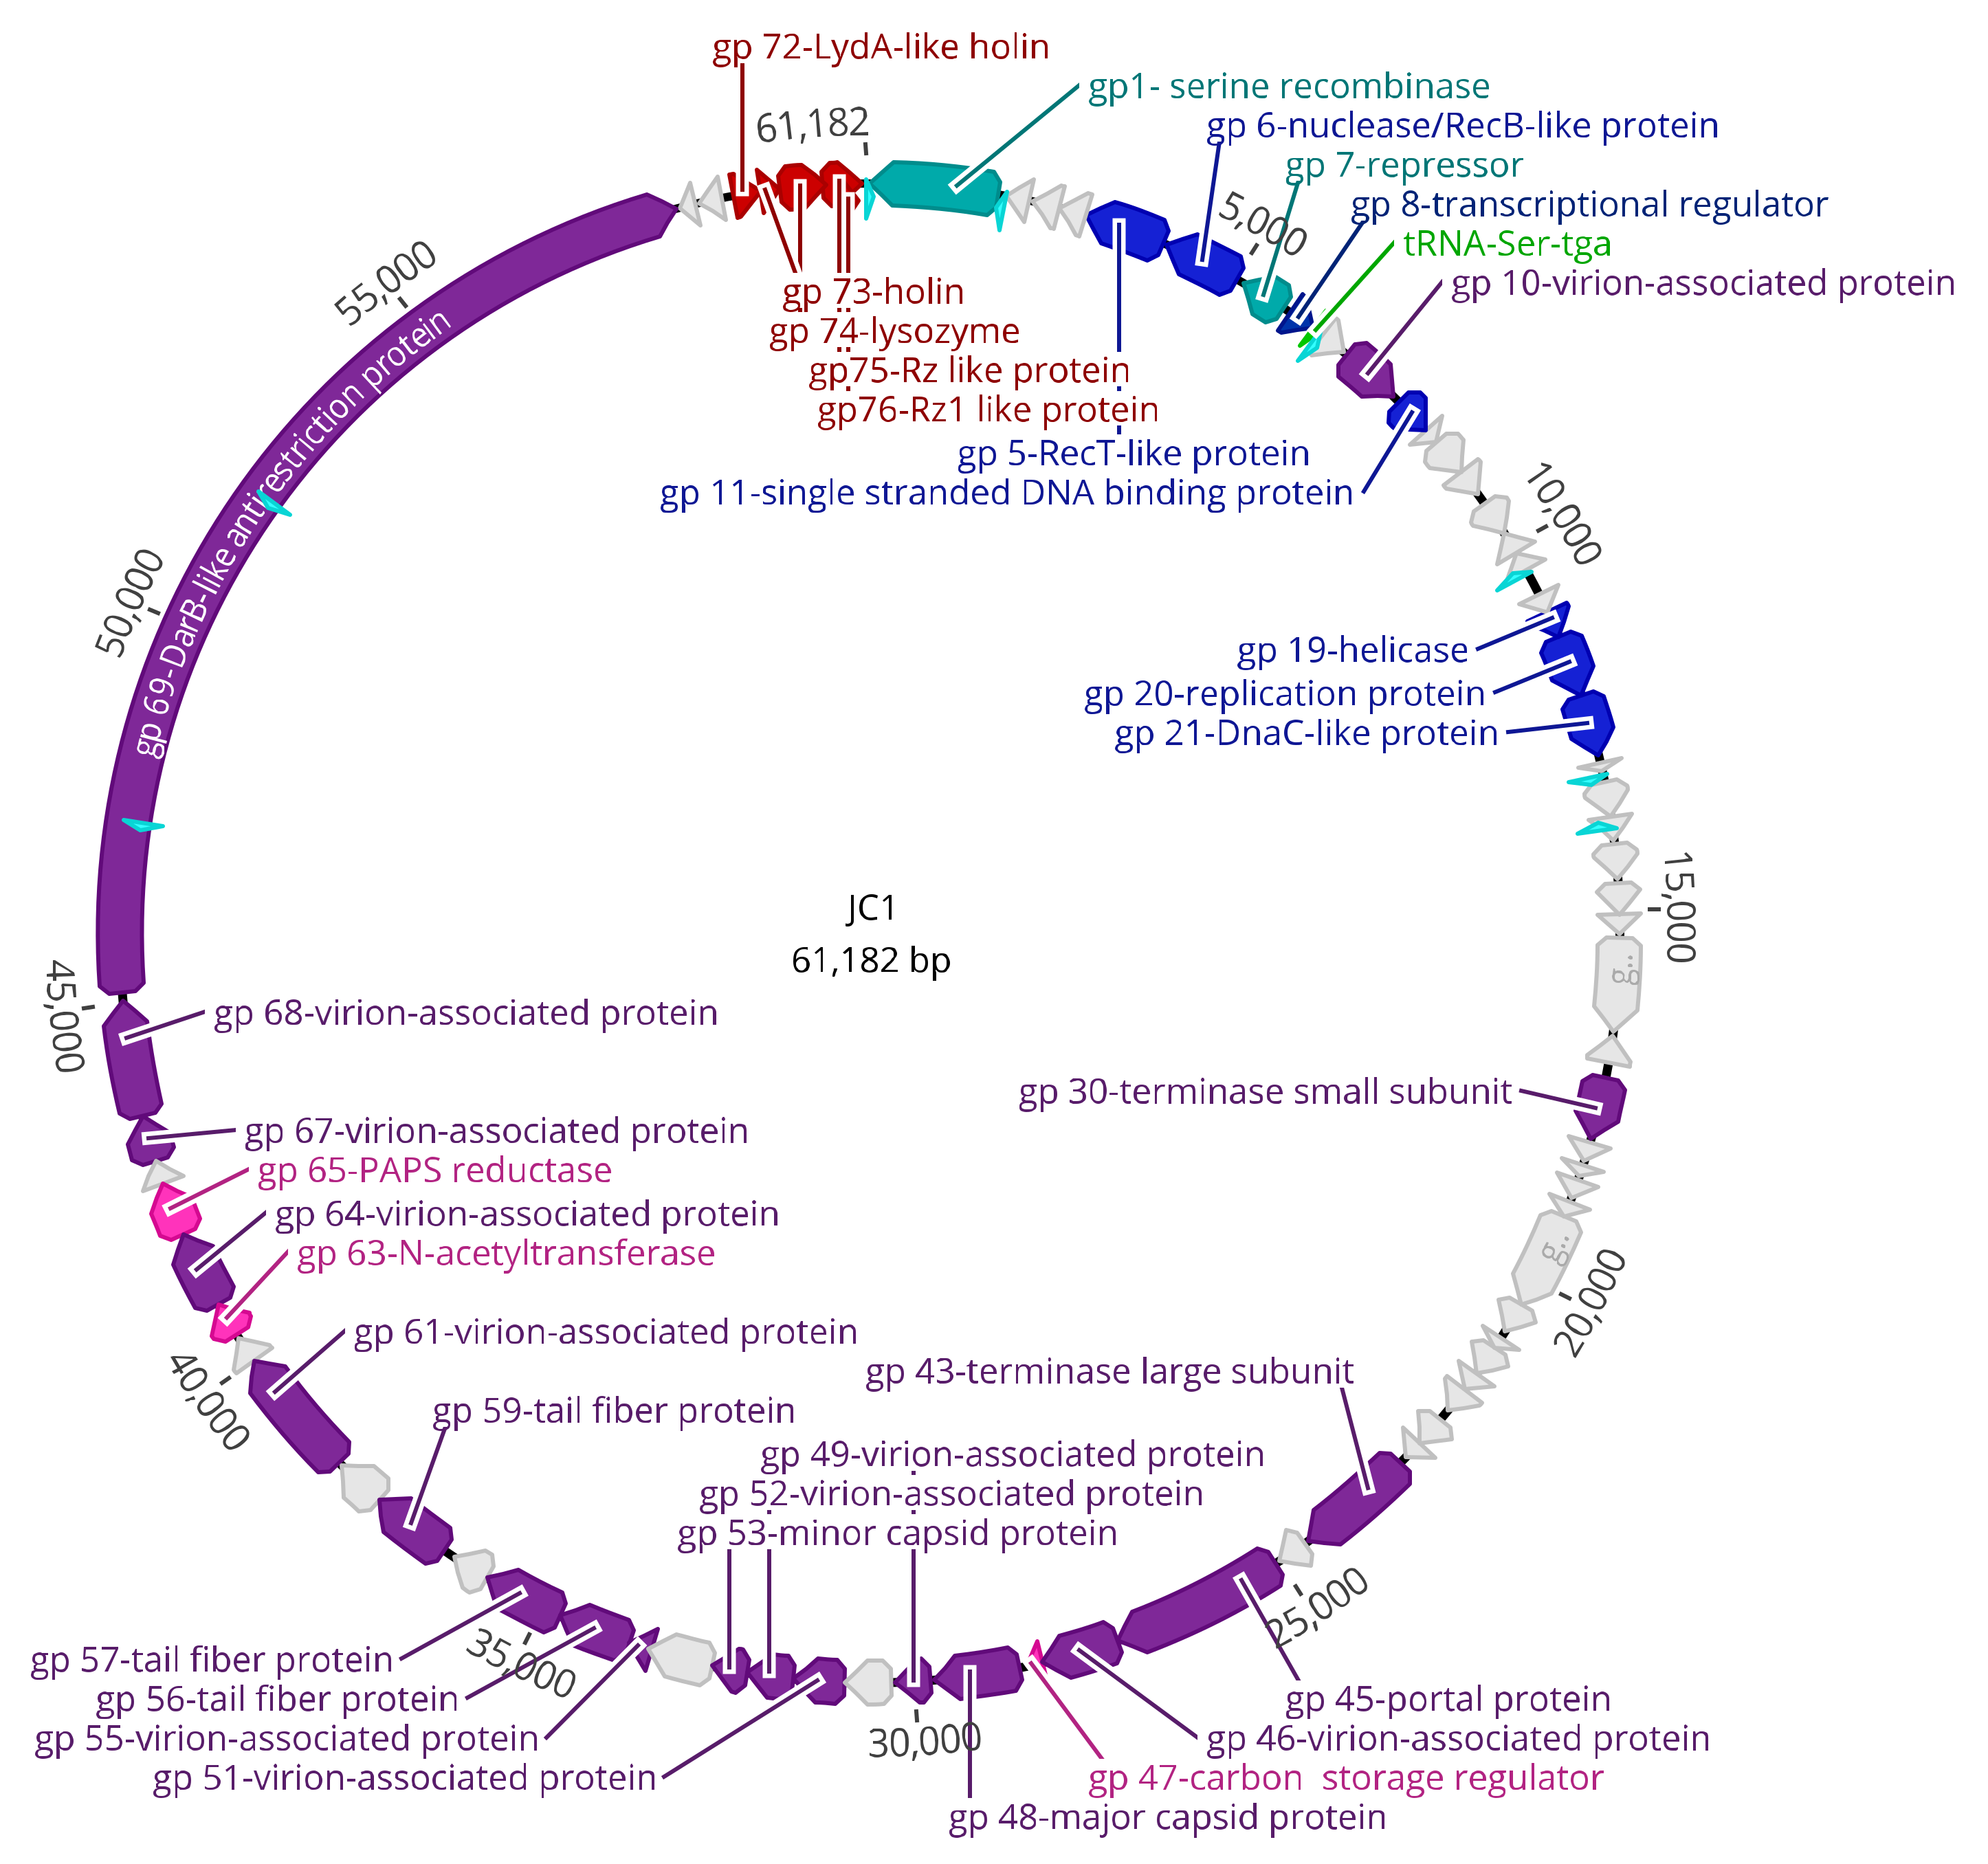
3.3. Genomic Characterization

The genome of JC1 is 61,182 bp in length (Figure 4) with a 65.4% G + C content and a coding density of approximately 95%. BLASTn analysis of the JC1 genome shows it is related to the Bcep22-like Podoviridae phages and belongs to the Lessievirus genus. JC1 is most similar to DC1 with 90.88% identity over 61% of the genome. Interestingly, JC1 also has similarity to a number of Ralstonia phages, which likely explains why JC1 is able to infect R. picketti. Using MAFFT alignment, JC1 is the most divergent of the Bcep22-like phages, with 54.3%, 57%, 59.1%, and 60% identity across the whole genome to Bcep22, BcepMigl, BcepIL02, and DC1, respectively (Figure 5).
Though ~40% of the JC1 genome is dissimilar to the other Bcep22-like phages, and ~55% of the Ralstonia phage Gervaise differs from each Bcep22-like podovirus, the retained synteny between the phage genomes is apparent (Figure 6). Each phage encodes a putative serine or tyrosine recombinase on the reverse strand, a repressor-like gene, as well as a serine tRNA. Their entire, or almost entire, virion morphogenesis and lysis modules are encoded on the positive strands. Each phage encodes 3–4 tail fiber proteins followed by a conserved protein annotated as the head closure protein in Ralstonia phages. Additionally, all 6 of the genomes encode a massive DarB-like protein on the positive strand followed by two hypothetical proteins on the negative strand and the lysis module. Bcep22 and DC1 have the highest G + C content of the Lessieviruses at 66.2% while BcepIL02, BcepMigl, and JC1 have a lower G + C content around 65%, below that of B. cenocepacia, which possesses a 66.9% G + C content [68]. Noticeably, JC1, Bcep22, and BcepMigl all lack the presence of the PagP-like virulence factor found in BcepIL02 and DC1 [62,63]. Similarly to Bcep22 and BcepIL02, JC1 appears to be a circularly permuted phage, and the genome was set to begin after the predicted lysis module [62].
There are 76 predicted protein-coding genes and one predicted serine tRNA gene (Table 3, Figure 4). The predicted gene products have 12 GTG start codons and 64 ATG start codons. There are 50 TGA stop codons, with the remainder being 21 TAA codons and 5 TAG codons. BLASTp analysis of the 76 predicted proteins identified significant matches for every predicted gene product in the genome (Table 3, Figure 4). Predicted proteins gp4, gp16, gp17, gp33, gp34, gp37, gp39, gp42, and gp66 had no significant hits to the viruses database, but had hits to the bacterial database, all of which had very high percent identity to B. multivorans strains AU34603 (JAHPNN010000013.1), AU36904 (JAHPNA010000002.1), AU9032 (JAHPOS010000011.1), and AU11550 (JAHPOP010000012.1). Upon further analysis of these incomplete genomes, it appears that a potential 6th member of this podovirus group exists stably integrated into all four of these strains, though functionality of the prophage is unknown. It is important to note some base pair differences exist between the 4 lysogens that likely arose overtime from integration in different strains. This prophage harbours around 96.4% similarity to JC1 and has all the genomic similarities discussed above with the other Bcep22-like phages.
Rho-independent termination sites were predicted using ARNold [69,70,71,72]. The 8 predicted sites are displayed in Table 4 and are located downstream of gp2 (hypothetical protein) and downstream of the serine tRNA, upstream of gp17 (hypothetical protein), downstream of gp22 (hypothetical protein), one within the coding region in the opposite direction of gp24 (hypothetical protein), two within the coding region in the opposite direction of gp69 (DarB-like antirestriction protein), and one immediately downstream of the lysis module (gp72–76).

3.4. DNA Replication, Repair, and Regulation Module

JC1 has at least 7 proteins involved in DNA replication, repair, and regulation spanning genes 5 through 21 (Table 3, Figure 4). Putative functions determined via BLASTp include RecT/RecB (gp 5/6), which may aid in phage recombination events, a transcriptional regulator (gp8), a single stranded DNA binding protein (gp11), a helicase (gp19), a replication initiator protein (gp20), and a DnaC-like helicase loader (gp21) (Table 3, Figure 4). An interesting hypothetical protein in this module is gp18, which is present in each Bcep22-like phage at the beginning of the gene cluster containing the replication initiator protein and the DnaC-like helicase loading protein. This protein has a predicted helix-turn-helix domain and likely binds to DNA (Table 5); though its function is unknown, the conserved sequence location and high percent identity (>77% to each homolog) suggests it may have an important role in DNA replication.
JC1 follows a trend observed in Gram-negative phages where the recombination genes (gp5/6) are located between the repressor and the integrase genes (gp1/gp7) [73]. Interestingly, unlike Bcep22, BcepIL02, DC1, and BcepMigl, JC1 encodes a putative helicase protein (gp19) predicted both by BLASTp and conserved domain search results (Table 3 and Table 5). Furthermore, it does not follow the typical organization of an initiator-helicase loader-helicase (ILH-type) replication module seen in other phage, where the helicase protein is downstream of the replication initiator protein and the helicase loading protein [73]. Instead, the helicase protein is encoded upstream of the initiator protein, making it a helicase-initiator-helicase loader (HIL) replication module. This organization is also seen in the B. multivorans prophage discussed above, but whether this is a common module organization or unique to these phages is unknown and requires an in-depth evaluation of other phage genomes.

3.5. Virion Morphogenesis Module

The virion morphogenesis module takes up over half of the genome, is composed of at least 19 predicted proteins spanning from gp30 to gp69, and is encoded entirely on the positive strand (Figure 4). BLASTp, conserved domain search, and homology to other phages were used to putatively assign functions for these proteins and include a small and large terminase subunit (gp30 and gp43, respectively), a portal protein (gp45), a major capsid protein (gp48), three virion associated proteins (gp49, gp53, gp55, and gp67), three tail fiber proteins (gp56, gp57, gp59), a head closure protein (gp61), and a DarB-like antirestriction protein (gp69) (Table 3 and Table 5). The end of this module is marked by two hypothetical genes on the reverse strand, and as discussed above, are highly conserved among the Bcep22-like phages.
Similar to Bcep22 and BcepIl02, the terminase small subunit is located a significant distance away from the terminase large subunit, contrasting what is seen in lambdoid phage and many other Bcc phage genomes [63,74,75,76,77,78,79,80]. BcepB1A is a Myoviridae phage that displays a degree of mosaicism to the Lessievirus phages and exhibits the larger distance between the two terminase subunits [81], suggesting this organization is not distinct to Lessieviruses. Conclusive with comparisons done by Gill et al. [62], the terminase large subunit in JC1 is also related to the terL homologs in Pseudomonas aeruginosa phage F116 (YP_164303.1) and Sinorhizobium phage PBC5 (YP_010115347.1), and the putative portal protein, major capsid protein, and head closure protein all have homology to E. coli phage 933W (NP_049512.1, NP_049514.1, NP_049522.1). These genomic similarities paired with JC1 being a terminally redundant circularly permuted genome suggests that phage in this group likely package their genomes via a headful mechanism.
The DarB-like antirestriction protein takes up a massive portion of the virion morphogenesis module (32.7%) and 22.1% of the whole phage genome. This protein is most similar to the DarB homolog in Bcep22 (gp75) and is also commonly found in many Ralstonia phages. E. coli phage P1 requires virion-associated proteins DarA and DarB to protect P1 DNA from restriction by the host type I restriction system [82], and as discussed previously likely provide a significant benefit to the Bcep22-like phages given the extra burden the size of these genes impose [62]. Interestingly, the P1 antirestriction system has been shown to require additional proteins including DdrA, DdrB, Hdf, and Ulx [83]. No homologs of any of these other proteins have been identified in the Lessieviruses thus far, however there are a significant number of virion-associated proteins with no known function and therefore it is likely homologs of these genes exist.

3.6. Lysis Module

The lysis module is a collection of 5 genes (gp72–gp76); surprising given the lysis modules of the other four phages contain the typical SRRzRz1 lysis organization [62,63,84]. The module begins with two predicted holin genes and a lysozyme (gp72–gp74). The LydA-like holin (gp72) has a conserved Phage_holin_3_3 domain, and TMHMM predicts the protein to have two transmembrane domains, classifying it as a superfamily III, family 34 holin [85]. The stop codon of gp72 overlaps with the start codon of gp73, similar to how lydA and lydB are organized in coliphage P1 [86]. However, unlike P1 LydB, gp73 is predicted to have two transmembrane domains. This is unusual as antiholins of class I and II holins typically display a dual-start motif or have been seen to be coded completely within the holin gene [87,88]. With that said, many Streptococcus phage encode a class I and class II holin (respectively) upstream of an endolysin, and it is likely the second holin gene acts as an antiholin [89]. The third gene in this module is a predicted lysozyme (gp74) with a conserved ZliS superfamily domain. These enzymes hydrolyze the β1,4-glycosidic bond in peptidoglycan, and gp72–gp74 are found in a similar organization as some Type X Secretion Systems (TXSS): two holins preceding a ZliS superfamily muramidase [90,91].
The top BLASTp hits for gp72–gp74 do not involve any Burkholderia Podoviridae phages. The LydA-like holin (gp72) is homologous to uncultured Caudovirales phages, and Siphoviridae phages from Nitratiruptor, Psychrobacter, and Moraxella species. Similarly, the second holin gene (gp73) is most related to Siphoviridae phage AH2 and Myoviridae phage PE067. Continuing the trend, the top BLASTp hit for the lysozyme (gp74) is to a Rhodoferax podovirus, and the rest of the top hits are to Siphoviridae phages. The overall identity is on the lower end, ranging between 50–65% over 80 to 95% of the query, and the evolutionary origin of these three genes is unknown.
The lysis module of JC1 is homologous to the two spanin subunits found in all the other Lessievirus phages. The Rz and Rz1 proteins (gp75 and gp76, respectively) also belong to the embedded class of Rz1 genes, where the entire coding sequence of Rz1 is found within the coding sequence of Rz [62,84]. Rz (gp75) is predicted to have an N-terminal transmembrane domain (TMD) and SignalP analysis of Rz1 (gp76) predicts a lipoprotein signal peptide (Sec/SPII) with a cleavage site between amino acids 19 and 20, resulting in a final processed protein of 54 amino acids [48,49].
The lysis module of JC1 differs in the mode of lysis from the rest of the phages in the Lessieviruses genus, an interesting feature considering how similar the genomes are to one another. The other Lessieviruses likely lyse cells using pinholins and SAR endolysins [62], while JC1 likely lyses cells using the canonical holin mechanism. Though Lynch et al. [63] has predicted gp68 in DC1 (homolog of gp70 in JC1) to be a putative antiholin based on the TMHMM prediction of a single transmembrane domain (also predicted in all the Lessieviruses homologues), it is likely this protein plays a different role after analysis of the JC1 lysis module. It has been suggested that pinholins are an intermediate stage in the evolution of holin-endolysin systems, with the canonical holins having a selective advantage [92]. Therefore, this mechanistic difference in lysis may potentially play a role in the larger host range exhibited by JC1, but further studies are needed to examine the lysis potential of these modules.

3.7. Moron Genes

The genome of JC1 harbours three interesting moron genes, a carbon storage regulator (CsrA), an N-acetyltransferase, and a phosphoadenosine phosphosulfate (PAPS) reductase (gp47, gp63, and gp65, respectively). All three of these genes are present in the Lessieviruses, in similar locations and with high percent identity between homologues. CsrA has been associated with a massive array of functions in bacteria, including but not limited to carbon metabolism, virulence, motility, and biofilm formation [93]. Gp63 has a conserved RimL domain, involved in acetylating the ribosomal L12 protein [94]. N-acetyltransferases have been proposed to be evolutionary precursors of the eukaryotic histone acetyltransferases [95], and therefore the N-acetyltransferase encoded by JC1 may play a role in modifying gene regulation. PAPS reductases are a class of sulfonucleotide reductases (SRs) that are involved in catalyzing the reduction of adenylated sulfate to sulfite, a crucial step in the cysteine biosynthesis pathway [96]. PAPS reductases are found in pathogenic bacteria such as E. coli, Salmonella typhimurium, and Yersinia pestis and are not found in humans, making this class of protein interesting as potential targets for therapeutic intervention [96]. The JC1 PAPS reductase (gp65) likely plays a role in sulfate reduction and could play a role in pathogenicity. Further experiments are needed to investigate the functions these moron genes play in the infection cycle of JC1 and the other Lessieviruses.

3.8. Analysis of JC1 Structural Proteins

We performed proteomic analysis on CsCl purified virions to identify any unknown virion-associated proteins and confirm predicted virion-associated proteins. Proteins determined to be virion-associated are listed in Table 6 and include the portal protein (gp45), the carbon storage regulator (CsrA) (gp47), the major capsid protein (gp48), the head closure protein (gp61), four virion-associated proteins (gp49, gp53, gp55, and gp67), six hypothetical proteins (gp10, gp46, gp51, gp52, gp64, and gp68), and the DarB-like antirestriction protein (gp69). As expected, the most abundant protein identified was the major capsid protein. The six hypothetical proteins have been assigned putative functions as virion-associated proteins in Table 3, though their functions beyond that are unknown.
Interestingly, gp62 did not show up in the mass spectrometry data even though it is predicted to be virion associated. Mass spectrometry analysis done by Gill et al. [62] did not identify gp68 in Bcep22 (a homolog of JC1 gp62) as virion-associated, but it was predicted to be virion-associated because the homolog was identified in BcepIl02 (gp64). Given that this protein was not identified by mass spectrometry for Bcep22 or JC1, it seems likely that this protein is not virion-associated for these two phages. Reasoning for the exclusion of this protein in Bcep22 and JC1 is speculative but could be associated with the number of tail fiber genes each phage encodes, as BcepIL02 has 4 tail fiber genes whereas JC1 and Bcep22 have three. Mass spectrometry analysis would need to be conducted on DC1 and BcepMigl for further insights.
The carbon storage regulator protein (CsrA) was identified by mass spectrometry, but only one unique peptide was associated with it, and therefore though it is likely to be virion associated it cannot be definitively confirmed. No proteins were identified when the spectrometry data was screened against the UniProt Burkholderia database, suggesting this protein is not a result of bacterial protein contamination. Inclusion of CsrA in the actual virion is an interesting and exciting possibility, showing that it is not only a moron gene, but is providing an unknown benefit to the phage. Further experiments are necessary to explore the role of CsrA in infection, and if it is virion-associated in the other Lessieviruses.
An unexpected finding is that the hypothetical protein gp10 is virion associated. This protein has a conserved DUF2303 superfamily domain; homologs of this gene are in BcepIL02, BcepMigl, and DC1, but no homolog was found in Bcep22. The predicted structure of gp10 using Phyre2 shows similarity to a viral genome injection device from Lactococcus phage TP901-1 (90.4% confidence, 16% identity), a cytosolic disulfide reductase (DsbM) from Pseudomonas aeruginosa (49.3% confidence, 16% identity), and a Citrobacter restriction-modification controller protein (38.4% confidence, 20% identity). Given that gp10 is located in the replication and repair module, it is possible that this protein is associating with the DNA and not the actual structure of the virion. Gp10 could be similar in function to gp2 in T4 coliphage, associating with the ends of the DNA and protecting it from exonuclease activity [97,98].

3.9. Integration Site Characterization

The presence of lysogeny genes gp1 and gp7 led us to examine the potential of JC1 to form lysogens in Van1. Phage infection survivors that were superinfection resistant and had the presence of the JC1 genome verified using PCR were collected for further examination. Of the four previously characterized Bcc Podoviridae phages, one is obligately lytic and the others form unstable lysogens in the bacterial hosts tested [62,63,77]. Stability was tested and showed that lysogens maintained superinfection resistance and the presence of JC1 genome after three sequential platings, suggesting JC1 can stably lysogenize Van1. Genomic and plasmid DNA were isolated from four different JC1 lysogen isolates and wildtype Van1 and analyzed on an agarose gel. No significant differences were observed between the strains on the gels, suggesting JC1 likely is not taking the form of a phagemid (data not shown).
To identify the Van1 genome location where JC1 is integrating, we used a protocol from Williams et al. [56]. We determined that JC1 integrates into the 5′ end of the conserved gene rimO using an 18 bp attP overlapping region with 1 bp difference in the attB site (Figure 7). RimO belongs to the methylthiotransferase (MTTase) family of proteins and is involved in β-methylthiolation of residue D88 of the ribosomal S12 protein [99]. To further support these findings, the prophage found in the four B. multivorans genomes discussed in the genomic characterization section is also located directly next to rimO, with part of its integrase gene overlapping with rimO. Since JC1 integration disrupts the sequence of rimO so early into the coding region, loss of function seemed likely. However, with closer examination of the region an ATG is found 15 bp upstream of the attP site in the JC1 genome that allows RimO in Van1 to remain in frame while only changing 6 of the first 10 amino acids, and no change to the overall length of the protein (Supplementary Figure S1). It is possible that the amino acid changes or the phage DNA upstream of the start site could affect the expression or function of RimO, but highly conserved amino acids identified in the N-terminal region among the MTTase family are not affected by JC1 integration [99], and we predict RimO likely remains functional.
Previous studies have found increased resistance when residues around D88 of the S12 ribosomal protein are mutated [100], but similar to previous studies examining rimO knockout mutants [99,101], we saw no difference in streptomycin resistance between the JC1 lysogen and wildtype Van1 (data not shown). Since we do not know if or how activity of RimO is affected by JC1 integration, this data only confirms that resistance to streptomycin is not altered by JC1 integration. This is the first account of stable integration identified for the Bcep22-like phages, and it is possible that other members of this phage group may integrate next to rimO in an appropriate host. As briefly noted above, Bcep22, BcepIL02, and DC1 have not had successful attempts to isolate stable lysogens in host strains B. cenocepacia PC184 and AU1054 [62,63]. This could be due to several reasons, including a non-functional recombinase or bacterial strain incompatibility. Additionally, none of the other phages harbour the attP site that JC1 contains, and therefore their attP sites and integration locations may be different (or non-existent) than that of JC1.

3.10. Virulence Index of JC1

In addition to the qualitative observations done in this study we decided to provide a quantitative measure of JC1 virulence against its host strain. As mentioned by Storms et al. [102], characterizing novel phage tends to focus on non-standardized methods when looking at phage virulence. Troubleshooting in the lab to get high titer JC1 stocks (~1010 PFU/mL) led us to discover JC1 propagates to a higher titer at 30 °C as opposed to 37 °C; an interesting discovery given the delay it takes for JC1 to form plaques at 30 °C as mentioned above. This discrepancy led us to look at the virulence index for JC1 at 30 °C and 37 °C (Figure 8). The most effective MOI at 30 °C was 1000, though a significant amount of outgrowth occurred at this MOI, leaving MOIs 100 and 10 being the most effective at the 48-h endpoint (Figure 8A). As expected, the least effective MOI at 30 °C was 0.001, almost matching the growth of the bacterial control. Surprisingly, the least effective MOI at 30 °C (MOI 0.001) reduces the most growth by the 48-h endpoint at 37 °C and the highest MOI of 1000 had the most outgrowth, almost reaching bacterial control levels at 48 h (Figure 8B).
Using the equations from Storms et al. [102], the area under the curve for each MOI was calculated from time point 0 to the onset of stationary phase in the bacterial control. Time points 0–40 h and 0–30 h were used to calculate the local virulence for each MOI (log MOI −3 to 3) at 30 °C and 37 °C, respectively. JC1’s local virulence at each MOI for both temperatures were plotted (Figure 8C) and the global virulence index is 0.21 and 0.8 at 30 °C and 37 °C, respectively. JC1 activity against Van1 seems mostly unaffected by MOI at 37 °C, maintaining a virulence above 0.75 for every MOI tested. JC1’s global virulence index at 37 °C is more comparable to lytic E. coli phage T7 (0.84) than to lysogenic E. coli phage T5 (0.17) [102]. It is important to note that a different range of MOIs were used to test these phages (log MOI −7 to 0), and comparisons can only be made at similar MOIs. With that said, local virulence for T5 does not begin to match the level of virulence seen with JC1 at 37 °C until an MOI of 1 [102]. These similarities are the opposite when we look at virulence for 30 °C, where the curve and global virulence index is less virulent than T5 at comparable MOIs [102]. These results suggest that JC1 could be acting more lytic at 37 °C and more lysogenic at 30 °C. Furthermore, these results explain why JC1 reaches a higher titer when propagated at 30 °C, as a lower virulence is useful when propagating phage to high titer because the bacterial population is not reduced completely, and the phage have sufficient host cells to propagate on.
The cause of this surprising discrepancy in virulence at different temperatures is unknown but could potentially be due to a temperature sensitive switch between lytic and lysogenic lifestyle similar to podophage ØBp-AMP1 [103]. However, no bacterial lysis is seen when overlays of the JC1 lysogen are incubated at 30 °C or 37 °C (data not shown), suggesting a temperature switch may not be the cause of this discrepancy in virulence. Furthermore, infection efficiency and lysogen stability are not affected by a change in temperature (data not shown), though this does not rule out the chance JC1 lysogenizes at a higher rate at 30 °C. It is also possible that the difference in virulence is an effect of the bacterial growth rate, as Van1 grows slower but to an overall higher density at 30 °C, and grows faster but to an overall lower density at 37 °C. Further experiments are required to determine the cause of this shift in virulence seen at 30 °C and 37 °C.

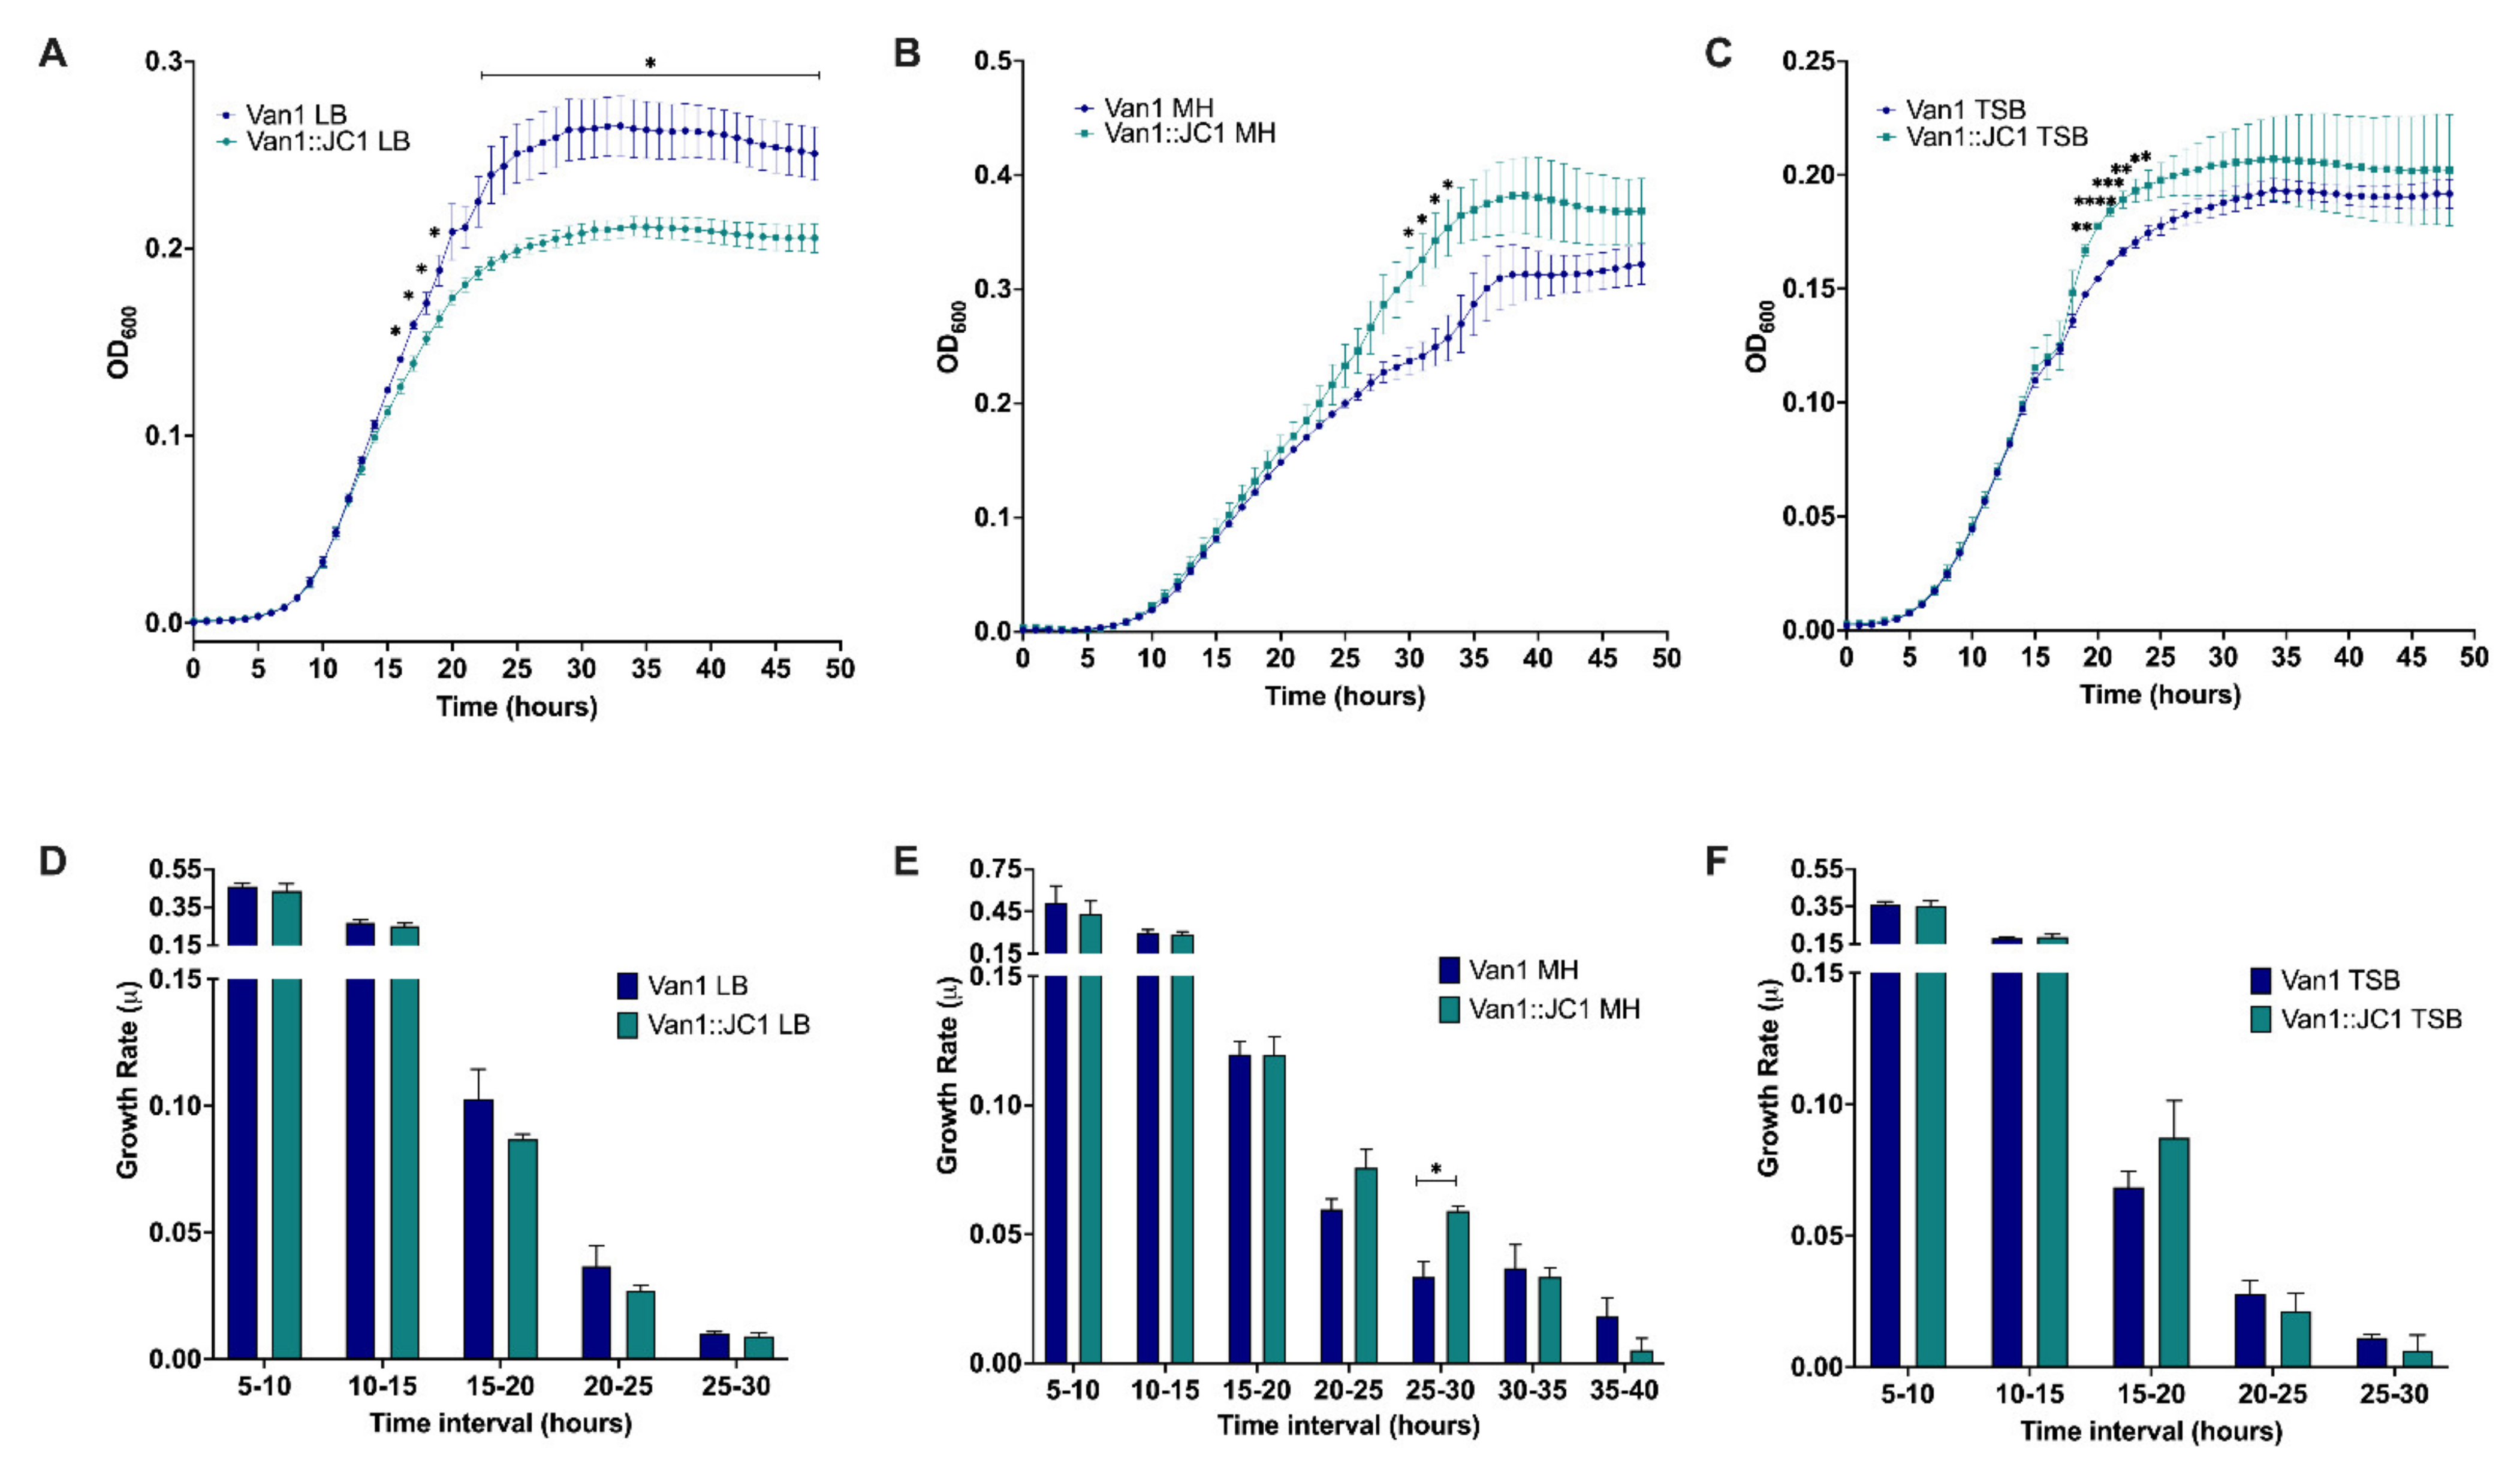
3.11. Lysogenic Conversion

One of the main reasons lytic phages are favoured for therapy is they cannot alter bacterial virulence with phage gene expression [104,105]. Burkholderia phages tend not to encode recognizable toxins or virulence factors but are known to encode proteins that can contribute to overall fitness [106]. Given the lack of obvious toxins/virulence factors, the significant number of hypothetical gene products with no predicted function, and the presence of moron genes involved in nutrient acquisition like csrA, an N-actyltransferase, and a PAPS reductase, we hypothesized JC1 may offer its host cell a growth advantage.
Examining the growth of the lysogen verses wildtype Van1 in three different rich mediums showed a difference in growth between the two strains (Figure 9A–C). The lysogen exhibited moderately increased growth after 48 h in MH and TSB liquid medias while exhibiting a slight decrease in growth in LB liquid media. A statistically significant difference in growth was observed between the lysogen and wildtype Van1 at 15–18 and 23–48 h when grown in LB (p < 0.05), at 30–33 h when grown in MH (p < 0.05), and at 19–24 h when grown in TSB (p < 0.05; p < 0.01; p < 0.001; p < 0.0001). To further examine the difference in growth we calculated the growth rate during log phase for each strain in each medium (Figure 9D–F); since the bacteria reach stationary phase at different time points in each media, the time points analyzed vary. A statistically significant difference in growth rate is observed between 25 and 30 h in MH (p < 0.05), further supporting the increase in growth exhibited by the lysogen at this time interval (Figure 9B,E). Overall, growth rate is not substantially affected in LB or TSB media, which is clear in the similar shapes of the curves for each strain in each media (Figure 9A,C,D,F). The largest difference in growth in LB and TSB begins when the bacterial growth is beginning to slow, resulting in lower growth rates that are closer together, even though the actual bacterial density is significantly different from one another (Figure 9A,C,D,F).
Lysogenic conversion is not well studied in Burkholderia species, and when done so typically examines change in virulence [78,104]. Two significant reasons for the paucity of studies in this area are that many of the characterized Burkholderia phages have been isolated from lysogens and therefore lack a wildtype strain for comparison [40,74,80,106,107,108,109], and/or attempts to create stable lysogens in other strains were unsuccessful [62,63]. A third reason is that most phage characterization studies are done with intent of using the phages for therapy and therefore favour the idea of removing lysogeny genes as opposed to studying lysogenic conversion [80,104]. To our knowledge, growth rate differences have not been studied in any Burkholderia lysogens but have been observed in Stenotrophomonas maltophilia lysogenized by bacteriophage DLP3 [58] and by ϕ24B integration in E. coli B strain MC1061 [110]. The differences observed between the growth of the Van1::JC1 lysogen and wildtype Van1 in each media demonstrates potential differences in energy utilization or nutrient acquisition.

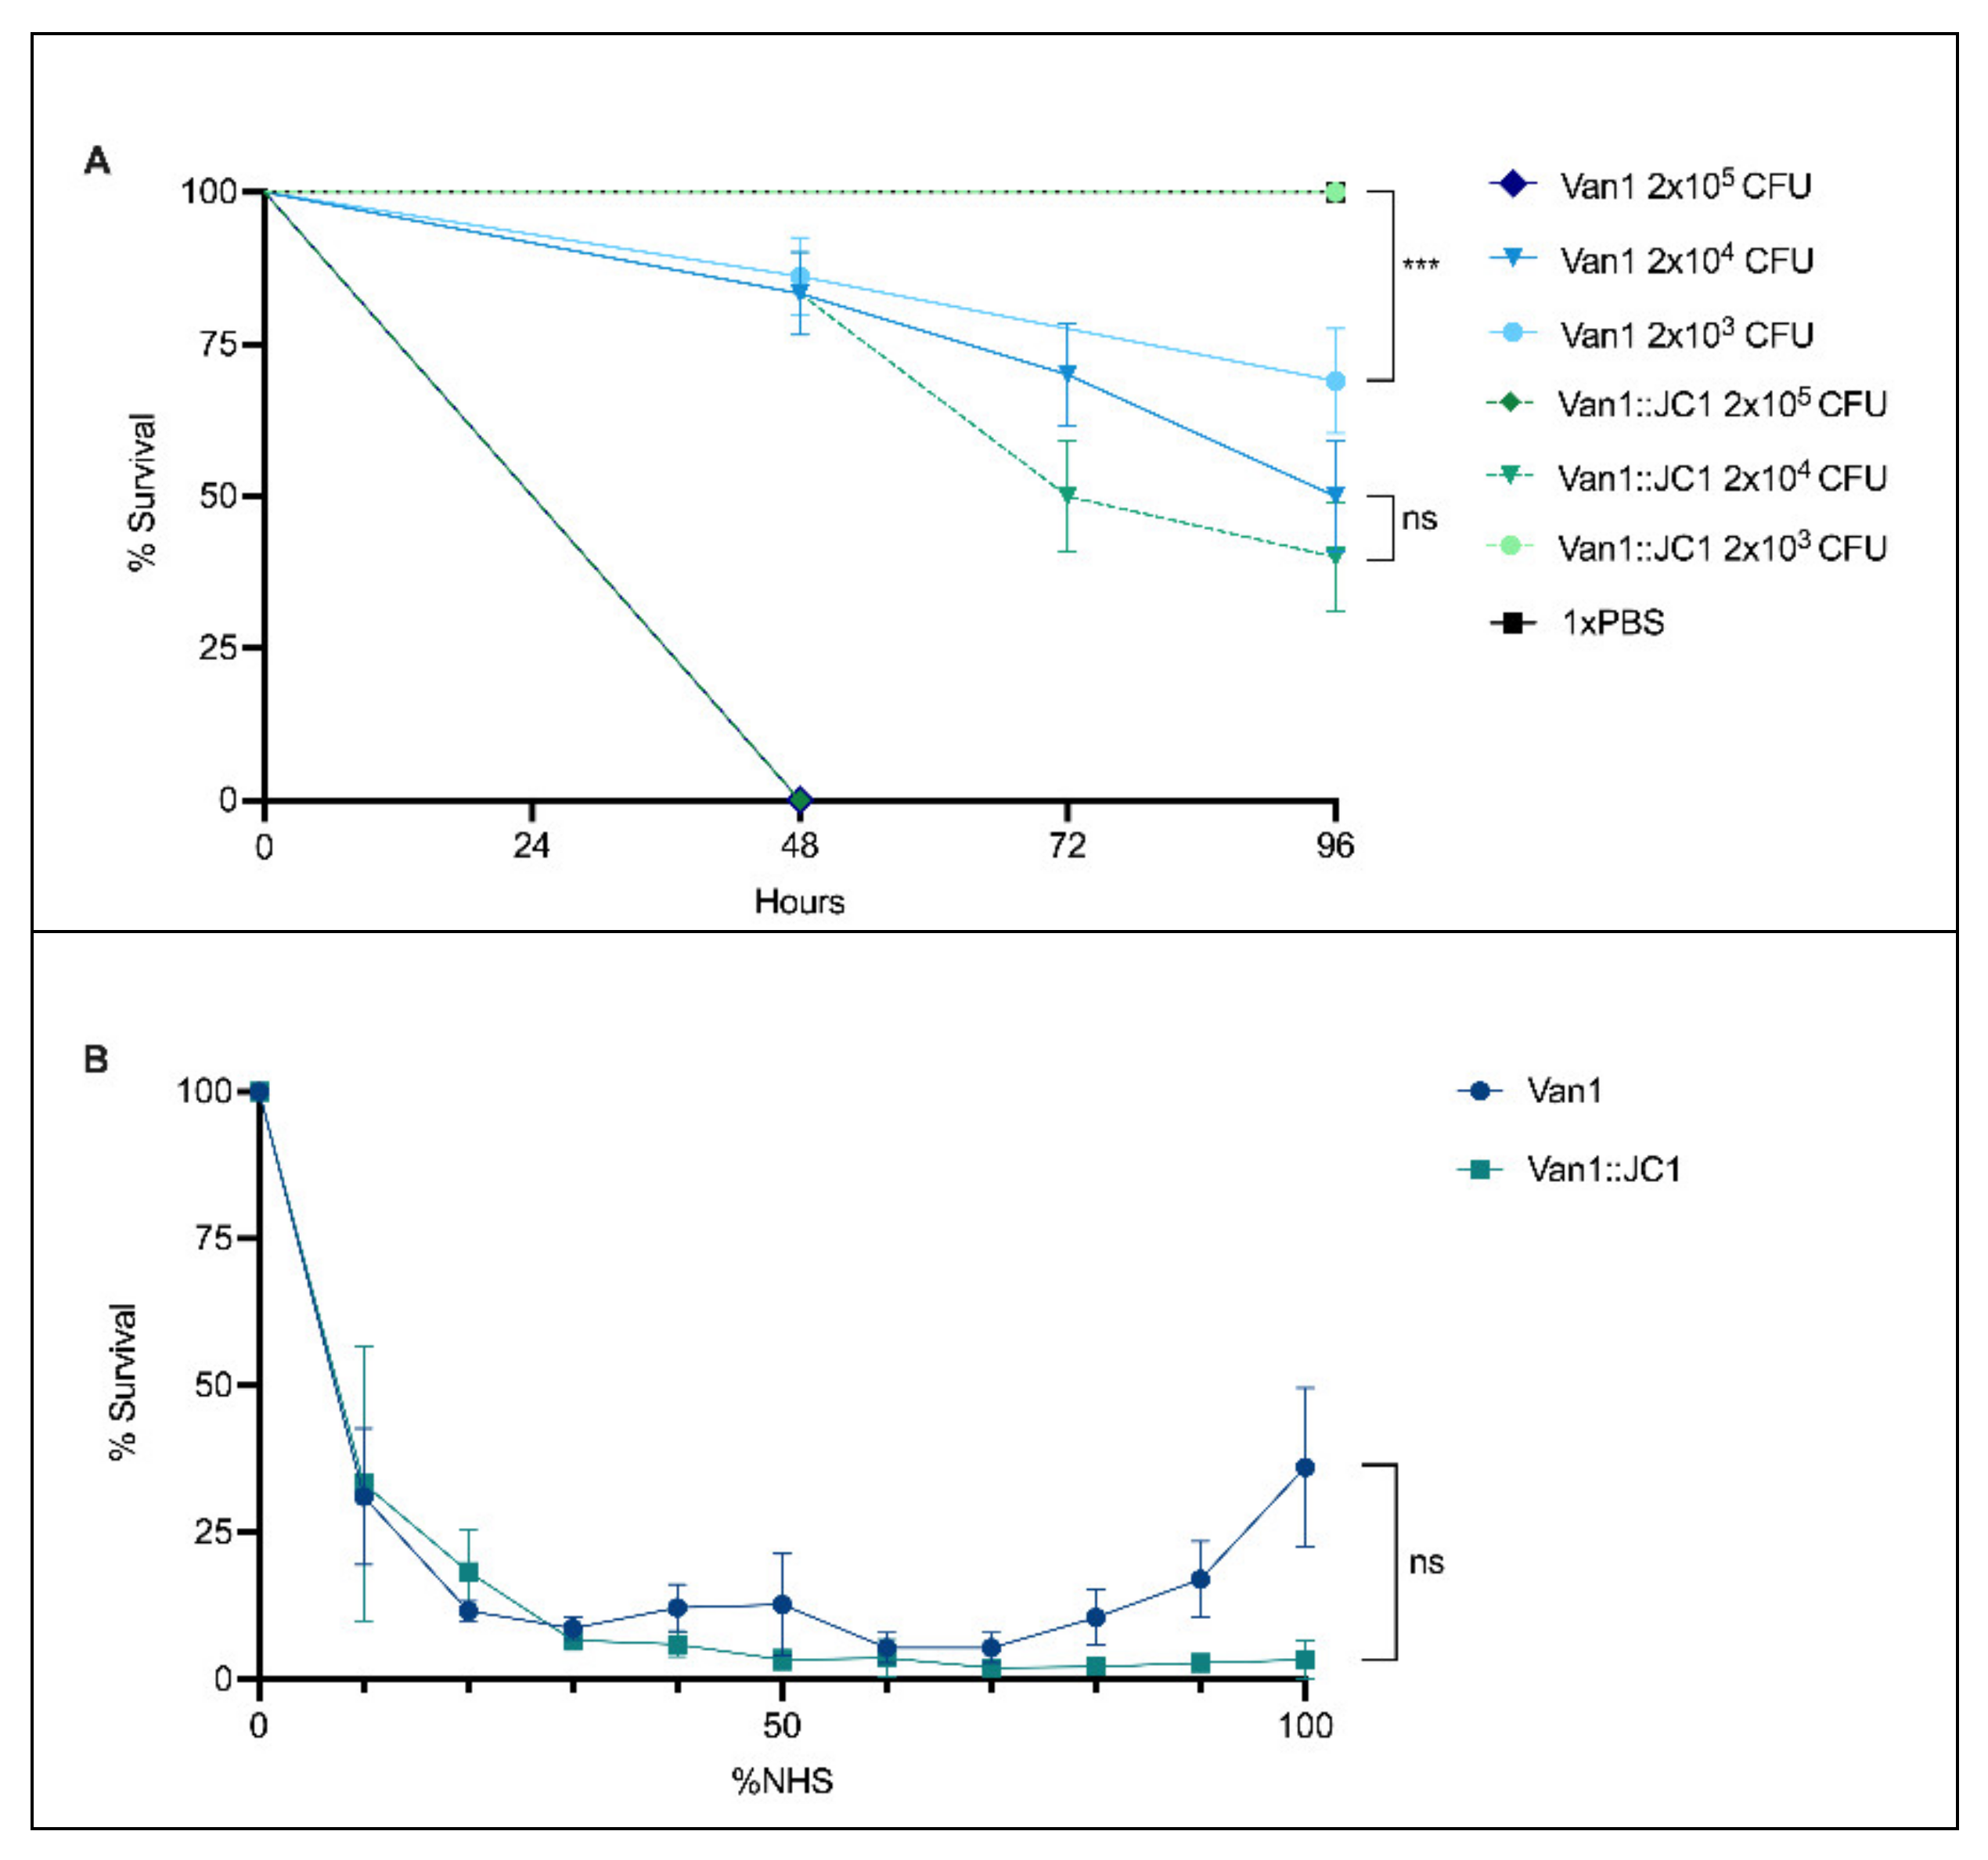
3.12. Comparison of Van1 & Van1::JC1 in Galleria mellonella and Normal Human Serum (NHS)

The differences between the Van1::JC1 lysogen and the wildtype strain in different media led us to examine whether changes in growth could have an effect on the virulence of Van1 in vivo. To study whether a difference in virulence exists between B. cenocepacia Van1 and the Van1::JC1 lysogen we injected the larval infection model G. mellonella [111,112,113] with various CFUs of each strain (Figure 10A). Van1 wildtype and the JC1 lysogen show dose-dependent killing, with a lethal dose of 2 × 10³ CFU and all wax worms dead by 48 h. The LD50 (50% lethal dose) is 2 × 10⁴ CFU, with no statistically significant difference seen between both strains. Interestingly, at 2 × 10⁵ CFU the Van1::JC1 lysogen is completely avirulent, whereas the wildtype strain is still able to kill about 25% of the population (p < 0.001). Given that we saw both increased and decreased growth depending upon which media the lysogen was grown in (Figure 9), it appears that the Van1::JC1 lysogen could be experiencing a slight growth disadvantage in the wax worm infection model, observable only at low CFU. Alternatively, the larval immune response could be causing stress on the lysogen at a low CFU resulting in a prophage switch to the lytic cycle, and therefore fewer viable Van1::JC1 bacteria. Further experiments are required to fully understand the lack of virulence in wax worms observed at the lower CFU for Van1::JC1.
“Cepacia Syndrome”, characterized by necrotizing pneumonia and septicaemia, is most commonly associated with B. cenocepacia infections [3,114,115]. To further explore the difference in fitness exhibited by wildtype Van1 and the Van1::JC1 lysogen, we tested the ability of each strain to survive in different concentrations of NHS (Figure 10B). NHS contains the heat-labile principle known as the complement system, a significant component of our innate immune system [116]. Overall, both strains do not show high propensity for survival in NHS, but wildtype Van1 demonstrates a higher percent survival between 80–100% NHS than the lysogen (p > 0.05; no significance). Given the lack of significance, no conclusions can be drawn, but there does seem to be a slight disadvantage for the lysogen in NHS, which coincides with our findings of decreased virulence in the G. mellonella infection model. This minor decrease in survival when exposed to complement could in part explain the decrease in virulence observed for the Van1::JC1 lysogen. The innate immune response of G. mellonella has complement-like proteins, and virulence studies from G. mellonella show strong correlation to results obtained from mice and rat lung [111,117,118,119]. Potentially, prophage JC1 may increase the sensitivity of Van1 towards the innate immune response, however, further experiments are required before solid conclusions can be drawn about this relationship.

4. Conclusions

Aside from encoding a repressor and an integrase, and being able to stably lysogenize its host bacterium, phage JC1 possesses several characteristics that would make it ideal for use in phage therapy. For one, JC1 has a considerably broad host range, being able to infect many member species of the Bcc. Phage JC1 also requires the inner core of the LPS for infection, so bacteria that mutate to evade infection by eliminating their O-antigen will likely develop a fitness disadvantage, as observed in previously characterized LPS mutants that lack the inner core [66,67]. Another favorable factor is the high level of virulence JC1 exhibits against host strain Van1 at 37 °C, which is comparable to virulence exhibited by lytic E. coli phage T7 at similar MOIs [102]. If the decrease in virulence at 30 °C is caused by an increased rate of lysogeny, then deletion of the genes responsible for lysogeny should increase the virulence index of JC1 at 30 °C and would make JC1 more suitable for use in therapy. Further experiments examining these potential alterations to make JC1 a suitable candidate for phage therapy against the Bcc are currently being conducted.

Supplementary Materials

The following supporting information can be downloaded at: https://www.mdpi.com/article/10.3390/v14050938/s1, Table S1: Plasmids used in this study. Table S2: Primers used in this study. Figure S1: RimO protein sequence of Van1 versus JC1 lysogen.

Author Contributions

Conceptualization, C.M.D. and J.J.D.; methodology, C.M.D., M.K.R., J.H.C., and J.J.D.; formal analysis, C.M.D., M.K.R. and J.J.D.; data curation, C.M.D., M.K.R., and J.H.C.; writing—original draft preparation, C.M.D.; writing—Review and editing, C.M.D. and J.J.D.; supervision, project administration, funding acquisition, J.J.D. All authors have read and agreed to the published version of the manuscript.

Funding

This research was funded by the Natural Sciences and Engineering Council of Canada (NSERC) (NSERC-238414-2018) and the Alberta Major Innovation Fund (RCP-19-003-MIF). C.M.D. was funded by a CGS-M graduate award from NSERC and an AIGSS award from Alberta Innovates. M.K.R. was funded by a CGS-M graduate award from NSERC.

Institutional Review Board Statement

Not applicable.

Informed Consent Statement

Not applicable.

Data Availability Statement

Not applicable.

Acknowledgments

The authors thank Arlene Oatway and Kacie Norton from the University of Alberta Department of Biological Sciences Advanced Microscopy Facility for assistance with TEM. The authors thank members of the Dennis and Tracy Raivio’s labs for thoughtful and helpful discussions.

Conflicts of Interest

The authors declare no conflict of interest.

References

  1. O’Neil, J. Tackling Drug-Resistant Infections Globally: Final Report and Recommendations. The Review on Antimicrobial Resistance; Government of the United Kingdom: London, UK, 2016; Available online: https://amr-review.org/sites/default/files/160518_Final%20paper_with%20cover.pdf (accessed on 1 March 2020).
  2. Council of Canadian Academies. When Antibiotics Fail: The Expert Panel on the Potential Socio-Economic Impacts of Antimicrobial Resistance in Canada; Council of Canadian Academies: Ottawa, ON, Canada, 2019. [Google Scholar]
  3. Mahenthiralingam, E.; Urban, T.A.; Goldberg, J.B. The multifarious, multireplicon Burkholderia cepacia complex. Nat. Rev. Microbiol. 2005, 3, 144–156. [Google Scholar] [CrossRef] [PubMed]
  4. Scoffone, V.C.; Chiarelli, L.R.; Trespidi, G.; Mentasti, M.; Riccardi, G.; Buroni, S. Burkholderia cenocepacia infections in cystic fibrosis patients: Drug resistance and therapeutic approaches. Front. Microbiol. 2017, 8, 1592. [Google Scholar] [CrossRef] [PubMed] [Green Version]
  5. Cystic Fibrosis Canada-The Canadian Cystic Fibrosis Registry 2019 Annual Data Report. Available online: https://www.cysticfibrosis.ca/registry/2019AnnualDataReport.pdf. (accessed on 20 January 2021).
  6. Gordillo Altamirano, F.L.; Barr, J.J. Phage therapy in the postantibiotic era. Clin. Microbiol. Rev. 2019, 32, e00066-18. [Google Scholar] [CrossRef] [PubMed] [Green Version]
  7. Davis, C.M.; McCutcheon, J.G.; Dennis, J.J. Aztreonam lysine increases the activity of phages E79 and PhiKZ against Pseudomonas aeruginosa PA01. Microorganisms 2021, 9, 152. [Google Scholar] [CrossRef]
  8. Kamal, F.; Dennis, J.J. Burkholderia cepacia complex phage-antibiotic synergy (PAS): Antibiotics stimulate lytic phage activity. Appl. Environ. Microbiol. 2015, 81, 1132–1138. [Google Scholar] [CrossRef] [Green Version]
  9. Comeau, A.M.; Tétart, F.; Trojet, S.N.; Prère, M.F.; Krisch, H.M. Phage-antibiotic synergy (PAS): β-lactam and quinolone antibiotics stimulate virulent phage growth. PLoS ONE 2007, 2, e799. [Google Scholar] [CrossRef] [Green Version]
  10. Chaudhry, W.N.; Concepción-Acevedo, J.; Park, T.; Andleeb, S.; Bull, J.J.; Levin, B.R. Synergy and order effects of antibiotics and phages in killing Pseudomonas aeruginosa biofilms. PLoS ONE 2017, 12, e0168615. [Google Scholar] [CrossRef]
  11. Seed, K.D.; Dennis, J.J. Isolation and characterization of bacteriophages of the Burkholderia cepacia complex. FEMS Microbiol. Lett. 2005, 251, 273–280. [Google Scholar] [CrossRef] [Green Version]
  12. Kropinski, A.M.; Mazzocco, A.; Waddell, T.E.; Lingohr, E.; Johnson, R.P. Enumeration of bacteriophages by double agar overlay plaque assay. Methods Mol. Biol. 2009, 501, 69–76. [Google Scholar] [CrossRef]
  13. Mahenthiralingam, E.; Coenye, T.; Chung, J.W.; Speert, D.P.; Govan, J.R.W.; Taylor, P.; Vandamme, P. Diagnostically and experimentally useful panel of strains from the Burkholderia cepacia complex. J. Clin. Microbiol. 2000, 38, 910–913. [Google Scholar] [CrossRef] [Green Version]
  14. Gonzalez, C.F.; Pettit, E.A.; Valadez, V.A.; Provin, E.M. Mobilization, cloning, and sequence determination of a plasmid-encoded polygalacturonase from a phytopathogenic Burkholderia (Pseudomonas) cepacia. Mol. Plant Microbe Interact. 1997, 10, 840–851. [Google Scholar] [CrossRef] [PubMed] [Green Version]
  15. McKenney, D.; Brown, K.E.; Allison, D.G. Influence of Pseudomonas aeruginosa exoproducts on virulence factor production in Burkholderia cepacia: Evidence of interspecies communication. J. Bacteriol. 1995, 177, 6989. [Google Scholar] [CrossRef] [PubMed] [Green Version]
  16. Stanier, R.Y.; Palleroni, N.J.; Doudoroff, M. The Aerobic Pseudomonads: A taxonomic study. J. Gen. Microbiol. 1966, 43, 159–271. [Google Scholar] [CrossRef] [PubMed] [Green Version]
  17. Cheng, H.P.; Lessie, T.G. Multiple replicons constituting the genome of Pseudomonas cepacia 17616. J. Bacteriol. 1994, 176, 4034–4042. [Google Scholar] [CrossRef] [PubMed] [Green Version]
  18. Gaffney, T.D.; Lessie, T.G. Insertion-sequence-dependent rearrangements of Pseudomonas cepacia plasmid PTGL1. J. Bacteriol. 1987, 169, 224–230. [Google Scholar] [CrossRef] [Green Version]
  19. Vandamme, P.; Holmes, B.; Vancanneyt, M.; Coenye, T.; Hoste, B.; Coopman, R.; Revets, H.; Lauwers, S.; Gillis, M.; Kersters, K.; et al. Occurrence of multiple genomovars of Burkholderia cepacia in cystic fibrosis patients and proposal of Burkholderia multivorans sp. nov. Int. J. Syst. Bacteriol. 1997, 47, 1188–1200. [Google Scholar] [CrossRef] [Green Version]
  20. Chu, K.K.; Davidson, D.J.; Halsey, T.K.; Chung, J.W.; Speert, D.P. Differential persistence among genomovars of the Burkholderia cepacia complex in a murine model of pulmonary infection. Infect. Immun. 2002, 70, 2715–2720. [Google Scholar] [CrossRef] [Green Version]
  21. Whiteford, M.L.; Wilkinson, J.D.; McColl, J.H.; Conlon, F.M.; Michie, J.R.; Evans, T.J.; Paton, J.Y. Outcome of Burkholderia (Pseudomonas) cepacia colonisation in children with cystic fibrosis following a hospital outbreak. Thorax 1995, 50, 1194–1198. [Google Scholar] [CrossRef] [Green Version]
  22. Mahenthiralingam, E.; Campbell, M.E.; Henry, D.A.; Speert, D.P. Epidemiology of Burkholderia cepacia infection in patients with cystic fibrosis: Analysis by randomly amplified polymorphic DNA fingerprinting. J. Clin. Microbiol. 1996, 34, 2914–2920. [Google Scholar] [CrossRef] [Green Version]
  23. Revets, H.; Vandamme, P.; Van Zeebroeck, A.; De Boeck, K.; Struelens, M.J.; Verhaegen, J.; Ursi, J.P.; Verschraegen, G.; Franckx, H.; Malfroot, A.; et al. Burkholderia (Pseudomonas) cepacia and cystic fibrosis: The epidemiology in Belgium. Acta Clin. Belg. 1996, 51, 222–230. [Google Scholar] [CrossRef]
  24. Lynch, K.H.; Dennis, J.J. Development of a species-specific Fur gene-based method for identification of the Burkholderia cepacia complex. J. Clin. Microbiol. 2008, 46, 447–455. [Google Scholar] [CrossRef] [PubMed] [Green Version]
  25. McKevitt, A.I.; Bajaksouzian, S.; Klinger, J.D.; Woods, D.E. Purification and characterization of an extracellular protease from Pseudomonas cepacia. Infect. Immun. 1989, 57, 771. [Google Scholar] [CrossRef] [PubMed] [Green Version]
  26. Mahenthiralingam, E.; Simpson, D.A.; Speert, D.P. Identification and characterization of a novel DNA marker associated with epidemic Burkholderia cepacia strains recovered from patients with cystic fibrosis. J. Clin. Microbiol. 1997, 35, 808. [Google Scholar] [CrossRef] [PubMed] [Green Version]
  27. Conway, B.A.D.; Chu, K.K.; Bylund, J.; Altman, E.; Speert, D.P. Production of exopolysaccharide by Burkholderia cenocepacia results in altered cell-surface interactions and altered bacterial clearance in mice. J. Infect. Dis. 2004, 190, 957–966. [Google Scholar] [CrossRef] [Green Version]
  28. Govan, J.R.W.; Doherty, C.J.; Nelson, J.W.; Brown, P.H.; Greening, A.P.; Maddison, J.; Dodd, M.; Webb, A.K. Evidence for transmission of Pseudomonas cepacia by social contact in cystic fibrosis. Lancet 1993, 342, 15–19. [Google Scholar] [CrossRef]
  29. Hutchison, M.L.; Poxton, I.R.; Govan, J.R.W. Burkholderia cepacia produces a hemolysin that is capable of inducing apoptosis and degranulation of mammalian phagocytes. Infect. Immun. 1998, 66, 2033. [Google Scholar] [CrossRef] [Green Version]
  30. Lewenza, S.; Conway, B.; Greenberg, E.P.; Sokol, P.A. Quorum sensing in Burkholderia cepacia: Identification of the LuxRI homologs CepRI. J. Bacteriol. 1999, 181, 748. [Google Scholar] [CrossRef] [Green Version]
  31. Balandreau, J.; Viallard, V.; Cournoyer, B.; Coenye, T.; Laevens, S.; Vandamme, P. Burkholderia cepacia genomovar III is a common plant-associated bacterium. Appl. Environ. Microbiol. 2001, 67, 982–985. [Google Scholar] [CrossRef] [Green Version]
  32. LiPuma, J.J.; Spilker, T.; Coenye, T.; Gonzalez, C.F. An epidemic Burkholderia cepacia complex strain identified in soil. Lancet 2002, 359, 2002–2003. [Google Scholar] [CrossRef]
  33. LiPuma, J.J.; Mortensen, J.E.; Dasen, S.E.; Edlind, T.D.; Schidlow, D.V.; Burns, J.L.; Stull, T.L. Ribotype analysis of Pseudomonas cepacia from cystic fibrosis treatment centers. J. Pediatr. 1988, 113, 859–862. [Google Scholar] [CrossRef]
  34. Walsh, T.A.; Ballou, D.P. Halogenated protocatechuates as substrates for protocatechuate dioxygenase from Pseudomonas cepacia. J. Biol. Chem. 1983, 258, 14413–14421. [Google Scholar] [CrossRef]
  35. Gillis, M.; Van Van, T.; Bardin, R.; Goor, M.; Hebbar, P.; Willems, A.; Segers, P.; Kersters, K.; Heulin, T.; Fernandez, M.P. Polyphasic taxonomy in the genus Burkholderia leading to an emended description of the genus and proposition of Burkholderia vietnamiensis Sp. Nov. for N2-fixing isolates from rice in Vietnam. Int. J. Syst. Bacteriol. 1995, 45, 274–289. [Google Scholar] [CrossRef]
  36. Burns, J.L.; Jonas, M.; Chi, E.Y.; Clark, D.K.; Berger, A.; Griffith, A. Invasion of respiratory epithelial cells by Burkholderia (Pseudomonas) cepacia. Infect. Immun. 1996, 64, 4054–4059. [Google Scholar] [CrossRef] [PubMed] [Green Version]
  37. Larsen, G.Y.; Stull, T.L.; Burns, J.L. Marked phenotypic variability in Pseudomonas cepacia isolated from a patient with cystic fibrosis. J. Clin. Microbiol. 1993, 31, 788. [Google Scholar] [CrossRef] [PubMed] [Green Version]
  38. Yeager, C.M.; Bottomley, P.J.; Arp, D.J.; Hyman, M.R. Inactivation of toluene 2-monooxygenase in Burkholderia cepacia G4 by alkynes. Appl. Environ. Microbiol. 1999, 65, 632–639. [Google Scholar] [CrossRef] [PubMed] [Green Version]
  39. Coenye, T.; Vandamme, P.; LiPuma, J.J.; Govan, J.R.W.; Mahenthiralingam, E. Updated version of the Burkholderia cepacia complex experimental strain panel. J. Clin. Microbiol. 2003, 41, 2797. [Google Scholar] [CrossRef] [Green Version]
  40. Mahenthiralingam, E.; Baldwin, A.; Dowson, C.G. Burkholderia cepacia complex bacteria: Opportunistic pathogens with important natural biology. J. Appl. Microbiol. 2008, 104, 1539–1551. [Google Scholar] [CrossRef]
  41. Palleroni, N.J.; Ballard, R.W.; Ralston, E.; Doudoroff, M. Deoxyribonucleic acid homologies among some Pseudomonas species. J. Bacteriol. 1972, 110, 1–11. [Google Scholar] [CrossRef] [Green Version]
  42. Yabannavar, A.V.; Zylstra, G.J. Cloning and characterization of the genes for p-nitrobenzoate degradation from Pseudomonas pickettii YH105. Appl. Environ. Microbiol. 1995, 61, 4284–4290. [Google Scholar] [CrossRef] [Green Version]
  43. McCutcheon, J.; Peters, D.; Dennis, J. Identification and characterization of type IV pili as the cellular receptor of broad host range Stenotrophomonas maltophilia bacteriophages DLP1 and DLP2. Viruses 2018, 10, 338. [Google Scholar] [CrossRef] [Green Version]
  44. Bankevich, A.; Nurk, S.; Antipov, D.; Gurevich, A.A.; Dvorkin, M.; Kulikov, A.S.; Lesin, V.M.; Nikolenko, S.I.; Pham, S.; Prjibelski, A.D.; et al. SPAdes: A new genome assembly algorithm and its applications to single-cell sequencing. J. Comput. Biol. 2012, 19, 455–477. [Google Scholar] [CrossRef] [PubMed] [Green Version]
  45. Delcher, A.L.; Bratke, K.A.; Powers, E.C.; Salzberg, S.L. Identifying bacterial genes and endosymbiont DNA with Glimmer. Bioinformatics 2007, 23, 673–679. [Google Scholar] [CrossRef]
  46. Hyatt, D.; Chen, G.L.; LoCascio, P.F.; Land, M.L.; Larimer, F.W.; Hauser, L.J. Prodigal: Prokaryotic gene recognition and translation initiation site identification. BMC Bioinf. 2010, 11, 119. [Google Scholar] [CrossRef] [PubMed] [Green Version]
  47. Besemer, J.; Lomsadze, A.; Borodovsky, M. GeneMarkS: A self-training method for prediction of gene starts in microbial genomes. Implications for finding sequence motifs in regulatory regions. Nucleic Acids Res. 2001, 29, 2607. [Google Scholar] [CrossRef] [PubMed] [Green Version]
  48. Lu, S.; Wang, J.; Chitsaz, F.; Derbyshire, M.K.; Geer, R.C.; Gonzales, N.R.; Gwadz, M.; Hurwitz, D.I.; Marchler, G.H.; Song, J.S.; et al. CDD/SPARCLE: The conserved domain database in 2020. Nucleic Acids Res. 2020, 48, D265–D268. [Google Scholar] [CrossRef] [PubMed] [Green Version]
  49. Krogh, A.; Larsson, B.; Von Heijne, G.; Sonnhammer, E.L.L. Predicting transmembrane protein topology with a hidden Markov model:Application to complete genomes. J. Mol. Biol. 2001, 305, 567–580. [Google Scholar] [CrossRef] [PubMed] [Green Version]
  50. Teufel, F.; Almagro Armenteros, J.J.; Johansen, A.R.; Gíslason, M.H.; Pihl, S.I.; Tsirigos, K.D.; Winther, O.; Brunak, S.; von Heijne, G.; Nielsen, H. SignalP 6.0 predicts all five types of signal peptides using protein language models. Nat. Biotechnol. 2022, 2022, 1–3. [Google Scholar] [CrossRef] [PubMed]
  51. Laslett, D.; Canback, B. ARAGORN, a program to detect tRNA genes and tmRNA genes in nucleotide sequences. Nucleic Acids Res. 2004, 32, 11–16. [Google Scholar] [CrossRef]
  52. Edgar, R.C. MUSCLE: Multiple sequence alignment with high accuracy and high throughput. Nucleic Acids Res. 2004, 32, 1792–1797. [Google Scholar] [CrossRef] [Green Version]
  53. Katoh, K.; Standley, D.M. MAFFT multiple sequence alignment software version 7: Improvements in performance and usability. Mol. Biol. Evol. 2013, 30, 772–780. [Google Scholar] [CrossRef] [Green Version]
  54. Darling, A.E.; Mau, B.; Perna, N.T. ProgressiveMauve: Multiple genome alignment with gene gain, loss and rearrangement. PLoS ONE 2010, 5, e11147. [Google Scholar] [CrossRef] [PubMed] [Green Version]
  55. Carlson, K.; Sulakvelidze, A. (Eds.) Working with Bacteriophages: Common Techniques and Methodological Approaches; Bacteriophages; CRC Press: Boca Raton, FL, USA, 2005. [Google Scholar]
  56. Kiljunen, S.; Datta, N.; Dentovskaya, S.V.; Anisimov, A.P.; Knirel, Y.A.; Bengoechea, J.A.; Holst, O.; Skurnik, M. Identification of the lipopolysaccharide core of Yersinia pestis and Yersinia pseudotuberculosis as the receptor for bacteriophage ΦA1122. J. Bacteriol. 2011, 193, 4963. [Google Scholar] [CrossRef] [Green Version]
  57. Williams, R.; Meader, E.; Mayer, M.; Narbad, A.; Roberts, A.P.; Mullany, P. Determination of the AttP and AttB sites of phage ΦCD27 from Clostridium difficile NCTC 12727. J. Med. Microbiol. 2013, 62, 1439–1443. [Google Scholar] [CrossRef] [PubMed]
  58. Peters, D.L.; McCutcheon, J.G.; Dennis, J.J. Characterization of novel broad-host-range bacteriophage DLP3 specific to Stenotrophomonas maltophilia as a potential therapeutic agent. Front. Microbiol. 2020, 11, 1358. [Google Scholar] [CrossRef] [PubMed]
  59. Duong-Nu, T.M.; Jeong, K.; Hong, S.H.; Puth, S.; Kim, S.Y.; Tan, W.; Lee, K.H.; Lee, S.E.; Rhee, J.H. A stealth adhesion factor contributes to Vibrio vulnificus pathogenicity: Flp pili play roles in host invasion, survival in the bloodstream and resistance to complement activation. PLoS Pathog. 2019, 15, e1007767. [Google Scholar] [CrossRef] [PubMed] [Green Version]
  60. McKay, G.A.; Woods, D.E.; MacDonald, K.L.; Poole, K. Role of phosphoglucomutase of Stenotrophomonas maltophilia in lipopolysaccharide biosynthesis, virulence, and antibiotic resistance. Infect. Immun. 2003, 71, 3068. [Google Scholar] [CrossRef] [Green Version]
  61. Ackermann, H.-W. Frequency of morphological phage descriptions in the year 2000-Brief Review. Arch. Virol. 2001, 146, 843–857. [Google Scholar] [CrossRef]
  62. Gill, J.J.; Summer, E.J.; Russell, W.K.; Cologna, S.M.; Carlile, T.M.; Fuller, A.C.; Kitsopoulos, K.; Mebane, L.M.; Parkinson, B.N.; Sullivan, D.; et al. Genomes and characterization of phages Bcep22 and BcepIL02, founders of a novel phage type in Burkholderia cenocepacia. J. Bacteriol. 2011, 193, 5300–5313. [Google Scholar] [CrossRef] [Green Version]
  63. Lynch, K.H.; Stothard, P.; Dennis, J.J. Characterization of DC1, a broad-host-range Bcep22-like podovirus. Appl. Environ. Microbiol. 2012, 78, 889–891. [Google Scholar] [CrossRef] [Green Version]
  64. Ragupathi, N.K.D.; Veeraraghavan, B. Accurate identification and epidemiological characterization of Burkholderia cepacia complex: An update. Ann. Clin. Microbiol. Antimicrob. 2019, 18, 7. [Google Scholar] [CrossRef] [Green Version]
  65. Lauman, P.; Dennis, J.J. Advances in phage therapy: Targeting the Burkholderia cepacia complex. Viruses. 2021, 13, 1331. [Google Scholar] [CrossRef] [PubMed]
  66. Loutet, S.A.; Flannagan, R.S.; Kooi, C.; Sokol, P.A.; Valvano, M.A. A complete lipopolysaccharide inner core oligosaccharide is required for resistance of Burkholderia cenocepacia to antimicrobial peptides and bacterial survival in vivo. J. Bacteriol. 2006, 188, 2073–2080. [Google Scholar] [CrossRef] [PubMed] [Green Version]
  67. Ortega, X.; Silipo, A.; Saldfas, M.S.; Bates, C.C.; Molinaro, A.; Valvano, M.A. Biosynthesis and structure of the Burkholderia cenocepacia K56-2 lipopolysaccharide core oligosaccharide: Truncation of the core oligosaccharide leads to increased binding and sensitvity to polymyxin B. J. Biol. Chem. 2009, 284, 21738–21751. [Google Scholar] [CrossRef] [PubMed] [Green Version]
  68. Holden, M.T.G.; Seth-Smith, H.M.B.; Crossman, L.C.; Sebaihia, M.; Bentley, S.D.; Cerdeño-Tárraga, A.M.; Thomson, N.R.; Bason, N.; Quail, M.A.; Sharp, S.; et al. The genome of Burkholderia cenocepacia J2315, an epidemic pathogen of cystic fibrosis patients. J. Bacteriol. 2009, 91, 261–277. [Google Scholar] [CrossRef] [Green Version]
  69. Gautheret, D.; Lambert, A. Direct RNA motif definition and identification from multiple sequence alignments using secondary structure profiles. J. Mol. Biol. 2001, 313, 1003–1011. [Google Scholar] [CrossRef]
  70. Macke, T.J.; Ecker, D.J.; Gutell, R.R.; Gautheret, D.; Case, D.A.; Sampath, R. RNAMotif, an RNA secondary structure definition and search algorithm. Nucleic Acids Res. 2001, 29, 4724–4735. [Google Scholar] [CrossRef]
  71. Lesnik, E.A.; Sampath, R.; Levene, H.B.; Henderson, T.J.; McNeil, J.A.; Ecker, D.J. Prediction of Rho-independent transcriptional terminators in Escherichia coli. Nucleic Acids Res. 2001, 29, 3583. [Google Scholar] [CrossRef] [Green Version]
  72. Hofacker, I.L.; Fontana, W.; Stadler, P.F.; Bonhoeffer, L.S.; Tacker, M.; Schuster, P. Fast folding and comparison of RNA secondary structures. Monatshefte für Chem./Chem. Mon. 1994, 125, 167–188. [Google Scholar] [CrossRef]
  73. Weigel, C.; Seitz, H. Bacteriophage replication modules. FEMS Microbiol. Rev. 2006, 30, 321–381. [Google Scholar] [CrossRef]
  74. Summer, E.J.; Gonzalez, C.F.; Carlisle, T.; Mebane, L.M.; Cass, A.M.; Savva, C.G.; LiPuma, J.J.; Young, R. Burkholderia cenocepacia phage BcepMu and a family of Mu-like phages encoding potential pathogenesis factors. J. Mol. Biol. 2004, 340, 49–65. [Google Scholar] [CrossRef]
  75. Casjens, S.R. Diversity among the tailed-bacteriophages that infect the Enterobacteriaceae. Res. Microbiol. 2008, 159, 340. [Google Scholar] [CrossRef] [PubMed] [Green Version]
  76. Goudie, A.D.; Lynch, K.H.; Seed, K.D.; Stothard, P.; Shrivastava, S.; Wishart, D.S.; Dennis, J.J. Genomic sequence and activity of KS10, a transposable phage of the Burkholderia cepacia complex. BMC Genom. 2008, 9, 615. [Google Scholar] [CrossRef] [PubMed] [Green Version]
  77. Lynch, K.H.; Abdu, A.H.; Schobert, M.; Dennis, J.J. Genomic characterization of JG068, a novel virulent Podovirus active against Burkholderia cenocepacia. BMC Genom. 2013, 14, 574. [Google Scholar] [CrossRef] [PubMed] [Green Version]
  78. Roszniowski, B.; Latka, A.; Maciejewska, B.; Vandenheuvel, D.; Olszak, T.; Briers, Y.; Holt, G.S.; Valvano, M.A.; Lavigne, R.; Smith, D.L.; et al. The temperate Burkholderia phage AP3 of the Peduovirinae shows efficient antimicrobial activity against B. cenocepacia of the IIIA Lineage. Appl. Microbiol. Biotechnol. 2017, 101, 1203–1216. [Google Scholar] [CrossRef]
  79. Lynch, K.H.; Liang, Y.; Eberl, L.; Wishart, D.S.; Dennis, J.J. Identification and characterization of ΦH111-1. Bacteriophage 2013, 3, e26649. [Google Scholar] [CrossRef] [Green Version]
  80. Lynch, K.H.; Stothard, P.; Dennis, J.J. Genomic analysis and relatedness of P2-like phages of the Burkholderia cepacia complex. BMC Genom. 2010, 11, 599. [Google Scholar] [CrossRef] [Green Version]
  81. Summer, E.J.; Gonzalez, C.F.; Bomer, M.; Carlile, T.; Embry, A.; Kucherka, A.M.; Lee, J.; Mebane, L.; Morrison, W.C.; Mark, L.; et al. Divergence and mosaicism among virulent soil phages of the Burkholderia cepacia complex. J. Bacteriol. 2006, 188, 255. [Google Scholar] [CrossRef] [Green Version]
  82. Iida, S.; Streiff, M.B.; Bickle, T.A.; Arber, W. Two DNA antirestriction systems of bacteriophage P1, DarA, and DarB: Characterization of DarA- phages. Virology 1987, 157, 156–166. [Google Scholar] [CrossRef]
  83. Piya, D.; Vara, L.; Russell, W.K.; Young, R.; Gill, J.J. The multicomponent antirestriction system of phage P1 is linked to capsid morphogenesis. Mol. Microbiol. 2017, 105, 399. [Google Scholar] [CrossRef] [Green Version]
  84. Summer, E.J.; Berry, J.; Tran, T.A.T.; Niu, L.; Struck, D.K.; Young, R. Rz/Rz1 lysis gene equivalents in phages of gram-negative hosts. J. Mol. Biol. 2007, 373, 1098–1112. [Google Scholar] [CrossRef]
  85. Reddy, B.L.; Saier, M.H. Topological and phylogenetic analyses of bacterial holin families and superfamilies. Biochim. Biophys. Acta 2013, 1828, 2654. [Google Scholar] [CrossRef] [PubMed] [Green Version]
  86. Schmidt, C.; Velleman, M.; Arber, W. Three functions of bacteriophage P1 involved in cell lysis. J. Bacteriol. 1996, 178, 1099. [Google Scholar] [CrossRef] [PubMed] [Green Version]
  87. Wang, I.N.; Smith, D.L.; Young, R. Holins: The protein clocks of bacteriophage infections. Annu. Rev. Microbiol. 2000, 54, 799–825. [Google Scholar] [CrossRef] [PubMed]
  88. Vukov, N.; Moll, I.; Bläsi, U.; Scherer, S.; Loessner, M.J. Functional regulation of the Listeria monocytogenes bacteriophage A118 holin by an intragenic inhibitor lacking the first transmembrane domain. Mol. Microbiol. 2003, 48, 173–186. [Google Scholar] [CrossRef]
  89. Sheehan, M.M.; Stanley, E.; Fitzgerald, G.F.; Van Sinderen, D. Identification and characterization of a lysis module present in a large proportion of bacteriophages infecting Streptococcus thermophilus. Appl. Environ. Microbiol. 1999, 65, 569. [Google Scholar] [CrossRef] [Green Version]
  90. Vermassen, A.; Leroy, S.; Talon, R.; Provot, C.; Popowska, M.; Desvaux, M. Cell wall hydrolases in bacteria: Insight on the diversity of cell wall amidases, glycosidases and peptidases toward peptidoglycan. Front. Microbiol. 2019, 10, 331. [Google Scholar] [CrossRef]
  91. Palmer, T.; Finney, A.J.; Saha, C.K.; Atkinson, G.C.; Sargent, F. A holin/peptidoglycan hydrolase-dependent protein secretion system. Mol. Microbiol. 2021, 115, 345–355. [Google Scholar] [CrossRef]
  92. Park, T.; Struck, D.K.; Dankenbring, C.A.; Young, R. The pinholin of lambdoid phage 21: Control of lysis by membrane depolarization. J. Bacteriol. 2007, 189, 9135. [Google Scholar] [CrossRef] [Green Version]
  93. Pourciau, C.; Lai, Y.J.; Gorelik, M.; Babitzke, P.; Romeo, T. Diverse mechanisms and circuitry for global regulation by the RNA-binding protein CsrA. Front. Microbiol. 2020, 11, 2709. [Google Scholar] [CrossRef]
  94. Tanaka, S.; Matsushita, Y.; Yoshikawa, A.; Isono, K. Cloning and molecular characterization of the gene rimL which encodes an enzyme acetylating ribosomal protein L12 of Escherichia coli K12. Mol. Gen. Genet. 1989, 217, 289–293. [Google Scholar] [CrossRef]
  95. Vetting, M.W.; Magnet, S.; Nieves, E.; Roderick, S.L.; Blanchard, J.S. A bacterial acetyltransferase capable of regioselective N-acetylation of antibiotics and histones. Chem. Biol. 2004, 11, 565–573. [Google Scholar] [CrossRef] [PubMed] [Green Version]
  96. Chartron, J.; Shiau, C.; Stout, C.D.; Carroll, K.S. 3′-phosphoadenosine-5′-phosphosulfate reductase in complex with thioredoxin: A structural snapshot in the catalytic cycle. Biochemistry 2007, 46, 3942. [Google Scholar] [CrossRef] [PubMed] [Green Version]
  97. Silverstein, J.L.; Goldberg, E.B. T4 DNA Injection. II. Protection of Entering DNA from Host Exonuclease, V. Virology 1976, 72, 212–223. [Google Scholar] [CrossRef]
  98. Silverstein, J.L.; Goldberg, E.B. T4 DNA Injection. I. Growth cycle of a gene 2 mutant. Virology 1976, 72, 195–211. [Google Scholar] [CrossRef]
  99. Anton, B.P.; Saleh, L.; Benner, J.S.; Raleigh, E.A.; Kasif, S.; Roberts, R.J. RimO, a MiaB-like enzyme, methylthiolates the universally conserved Asp88 residue of ribosomal protein S12 in Escherichia Coli. Proc. Natl. Acad. Sci. USA 2008, 105, 1826–1831. [Google Scholar] [CrossRef] [Green Version]
  100. Kurland, C.; Hughes, D.; Ehrenberg, M. Escherichia Coli and Salmonella: Cellular and Molecular Biology; American Association for the Advancement of Science: Washington, DC, USA, 1996; Volume 240, pp. 979–1004. [Google Scholar]
  101. Carr, J.F.; Hamburg, D.M.; Gregory, S.T.; Limbach, P.A.; Dahlberg, A.E. Effects of streptomycin resistance mutations on posttranslational modification of ribosomal protein S12. J. Bacteriol. 2006, 188, 2020–2023. [Google Scholar] [CrossRef] [Green Version]
  102. Storms, Z.J.; Teel, M.R.; Mercurio, K.; Sauvageau, D. The virulence index: A metric for quantitative analysis of phage virulence. Ther. Appl. Res. 2020, 1, 27–36. [Google Scholar] [CrossRef] [Green Version]
  103. Shan, J.; Korbsrisate, S.; Withatanung, P.; Adler, N.L.; Clokie, M.R.J.; Galyov, E.E. Temperature dependent bacteriophages of a tropical bacterial pathogen. Front. Microbiol. 2014, 5, 599. [Google Scholar] [CrossRef]
  104. Lynch, K.H.; Seed, K.D.; Stothard, P.; Dennis, J.J. Inactivation of Burkholderia cepacia complex phage KS9 gp41 identifies the phage repressor and generates lytic virions. J. Virol. 2010, 84, 1276–1288. [Google Scholar] [CrossRef] [Green Version]
  105. Boyd, E.F.; Brüssow, H. Common themes among bacteriophage-encoded virulence factors and diversity among the bacteriophages involved. Trends Microbiol. 2002, 10, 521–529. [Google Scholar] [CrossRef]
  106. Summer, E.J.; Gill, J.J.; Upton, C.; Gonzalez, C.F.; Young, R. Role of phages in the pathogenesis of Burkholderia or “Where are the toxin genes in Burkholderia phages?”. Curr. Opin. Microbiol. 2007, 10, 410. [Google Scholar] [CrossRef] [PubMed] [Green Version]
  107. Nzula, S.; Vandamme, P.; Govan, J.R.W. Sensitivity of the Burkholderia cepacia complex and Pseudomonas aeruginosa to transducing bacteriophages. FEMS Immunol. Med. Microbiol. 2000, 28, 307–312. [Google Scholar] [CrossRef] [PubMed] [Green Version]
  108. Langley, R.; Kenna, D.T.; Vandamme, P.; Ure, R.; Govan, J.R.W. Lysogeny and bacteriophage host range within the Burkholderia cepacia complex. J. Med. Microbiol. 2003, 52, 483–490. [Google Scholar] [CrossRef]
  109. Hens, D.K.; Ghosh, A.N.; Kumar, R. A new small temperate DNA phage BcP15 isolated from Burkholderia cepacia DR11. Arch. Virol. 2005, 150, 2421–2428. [Google Scholar] [CrossRef] [PubMed]
  110. Holt, G.S.; Lodge, J.K.; McCarthy, A.J.; Graham, A.K.; Young, G.; Bridge, S.H.; Brown, A.K.; Veses-Garcia, M.; Lanyon, C.V.; Sails, A.; et al. Shigatoxin encoding bacteriophage Φ24B modulates bacterial metabolism to raise antimicrobial tolerance. Sci. Rep. 2017, 7, 40424. [Google Scholar] [CrossRef] [Green Version]
  111. Seed, K.D.; Dennis, J.J. Development of Galleria mellonella as an alternative infection model for the Burkholderia cepacia complex. Infect. Immun. 2008, 76, 1267–1275. [Google Scholar] [CrossRef] [Green Version]
  112. Seed, K.D.; Dennis, J.J. Experimental bacteriophage therapy increases survival of Galleria mellonella larvae infected with clinically relevant strains of the Burkholderia cepacia complex. Antimicrob. Agents Chemother. 2009, 53, 2205–2208. [Google Scholar] [CrossRef] [Green Version]
  113. Kamal, F.; Peters, D.L.; McCutcheon, J.G.; Dunphy, G.B.; Dennis, J.J. Use of greater wax moth larvae (Galleria mellonella) as an alternative animal infection model for analysis of bacterial pathogenesis. Methods Mol. Biol. 2019, 1898, 163–171. [Google Scholar]
  114. Dennis, J.J. Burkholderia cenocepacia virulence microevolution in the CF lung: Variations on a theme. Virulence 2017, 8, 618–620. [Google Scholar] [CrossRef] [Green Version]
  115. Govan, J.R.W.; Brown, A.R.; Jones, A.M. Evolving epidemiology of Pseudomonas aeruginosa and the Burkholderia cepacia complex in cystic fibrosis lung infection. Future Microbiol. 2007, 2, 153–164. [Google Scholar] [CrossRef]
  116. Walport, M.J. Complement. First of two parts. N. Engl. J. Med. 2001, 344, 1058–1066. [Google Scholar] [CrossRef] [PubMed]
  117. Jander, G.; Rahme, L.G.; Ausubel, F.M. Positive correlation between virulence of Pseudomonas aeruginosa mutants in mice and insects. J. Bacteriol. 2000, 182, 3843–3845. [Google Scholar] [CrossRef] [PubMed] [Green Version]
  118. Brennan, M.; Thomas, D.Y.; Whiteway, M.; Kavanagh, K. Correlation between virulence of Candida albicans mutants in mice and Galleria mellonella larvae. FEMS Immunol. Med. Microbiol. 2002, 34, 153–157. [Google Scholar] [CrossRef] [PubMed] [Green Version]
  119. Tsai, C.J.; Loh, J.M.; Proft, T. Galleria mellonella infection models for the study of bacterial diseases and for antimicrobial drug testing. Virulence 2016, 7, 214–229. [Google Scholar] [CrossRef] [Green Version]
Figure 1. Transmission electron micrograph of JC1. High titer CsCl gradient purified JC1 virions were stained with 4% uranyl acetate on a copper grid and viewed at 140,000× magnification with a transmission electron microscope. Measurements of 10 phage particles have an average capsid diameter of 71 nm ± 1.24 nm and a short, noncontractile tail measuring 20 nm ± 0.91 nm in length and 13 nm ± 0.67 nm in width. Scale bar represents 100 nm.
Viruses 14 00938 g001
Figure 2. JC1 one-step growth curve on B. cenocepacia strain Van1. Subcultured Van1 was grown to approximately 3 × 10⁷ CFU/mL at 37 °C. JC1 lysate was added at an MOI of ~2 and incubated at 37 °C with aeration at 225 RPM. Samples were taken every 30 min for 3 h, followed by every hour for 3 h, and serially diluted in 1× PBS. A total of 5 μL of each dilution was spotted on soft agar overlays containing Van1. Error bars represent the standard error of the mean (SEM). Data from three biological replicates is shown. Phage JC1 exhibits a latent period of 1 h and 30 min and a burst size of 296 virions per cell at 6 h.
Viruses 14 00938 g002
Figure 3. Effects of proteinase K and periodate treatment on JC1 adsorption to B. cenocepacia Van1. Bacterial overnights were incubated with either (A) proteinase K or (B) or periodate to observe if JC1 can adsorb to bacteria without surface proteins or carbohydrates, respectively. Error bars represent the standard error of the mean (SEM). Data from three biological replicates is shown.
Viruses 14 00938 g003
Figure 4. Circularized genomic map of JC1. Scale (in bp) is shown on the outer periphery. Assigned putative functions for each of the 76 predicted open reading frames are as follows: lysis (red), DNA replication, repair, and regulation (blue), lysogeny (teal), virion morphogenesis (purple), hypothetical (grey), tRNA (green), moron (pink), Rho-independent terminator (light blue). JC1 has a GC content of 65%. Image created using Geneious Prime.
Viruses 14 00938 g004
Figure 5. Percent identity of Bcep22-like podoviruses and Ralstonia phage. Multiple sequence alignment was performed using MAFFT. Identical nucleotides between each genome is represented in greyscale and percent.
Viruses 14 00938 g005
Figure 6. Clinker gene cluster comparison of Bcep22-like phages and Ralstonia phage Gervaise. Comparison of whole genomes for Burkholderia phage JC1 against the four other Lessievirus phages DC1, BcepIL02, Bcep22, and BcepMigl and related Ralstonia phage Gervaise. Percent amino acid identity is represented by greyscale links between genomes. Homologous proteins are assigned a unique color.
Viruses 14 00938 g006
Figure 7. Sequence of JC1 attP overlap region in Burkholderia cenocepacia strain Van1. The 18 bp overlapping sequence present in attL and attR of the JC1 prophage and in the chromosome of the phage (virion) is lowercase. JC1 attP site is located 41 bp upstream of gp1, a predicted serine recombinase. The 1 bp difference between the attB site is underlined.
Viruses 14 00938 g007
Figure 8. Virulence of JC1 against Burkholderia cenocepacia Van1 at (A) 30 °C versus (B) 37 °C. Kill curves were measured every hour for 48 h. (C) Virulence curves of JC1 at 30 °C and 37 °C were calculated by dividing the area under the curve for each MOI by the area under the curve of the bacterial control and subtracting that from 1. A virulence index of 0 to 1 signifies a complete absence of virulence to a theoretical maximum virulence, respectively. All error bars represent the standard error of the mean (SEM). Data from three biological replicates is shown.
Viruses 14 00938 g008
Figure 9. Growth comparison of Van1 versus Van1::JC1 lysogen. (AC) Growth curve analysis of wildtype Van1 and Van1::JC1 lysogen in either Luria Bertani (LB), Muller Hinton (MH), or tryptic soy broth (TSB) liquid media. Overnight cultures were subcultured 1:100 in LB for 2 h and 45 min and further diluted 1:100 to a CFU/mL of approximately 1 × 10⁶ in the desired medium and measured every hour for 48 h. (DF) Growth rate of curves in (AC) calculated using growth rate equation log10N − log10N0 = (μ/2.303) (t − t0). Statistical analysis was performed using unpaired t-tests (* p < 0.05; ** p < 0.01; *** p < 0.001; **** p < 0.0001). All error bars represent the standard error of the mean (SEM). Data from three biological replicates is shown.
Viruses 14 00938 g009
Figure 10. Comparison of Van1 and Van1::JC1 lysogen in Galleria mellonella and Normal human serum (NHS). (A) Percent survival of G. mellonella over 96 h following infection with Van1 or Van1::JC1 lysogen at varying CFU. Larvae of similar size were injected with 5 μL of desired bacterial strain or 1xPBS, incubated at 37 °C, and monitored every 24 h for survival. Statistical analysis was performed using Logrank (Mantel-Cox test) (ns; no significance, ***; p < 0.001). Error bars represent standard error. Data from 3 biological replicates is shown, with ten larvae injected per replicate. (B) Percent survival of Van1 and Van1::JC1 lysogen in various concentrations of NHS. Bacteria were inoculated (104–105 CFU) into various concentrations of NHS diluted with LB. CFU counts were collected after a 2h incubation at 37 °C with humidity. Statistical analysis was performed using unpaired t-tests (ns; no significance). Error bars represent standard error of the mean (SEM). Data from three biological replicates is shown.
Viruses 14 00938 g010
Table 1. Host range analysis of JC1 on 85 Burkholderia strains.
Burkholderia SpeciesStrainEfficiency of Plating (EOP)Source/Reference
B. cepaciaATCC 25416 TNDOnion/[13,14,15]
ATCC 17759NDSoil, Trinidad/[13,14,15,16]
CEP509/LMG 188216.7 × 10−7CF patient, Australia/[13]
CEP5217.3 × 10−7CF patient, Canada/CBCCRRR *
B. multivoransATCC 17616+++Soil, USA/[13,16,17,18,19]
C3430NDCF patient, Canada/[20]
C1576, LMG 16660NDCF-e patient, UK/[13,19,21]
C52748.0 × 10−6CF patient, Canada/[20]
C5393NDCF patient, Canada/[13,20]
C5568++CF patient, Canada/[20]
JC1++CF patient, Canada/[20]
LMG 13010 T++CF patient, Belgium/[13,19,20,21,22,23]
M1512NDCF patient, Canada/[24]
M1865NDCF patient, Canada/[24]
R810NDCF patient, Canada/[24]
R1159NDCF patient, Canada/[24]
B. cenocepaciaAU10540.93CF patient/[18]
715jNDCF patient, USA/[25]
BS1++CF patient, Canada/This study
BS2++CF patient, Canada/This study
BS3++CF patient, Canada/This study
C1257++CF-e patient, USA/[20]
C4455++CF-e patient, Canada/[20]
C54240.25CF-e patient, Canada/[13,21]
C6433NDCF-e patient, Canada/[13,21,26]
C89630.3CF patient, Canada/[27]
C9343NDCF patient, Canada/[27]
CEP511++CF-e patient, Australia/[13,22]
CEP08680.002CF patient, Argentina/[25]
D1NDSoil, USA/[24]
HI2424NDSoil, USA/[24]
J23150.14CF-e patient, UK/[13,28,29]
K56-2+++CF-e patient, Canada/[13,30]
K63-3NDCF-e patient, Canada/[30]
LMG 19240NDWheat soil, Australia/[31]
MCO-3NDMaize soil, USA/[32]
PC1840.19CF-e patient, USA/[13,33]
R161+CF patient, Canada/[24]
R452+CF patient, Canada/[24]
R7500.9CF patient, Canada/[24]
R12840.022CF patient, Canada/[24]
R12850.6CF patient, Canada/[24]
R1314++CF patient, Canada/[24]
R14340.86CF patient, Canada/[24]
R1619++CF patient, Canada/[24]
R18820.53CF patient, Canada/[24]
R18830.47CF patient, Canada/[24]
R18841CF patient, Canada/[24]
R23140.73CF patient, Canada/[24]
RK1b0.31CF patient, Canada/[24]
S115280.8CF patient, Canada/[24]
Van11CF patient, Canada/This study
B. stabilisLMG 14294+CF patient, Belgium/[13,23]
C7322/LMG 188706.0 × 10−4CF patient, Canada/[13,22]
R450NDCF patient, Canada/[24]
R2140+CF patient, Canada/[24]
R2339NDCF patient, Canada/[24]
B. vietnamiensisDBO1NDSoil, USA/[34]
LMG 10929 TNDRice, Vietnam/[13,19,35]
PC259/LMG 18835+CF patient, USA/[13,36,37]
G4NDSoil, USA/[38]
B. dolosaAU0158++CF patient, USA/[39]
CEP021+CF patient, USA/[39]
E128.6 × 10−5CF patient, UK/[39]
STM1441NDSoil, Senegal/[39]
B. ambifariaAMMD TNDSoil, USA/[39]
ATCC 532662.3 × 10−5Soil, USA/[39]
CEP9960.31CF patient, Australia/[39]
M53NDSoil, USA/[24]
B. anthinaAU12930.8CF patient, USA/[39]
C17654.3 × 10−3CF patient, UK/[39]
J2552NDSoil, UK/[39]
W92TNDSoil, USA/[39]
B. pyrrociniaATCC 15958NDSoil, Japan/[39]
ATCC 39277NDSoil, USA/[39]
BC011NDWater, USA/[39]
C1469NDCF patient, UK/[39]
Bcc Group KCEP0964NDCF patient, Canada/[24]
CEP1056++CF patient, Canada/[24]
R4453.1 × 10−5CF patient, Canada/[24]
B. lata383NDSoil, Trinidad/[40]
Burkholderia sp.JS1501Soil, USA/[24]
Pandoraea sp.R1717NDCF patient, Canada/[24]
Ralstonia pickettiiATCC 275110.7Patient isolate, USA/[41]
YH105NDSoil, USA/[42]
ND, Not detected; +, clearing at 1010 PFU/mL; ++, clearing at 109 PFU/mL; +++, clearing at 108 PFU/mL. EOP calculated by dividing PFU/mL on each strain by actual PFU/mL determined on strain Van1. Abbreviations: T, type strain; CF, cystic fibrosis isolate; CF-e, cystic fibrosis epidemic isolate. * Canadian Burkholderia cepacia complex Research and Referral Repository.
Table 2. JC1 receptor identification on B. cenocepacia K56-2 LPS mutants.
Bacterial StrainPhenotypepSCRhaB2pSCRhaB2-Complement
K56-2Wildtype LPS++
SAL1K56-2 hldA:: pSL5, Lacks inner and outer core+
CCB1K56-2 waaC::pGPΩTp, Lacks inner and outer core+
XOA8K56-2 wabO::pGPΩTp, Lacks inner and outer core+
XOA7K56-2 waaL::pGPΩTp, Lacks outer core++
XOA15K56-2 wabR::pGPΩTp, Lacks outer core++
XOA17K56-2 wabS::pGPΩTp, Lacks outer core++
RSF19K56-2 wbxE:: pRF201, Lacks O-antigen++
Table 3. Bacteriophage genome annotations for JC1 obtained from BLASTp data.
GeneStartEndStrandLength(aa)Putative FunctionBLASTp HitSpeciesCoverage (%)E-ValueIdentity (%)Accession
116605551 aaserine recombinaseserine recombinase-like proteinBurkholderia phage Bcep22100070.29NP_944235.2
22081179495 aahypothetical proteinhypothetical protein Bcep22_gp07Burkholderia phage Bcep22722 × 10−2765.22YP_009173769.1
324932146115 aahypothetical proteinhypothetical protein Bcep22_gp09Burkholderia phage Bcep22982 × 10−2140.35NP_944237.1
428672490125 aahypothetical proteinhypothetical proteinBurkholderia multivorans1003 × 10−8496.80WP_217093966.1
538952864343 aaRecT-like proteinRecT-like proteinBurkholderia phage Bcep221001 × 10−17874.16NP_944238.1
649763945343 aanuclease/RecB-like proteinnuclease/RecB-like proteinBurkholderia phage Bcepmigl98084.32YP_007236753.1
756975104197 aarepressortranscriptional regulatorBurkholderia phage Bcepmigl1007 × 10−8159.90YP_007236754.1
858216165+114 aatranscriptional regulatortranscriptional regulatorBurkholderia phage DC1788 × 10−3866.29YP_006589939.1
963356685+116 aahypothetical proteinhypothetical protein G167_gp75 Burkholderia phage Bcepmigl964 × 10−6787.50YP_007236756.1
1067377546+269 aavirion-associated protein ahypothetical protein BcepIL02_gp11Burkholderia phage Bcepil02992 × 10−14373.98YP_002922683.1
1176428142+166 aasingle stranded DNA binding proteinsingle stranded DNA binding proteinBurkholderia phage DC11004 × 10−8281.33YP_006589943.1
1281518369+72 aahypothetical proteinhypothetical protein B862_gp69Burkholderia phage DC11003 × 10−4088.89YP_006589944.1
1383668842+158 aahypothetical proteinhypothetical protein UAM5_00057Ralstonia phage UAM5992 × 10−6865.61CAH0532174.1
1488399201+120 aahypothetical proteinhypothetical protein KMC44_gp61Ralstonia phage Cimandef981 × 10−5970.87YP_010078217.1
1593529807+151 aahypothetical proteinhypothetical protein B862_gp66Burkholderia phage DC1847 × 10−6885.94YP_006589947.1
1610,1279801108 aahypothetical proteinhypothetical proteinBurkholderia multivorans1002 × 10−75100WP_217093979.1
1710,38910,13285 aahypothetical proteinhypothetical proteinBurkholderia multivorans1002 × 10−53100WP_217093980.1
1810,74410,974+76 aahypothetical proteinhypothetical protein B862_gp65Burkholderia phage DC11003 × 10−3984.21YP_006589948.1
1910,97111,357+128 aahelicaseTPA: MAG TPA: hypothetical proteinSiphoviridae sp.616 × 10−1844.30DAT31939.1
2011,35412,178+274 aaeplication initiator proteinreplication proteinBurkholderia phage Bcepmigl392 × 10−4876.85YP_007236768.1
2112,17512,975+266 aaDnaC-like proteinDnaC-like proteinBurkholderia phage Bcepil02994 × 10−15076.60YP_002922693.1
2213,05713,182+41 aahypothetical proteinhypothetical protein G167_gp61Burkholderia phage Bcepmigl1001 × 10−956.10YP_007236770.1
2313,33713,765+142 aahypothetical proteinhypothetical protein B862_gp60Burkholderia phage DC1985 × 10−5160.28YP_006589953.1
2413,77114,106+111 aahypothetical proteinhypothetical protein BcepIL02_gp24Burkholderia phage Bcepil02851 × 10−1643.75YP_002922696.1
2514,16614,609+147 aahypothetical proteinTPA: MAG TPA_asm: hypothetical proteinMyoviridae sp.957 × 10−4449.29DAL29776.1
2614,65215,041+129 aahypothetical proteinTPA: MAG TPA: hypothetical proteinMyoviridae sp.951 × 10−934.35DAP81611.1.1
2715,04415,325+93 aahypothetical proteinhypothetical protein B862_gp58Burkholderia phage DC11003 × 10−4070.83YP_006589955.1
2815,36416,602+412 aahypothetical proteinhypothetical protein Bcep22_gp31Burkholderia phage Bcep221006 × 10−15662.42NP_944260.2
2917,01716,658119 aahypothetical proteinhypothetical protein KMC50_gp40Ralstonia phage Claudette852 × 10−2549.02YP_010078630.1
3017,21018,010+266 aaterminase small subunitterminase small subunitBurkholderia phage DC1938 × 10−16183.53YP_006589958.1
3118,09018,338+82 aahypothetical proteinhypothetical protein B862_gp53Burkholderia phage DC1922 × 10−3982.89YP_006589960.1
3218,38918,517+42 aahypothetical proteinhypothetical protein B862_gp49Burkholderia phage DC1972 × 10−1787.80YP_006589964.1
3318,56218,840+92 aahypothetical proteinhypothetical proteinBurkholderia multivorans1001 × 10−5997.83WP_217093993.1
3418,87219,066+64 aahypothetical proteinhypothetical proteinBurkholderia multivorans1009 × 10−3696.88WP_217093994.1
3519,05920,366+435 aahypothetical proteinhypothetical protein phiE131_040Burkholderia phage phiE131479 × 10−2341.40AYJ74306.1
3620,35620,766+136 aahypothetical proteinhypothetical protein HOT12_gp34Burkholderia phage vB_BmuP_KL4845 × 10−3268.10YP_009800723.1
3720,85121,033+60 aahypothetical proteinhypothetical proteinBurkholderia multivorans1008 × 10−33100WP_217093996.1
3821,03021,416+128 aahypothetical proteinTPA: MAG TPA: Protein of unknown function (DUF2591)Caudovirales sp.992 × 10−1336.76DAH87964.1
3921,41321,700+95 aahypothetical proteinhypothetical proteinBurkholderia multivorans1009 × 10−63100WP_217093998.1
4021,69722,035+112 aahypothetical proteinhypothetical protein Bcep22_gp48Burkholderia phage Bcep22992 × 10−6585.59NP_944277.1
4122,17222,582+136 aaDUF2778 domain-containing proteinTPA: MAG TPA: Protein of unknown function (DUF2778)Myoviridae sp.988 × 10−1939.57DAO56318.1
4222,57922,860+93 aahypothetical proteinhypothetical proteinBurkholderia multivorans1007 × 10−5798.92WP_217094000.1
4322,94824,549+533 aaterminase large subunitterminase large subunitBurkholderia phage DC198083.11YP_006589971.1
4424,56024,991+143 aahypothetical proteinhypothetical protein BcepIL02_gp45Burkholderia phage Bcepil02992 × 10−8282.39YP_002922717.1
4525,01327,310+765 aaportal proteinphage portal proteinBurkholderia phage Bcepil0295077.53YP_002922718.1
4627,31828,340+340 aavirion-associated proteinahypothetical protein Bcep22_gp52Burkholderia phage Bcep22983 × 10−11057.82NP_944281.1
4728,36728,561+64 aacarbon storage regulatorcarbon storage regulatorBurkholderia phage DC11001 × 10−3089.06YP_006589976.1
4828,66029,754+364 aamajor capsid proteinmajor capsid proteinBurkholderia phage Bcepmigl100092.03YP_007236797.1
4929,82130,288+155 aavirion-associated proteinvirion associated proteinBurkholderia phage Bcepmigl1002 × 10−7774.84YP_007236798.1
5030,34630,942+198 aahypothetical proteinhypothetical protein B862_gp33Burkholderia phage DC1995 × 10−8063.41YP_006589980.1
5130,94631,593+215 aavirion-associated protein ahypothetical protein B862_gp32Burkholderia phage DC11007 × 10−14792.09YP_006589981.1
5231,59032,219+209 aavirion-associated protein ahypothetical protein G167_gp30Burkholderia phage Bcepmigl1006 × 10−11777.14YP_007236801.1
5332,22932,648+139 aavirion-associated proteinmajor capsid proteinBurkholderia phage DC11006 × 10−9394.24YP_006589983.1
5432,65333,528+291 aahypothetical proteinhypothetical protein B862_gp29Burkholderia phage DC1979 × 10−14774.39YP_006589984.1
5533,51033,788+92 aavirion-associated proteinvirion-associated phage proteinBurkholderia phage Bcepil021002 × 10−5390.22YP_002922729.1
5633,79034,740+316 aatail fiber proteinputative tail fiber proteinBurkholderia phage Bcepil021004 × 10−17776.90YP_002922730.1
5734,74435,814+356 aatail fiber proteinputative tail fiber proteinBurkholderia phage Bcepil021002 × 10−14564.54YP_002922731.1
5835,81136,323+170 aahypothetical proteinhypothetical protein BcepIL02_gp60Burkholderia phage Bcepil02987 × 10−3945.29YP_002922732.1
5936,48437,530+348 aatail fiber proteinTPA: MAG TPA: Endo N acetylneuraminidaseSiphoviridae sp.599 × 10−8463.59DAM52127.1
6037,53238,221+229 aahypothetical proteinhypothetical proteinPseudomonas phage Dolphis1006 × 10−1844.92QNJ57341.1
6138,27640,018+580 aahead closure proteinvirion-associated phage proteinBurkholderia phage Bcepil02100090.00YP_002922735.1
6240,02040,373+117 aahypothetical protein avirion-associated phage proteinBurkholderia phage Bcepil02972 × 10−6286.09YP_002922736.1
6340,42440,864+146 aaacetyltransferaseacetyltransferaseBurkholderia phage DC1976 × 10−9289.51YP_006589993.1
6440,85741,855+332 aavirion-associated protein ahypothetical protein B862_gp19Burkholderia phage DC1100091.27YP_006589994.1
6541,86742,589+240 aaphosphoadenosine phosphosulfate reductasephosphoadenosine phosphosulfate reductaseBurkholderia phage DC11002 × 10−16794.17YP_006589995.1
6642,58942,888+99 aahypothetical proteinhypothetical proteinBurkholderia multivorans1002 × 10−59100WP_217094022.1
6742,90543,495+196 aavirion-associated proteinvirion-associated phage proteinBurkholderia phage Bcepil02301 × 10−449.21YP_002922740.1
6843,50645,038+510 aavirion-associated protein ahypothetical protein B862_gp17Burkholderia phage DC1100080.30YP_006589996.1
6945,12358,670+4515 aaDarB-like antirestriction proteinDarB-like antirestriction proteinBurkholderia phage Bcep22100079.33NP_944303.1
7058,94058,70179 aahypothetical proteinhypothetical protein BcepIL02_gp71Burkholderia phage Bcepil02971 × 10−4689.61YP_002922743.1
7159,28758,99198 aahypothetical proteinhypothetical protein G167_gp14Burkholderia phage Bcepmigl1002 × 10−4167.35YP_007236817.1
7259,44359,790+115 aaLydA-like holinLydA-like holinuncultured Caudovirales phage824 × 10−2754.74CAB4121548.1
7359,78760,059+90 aaholinholinBurkholderia phage vB_BceS_AH2916 × 10−3268.29YP_006561127.1
7460,05660,634+192 aalysozymehypothetical protein AXJ08_gp22Rhodoferax phage P26218947 × 10−5749.45YP_009222572.1
7560,63161,140+169 aaRzRz-like phage lysis proteinBurkholderia phage Bcep22957 × 10−6566.27NP_944308.1
7660,86661,087+73 aaRz1Rz1Burkholderia phage DC11009 × 10−1683.56YP_006590003.1
a Putative function determined by mass spectrometry analysis.
Table 4. Predicted Rho-independent terminators in JC1.
StartProgramStrandSequence−ΔG
1753BothATCGACTCCAACGGCACCCTCGCGGTGCCGTTTTTATTGCCC−13.20
6258Rnamotif+CCAGCTGTTGAGCCTCCCGTTTCAGGGAGGCTTTTTGCCCGTA−15.70
10,407RnamotifAGAGCGTCGTCGGCGGCCCGCACGGCCGCCaTTTTTTTCGATC−16.00
13,228Rnamotif+GGCGACTTTGGTGGGCGGCTCGTACAGCGCCCGTTTTTTTTCACC−9.60
13,893RnamotifCCGATGCGCACCGGCCGGATGTGGCTGATCCGGTTGTTGTATTCGCGG−10.50
47,347RnamotifTCGGCCGACACCTTGCGGCGCTCGGCCGTGAGcaTCTTGTTCCAGC−12.10
51,986RnamotifCCTCCTGAATCGCGCGCCAGATGGCGCGCTTCTGGTTCGGG−15.60
61,154Both+GGCTGAGACTTCCCCGGCGCGAGCCGGGGTTTTTTATGCCG−16.40
Rho-independent terminators were identified using the ARNold [69,70,71,72] program and putative terminators with a ΔG value of −9 kcal/mol or less were retained. DNA predicted to form the loop in the RNA is in red, and DNA predicted to encode an RNA stem is blue.
Table 5. The conserved domains found in the 76 gene products of JC1.
GpHit TypePSSM-IDIntervalE-ValueAccessionShort NameSuperfamily
1specific2382069–1591.68 × 10−24cd00338Ser_Recombinasecl02788
5superfamily41398831–2452.47 × 10−48cl04285RecT superfamily-
6superfamily41560714–1686.92 × 10−17cl09232YqaJ superfamily-
7specific23804511–631.31 × 10⁻⁵cd00093HTH_XREcl22854
10superfamily41328120–2682.41 × 10−72cl02338DUF2303 superfamily-
14superfamily37777734–986.08 × 10⁻⁸cl06229DUF1364 superfamily-
18specific4048975–743.76 × 10⁻¹⁹pfam14090HTH_39cl16606
19specific21494715–883.71 × 10⁻¹⁹smart00974T5orf172cl15257
20superfamily237940106–1412.12 × 10−3cl36477PRK15313 superfamily-
21superfamily42296372–2631.95 × 10−39cl38936P-loop_NTPase superfamily-
30specific39758319–2367.93 × 10−24pfam03592Terminase_2cl01513
38superfamily4163282–1201.32 × 10−21cl11584DUF2591 superfamily-
40superfamily4041623–867.90 × 10⁻²¹cl16173DUF4031 superfamily-
41specific4024781–1256.70 × 10−48pfam10908DUF2778cl12489
43superfamily22285851–2523.53 × 10−09cl2855717 superfamily-
45superfamily29311957–6169.79 × 10−10cl24922P22_portal superfamily-
45superfamily135173668–7658.02 × 10−5cl31366PRK04654 superfamily-
47specific3969341–447.10 × 10⁻⁸pfam02599CsrAcl00670
48specific40418939–3588.21 × 10−100pfam13252DUF4043cl22542
53superfamily41220429–1304.16 × 10−3cl00184CAS_like superfamily-
57specific404724255–3063.00 × 10−13pfam13884Peptidase_S74cl16452
59specific404724248–3042.58 × 10−12pfam13884Peptidase_S74cl16452
63specific2245849–1346.86 × 10−4COG1670RimLcl34333
65specific23884610–1815.36 × 10−24cd01713PAPS_reductasecl00292
68superfamily180240299–4009.02 × 10−7cl32090PRK05759 superfamily-
69superfamily2269931810–26776.59 × 10−99cl18793COG4646 superfamily
69specific4086274195–44011.56 × 10−36pfam18857LPD38cl40138
69specific4085693170–32709.95 × 10−19pfam18798LPD3cl40093
69specific38159480–1927.10 × 10−14cd00254LT-likecl00222
69specific2238971537–17833.77 × 10−11COG0827YtxKcl28092
69superfamily2371711358–15003.31 × 10−7cl36163PRK12678 superfamily-
69superfamily2236272412–28682.48 × 10−5cl33945HepA superfamily -
69superfamily2353341071–12871.59 × 10−3cl35279PRK05035 superfamily-
72specific40648124–1033.77 × 10−16pfam16083Phage_holin_3_3cl24062
74superfamily2264392–1862.17 × 10−28cl34694ZliS superfamily -
75superfamily41985454–1632.39 × 10−10cl22701Phage_lysis superfamily-
Table 6. Proteins determined to be virion-associated by proteomic analysis of CsCl-purified JC1 virions.
ProteinScoreCoverageUnique Peptides (#)Putative Function
gp48298.4456.0427Major capsid protein
gp6988.9215.6151DarB-like antirestriction protein
gp4982.9250.326Virion-associated protein
gp6445.9445.189Hypothetical protein
gp5330.6358.995Virion-associated protein
gp6827.4617.069Hypothetical Protein
gp4525.8522.2214Portal protein
gp5622.8841.147Tail fiber protein
gp5219.4746.418Hypothetical protein
gp6116.0111.216Virion-associated phage protein
gp1013.421.565Hypothetical protein
gp5513.1648.914Virion-associated phage protein
gp5112.9725.585Hypothetical protein
gp679.3542.867Virion-associated phage protein
gp464.1413.824Hypothetical protein
gp472.6118.751Carbon storage regulator
Publisher’s Note: MDPI stays neutral with regard to jurisdictional claims in published maps and institutional affiliations.

