
Identifying Country-Level Risk Factors for the Spread of COVID-19 in Europe Using Machine Learning

 ,
,  , , ,
, , ,
Abstract
:1. Introduction
2. Materials and Methods
2.1. Dataset
2.1.1. Data Sources
2.1.2. Feature Extraction
2.2. Proposed Methodolgy
2.2.1. Data Pre-Processing
2.2.2. Feature Exploration
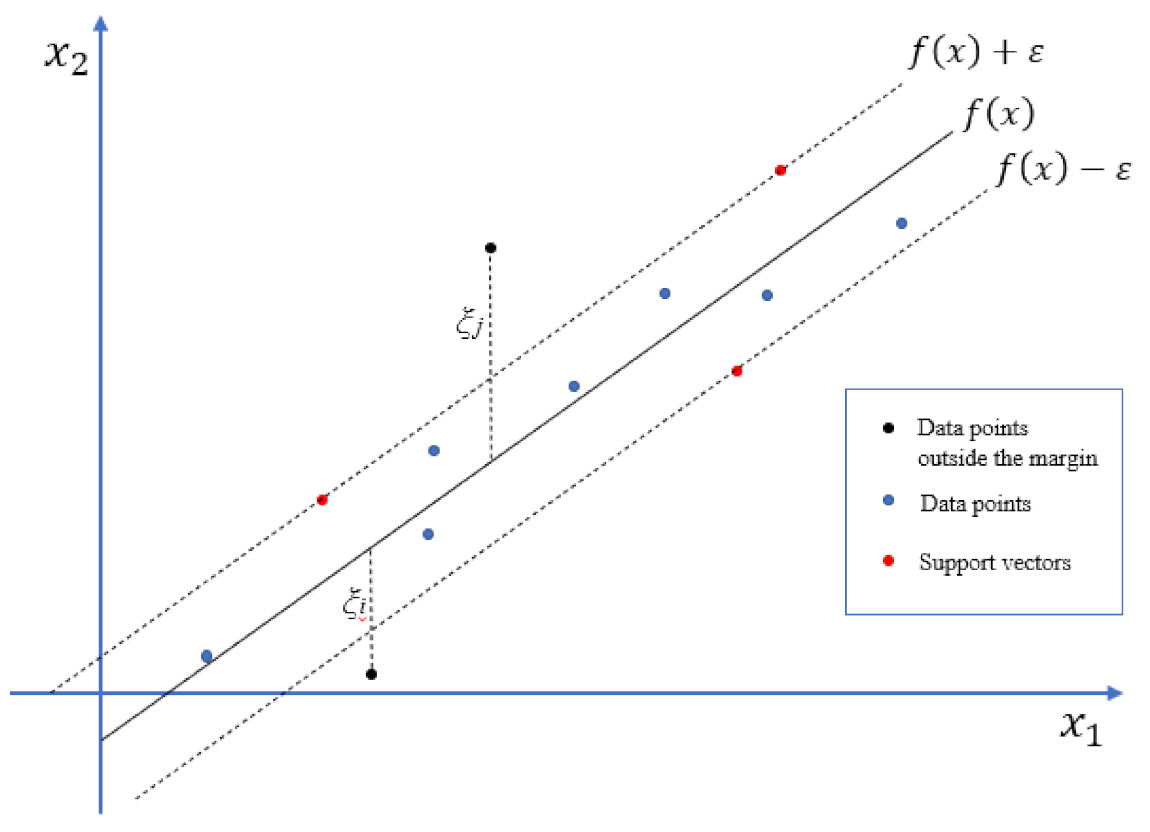
2.2.3. Regression
2.3. Validation and Explainability
3. Results
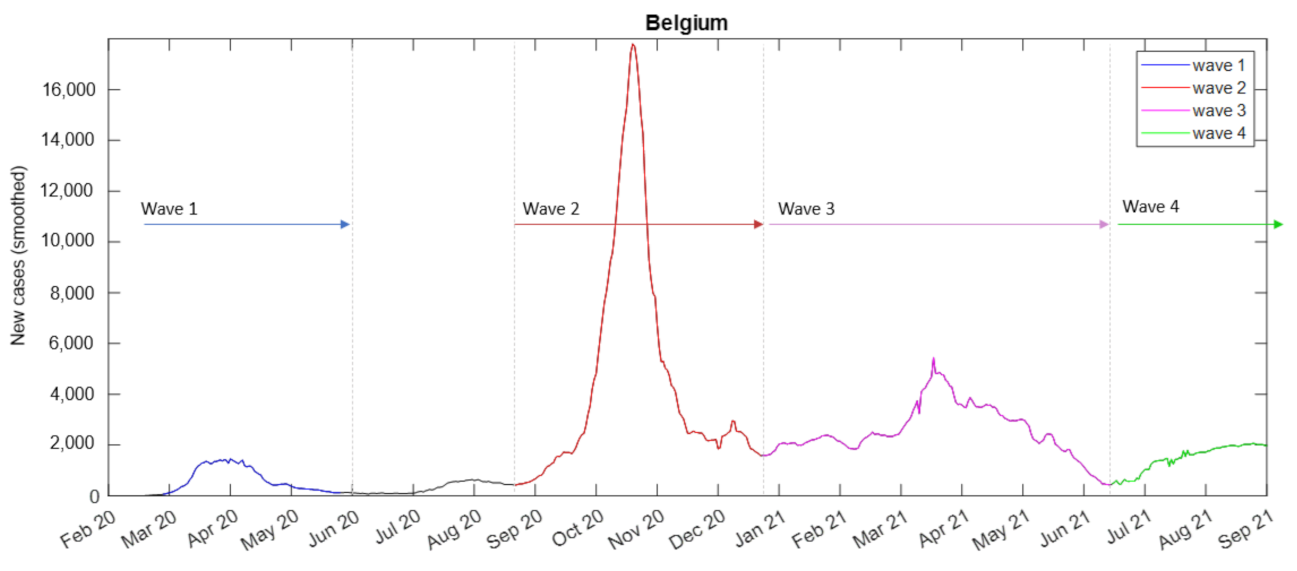
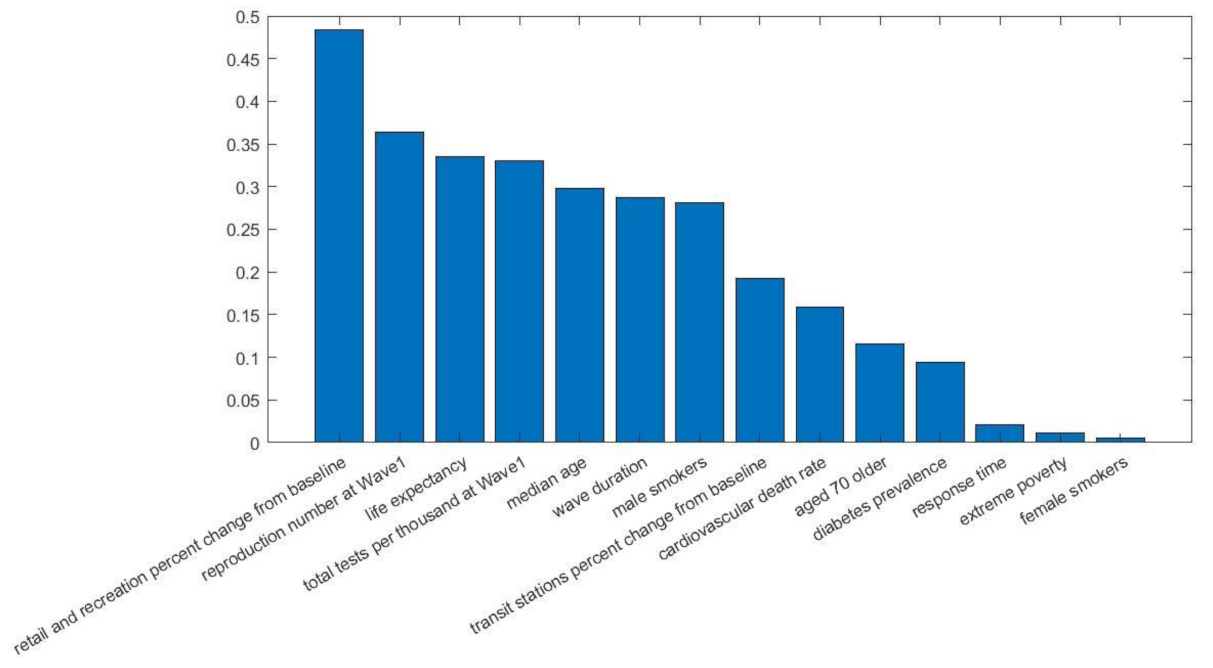
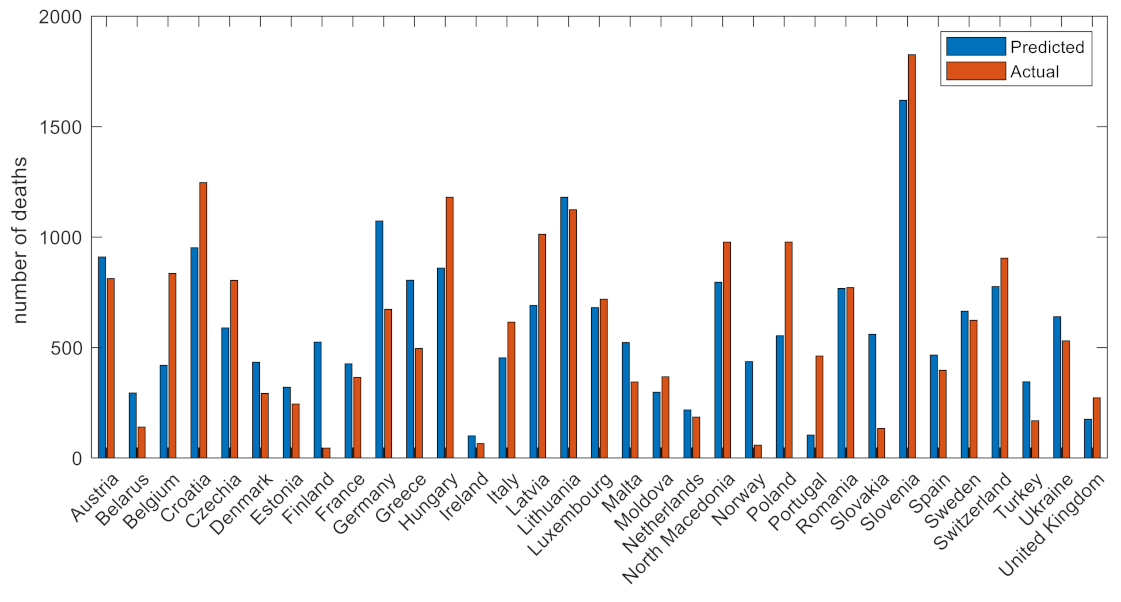
3.1. Wave 1
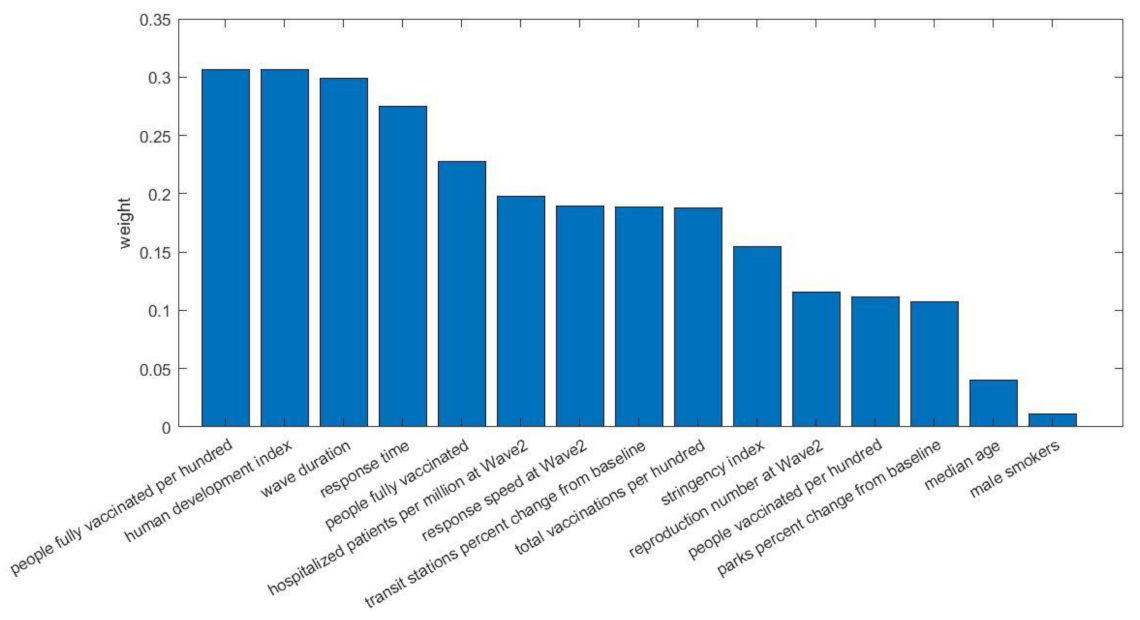
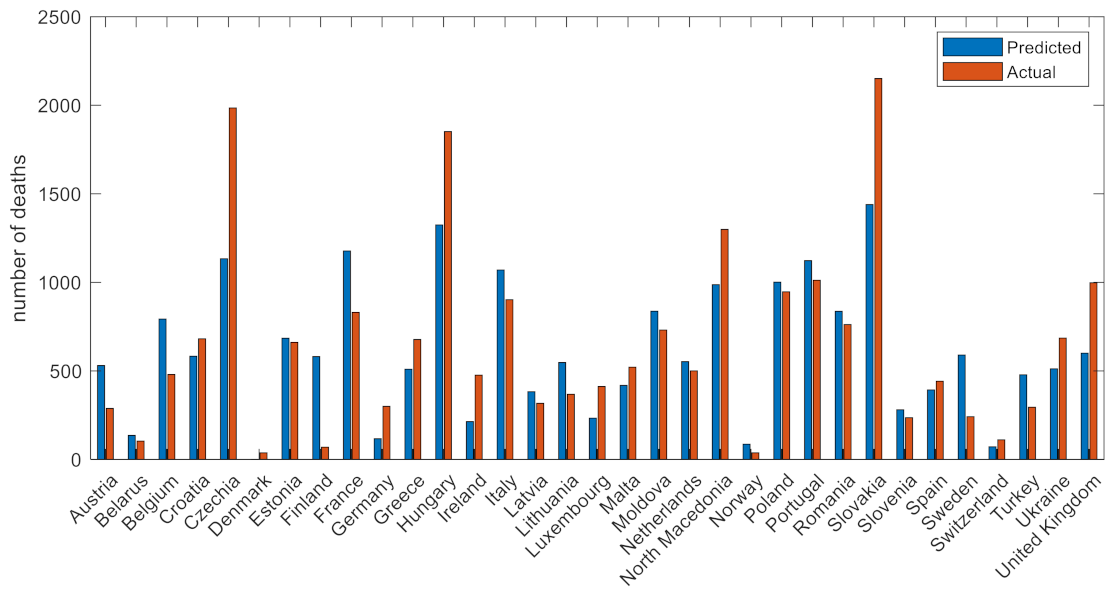
3.2. Wave 2
3.3. Wave 3
4. Discussion
Author Contributions
Funding
Institutional Review Board Statement
Informed Consent Statement
Data Availability Statement
Conflicts of Interest
References
- Rauf, A.; Abu-Izneid, T.; Olatunde, A.; Ahmed Khalil, A.; Alhumaydhi, F.A.; Tufail, T.; Shariati, M.A.; Rebezov, M.; Almarhoon, Z.M.; Mabkhot, Y.N.; et al. COVID-19 Pandemic: Epidemiology, Etiology, Conventional and Non-Conventional Therapies. Int. J. Environ. Res. Public Health 2020, 17, 8155. [Google Scholar] [CrossRef] [PubMed]
- Sun, Y.; Koh, V.; Marimuthu, K.; Ng, O.T.; Young, B.; Vasoo, S.; Chan, M.; Lee, V.J.M.; De, P.P.; Barkham, T.; et al. Epidemiological and Clinical Predictors of COVID-19. Clin. Infect. Dis. 2020, 71, 786–792. [Google Scholar] [CrossRef] [PubMed] [Green Version]
- Chakraborty, I.; Maity, P. COVID-19 outbreak: Migration, effects on society, global environment and prevention. Sci. Total Environ. 2020, 728, 138882. [Google Scholar] [CrossRef] [PubMed]
- McKibbin, W.; Fernando, R. The economic impact of COVID-19. Econ. Time COVID-19 2020, 45–51. [Google Scholar]
- Khan, K.S.; Mamun, M.A.; Griffiths, M.D.; Ullah, I. The Mental Health Impact of the COVID-19 Pandemic Across Different Cohorts. Int. J. Ment. Health Addict. 2020, 20, 380–386. [Google Scholar] [CrossRef] [PubMed]
- Williamson, E.J.; Walker, A.J.; Bhaskaran, K.; Bacon, S.; Bates, C.; Morton, C.E.; Curtis, H.J.; Mehrkar, A.; Evans, D.; Inglesby, P.; et al. OpenSAFELY: Factors associated with COVID-19 death in 17 million patients. Nature 2020, 584, 430. [Google Scholar] [CrossRef] [PubMed]
- Maringe, C.; Spicer, J.; Morris, M.; Purushotham, A.; Nolte, E.; Sullivan, R.; Rachet, B.; Aggarwal, A. The impact of the COVID-19 pandemic on cancer deaths due to delays in diagnosis in England, UK: A national, population-based, modelling study. Lancet Oncol. 2020, 21, 1023–1034. [Google Scholar] [CrossRef]
- Santosh, K.C. AI-Driven Tools for Coronavirus Outbreak: Need of Active Learning and Cross-Population Train/Test Models on Multitudinal/Multimodal Data. J. Med. Syst. 2020, 44, 93. [Google Scholar] [CrossRef] [PubMed] [Green Version]
- Allam, Z.; Dey, G.; Jones, D.S. Artificial Intelligence (AI) Provided Early Detection of the Coronavirus (COVID-19) in China and Will Influence Future Urban Health Policy Internationally. AI 2020, 1, 156–165. [Google Scholar] [CrossRef] [Green Version]
- Gozes, O.; Frid-Adar, M.; Greenspan, H.; Browning, P.D.; Zhang, H.; Ji, W.; Bernheim, A.; Siegel, E. Rapid ai development cycle for the coronavirus (COVID-19) pandemic: Initial results for automated detection & patient monitoring using deep learning ct image analysis. arXiv 2020, arXiv:2003.05037. [Google Scholar]
- Allam, Z.; Jones, D.S. On the Coronavirus (COVID-19) Outbreak and the Smart City Network: Universal Data Sharing Standards Coupled with Artificial Intelligence (AI) to Benefit Urban Health Monitoring and Management. Healthcare 2020, 8, 46. [Google Scholar] [CrossRef] [PubMed] [Green Version]
- Naseem, M.; Akhund, R.; Arshad, H.; Ibrahim, M.T. Exploring the Potential of Artificial Intelligence and Machine Learning to Combat COVID-19 and Existing Opportunities for LMIC: A Scoping Review. J. Prim. Care Community Health 2020, 11, 2150132720963634. [Google Scholar] [CrossRef] [PubMed]
- Debnath, S.; Barnaby, D.P.; Coppa, K.; Makhnevich, A.; Kim, E.J.; Chatterjee, S.; Tóth, V.; Levy, T.J.; Paradis, M.D.; Cohen, S.L.; et al. Machine learning to assist clinical decision-making during the COVID-19 pandemic. Bioelectron. Med. 2020, 6, 14. [Google Scholar] [CrossRef] [PubMed]
- Joshi, A.; Dey, N.; Santosh, K. Intelligent Systems and Methods to Combat COVID-19; Springer: Singapore, 2020. [Google Scholar]
- Kolozsvári, L.R.; Bérczes, T.; Hajdu, A.; Gesztelyi, R.; Tiba, A.; Varga, I.; Ala’a, B.; Szőllősi, G.J.; Harsányi, S.; Garbóczy, S.; et al. Predicting the epidemic curve of the coronavirus (SARS-CoV-2) disease (COVID-19) using artificial intelligence: An application on the first and second waves. Inform. Med. Unlocked 2021, 25, 100691. [Google Scholar] [CrossRef] [PubMed]
- Muhammad, L.J.; Islam, M.; Usman, S.S.; Ayon, S.I. Predictive Data Mining Models for Novel Coronavirus (COVID-19) Infected Patients’ Recovery. SN Comput. Sci. 2020, 1, 206. [Google Scholar] [CrossRef] [PubMed]
- Ayyoubzadeh, S.M.; Zahedi, H.; Ahmadi, M.; Kalhori, S.R.N. Predicting COVID-19 Incidence Through Analysis of Google Trends Data in Iran: Data Mining and Deep Learning Pilot Study. JMIR Public Health Surveill. 2020, 6, e18828. [Google Scholar] [CrossRef] [PubMed]
- Goodman-Meza, D.; Rudas, A.; Chiang, J.N.; Adamson, P.C.; Ebinger, J.; Sun, N.; Botting, P.; Fulcher, J.A.; Saab, F.G.; Brook, R.; et al. A machine learning algorithm to increase COVID-19 inpatient diagnostic capacity. PLoS ONE 2020, 15, e0239474. [Google Scholar] [CrossRef] [PubMed]
- Prakash, K.B. Analysis, Prediction and Evaluation of COVID-19 Datasets using Machine Learning Algorithms. Int. J. Emerg. Trends Eng. Res. 2020, 8, 2199–2204. [Google Scholar] [CrossRef]
- Malki, Z.; Atlam, E.-S.; Hassanien, A.E.; Dagnew, G.; Elhosseini, M.A.; Gad, I. Association between weather data and COVID-19 pandemic predicting mortality rate: Machine learning approaches. Chaos Solitons Fractals 2020, 138, 110137. [Google Scholar] [CrossRef]
- Bastani, H.; Drakopoulos, K.; Gupta, V.; Vlachogiannis, I.; Hadjicristodoulou, C.; Lagiou, P.; Magiorkinis, G.; Paraskevis, D.; Tsiodras, S. Efficient and targeted COVID-19 border testing via reinforcement learning. Nature 2021, 599, 108–113. [Google Scholar] [CrossRef]
- Obermeyer, Z. A machine-learning algorithm to target COVID testing of travellers. Nature 2021, 599, 34–36. [Google Scholar] [CrossRef] [PubMed]
- Mathieu, E.; Ritchie, H.; Ortiz-Ospina, E.; Roser, M.; Hasell, J.; Appel, C.; Giattino, C.; Rodés-Guirao, L. A global database of COVID-19 vaccinations. Nat. Hum. Behav. 2021, 5, 947–953. [Google Scholar] [CrossRef] [PubMed]
- Hasell, J.; Mathieu, E.; Beltekian, D.; Macdonald, B.; Giattino, C.; Ortiz-Ospina, E.; Roser, M.; Ritchie, H. A cross-country database of COVID-19 testing. Sci. Data 2020, 7, 1–7. [Google Scholar] [CrossRef] [PubMed]
- Rahman, M.M.; Davis, D.N. Machine learning-based missing value imputation method for clinical datasets. In IAENG Transactions on Engineering Technologies; Springer: Dordrecht, The Netherlands, 2013; pp. 245–257. [Google Scholar]
- Shahriyari, L. Effect of normalization methods on the performance of supervised learning algorithms applied to HTSeq-FPKM-UQ data sets: 7SK RNA expression as a predictor of survival in patients with colon adenocarcinoma. Brief. Bioinform. 2019, 20, 985–994. [Google Scholar] [CrossRef] [PubMed]
- Subasi, O.; Di, S.; Bautista-Gomez, L.; Balaprakash, P.; Unsal, O.; Labarta, J.; Cristal, A.; Krishnamoorthy, S.; Cappello, F. Exploring the capabilities of support vector machines in detecting silent data corruptions. Sustain. Comput. Inform. Syst. 2018, 19, 277–290. [Google Scholar] [CrossRef] [Green Version]
- Steinwart, I.; Christmann, A. Sparsity of SVMs that use the epsilon-insensitive loss. Adv. Neural Inf. Processing Syst. 2008, 21, 1569–1576. [Google Scholar]
- Molnar, C. Interpretable Machine Learning; Lulu. com: Morrisville, NC, USA, 2020. [Google Scholar]
- Jabłońska, K.; Aballéa, S.; Toumi, M. The real-life impact of vaccination on COVID-19 mortality in Europe and Israel. Public Health 2021, 198, 230–237. [Google Scholar] [CrossRef]
- Ratto, M.C.; Cabrera, J.M.; Zacharías, D.; Azerrat, J.M. The effectiveness of government measures during the first wave of the outbreak. Soc. Sci. Q. 2021, 102, 2088–2105. [Google Scholar] [CrossRef]
- Sypsa, V.; Roussos, S.; Paraskevis, D.; Lytras, T.; Tsiodras, S.; Hatzakis, A. Effects of Social Distancing Measures during the First Epidemic Wave of Severe Acute Respiratory Syndrome Infection, Greece. Emerg. Infect. Dis. 2021, 27, 452–462. [Google Scholar] [CrossRef] [PubMed]
- Bhaskaran, K.; Bacon, S.; Evans, S.J.; Bates, C.J.; Rentsch, C.T.; MacKenna, B.; Tomlinson, L.; Walker, A.J.; Schultze, A.; Morton, C.E.; et al. Factors associated with deaths due to COVID-19 versus other causes: Population-based cohort analysis of UK primary care data and linked national death registrations within the OpenSAFELY platform. Lancet Reg. Health-Eur. 2021, 6, 100109. [Google Scholar] [CrossRef]
- Marois, G.; Muttarak, R.; Scherbov, S. Assessing the potential impact of COVID-19 on life expectancy. PLoS ONE 2020, 15, e0238678. [Google Scholar] [CrossRef] [PubMed]
- Keeling, M.J.; Hollingsworth, T.D.; Read, J.M. Efficacy of contact tracing for the containment of the 2019 novel coronavirus (COVID-19). J. Epidemiol. Community Health 2020, 74, 861–866. [Google Scholar] [CrossRef] [PubMed]
- Anderson, R.M.; Heesterbeek, H.; Klinkenberg, D.; Hollingsworth, T.D. How will country-based mitigation measures influence the course of the COVID-19 epidemic? Lancet 2020, 395, 931–934. [Google Scholar] [CrossRef]
- Mattiuzzi, C.; Lippi, G. Primary COVID-19 vaccine cycle and booster doses efficacy: Analysis of Italian nationwide vaccination campaign. Eur. J. Public Health 2022. [Google Scholar] [CrossRef] [PubMed]
- Arbel, R.; Moore, C.M.; Sergienko, R.; Pliskin, J. How many lives do COVID vaccines save? Evidence from Israel. Am. J. Infect. Control 2021, 50, 258–261. [Google Scholar] [CrossRef] [PubMed]
- Ritchie, H.; Mathieu, E.; Rodés-Guirao, L.; Appel, C.; Giattino, C.; Ortiz-Ospina, E.; Beltekian, D.; Hasell, J.; Macdonald, B.; Roser, M. Coronavirus Pandemic (COVID-19). Our World in Data. 2020. Available online: https://ourworldindata.org/covid-vaccinations?country=OWID_WRL (accessed on 8 October 2021).
- Google LLC “Google COVID-19 Community Mobility Reports”. Available online: https://www.google.com/covid19/mobility/ (accessed on 8 October 2021).


| Category | Description |
|---|---|
| Confirmed cases | Demonstrates the new or total confirmed cases of SARS-CoV-2 (F33 in Table 2) |
| Confirmed deaths | Describes the COVID-19-related deaths (F34 and F40) |
| Hospital and intensive care units (ICU) | Describes variables which consists of data about the patients in hospital and the patients in intensive care units (F36 and F37) |
| Policy responses | Government Response Stringency Index, which is composite measure based on 9 response indicators (0 to 100, 100 = strictest response) (F7 and F8) |
| Reproduction number | Real-time estimate of the effective reproduction number (R) of COVID-19 (F35) |
| Tests and positivity | Consists of variables which demonstrate information about the total number of tests per 1000, new tests per 1000, and the tests that are positive given as a rolling 7-day average (F38–39) |
| Vaccinations | Information about the vaccination doses and the booster doses that have been administered (F9–17) |
| Mobility | Includes mobility trends for places such as markets, drug stores, public areas, transport hubs, retail, recreation, places of residence, and workplaces (F1–6) |
| Generic | Includes variables that describe demographic data and data that occur from the quality of life (F18–32) |
| # | Category | Description | Current Wave | Previous Wave | |
|---|---|---|---|---|---|
| F1 | Mobility | Grocery and pharmacy percent change from baseline | Mean | ✔ | |
| F2 | Parks percent change from baseline | ✔ | |||
| F3 | Residential percent change from baseline | ✔ | |||
| F4 | Retail and recreation percent change from baseline | ✔ | |||
| F5 | Transit stations percent change from baseline | ✔ | |||
| F6 | Workplaces percent change from baseline | ✔ | |||
| F7 | Policy responses | Stringency index | ✔ | ✔ | |
| F8 | Response time | See (1) | ✔ | ✔ | |
| F9 | Vaccinations | Total vaccinations (cumulative) | Last valid | ✔ | |
| F10 | People vaccinated (cumulative) | ✔ | |||
| F11 | People fully vaccinated (cumulative) | ✔ | |||
| F12 | New vaccinations | Mean | ✔ | ||
| F13 | New vaccinations smoothed | ✔ | |||
| F14 | Total vaccinations per hundred (cumulative) | Last valid | ✔ | ✔ | |
| F15 | People vaccinated per hundred (cumulative) | ✔ | ✔ | ||
| F16 | People fully vaccinated per hundred (cumulative) | ✔ | ✔ | ||
| F17 | New vaccinations (smoothed) per million | Mean | ✔ | ||
| F18 | Demographics | Population | Mean | ✔ | |
| F19 | Population density | ✔ | |||
| F20 | Median age | ✔ | |||
| F21 | Aged 65 older | ✔ | |||
| F22 | Aged 70 older | ✔ | |||
| F23 | GDP per capita | ✔ | |||
| F24 | Extreme poverty | ✔ | |||
| F25 | Cardiovasc death rate | ✔ | |||
| F26 | Diabetes prevalence | ✔ | |||
| F27 | Female smokers | ✔ | |||
| F28 | Male smokers | ✔ | |||
| F29 | Handwashing facilities | ✔ | |||
| F30 | Hospital beds per thousand | ✔ | |||
| F31 | Life expectancy | ✔ | |||
| F32 | Human development index | ✔ | |||
| F33 | Cases, deaths, hospitalizations, and positivity | Total cases per million | Last valid | ✔ | |
| F34 | Total deaths per million | ✔ | |||
| F35 | Reproduction number | Mean | ✔ | ||
| F36 | ICU patients per million (cumulative) | Last valid | ✔ | ||
| F37 | Hospitalized patients per million (cumulative) | ✔ | |||
| F38 | Total tests per thousand (cumulative) | ✔ | |||
| F39 | Positive rate given as a rolling 7-day average | Mean | ✔ | ||
| F40 | Total deaths per million in the wave (cumulative) | Last valid | ✔ |
| Metric | Wave 1 | Wave 2 | Wave 3 |
|---|---|---|---|
| Mean square error 1 | 0.02707 | 0.01829 | 0.01913 |
Publisher’s Note: MDPI stays neutral with regard to jurisdictional claims in published maps and institutional affiliations. |
© 2022 by the authors. Licensee MDPI, Basel, Switzerland. This article is an open access article distributed under the terms and conditions of the Creative Commons Attribution (CC BY) license (https://creativecommons.org/licenses/by/4.0/).
Share and Cite
Moustakidis, S.; Kokkotis, C.; Tsaopoulos, D.; Sfikakis, P.; Tsiodras, S.; Sypsa, V.; Zaoutis, T.E.; Paraskevis, D. Identifying Country-Level Risk Factors for the Spread of COVID-19 in Europe Using Machine Learning. Viruses 2022, 14, 625. https://doi.org/10.3390/v14030625
Moustakidis S, Kokkotis C, Tsaopoulos D, Sfikakis P, Tsiodras S, Sypsa V, Zaoutis TE, Paraskevis D. Identifying Country-Level Risk Factors for the Spread of COVID-19 in Europe Using Machine Learning. Viruses. 2022; 14(3):625. https://doi.org/10.3390/v14030625
Chicago/Turabian StyleMoustakidis, Serafeim, Christos Kokkotis, Dimitrios Tsaopoulos, Petros Sfikakis, Sotirios Tsiodras, Vana Sypsa, Theoklis E. Zaoutis, and Dimitrios Paraskevis. 2022. "Identifying Country-Level Risk Factors for the Spread of COVID-19 in Europe Using Machine Learning" Viruses 14, no. 3: 625. https://doi.org/10.3390/v14030625