
A Comparative Systematic Review of COVID-19 and Influenza

 , and
, and
Abstract
:1. Introduction
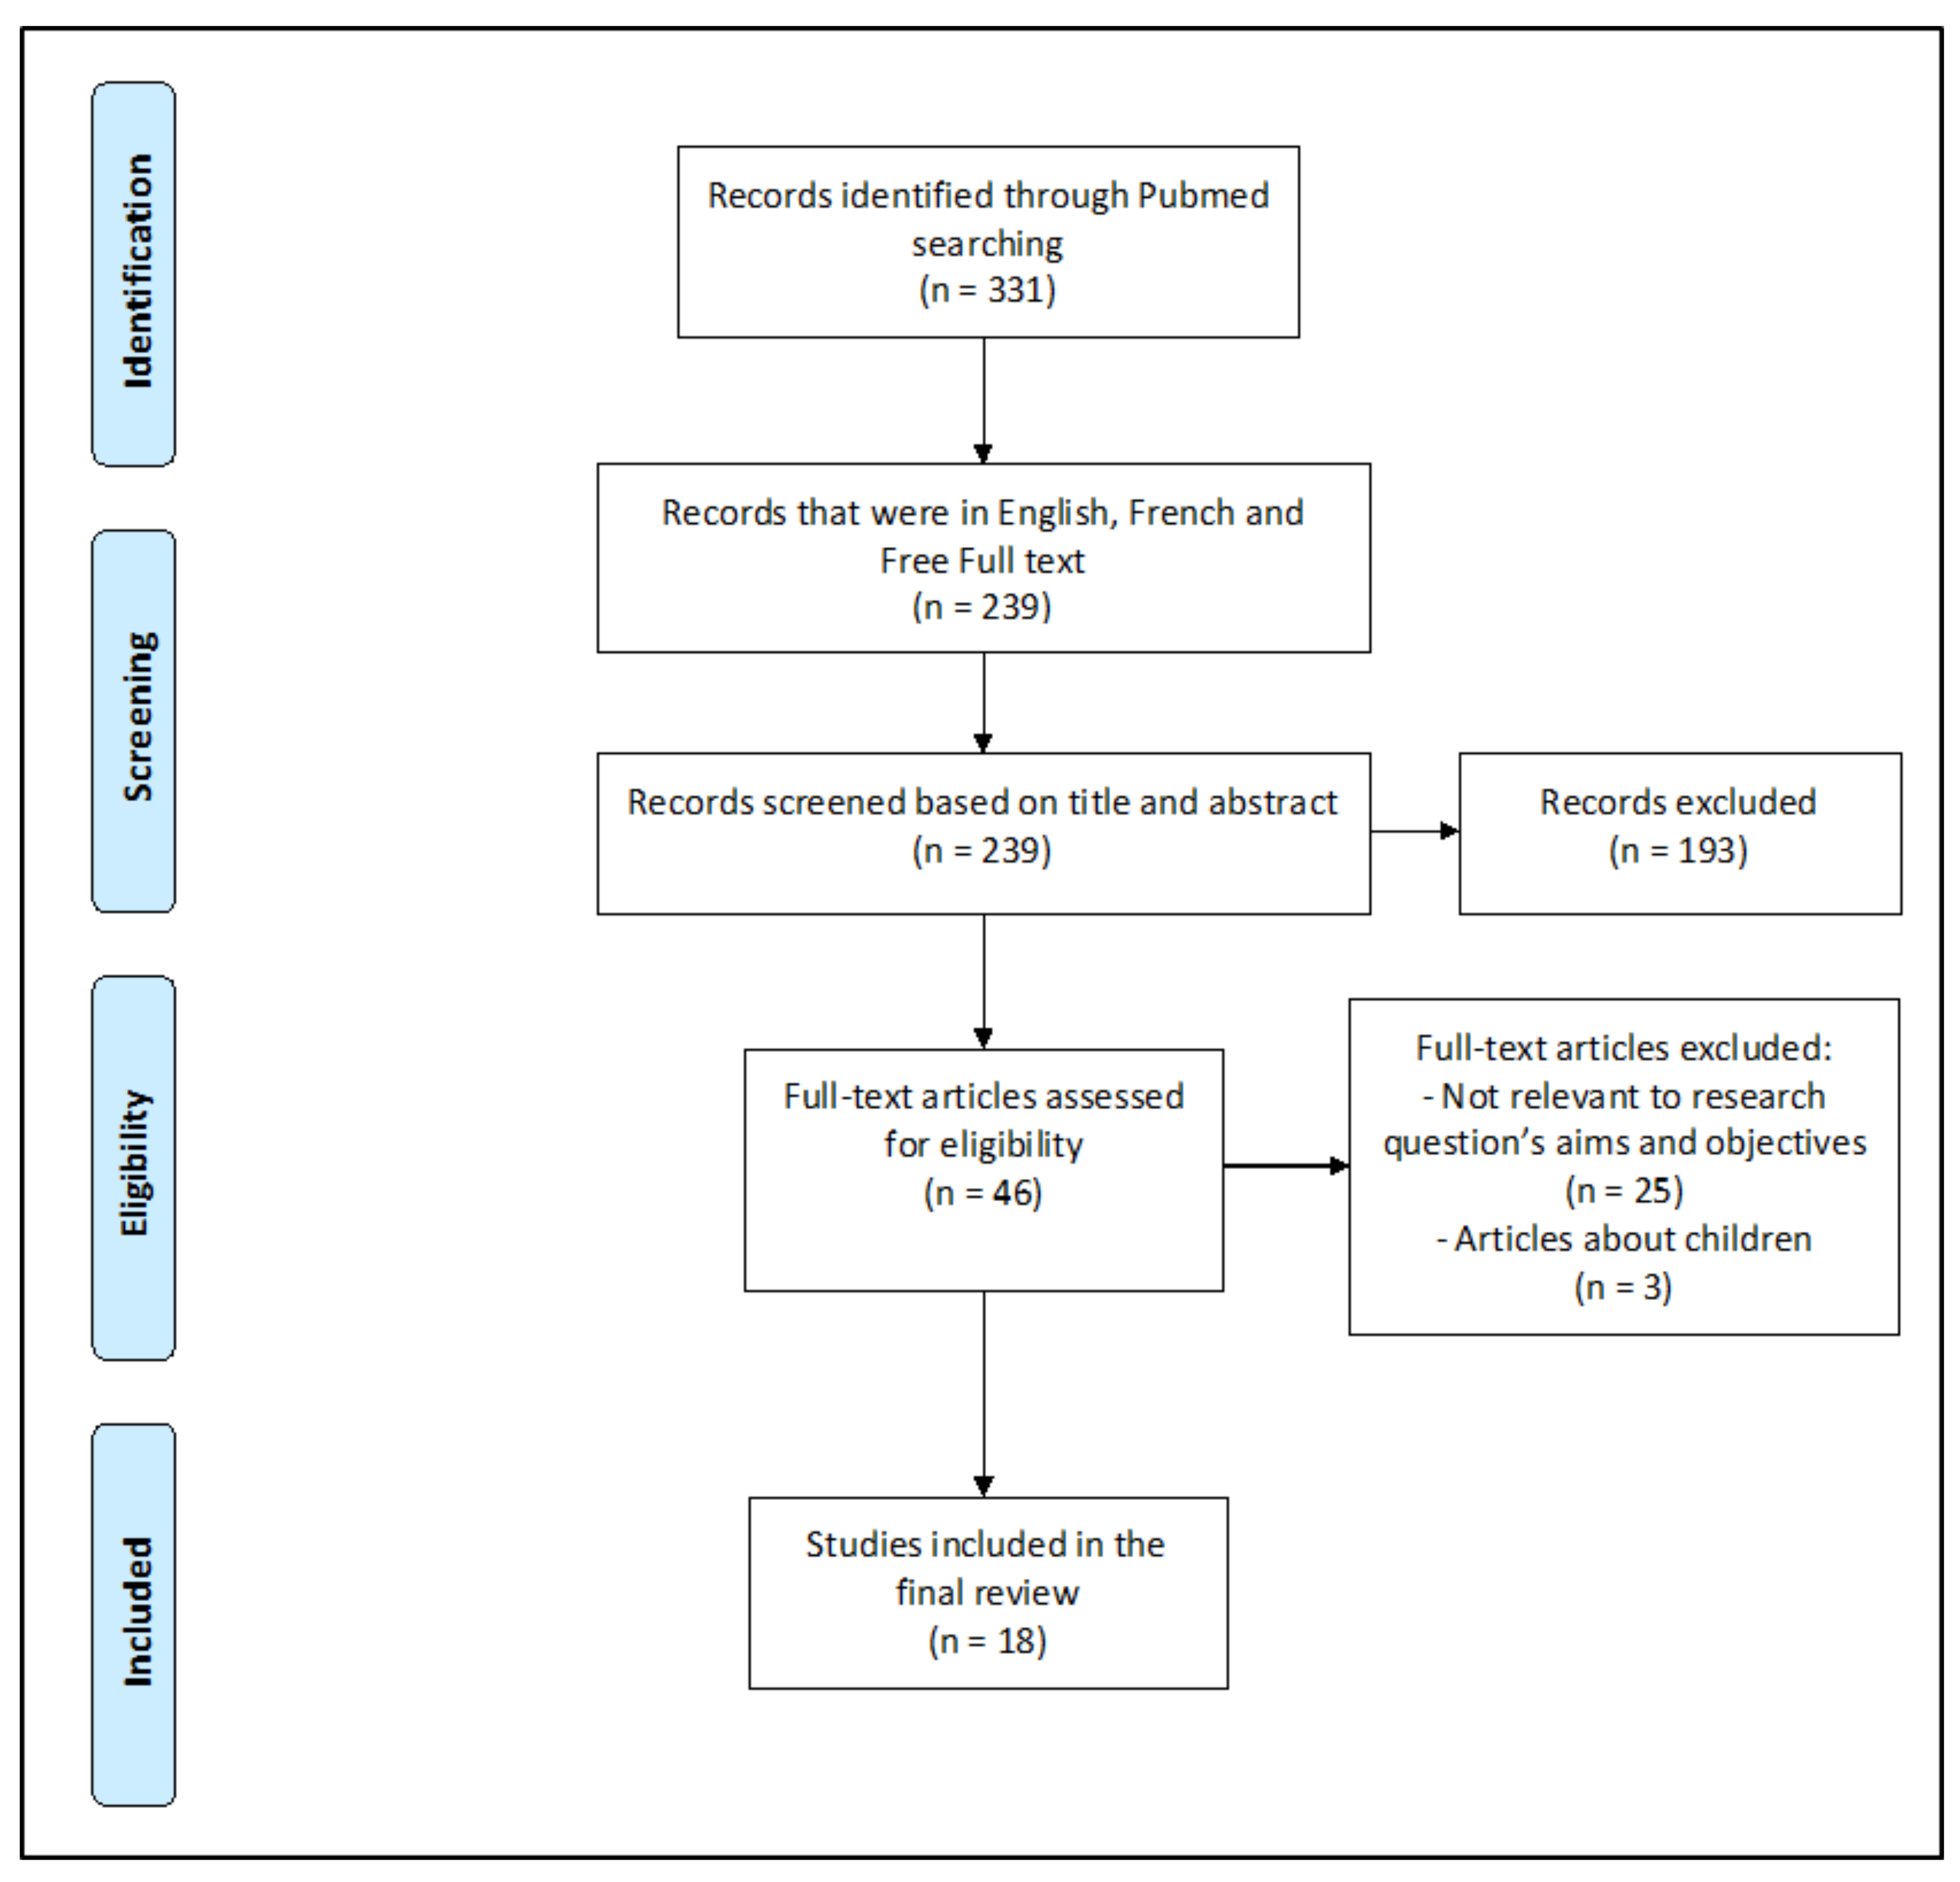
2. Methods
3. Results
3.1. Included Citations in the COVID-19 vs. Influenza Review
3.2. Studies in Patients with COVID-19 and Influenza
3.2.1. Demographic and Clinical Findings
3.2.2. Laboratory Findings
3.2.3. Radiological Findings
4. Discussion
5. Conclusions
Author Contributions
Funding
Institutional Review Board Statement
Informed Consent Statement
Data Availability Statement
Conflicts of Interest
References
- Zhu, N.; Zhang, D.; Wang, W.; Li, X.; Yang, B.; Song, J.; Zhao, X.; Huang, B.; Shi, W.; Lu, R.; et al. A Novel Coronavirus from Patients with Pneumonia in China, 2019. N. Engl. J. Med. 2020, 382, 727–733. [Google Scholar] [CrossRef]
- Khan, M.S.; Shahid, I.; Anker, S.D.; Solomon, S.D.; Vardeny, O.; Michos, E.D.; Fonarow, G.C.; Butler, J. Cardiovascular implications of COVID-19 versus influenza infection: A review. BMC Med. 2020, 18, 403. [Google Scholar] [CrossRef]
- Onigbinde, S.O.; Ojo, A.S.; Fleary, L.; Hage, R. Chest Computed Tomography Findings in COVID-19 and Influenza: A Narrative Review. Biomed Res. Int. 2020, 2020, 6928368. [Google Scholar] [CrossRef]
- WHO. Up to 650 000 People Die of Respiratory Diseases Linked to Seasonal Flu Each Year. Available online: https://www.who.int/news/item/13-12-2017-up-to-650-000-people-die-of-respiratory-diseases-linked-to-seasonal-flu-each-year (accessed on 15 January 2021).
- Li, P.; Wang, Y.; Peppelenbosch, M.P.; Ma, Z.; Pan, Q. Systematically comparing COVID-19 with 2009 influenza pandemic for hospitalized patients. Int. J. Infect. Dis. 2020, 102, 375–380. [Google Scholar] [CrossRef]
- Cates, J.; Lucero-Obusan, C.; Dahl, R.M.; Schirmer, P.; Garg, S.; Oda, G.; Hall, A.J.; Langley, G.; Havers, F.P.; Holodniy, M.; et al. Risk for In-Hospital Complications Associated with COVID-19 and Influenza—Veterans Health Administration, United States, October 1, 2018–May 31, 2020. Morb. Mortal. Wkly. Rep. 2020, 69, 1528–1534. [Google Scholar] [CrossRef]
- Luo, Y.; Yuan, X.; Xue, Y.; Mao, L.; Lin, Q.; Tang, G.; Song, H.; Liu, W.; Hou, H.; Wang, F.; et al. Using a diagnostic model based on routine laboratory tests to distinguish patients infected with SARS-CoV-2 from those infected with influenza virus. Int. J. Infect. Dis. 2020, 95, 436–440. [Google Scholar] [CrossRef]
- Chen, J.; Pan, Y.; Li, G.; Xu, W.; Zhang, L.; Yuan, S.; Xia, Y.; Lu, P.; Zhang, J. Distinguishing between COVID-19 and influenza during the early stages by measurement of peripheral blood parameters. J. Med. Virol. 2020. [Google Scholar] [CrossRef] [PubMed]
- Qu, J.; Chang, L.K.; Tang, X.; Du, Y.; Yang, X.; Liu, X.; Han, P.; Xue, Y. Clinical characteristics of COVID-19 and its comparison with influenza pneumonia. Acta Clin. Belg. Int. J. Clin. Lab. Med. 2020, 75, 348–356. [Google Scholar] [CrossRef] [PubMed]
- Zhang, J.J.; Ding, D.; Huang, X.; Zhang, J.J.; Chen, D.; Fu, P.; Shi, Y.; Xu, W.; Tao, Z. Differentiation of COVID-19 from seasonal influenza: A multicenter comparative study. J. Med. Virol. 2020. [Google Scholar] [CrossRef] [PubMed]
- Faury, H.; Courboulès, C.; Payen, M.; Jary, A.; Hausfater, P.; Luyt, C.E.; Dres, M.; Pourcher, V.; Abdi, B.; Wirden, M.; et al. Medical Features of COVID-19 and Influenza Infection: A Comparative Study in Paris, France. J. Infect. 2020, 82, E36–E39. [Google Scholar] [CrossRef] [PubMed]
- Liu, M.; Zeng, W.; Wen, Y.; Zheng, Y.; Lv, F.; Xiao, K. COVID-19 pneumonia: CT findings of 122 patients and differentiation from influenza pneumonia. Eur. Radiol. 2020, 30, 5463–5469. [Google Scholar] [CrossRef] [PubMed]
- Tang, X.; Du, R.H.; Wang, R.; Cao, T.Z.; Guan, L.L.; Yang, C.Q.; Zhu, Q.; Hu, M.; Li, X.Y.; Li, Y.; et al. Comparison of Hospitalized Patients with ARDS Caused by COVID-19 and H1N1. Chest 2020, 158, 195–205. [Google Scholar] [CrossRef]
- Cobb, N.L.; Sathe, N.A.; Duan, K.I.; Seitz, K.P.; Thau, M.R.; Sung, C.C.; Morrell, E.D.; Mikacenic, C.; Kim, H.N.; Liles, W.C.; et al. Comparison of Clinical Features and Outcomes in Critically Ill Patients Hospitalized with COVID-19 versus Influenza. Ann. Am. Thorac. Soc. 2020. [Google Scholar] [CrossRef] [PubMed]
- Zayet, S.; Kadiane-Oussou, N.J.; Lepiller, Q.; Zahra, H.; Royer, P.Y.; Toko, L.; Gendrin, V.; Klopfenstein, T. Clinical features of COVID-19 and influenza: A comparative study on Nord Franche-Comte cluster. Microbes Infect. 2020, 22, 481–488. [Google Scholar] [CrossRef]
- Wang, H.; Wei, R.; Rao, G.; Zhu, J.; Song, B. Characteristic CT findings distinguishing 2019 novel coronavirus disease (COVID-19) from influenza pneumonia. Eur. Radiol. 2020, 30, 4910–4917. [Google Scholar] [CrossRef]
- Lin, L.; Fu, G.; Chen, S.; Tao, J.; Qian, A.; Yang, Y.; Wang, M. CT Manifestations of Coronavirus Disease (COVID-19) Pneumonia and Influenza Virus Pneumonia: A Comparative Study. Am. J. Roentgenol. 2020, 216, 71–79. [Google Scholar] [CrossRef]
- Auvinen, R.; Nohynek, H.; Syrjänen, R.; Ollgren, J.; Kerttula, T.; Mäntylä, J.; Ikonen, N.; Loginov, R.; Haveri, A.; Kurkela, S.; et al. Comparison of the clinical characteristics and outcomes of hospitalized adult COVID-19 and influenza patients—A prospective observational study. Infect. Dis. 2020, 53, 111–121. [Google Scholar] [CrossRef]
- Yin, Z.; Kang, Z.; Yang, D.; Ding, S.; Luo, H.; Xiao, E. A Comparison of Clinical and Chest CT Findings in Patients with Influenza A (H1N1) Virus Infection and Coronavirus Disease (COVID-19). Am. J. Roentgenol. 2020, 215, 1065–1071. [Google Scholar] [CrossRef]
- Lin, Y.H.; Luo, W.; Wu, D.H.; Lu, F.; Hu, S.X.; Yao, X.Y.; Wang, Z.X.; Shi, Y.H. Comparison of clinical, laboratory, and radiological characteristics between SARS-CoV-2 infection and community-acquired pneumonia caused by influenza virus: A cross-sectional retrospective study. Medicine 2020, 99, e23064. [Google Scholar] [CrossRef]
- Lee, J.; Lee, Y.H.; Chang, H.H.; Choi, S.H.; Seo, H.; Yoo, S.S.; Lee, S.Y.; Cha, S.I.; Park, J.Y.; Kim, C.H. Comparison of Short-Term Mortality between Mechanically Ventilated Patients with COVID-19 and Influenza in a Setting of Sustainable Healthcare System. J. Infect. 2020, 81, e76–e78. [Google Scholar] [CrossRef]
- Kumlin, U.; Olofsson, S.; Dimock, K.; Arnberg, N. Sialic acid tissue distribution and influenza virus tropism. Influenza Other Respir. Viruses 2008, 2, 147–154. [Google Scholar] [CrossRef] [PubMed]
- Hamming, I.; Timens, W.; Bulthuis, M.; Lely, A.; Navis, G.; van Goor, H. Tissue distribution of ACE2 protein, the functional receptor for SARS coronavirus. A first step in understanding SARS pathogenesis. J. Pathol. 2004, 203, 631–637. [Google Scholar] [CrossRef]
- Rabi, F.A.; Al Zoubi, M.S.; Kasasbeh, G.A.; Salameh, D.M.; Al-Nasser, A.D. SARS-CoV-2 and Coronavirus Disease 2019: What We Know So Far. Pathogens 2020, 9, 231. [Google Scholar] [CrossRef]
- Xu, H.; Zhong, L.; Deng, J.; Peng, J.; Dan, H.; Zeng, X.; Li, T.; Chen, Q. High expression of ACE2 receptor of 2019-nCoV on the epithelial cells of oral mucosa. Int. J. Oral Sci. 2020, 12, 8. [Google Scholar] [CrossRef]
- Klopfenstein, T.; Zahra, H.; Kadiane-Oussou, N.J.; Lepiller, Q.; Royer, P.-Y.; Toko, L.; Gendrin, V.; Zayet, S. New loss of smell and taste: Uncommon symptoms in COVID-19 patients on Nord Franche-Comte cluster, France. Int. J. Infect. Dis. 2020, 100, 117–122. [Google Scholar] [CrossRef]
- Zayet, S.; Klopfenstein, T.; Mercier, J.; Kadiane-Oussou, N.J.; Lan Cheong Wah, L.; Royer, P.-Y.; Toko, L.; Gendrin, V. Contribution of anosmia and dysgeusia for diagnostic of COVID-19 in outpatients. Infection 2020. [Google Scholar] [CrossRef]
- Ji, Y.; Ma, Z.; Peppelenbosch, M.P.; Pan, Q. Potential association between COVID-19 mortality and health-care resource availability. Lancet Glob. Health 2020, 8, e480. [Google Scholar] [CrossRef] [Green Version]
- Słomka, A.; Kowalewski, M.; Żekanowska, E. Coronavirus Disease 2019 (COVID–19): A Short Review on Hematological Manifestations. Pathogens 2020, 9, 493. [Google Scholar] [CrossRef]
- Fathi, N.; Rezaei, N. Lymphopenia in COVID-19: Therapeutic opportunities. Cell Biol. Int. 2020, 44, 1792–1797. [Google Scholar] [CrossRef] [PubMed]
- Roberts, N.J. Diverse and Unexpected Roles of Human Monocytes/Macrophages in the Immune Response to Influenza Virus. Viruses 2020, 12, 379. [Google Scholar] [CrossRef] [Green Version]
- Xu, B.; Fan, C.; Wang, A.; Zou, Y.; Yu, Y.; He, C.; Xia, W.; Zhang, J.; Miao, Q. Suppressed T cell-mediated immunity in patients with COVID-19: A clinical retrospective study in Wuhan, China. J. Infect. 2020, 81, e51–e60. [Google Scholar] [CrossRef]
- Chowdhury, M.A.; Hossain, N.; Kashem, M.A.; Shahid, M.A.; Alam, A. Immune response in COVID-19: A review. J. Infect. Public Health 2020, 13, 1619–1629. [Google Scholar] [CrossRef]
- Bonam, S.R.; Kaveri, S.V.; Sakuntabhai, A.; Gilardin, L.; Bayry, J. Adjunct Immunotherapies for the Management of Severely Ill COVID-19 Patients. Cell Rep. Med. 2020, 1, 100016. Available online: https://www.cell.com/cell-reports-medicine/abstract/S2666-3791(20)30021-5 (accessed on 2 March 2021). [CrossRef]
- Cohen, S.L.; Gianos, E.; Barish, M.A.; Chatterjee, S.; Kohn, N.; Lesser, M.; Giannis, D.; Coppa, K.; Hirsch, J.; McGinn, T.; et al. Prevalence and Predictors of Venous Thromboembolism or Mortality in Hospitalized COVID-19 Patients. Thromb. Haemost. 2021. [Google Scholar] [CrossRef] [PubMed]
- Bai, H.X.; Hsieh, B.; Xiong, Z.; Halsey, K.; Choi, J.W.; Tran, T.M.L.; Pan, I.; Shi, L.-B.; Wang, D.-C.; Mei, J.; et al. Performance of Radiologists in Differentiating COVID-19 from Non-COVID-19 Viral Pneumonia at Chest CT. Radiology 2020, 296, E46–E54. [Google Scholar] [CrossRef]
- Zayet, S.; Klopfenstein, T.; Mezher, C.; Gendrin, V.; Conrozier, T.; Ben Abdallah, Y. Coronavirus disease 2019 with spontaneous pneumothorax, pneumomediastinum and subcutaneous emphysema, France. New Microbes New Infect. 2020, 38, 100785. [Google Scholar] [CrossRef]
- Shim, S.S.; Kim, Y.; Ryu, Y.J. Novel influenza A (H1N1) infection: Chest CT findings from 21 cases in Seoul, Korea. Clin. Radiol. 2011, 66, 118–124. [Google Scholar] [CrossRef]


| References | Country | Study Type ** | Number of Patients/Studies * (COVID-19 vs. Influenza) |
|---|---|---|---|
| Jordan Cates et al. [6] | United States | Cohort | 9401 (3948 vs. 5453) |
| Ying Luo et al. [7] | China (Hubei) | Cohort | 2167 (1027 vs. 1140) |
| Jiangnan Chen et al. [8] | China (Shaoxing) | Case-Control | 380 (169 vs. 131; 80 healthy controls) |
| Jiajia Qu et al. [9] | China | Retrospective Cohort | 366 (246 vs. 120) |
| Jianguo Zhang et al. [10] | China | Retrospective cohort | 326 (211 vs. 115) |
| Helene Faury et al. [11] | France (Paris) | Retrospective | 200 (100 vs. 100) |
| Pengfei Li et al. * [5] | - | Systematic review and Meta-analysis | 197 (113 vs. 84) |
| Mengqi Liu et al. [12] | China (Chongqing) | Retrospective | 180 (122 vs. 48) |
| Xiao Tang et al. [13] | China (Wuhan) | Retrospective case-control | 148 (73 vs. 75) |
| Natalie L. Cobb et al. [14] | United States (Washington) | Retrospective Cohort | 139 (65 vs. 74) |
| Souheil Zayet et al. [15] | France | Retrospective | 124 (70 vs. 54) |
| Hao Wang et al. [16] | China | Retrospective | 105 (13 vs. 92) |
| Liaoyi Lin et al. [17] | China (Wenzhou) | Retrospective | 97 (52 vs. 45) |
| Raija Auvinen et al. [18] | Finland | Prospective study | 61 (28 vs. 33) |
| Zhilan Yin et al. [19] | China | Retrospective | 60 (30 vs. 30) |
| Yi-Hua Lin et al. [20] | China (Xiamen) | A cross-sectional retrospective study | 57 (35 vs. 22) |
| Jaehee Lee et al. [21] | South Korea (Daegu) | Retrospective | 29 (20 vs. 09) |
| Stephen O. Onigbinde et al. * [3] | - | Review | 17 (09 vs. 08) |
| References | Significant Clinical Features/Outcome | COVID-19 (%) | Influenza (%) | p-Value < 0.05 |
|---|---|---|---|---|
| Jordan Cates et al. [6] | Admitted to ICU | 36.5 | 17.6 | <0.001 |
| Hospital mortality | 21 | 3.8 | <0.001 | |
| Duration of hospitalization (median days, [IQR]) | 8.6 [3.9–18.6] | 3.0 [1.8–6.5] | <0.001 | |
| Jiajia Qu et al. [9] | Fever | 78.5 | 89.2 | <0.05 |
| Persistent fever | 50.4 | 74.2 | <0.01 | |
| Jianguo Zhang et al. [10] | Cough | 69.7 | 86.1 | 0.001 |
| Expectoration | 22.7 | 74.8 | <0.001 | |
| Dyspnea | 14.7 | 27.8 | 0.004 | |
| Chest pain | 13.7 | 27.8 | 0.002 | |
| Vomiting | 1.4 | 9.6 | <0.001 | |
| Helene Faury et al. [11] | Chronic pulmonary diseases | 12.0 | 27.0 | 0.01 |
| Overweight/Obesity | 40.8 | 25.0 | 0.02 | |
| Median BMI | 27.3 | 24.8 | 0.04 | |
| Fatigue | 63.6 | 39.0 | 0.0006 | |
| Diarrhea | 25.8 | 13.0 | 0.03 | |
| Faintness | 12.1 | 3.0 | 0.02 | |
| Anosmia/Ageusia | 7.0 | 0 | 0.01 | |
| Sputum production | 12.0 | 36.0 | 0.0001 | |
| Nasal Congestion | 8.3 | 21 | 0.02 | |
| Secondary respiratory failure | 21.0 | 0 | <0.0001 | |
| Acute Kidney failure | 17.0 | 7.0 | 0.048 | |
| Pulmonary embolism | 6.0 | 0 | 0.03 | |
| Heart congestion | 2.0 | 14.0 | 0.003 | |
| Admitted to ICU | 31.0 | 12.0 | 0.002 | |
| Duration of hospitalization (days, [IQR]) | 10 [4–17] | 4 [1–11] | <0.0001 | |
| Oxygen therapy | 65.0 | 42.3 | 0.002 | |
| Mortality rate | 20.0 | 5.0 | 0.002 | |
| Pengfei Li et al. [5] | Cardiovascular disease/Hypertension | 28.76 | 14.11 | <0.0001 |
| Diabetes | 16.38 | 11.12 | 0.012 | |
| Asthma | 8.42 | 16.09 | 0.0033 | |
| Chronic Obstructive Pulmonary disease | 4.93 | 9.52 | 0.0003 | |
| Immunocompromised conditions | 4.39 | 9.99 | <0.0001 | |
| Fever | 72.08 | 89.99 | <0.0001 | |
| Cough | 57.99 | 85.31 | <0.0001 | |
| Shortness of breath | 32.89 | 49.19 | 0.0249 | |
| Rhinorrhea | 8.48 | 38.57 | <0.0001 | |
| Sore throat | 9.48 | 37.28 | <0.0001 | |
| Myalgia/Muscle pain | 18.97 | 30.12 | 0.0242 | |
| Vomiting | 8.67 | 24.27 | <0.0001 | |
| Mengqi Liu et al. [12] | Stuffy and runny nose | 7 | 23 | 0.002 |
| Xiao Tang et al. [13] | Productive cough | 53.4 | 78.7 | 0.002 |
| Fatigue | 63 | 18.7 | <0.001 | |
| GI symptoms | 37 | 6.7 | <0.001 | |
| Myalgia | 34.2 | 14.7 | 0.007 | |
| Natalie L. Cobb et al. [14] | ARDS | 63 | 26 | <0.001 |
| Hospital mortality | 40 | 19 | 0.006 | |
| Souheil Zayet et al. [15] | Frontal headache | 25.7 | 9.3 | 0.021 |
| Retro-orbital or temporal headache | 18.6 | 3.7 | 0.013 | |
| Fever | 75.7 | 92.6 | 0.042 | |
| Anosmia | 52.9 | 16.7 | <0.001 | |
| Dysgeusia | 48.6 | 20.4 | 0.001 | |
| Diarrhea | 40 | 20.4 | 0.021 | |
| Sputum Production | 28.6 | 51.9 | 0.01 | |
| Sneezing | 18.6 | 46.3 | 0.001 | |
| Dyspnea | 34.3 | 59.3 | 0.007 | |
| Sore throat | 20 | 44.4 | 0.006 | |
| Conjunctival hyperemia | 4.3 | 29.6 | <0.001 | |
| Tearing | 5.7 | 24.1 | 0.004 | |
| Vomiting | 2.8 | 22.2 | 0.001 | |
| Crackling sound | 38.6 | 20.4 | 0.032 | |
| Ronchi sounds | 1.4 | 16.7 | 0.002 | |
| Hao Wang et al. [16] | Cough | 30.8 | 82.6 | 0 |
| Raija Auvinen et al. [18] | Pulmonary Diseases | 18 | 45 | 0.03 |
| Current smoking | 4 | 30 | 0.008 | |
| Headache | 85 | 52 | 0.004 | |
| ARDS | 93 | 58 | 0.003 | |
| ICU admission | 29 | 6 | 0.034 | |
| Duration of hospitalization (days, [IQR]) | 6 [4–21] | 3 [2–4] | <0.001 | |
| Zhilan Yin et al. [19] | Cough | 73.3 | 96.7 | 0.026 |
| Expectoration | 43.3 | 80 | 0.007 | |
| Yi-Hua Lin et al. [20] | Fever 38.0 °C–38.9 °C | 43 | 32 | 0.014 |
| Fever ≥39.0 °C | 11 | 45 | 0.014 | |
| Cough | 51 | 100 | <0.001 | |
| Expectoration | 28 | 91 | <0.001 | |
| Dyspnea | 9 | 59 | <0.001 | |
| Chills | 23 | 55 | 0.015 | |
| Jaehee Lee et al. [21] | Median heart rate (bpm) | 83 | 107 | 0.017 |
| References | Significant Laboratory Findings | COVID-19 (%) | Influenza (%) | p-Value < 0.05 |
|---|---|---|---|---|
| Ying Luo et al. [7] | White blood cell count (×109 /L, median, [IQR]) | 5.45 [4.46–7.17] | 6.14 [4.66–8.24] | <0.001 |
| Neutrophil (×109 /L, median, [IQR])) | 3.68 [2.68–5.16] | 4.09 [2.85–6.11] | <0.001 | |
| Lymphocyte (%, median, [IQR]) | 22.0 [14.6–29.4] | 20.5 [13.3–28.6] | 0.009 | |
| Monocyte (×109 /L, median, [IQR]) | 0.47 [0.34–0.61] | 0.52 [0.37–0.69] | <0.001 | |
| Eosinophil (×109 /L, median, [IQR]) | 0.01 [0.00–0.05] | 0.02 [0.00–0.07] | <0.001 | |
| Eosinophil (%, median, [IQR]) | 0.2 [0.0–2.9] | 0.3 [0.0–1.2] | <0.001 | |
| Basophil (%, median, [IQR]) | 0.2 [0.0–0.3] | 0.2 [0.1–0.3] | <0.001 | |
| Red blood cell count (×1012 /L, median, [IQR]) | 4.43 [4.00–4.84] | 4.37 [3.96–4.78] | 0.012 | |
| Hemoglobin (g/L, median, [IQR]) | 134 [122–146] | 131 [119–143] | <0.001 | |
| Hematocrit (%, median, [IQR]) | 39.7 [36.2–43.1] | 39.1 [35.5–42.4] | 0.002 | |
| MCV (fL, median, [IQR]) | 89.1 [86.4–91.7] | 89.6 [86.7–92.4] | 0.003 | |
| MCH (pg, median, [IQR]) | 30.6 [29.5–31.6] | 30.4 [29.3–31.3] | 0.002 | |
| MCHC (g/L, median, [IQR]) | 343 [335–351] | 337 [329–346] | <0.001 | |
| RDW-CV (Median, [IQR]) | 12.2 [11.9–12.8] | 12.5 [12.0–13.2] | <0.001 | |
| RDW-SD (fL, median, [IQR]) | 39.5 [37.8–41.8] | 40.9 [38.8–43.2] | <0.001 | |
| PDW (fL, median, [IQR]) | 12.0 [10.8–13.6] | 12.3 [11.0–13.9] | 0.021 | |
| Alanine aminotransferase (U/L, median, [IQR]) | 25 [18–38] | 24 [16–36] | 0.019 | |
| Aspartate aminotransferase (U/L, median, [IQR]) | 27 [21–36] | 25 [19–35] | <0.001 | |
| Total Protein (g/L, mean) | 69.3 ± 5.6 | 68.5 ± 6.4 | 0.003 | |
| Globulin (g/L, median, [IQR]) | 32.4 ± 4.4 | 31.8 ± 4.8 | <0.001 | |
| Indirect Bilirubin (μmol/L, median, [IQR]) | 5.5 [4.2–7.3] | 4.9 [3.8–6.9] | <0.001 | |
| GGT (U/L, median, [IQR]) | 30 [21–48] | 35 [21–54] | 0.003 | |
| Alkaline Phosphatase (U/L, median, [IQR]) | 65 [56–78] | 75 [63–96] | <0.001 | |
| LDH (U/L, median, [IQR]) | 260 [217–327] | 235 [196–298] | <0.001 | |
| Triglyceride (mmol/L, median, [IQR]) | 1.75 ± 088 | 1.63 ± 0.84 | <0.001 | |
| HDL-C (mmol/L, median, [IQR]) | 0.99 ± 0.19 | 0.97 ± 0.22 | 0.002 | |
| LDL-C (mmol/L, median, [IQR]) | 2.45 ± 0.55 | 2.41 ± 0.68 | 0.004 | |
| Creatinine (μmol/L, median, [IQR]) | 72 [61–87] | 69 [59–82] | <0.001 | |
| Urea (mmol/L, median, [IQR]) | 5.89 ± 3.84 | 5.54 ± 3.41 | 0.001 | |
| Uric acid (μmol/L, median, [IQR]) | 253 [206–313] | 260 [219–304] | 0.031 | |
| Calcium (mmol/L, median, [IQR]) | 2.14 ± 0.11 | 2.17 ± 0.11 | <0.001 | |
| Magnesium (mmol/L, median, [IQR]) | 0.87 ± 0.07 | 0.86 ± 0.09 | 0.001 | |
| Chlorine (mmol/L, median, [IQR]) | 100.4 ± 4.2 | 101.4 ± 3.7 | <0.001 | |
| Potassium (mmol/L, median, [IQR]) | 4.21 ± 0.42 | 4.15 ± 0.40 | <0.001 | |
| Sodium (mmol/L, median, [IQR]) | 139.7 ±3.9 | 139.1 ± 3.4 | <0.001 | |
| Phosphate (mmol/L, median, [IQR]) | 1.04 ± 0.26 | 1.05 ± 0.20 | 0.002 | |
| HCO3 (mmol/L, median, [IQR]) | 24.5 ± 2.9 | 24.0 ± 3.1 | <0.001 | |
| Hypersensitive CRP (mg/L, median, [IQR]) | 20.0 [5.8–45.8] | 15.7 [4.8–40.1] | 0.024 | |
| ESR (mm/h, median, [IQR]) | 35 [24–47] | 27 [17–40] | <0.001 | |
| Prothrombin time (s, mean) | 14.06 ± 1.09 | 14.09 ± 1.83 | <0.001 | |
| APTT (s, mean) | 39.9 ± 4.5 | 39.6 ± 5.0 | 0.02 | |
| Thrombin time (s, mean) | 16.9 ± 1.4 | 16.6 ± 2.0 | <0.001 | |
| Prothrombin activity (%, mean) | 91 ± 11 | 92 ± 14 | <0.001 | |
| Fibrinogen (g/L, mean) | 4.71 ± 1.08 | 4.27 ± 1.18 | <0.001 | |
| D-Dimer (mg/L, median, [IQR]) | 1.24 [0.65–2.75] | 1.72 [0.85–3.30] | <0.001 | |
| Jiangnan Chen et al. [8] | Monocyte (×109 /L, median, [IQR]) | 0.36 [0.28–0.48] | 0.55 [0.4–0.71] | 0 |
| Monocyte (%, median, [IQR]) | 7.60 [6.20–9.95] | 9.0 [7.20–11.40] | 0 | |
| Neutrophil (×109 /L, median, [IQR]) | 2.93 [2.26–3.79] | 4.26 [3.00–5.74] | 0 | |
| Neutrophil (%, mean) | 64.50 ± 11.64 | 68.42 ± 14.69 | 0.011 | |
| Lymphocyte (%, mean) | 26.30 ± 10.52 | 21.07 ± 12.85 | 0 | |
| Eosinophil (%, median, [IQR]) | 0.60 [0.30–1.15] | 0.40 [0.10–1.10] | 0.038 | |
| Basophil (%, median, [IQR]) | 0.20 [0.10–0.30] | 0.10 [0.10–0.30] | 0.001 | |
| Jiajia Qu et al. [9] | Elevated lymphocyte | 0 | 5 | <0.01 |
| Abnormal Urinary test | 32.11 | 21.67 | <0.05 | |
| Urine protein positive | 16.26 | 8.33 | <0.05 | |
| Elevated procalcitonin | 40.83 | 10.98 | <0.01 | |
| Elevated white blood cells | 75 | 26.83 | <0.01 | |
| Jianguo Zhang et al. [10] | Leukocytosis > 9.5 × 10⁹ /L | 16.1 | 30.4 | 0.003 |
| Neutrophilia > 75% | 32.2 | 50.4 | 0.001 | |
| Lymphocytopenia < 20% | 46.9 | 68.7 | <0.001 | |
| Creatine Kinase > 25 U/L | 11.8 | 3.5 | 0.013 | |
| Helene Faury et al. [11] | White Blood cell count (G/L, median, [IQR]) | 5.88 [4.41–7.68] | 6.72 [5.15–9.42] | 0.01 |
| Neutrophil (G/L, median, [IQR]) | 4.11 [2.99–5.65] | 5.06 [3.43–7.25] | 0.02 | |
| Platelets (G/L, median, [IQR]) | 179 [145–225] | 199 [168–239] | 0.04 | |
| Sodium (U/L, median, [IQR])) | 137 [135–139] | 138 [136–140] | 0.006 | |
| Troponin (ng/L, median, [IQR]) | 9.2 [6.5–22.4] | 34.4 [8.8–72.2] | 0.007 | |
| Albumin (g/L, median, [IQR]) | 30 [27–33] | 37 [33–39] | 0.04 | |
| Aspartate aminotransferase (U/L, median, [IQR]) | 45 [34–76] | 34 [29–49] | 0.02 | |
| LDH (U/L, median, [IQR]) | 397 [305–544] | 298 [248–383] | 0.04 | |
| Xiao Tang et al. [13] | PaO2/FiO2 (Median, mm Hg) | 198.5 | 107 | <0.001 |
| Aspartate transaminase (U/L) | 25.5 | 70 | <0.001 | |
| LDH (U/L) | 483 | 767 | <0.001 | |
| Troponin I (ng/mL) | 0.03 | 0.14 | <0.001 | |
| CD3+ (Median, cells/mL) | 193 | 303 | 0.007 | |
| CD4+/CD3+ (Median, cells/mL) | 97 | 185 | <0.001 | |
| Natalie L. Cobb et al. [14] | White blood cells at admission (median, [IQR]) | 7240 [5430–11,820] | 9035 [6590–14,900] | 0.007 |
| Neutrophil at admission (median, [IQR]) | 5405 [3880–9580] | 7210 [4990–11,890] | 0.02 | |
| Early sputum cultures (positive) | 27.2 | 72.2 | 0.005 | |
| Raija Auvinen et al. [18] | Leukocytes count ×109 /L (Median, [IQR]) | 5.1 (4.0–6.3) | 6.7 (5.4–10.9) | 0.002 |
| Leukocytosis | 11 | 39 | 0.019 | |
| Thrombocytopenia < 150 × 109 /L | 39 | 12 | 0.019 | |
| Alanine aminotransferase (U/L, [IQR]) | 42 [19–127] | 23 [12–123] | 0.011 | |
| Zhilan Yin et al. [19] | Neutrophil (×109 cells/L, median, [IQR]) | 3.57 [2.72–4.92] | 4.75 [3.15–7.00] | 0.037 |
| Procalcitonin (ng/mL, median, [IQR]) | 0.04 [0.03–0.09] | 0.11 [0.09–0.37] | 0.002 | |
| Yi-Hua Lin et al. [20] | White blood cells (×109 cells/L, mean) | 4.87 ± 2.04 | 7.59 ± 5.12 | 0.026 |
| Leukocytosis | 3 | 32 | 0.002 | |
| Neutrophil (×109 /L, mean) | 3.16 ± 1.73 | 6.20 ± 4.84 | 0.009 | |
| Lymphocyte (×109 /L, mean) | 1.19 ± 0.59 | 0.88 ± 0.52 | 0.049 | |
| Anemia | 0 | 41 | <0.001 | |
| CRP (mg/L, median, [IQR])) | 9.56 [3.82–22.42] | 55.3 [33.97–102.77] | 0.001 | |
| Procalcitonin (ng/L, median, [IQR]) | 0.05 [0.05–0.06] | 0.25 [0.08–2.28] | <0.001 | |
| Urea Nitrogen (mmol/L, mean) | 3.76 ± 1.37 | 6.36 ± 3.30 | 0.002 | |
| LDH (U/L, median, [IQR])) | 158.0 [142.0–196.0] | 243.5 [198.3–328.8] | <0.001 | |
| PaO2/FiO2 < 200 mm Hg | 4 | 22 | 0.022 | |
| Jaehee Lee et al. [21] | White blood cell (Median, cells/uL) | 7470 | 2680 | 0.027 |
| References | Significant Radiological Findings | COVID-19 (%) | Influenza (%) | p-Value < 0.05 |
|---|---|---|---|---|
| Jianguo Zhang et al. [10] | Rounded opacities | 37.9 | 19.1 | <0.001 |
| Bronchiolar wall thickening | 33.6 | 13 | <0.0001 | |
| Air bronchogram | 29.9 | 13 | <0.001 | |
| Consolidation | 26.1 | 15.7 | 0.031 | |
| Interlobular septal thickening | 24.2 | 13.9 | 0.029 | |
| Crazy paving pattern | 22.3 | 9.6 | 0.004 | |
| Tree-in-bud | 13.7 | 5.2 | 0.018 | |
| GGO with consolidation | 25.6 | 39.1 | 0.011 | |
| Helene Faury et al. [11] | Pulmonary nodules | 8.8 | 50.0 | 0.001 |
| Mengqi Liu et al. [12] | Predominant distribution: | |||
| – Central | 2 | 6 | 0.022 | |
| – Peripheral | 45 | 20 | ||
| – Mixed | 53 | 74 | ||
| Interlobular septal thickening | 66 | 43 | 0.014 | |
| Rounded opacities | 35 | 17 | 0.048 | |
| Nodules | 28 | 71 | <0.001 | |
| Tree-in-bud | 9 | 40 | <0.001 | |
| Pleural effusion | 6 | 31 | <0.001 | |
| Pure GGO without nodules | 29 | 11 | <0.001 | |
| Pure GGO + interlobular septal thickening | 21 | 6 | 0.042 | |
| Rounded opacities without nodules | 22 | 0 | 0.002 | |
| Interlobular septal thickening without nodules | 45 | 6 | <0.001 | |
| Rounded opacities + interlobular septal thickening + absence of pleural effusion | 19 | 3 | 0.021 | |
| Xiao Tang et al. [13] | GGO | 94.5 | 45.3 | <0.001 |
| Consolidation | 28.8 | 45.3 | 0.042 | |
| Natalie L Cobb et al. [14] | Bilateral opacities | 90 | 52 | <0.001 |
| Hao Wang et al. [16] | Lesion Distribution: | |||
| – Central | 7.7 | 75 | 0.000 | |
| – Peripheral | 38.5 | 3.3 | ||
| – Diffuse | 0 | 21.7 | ||
| – Non-specific | 53.8 | 0 | ||
| Lobe predomination: | ||||
| – Superior lobe | 23.1 | 23.9 | 0.001 | |
| – Inferior lobe | 15.4 | 57.6 | ||
| – Middle lobe | 7.7 | 7.6 | ||
| – Balanced predomination | 53.8 | 10.9 | ||
| Lesion margin: | ||||
| – Clear | 46.2 | 10.9 | 0.004 | |
| – Vague | 53.8 | 89.1 | ||
| GGO Involvement pattern: | ||||
| – Patchy | 38.5 | 5.4 | 0.000 | |
| – Cluster like | 7.7 | 77.2 | ||
| – GGO + consolidation opacities | 46.2 | 6.5 | ||
| – Whole consolidation | 7.7 | 10.9 | ||
| Lesion Contour: | ||||
| – Shrinking | 69.2 | 1.1 | 0.000 | |
| – Non-shrinking | 30.8 | 98.9 | ||
| Bronchial wall thickening | 0 | 32.6 | 0.018 | |
| Liaoyi Lin et al. [17] | Close to the pleura | 69 | 40 | 0.005 |
| Mucoid impaction | 2 | 13 | 0.047 | |
| Pleural effusion | 0 | 22 | <0.001 | |
| Axial distribution: | ||||
| – Inner | 6 | 7 | <0.001 | |
| – Outer | 67 | 24 | ||
| – Diffuse | 12 | 36 | ||
| – Random | 15 | 33 | ||
| Raija Auvinen et al. [18] | Linear opacities | 14 | 42 | 0.024 |
| GGO/Consolidation | 68 | 21 | < 0.001 | |
| Zhilan Yin et al. [19] | Vascular enlargement | 67 | 93 | 0.037 |
| Pleural Thickening | 63 | 90 | 0.03 | |
| Linear opacification | 50 | 90 | 0.002 | |
| Crazy-paving sign | 30 | 60 | 0.021 | |
| Pleural effusion | 53 | 13 | 0.002 | |
| Bronchiectasis | 30 | 3 | 0.012 | |
| Yi-Hua Lin et al. [20] | GGO | 71 | 23 | < 0.001 |
| Infiltration | 29 | 68 | 0.003 | |
| GGO + reticular pattern | 63 | 0 | < 0.001 | |
| Interlobular septal thickening | 71 | 27 | 0.001 |
Publisher’s Note: MDPI stays neutral with regard to jurisdictional claims in published maps and institutional affiliations. |
© 2021 by the authors. Licensee MDPI, Basel, Switzerland. This article is an open access article distributed under the terms and conditions of the Creative Commons Attribution (CC BY) license (http://creativecommons.org/licenses/by/4.0/).
Share and Cite
Osman, M.; Klopfenstein, T.; Belfeki, N.; Gendrin, V.; Zayet, S. A Comparative Systematic Review of COVID-19 and Influenza. Viruses 2021, 13, 452. https://doi.org/10.3390/v13030452
Osman M, Klopfenstein T, Belfeki N, Gendrin V, Zayet S. A Comparative Systematic Review of COVID-19 and Influenza. Viruses. 2021; 13(3):452. https://doi.org/10.3390/v13030452
Chicago/Turabian StyleOsman, Molka, Timothée Klopfenstein, Nabil Belfeki, Vincent Gendrin, and Souheil Zayet. 2021. "A Comparative Systematic Review of COVID-19 and Influenza" Viruses 13, no. 3: 452. https://doi.org/10.3390/v13030452