Article

The Ecology of Nipah Virus in Bangladesh: A Nexus of Land-Use Change and Opportunistic Feeding Behavior in Bats

1
Department of Epidemiology, Johns Hopkins Bloomberg School of Public Health, Baltimore, MD 21205, USA
2
Infectious Diseases Division, icddr,b, Dhaka 1212, Bangladesh
3
Infectious Diseases and Geographic Medicine Division, Stanford University, Stanford, CA 94305, USA
4
Department of Genetics, Cambridge University, Cambridge CB2 3EJ, UK
5
Center for Infectious Disease Dynamics, Pennsylvania State University, State College, PA 16801, USA
6
Department of Microbiology and Immunology, Montana State University, Bozeman, MT 59717, USA
*
Author to whom correspondence should be addressed.
Viruses 2021, 13(2), 169; https://doi.org/10.3390/v13020169
Submission received: 10 December 2020 / Revised: 13 January 2021 / Accepted: 21 January 2021 / Published: 23 January 2021
(This article belongs to the Special Issue Henipaviruses)

Abstract

:
Nipah virus is a bat-borne paramyxovirus that produces yearly outbreaks of fatal encephalitis in Bangladesh. Understanding the ecological conditions that lead to spillover from bats to humans can assist in designing effective interventions. To investigate the current and historical processes that drive Nipah spillover in Bangladesh, we analyzed the relationship among spillover events and climatic conditions, the spatial distribution and size of Pteropus medius roosts, and patterns of land-use change in Bangladesh over the last 300 years. We found that 53% of annual variation in winter spillovers is explained by winter temperature, which may affect bat behavior, physiology, and human risk behaviors. We infer from changes in forest cover that a progressive shift in bat roosting behavior occurred over hundreds of years, producing the current system where a majority of P. medius populations are small (median of 150 bats), occupy roost sites for 10 years or more, live in areas of high human population density, and opportunistically feed on cultivated food resources—conditions that promote viral spillover. Without interventions, continuing anthropogenic pressure on bat populations similar to what has occurred in Bangladesh could result in more regular spillovers of other bat viruses, including Hendra and Ebola viruses.

1. Introduction

Despite successes in decreasing the burden of infectious diseases during the 20th century [1,2,3,4], emerging zoonotic infections remain an important threat to human health globally [5,6]. Furthermore, for many zoonoses, we have a poor understanding of the biological factors that determine when and where animal hosts are infectious and pose a risk for spillover into human populations [7]. Spillover events often appear sporadic in space and time and repeated outbreaks are rare. This low replication makes it difficult to ascertain the natural history of pathogens. Moreover, rapid response to outbreaks of novel infectious diseases is facilitated when data on related pathogens have been collected through surveillance in animal hosts [8]. Only through long-term surveillance efforts that integrate knowledge of reservoir host ecology, routes of pathogen spillover, and the nature of human–animal interactions can we develop an understanding of the ecology of emerging infections and manage the risk of spillover [7]. Our goal in this study was to assess the ecological conditions that affect the spillover of Nipah virus from fruit bats to humans in Bangladesh on the basis of almost two decades of outbreaks.
Nipah virus (family Paramyxoviridae, genus Henipavirus) is hosted by various Pteropus fruit bat species with partially overlapping ranges across countries of South and Southeast Asia [9,10,11,12,13,14,15,16,17,18,19,20,21] and potentially the Philippines, where an outbreak of illness in humans and horses from a Nipah-like virus occurred [22]. The range of henipaviruses including Hendra [23], Cedar [24], and others [25,26,27] extends throughout the geographic range of pteropodid bats to Australia, Indian Ocean islands, and sub-Saharan Africa [28]. These data, combined with limited evidence of pathology in henipavirus-infected bats [29,30], suggest that henipaviruses have had a long association with their bat reservoirs that spans the dispersal of pteropodid bats out of Southeast Asia to other regions [31,32,33,34,35].
Distinct outbreaks of Nipah virus infection have highlighted that the same pathogen may use multiple routes to spillover. Nipah virus was first discovered following an outbreak of febrile illness in pigs, pig farmers, and abattoir workers in Malaysia and neighboring Singapore between September 1998 and May 1999 [36,37,38,39]. The outbreak ended only after Malaysia established widespread surveillance of pigs, resulting in the culling of over one million animals [40]. Outbreaks of Nipah virus infection in Bangladesh have a very different ecological pattern. Since 2001 when the first cases of human encephalitis in Bangladesh and India were linked to Nipah virus [9,41], outbreaks have been reported almost every year in Bangladesh and more sporadically in neighboring India [42,43]. Outbreaks in Bangladesh are seasonal, with cases occurring between December and April [44], and cluster primarily in the central and northwest districts of the country. Unlike the outbreaks in Malaysia, those in Bangladesh did not involve an intermediate animal host and were instead linked to drinking fresh or fermented sap (tari) from silver date palm trees (Phoenix sylvestris) [45,46,47]. Geographic variation in observed spillover frequency across Bangladesh is partly explained by the proportion of households that drink fresh date palm sap [48] and the distance to the nearest hospital where systematic Nipah virus surveillance occurs [44]. The independence of these spillover events is supported by the genetic variability among Nipah virus sequences from humans and bats in Bangladesh collected from separate outbreaks, contrasting with the more homogeneous sequences from Malaysia [49]. Lastly, human-to-human transmission of Nipah virus occurs in Bangladesh [50,51] with an average reproduction number (the average number of secondary cases per case patient) of 0.33 (95% confidence interval (CI): 0.19–0.59) estimated over 2001–2014 [51] or 0.2 (95% CI: 0.1–0.4) over 2007–2018 [42]. Human-to-human transmission of Nipah virus has also been reported during Nipah virus outbreaks in India in 2001, 2007, and 2018 [41,43,52,53]. Although human-to-human transmission was not widely acknowledged in Malaysia at the time of the outbreak [38], methods for detecting such transmission events (e.g., contact tracing) may not have been in place. Additionally, numerous cases reported in the literature had no contact with pigs, suggesting human-to-human transmission may be an alternative explanation [39,54,55]. Thus, the extent of human-to-human transmission that occurred during the Malaysian Nipah virus outbreak remains unclear.
One striking similarity between Nipah virus ecology in Bangladesh and Malaysia is that spillovers were facilitated by human resource supplementation in modified landscapes [56]. In Malaysia this involved planting fruit trees in close proximity to piggeries [57,58], whereas, in Bangladesh, the key resource appears to be date palm sap. Pteropus medius (formerly P. giganteus) frequently visit date palm trees to consume sap, potentially contaminating sap by licking the shaved area of the tree, urinating or defecating in the collection pots, or, in some cases, becoming trapped and dying in the pot [46,59,60]. Visits by P. medius are highest during winter months (Islam et al., in review) when date palm sap is primarily harvested to drink fresh (October to March or April) [45,60,61] and when other available cultivated fruit resources for bats are low [62]. While Phoenix sylvestris is a native species in Bangladesh [63,64,65,66], date palm sap would not be available to bats if trees were not tapped by sap collectors. P. medius is found throughout Bangladesh and bats shed Nipah virus in their urine in all seasons [67]. Nipah virus can remain infectious at 22 °C in neutral pH bat urine for up to 4 days and artificial sap (13% sucrose, 0.21% bovine serum albumin, pH 7) for over 1 week [68,69]; most fresh sap and fermented tari is consumed within hours of collection [45,47,59]. While the prevalence of Nipah virus shedding in P. medius is generally low [67], presenting a bottleneck in spillover, the risk of foodborne transmission increases for communities with higher sap consumption [48]. These patterns imply that the spatiotemporal clustering of Nipah spillovers is a convergence of human and bat consumption behavior, wherein the risk of consuming sap contaminated with Nipah virus shed from bats is highest during winter when most sap is consumed by humans and in regions with high rates of sap consumption.
However, there are still aspects of Nipah virus ecology in bats and their interface with human populations that are unclear. First, there is substantial year-to-year variation in the number of Nipah virus spillover events in Bangladesh [42] that may be explained by ecological factors influencing bat behavior and viral shedding. Cortes et al. [44] showed that differences in winter temperature can explain variation in Nipah virus spillovers, but this analysis only covered the period 2007–2013 and missed the decrease in spillovers observed after 2015 [42]. Second, we lack comprehensive information on the population biology, roosting and feeding behavior, and movement ecology of P. medius in Bangladesh. Like other Pteropus spp. bats, P. medius populations appear to be in decline due to hunting and habitat loss [70,71,72], but P. medius also appears to thrive in the human-dominated landscapes of Bangladesh. This adaptability derives from the opportunistic feeding habits of Pteropus species and their ability to forage over large areas [67,73,74,75]. Even though Bangladesh is already the most densely populated country that is not a small city-state or island [76], more P. medius roosts in Bangladesh are found in areas with higher human population density, forest fragmentation, and supplemental food resources from residential fruit trees [77,78]. However, villages with Nipah virus spillovers did not have more P. medius roosts or total bats in the village or within 5 km of the village boundary than villages where spillovers have not been detected [48]. National surveys of P. medius roost sites and population trends, including mapping of food resources used by bats, would provide a better understanding of P. medius interactions with humans. Lastly, we lack a historical perspective on how land-use changes in Bangladesh may have influenced P. medius populations and behavior, thereby setting the stage for the emergence of Nipah virus. Analysis of these aspects of Nipah virus ecology will provide clearer insights into the potential drivers of Nipah virus spillover from bats.
The objective of this study was to describe the ecological factors that contribute to a higher likelihood of Nipah virus spillover, including climate effects on bat behavior or physiology, the geography of bat roosting sites in Bangladesh, and the relationship between historical land-use change and bat roosting behavior. Following the results of Cortes et al. [44], we hypothesized that Nipah virus spillovers would have a strong relationship with winter temperature that explains annual variation in spillover numbers between 2001 and 2018. Regarding P. medius roosting sites, we hypothesized that spatial variables related to climate, human population density, land-use, and anthropogenic food resources such as fruit trees and date palm trees could explain variation in the occupancy and size of roosting bat populations. Lastly, we hypothesized that land-use change, specifically the loss of primary forests, has been a continuous process throughout human occupation of the region that was accelerated during British occupation. This progressive loss of forests likely led to a shift in roosting sites toward more urban areas closer to anthropogenic food resources, a condition that facilitates spillover but predates the first recognized outbreaks of Nipah virus infection by many years. By assessing these patterns, we develop a more comprehensive view of Nipah virus ecology in Bangladesh and provide a path forward for research and management of this system.

2. Materials and Methods

2.1. Nipah Virus Spillover Events

To investigate the spatial and temporal patterns of Nipah virus spillover in Bangladesh, we compiled data on the number of spillover events and affected administrative districts during 2001–2018. Cases prior to 2007 were detected through community investigations following reports of clusters of encephalitis. Cases from 2007 onward reflect those identified through systematic surveillance for Nipah virus infection at three tertiary care hospitals combined with investigations of all cases detected to look for clusters, as well as any reports of possible outbreaks through media or other information sources [42]. Independent spillover events were defined as index cases of Nipah virus infection within a given outbreak year. This definition excludes cases that resulted from secondary human-to-human transmission following spillover.

2.2. Climate Data

Expanding on the results from Cortes et al. [44] showing associations between climate and the number of spillover events during 2007–2013, we used data from 20 weather stations in Bangladesh. Mean temperature at 3 hour intervals and daily precipitation between 1953–2015 were obtained from the Bangladesh Meteorological Department. Daily temperature and precipitation summary data from 2015 onward were obtained from the National Climatic Data Center [79] and merged with the older data. We also downloaded monthly indices for three major climate cycles that lead to temperature and precipitation anomalies in the region: the multivariate El Niño–Southern Oscillation (ENSO) index (MEI), the Indian Ocean dipole mode index (DMI), and the subtropical Indian Ocean dipole index (SIOD). Data were retrieved from the Japan Agency for Marine-Earth Science and Technology Application Laboratory [80] and the National Oceanic and Atmospheric Administration Physical Sciences Laboratory [81]. On the basis of the frequency of Nipah virus spillovers occurring in winter, we focused on weather summary statistics for each year that covered the period from the start of the preceding December to the end of February of a focal outbreak year. We calculated the mean and recorded the minimum temperature over all stations, the percentage of days below 17 °C, and the cumulative precipitation from all stations over the focal period. The choice of 17 °C was arbitrary but represents an upper bound for relative coolness during winter that does not produce any zeros. Mean winter MEI, DMI, and SIOD values were also calculated for each year.

2.3. Survey of Bat Roost Sites and Food Resources

The spatial distribution of Pteropus medius in Bangladesh was inferred from a countrywide survey of villages as part of investigations regarding risk factors for Nipah spillover performed over the winters of 2011–2012 and 2012–2013 [48]. Briefly, trained teams of data collectors interviewed key informants within villages, who identified known bat roost sites (both occupied and unoccupied) in the village and within 5 km of the village and reported details of the duration of roost occupancy and perceived population trends. The interviewers also mapped the location and number of date palm trees (Phoenix sylvestris) and known feeding sites that bats were reported to visit within 500 m of the villages. Feeding sites included fruit trees planted in orchards or in residential areas: jujube (Ziziphus mauritiana), banana, mango, guava, lychee, star fruit, jackfruit, papaya, sapodilla (Manilkara zapota), mulberry, hog plum (Spondias mombin), Indian olive (Elaeocarpus serratus), and other species.

2.4. Spatial Covariates of Bat Roost Sites

To evaluate spatial covariates that could explain the occupancy (presence/absence of bats) and abundance (estimated population size) of bats living in mapped roost sites, we extracted data from available raster surfaces describing human population density, land-use, bioclimatic variables (e.g., mean annual temperature and precipitation), elevation, slope, and forest cover. Spatial covariate raster files were downloaded from WorldPop [82,83], the Socioeconomic Data and Applications Center (SEDAC) [84], WorldClim [85], and a study on global forest-cover change [86]. We also calculated the distance from an index roost site to the nearest village, neighboring roost, date palm tree, and feeding site, and the number of villages, other mapped roosts, date palm trees, and feeding sites within a 15 km radius around each roost. Average nightly foraging distances of individual P. medius in two colonies in Bangladesh were estimated to be 10.8 km and 18.7 km; thus, 15 km was chosen to represent the distance a bat might expect to travel to reach a suitable feeding site [67]. The number of potential covariates was initially reduced by removing variables that were colinear (Pearson’s correlation greater than 0.7). Descriptions, sources, spatial resolution, and distribution statistics for all 32 covariates are provided in Table S1 (Supplementary Materials).

2.5. Historical Land-Use Data

Given the reliance of P. medius on tall trees for roosting and various native and cultivated fruit trees for food, we gathered data on historical changes in land-use, particularly forested lands, across Bangladesh from data sources covering separate but overlapping time periods. Reconstructed natural biomes and anthropogenic biomes from 1700–2000 were extracted from rasters produced by Ellis et al. [87] using the HYDE 3.1 data model [88] and available from SEDAC. We reclassified their land-use subcategories into three primary categories: dense settlements, consisting of urban and suburban areas with high human population density (>100 persons/km2 for settlements, >2500 persons/km2 for urban areas), rice villages and other croplands or rangelands, and forested areas, including populated woodlands and remote forests. Land-use data for the years 1992, 2004, 2015, and 2018 were downloaded from the Organization for Economic Cooperation and Development (OECD) land-cover database [89], derived from European Space Agency Climate Change Initiative land-cover maps [90]. Data for 1990 and 2016 were provided by the World Bank [91]. Land cover over the period 1930–2014 came from an analysis by Reddy et al. [92]. Lastly, forest cover from 2000 and subsequent forest loss as of 2017 were calculated from maps produced by Hansen et al. [86] using the R package gfcanalysis [93,94]. For the calculations from Hansen et al. data, we chose a cutoff of 40% forest-cover density to match the definition of dense forests used by Reddy et al. Across these datasets, we calculated the percentage of Bangladesh’s total land area (147,570 km2 [92]) that was classified as forest.

2.6. Statistical Analysis

Separate Nipah virus spillover events were clustered geographically by the latitude and longitude of affected administrative districts and temporally by the date of illness of each index case using a bivariate normal kernel via the R package MASS [95]. To examine the association between Nipah virus spillovers and climate variables, separate generalized linear models were produced that examined climate summary statistics and the number of spillover districts or independent spillover events assuming a Poisson distribution for each response. Model selection was performed to choose the best-fitting combination of climate covariates according to Akaike’s information criterion corrected for small sample sizes (AICc) [96] using the R package MuMIn [97].
The importance of spatial covariates in explaining variation in the occupancy and abundance of bats at roost sites was assessed through a combination of linear modeling and machine learning. The covariates were standardized, and data were split into two sets: an occupancy dataset of 488 mapped roost sites with a binary variable describing whether bats were currently present or not and an abundance dataset of 323 mapped roost sites with the estimated count of bats at each currently occupied roost at the time of the interview. Both datasets were split into training (80%) and testing (20%) sets for validation of models [98]. Generalized linear models (GLMs) were fit with all potential covariates, assuming a binomial distribution for roost site occupancy and a negative binomial distribution for roost counts, which was chosen because of the observed overdispersion of the data, with a variance–mean ratio greater than unity. Due to the large number of potential covariates, least absolute shrinkage and selection operator (LASSO) regularization was implemented to reduce the number of covariates and minimize prediction error [99]. We also used random forests to perform covariate selection and assess explanatory power [100]. This machine learning method constructs many decision trees using random subsets of the response variable and covariates then averages the predictions. This method of constructing and averaging a set of uncorrelated decision trees reduces overfitting relative to single decision trees. Linear modeling and random forests were performed in R using the packages caret, glmnet, and ranger [101,102,103].

3. Results

3.1. Spatiotemporal Patterns of Nipah Virus Spillover

On the basis of 183 spillover events from 2001–2018, we confirmed previous analyses [42,44,48] showing that Nipah virus spillovers are spatially clustered within districts in the central and northwest regions of Bangladesh (Figure 1A). Outbreak years vary in the intensity of spillover and winter is the primary season when spillovers occur throughout the country (Figure 1B,C), although there are occasional events in early spring in central Bangladesh. With the exception of 2002, 2006, and 2016, Nipah virus spillovers have been observed every year since the virus was first identified in 2001, and, as observed by Nikolay et al. [42], more spillovers were observed between 2010–2015 than before or after this period (Figure 1D). In accordance with previous work [44] covering 2007–2013, we confirmed that much of this yearly variation in spillover events (53%) can be explained by winter weather over the longer period 2001–2018. Mean winter temperature, minimum winter temperature, and the percentage of days below 17 °C all showed statistically significant associations with yearly spillover events and the number of affected districts (p < 0.001; Figures S1–S3, Supplementary Materials). There were no significant associations with cumulative winter precipitation (p > 0.05; Figure S4, Supplementary Materials) or the three climate oscillation indices (MEI, DMI, and SIOD; Figure S5, Supplementary Materials). The percentage of days below 17 °C was chosen as the single best-fitting covariate for both outcomes according to AICc (Tables S2 and S3, Supplementary Materials), showing that colder winter temperatures were associated with more spillovers and more affected districts during 2010–2015, followed by fewer spillovers and affected districts during the relatively warmer period of 2016–2018 (Figure 1D,E; Figure S3, Supplementary Materials). Sensitivity analysis of the association between spillovers and the number of winter days below a certain temperature threshold confirmed that the relationship was strongest at thresholds of 16 to 18 °C, but was statistically significant for thresholds ranging from 15 to 20 °C (Table S4, Supplementary Materials). We note that spillover observations prior to 2007 mostly appear as undercounts relative to those expected by the winter temperatures (Figure 1E; Figures S1–S3, Supplementary Materials), which may be attributed to the lack of systematic surveillance during that period [42].

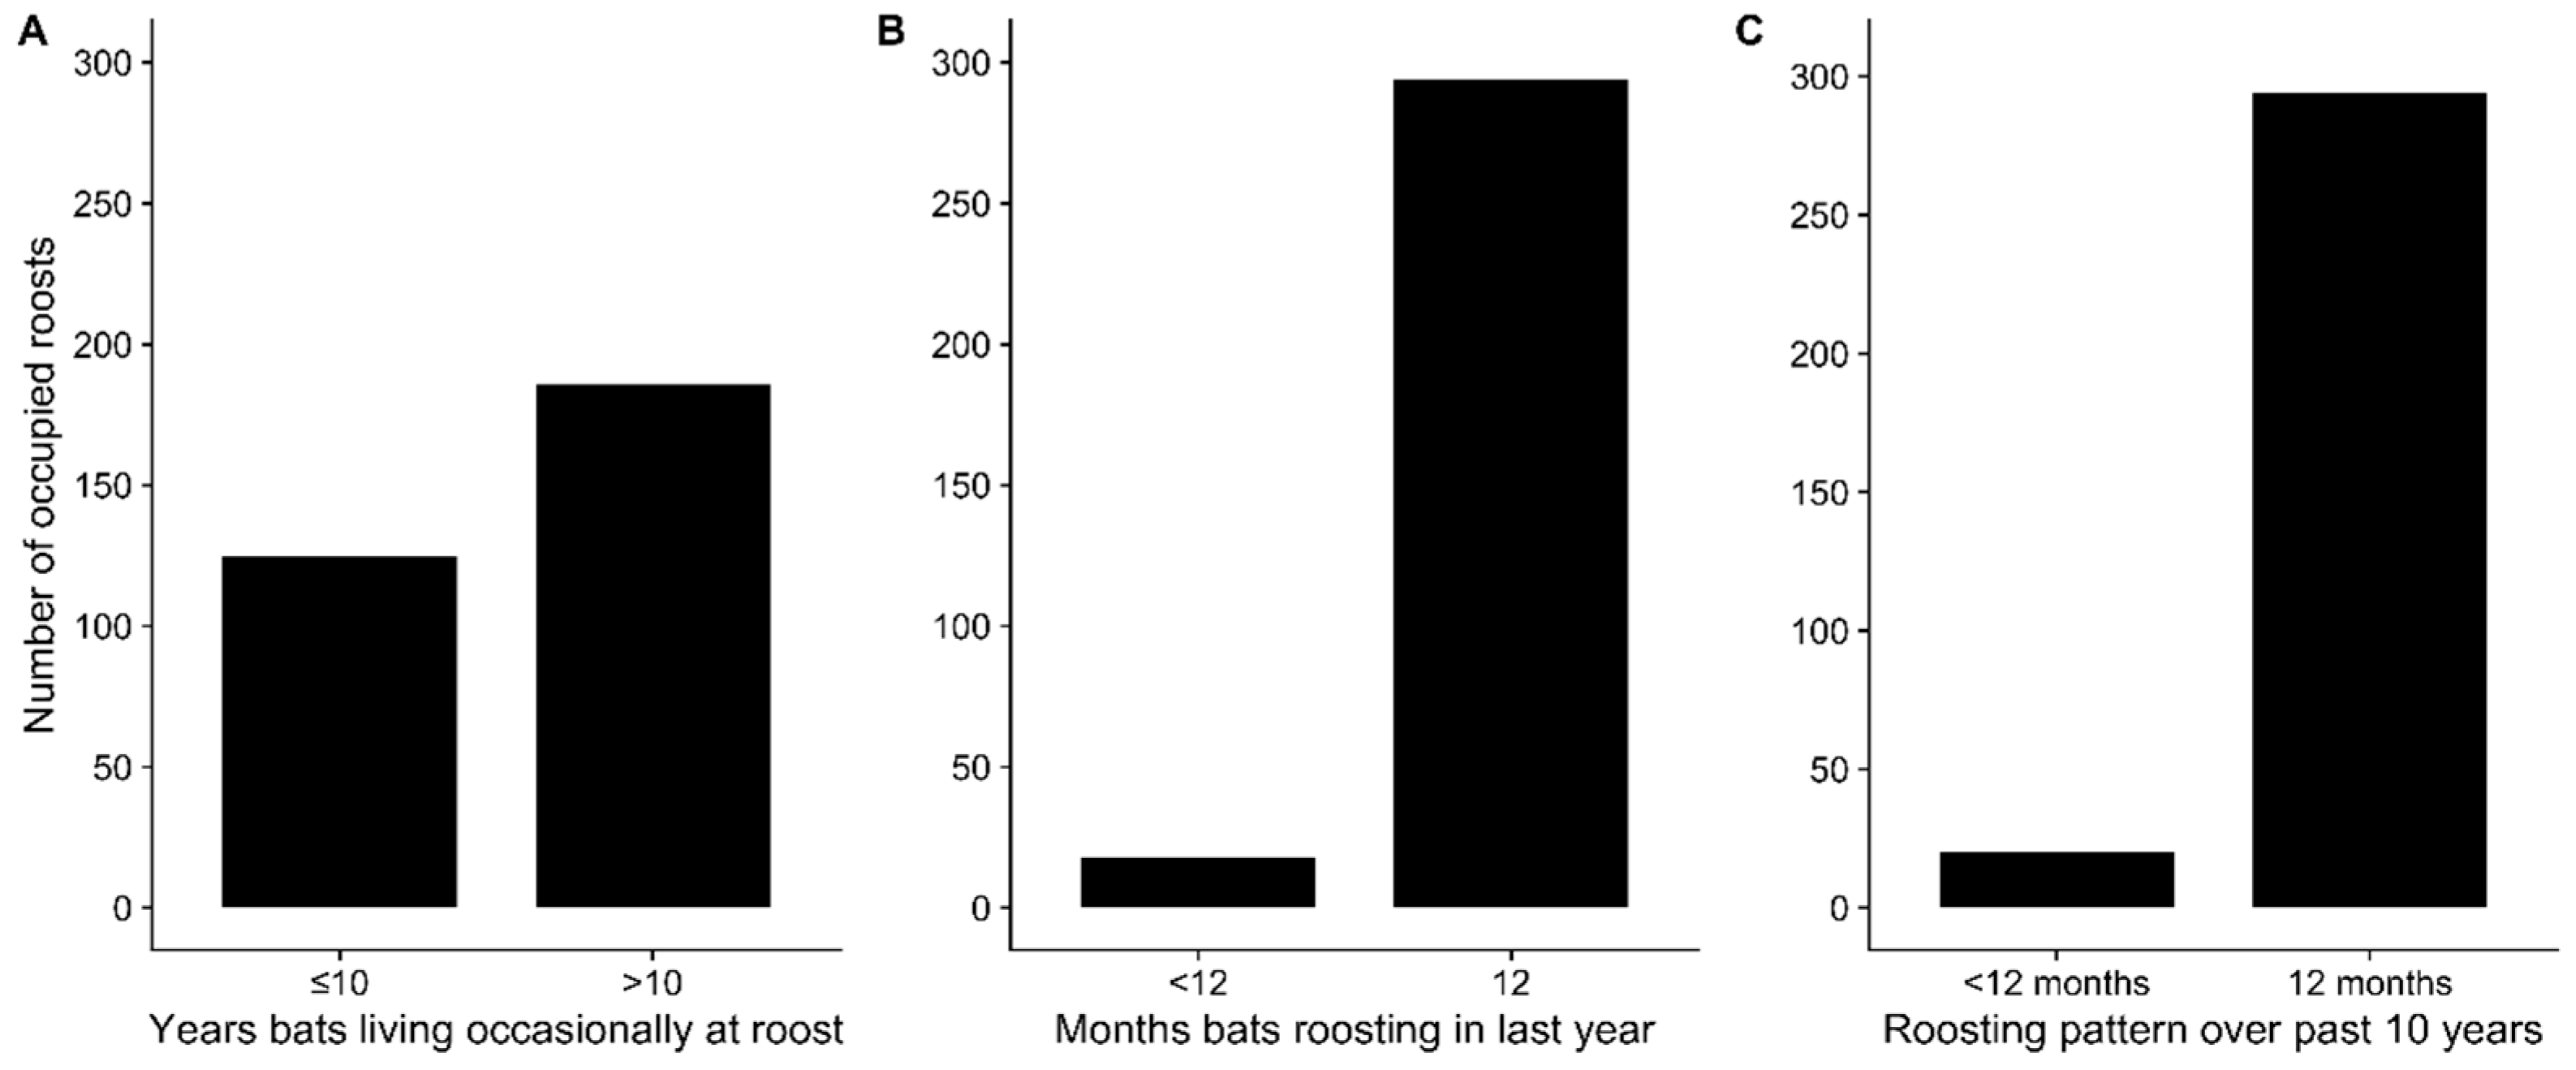
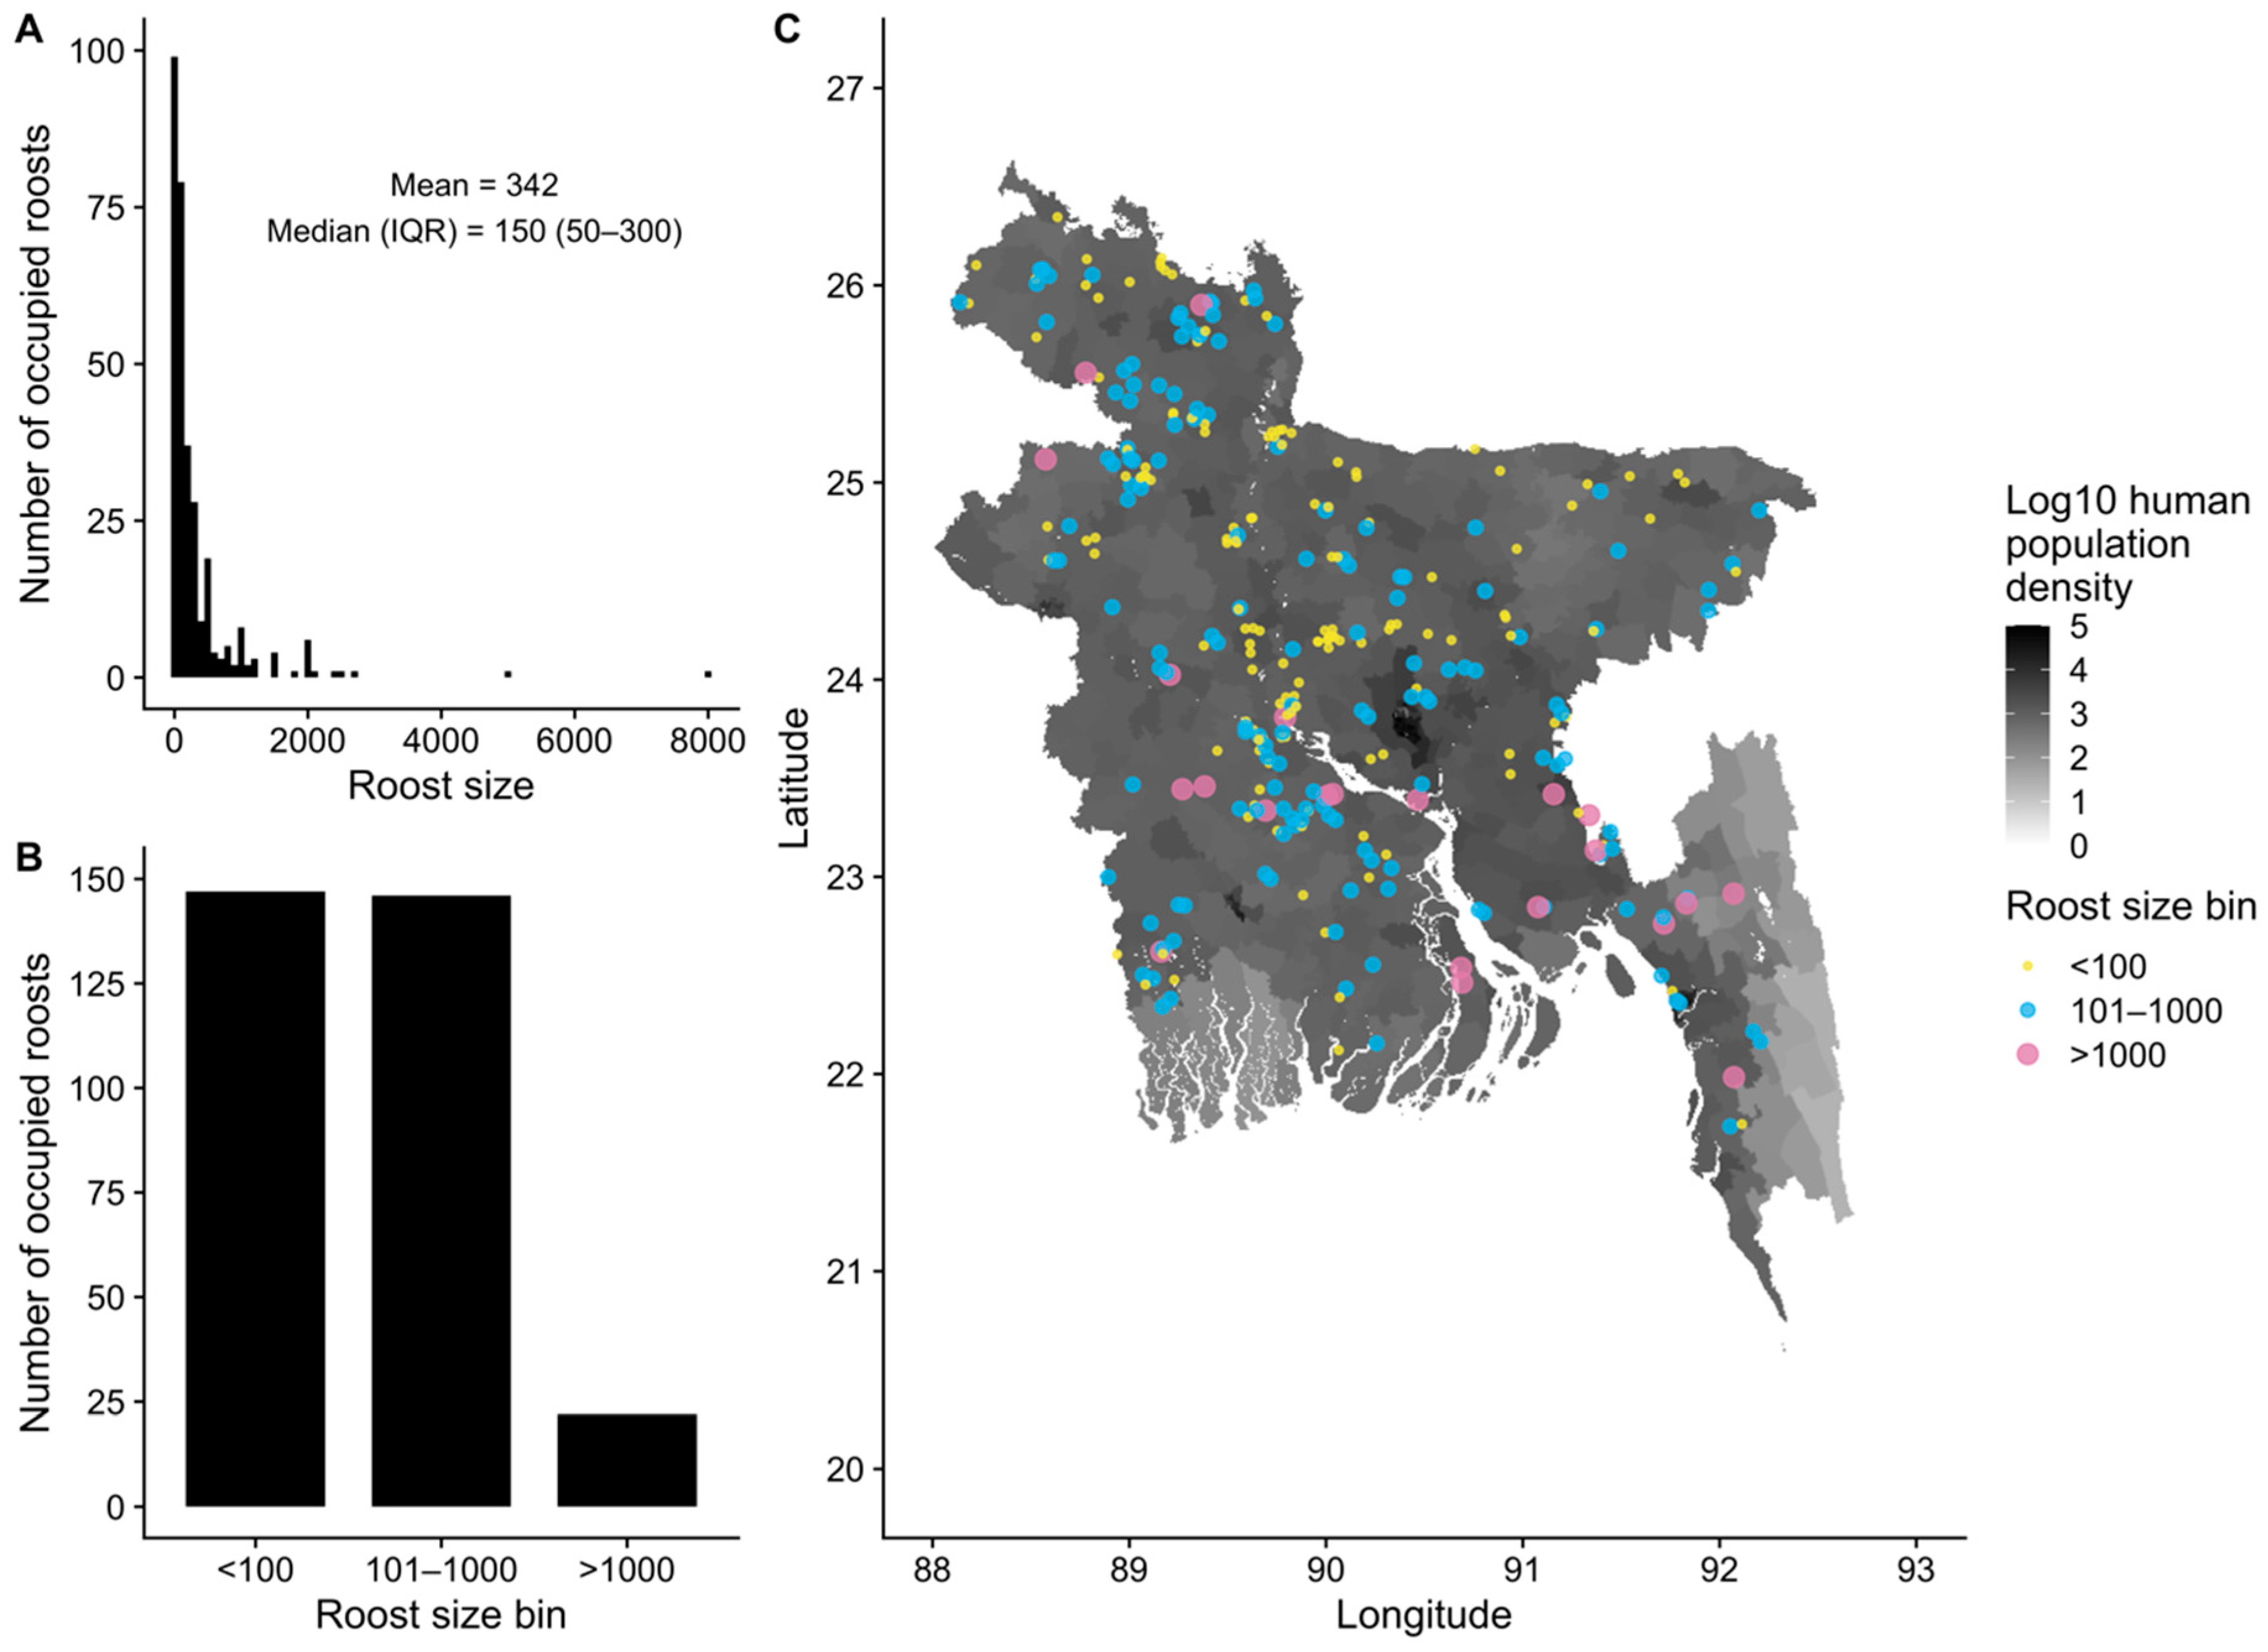
3.2. Spatial Distribution and Sizes of Pteropus medius Roosts

Interviewers mapped a total of 474 roost sites in and around 204 villages, 315 that were occupied at the time of the interview and 159 that were unoccupied. According to interviewees, most occupied roosts (186, 59%) were reported as being at least occasionally occupied for more than 10 years, with an average occupancy duration of 8.5 years (Figure 2A). The majority (294, 93%) of roosts were reported to be continuously occupied every month within the last year, with an average duration of 11.6 months (Figure 2B). This pattern of continuous occupancy was reported by interviewees to have been similar over the last 10 years (Figure 2C). Interviewees generally could not recall what season bats began roosting at sites; however, when reported, roosts were first occupied more frequently in winter than other seasons (Figure S6A, Supplementary Materials). When considering intermittently occupied roost sites (<12 months of occupancy in a year), bats were also more likely to be present at roost sites during winter (Figure S6B, Supplementary Materials).
The size of occupied roosts varied widely, from only one bat to an estimated 8000 bats at one roost in west–central Bangladesh, with a median size of 150 bats (Figure 3A,B). Studies of P. medius demonstrate that this distribution of individual roost sizes is similar to those reported in Pakistan, India, Nepal, and Sri Lanka [104,105,106,107,108,109,110]. This contrasts with reports of much larger roosts of thousands of P. lylei in Cambodia and Thailand [20,111], and roost sizes of P. alecto and P. poliocephalus in Australia estimated in the tens of thousands [112,113,114].
Roost sizes did not appear to be spatially clustered, such that large and small roosts are intermixed throughout the country (Figure 3C). The clustering of roosts in the central and northwest regions of Bangladesh appears to be a spatial artefact of the sampling design, which targeted roost sites predominantly in and nearby villages where Nipah virus spillover events have occurred (Figure S7, Supplementary Materials). Following model selection using LASSO, the remaining spatial covariates generally had poor explanatory power for roost occupancy (presence/absence of bats) and abundance (roost size), with R2 of 15% or less for testing and training sets (Table 1). Area under the receiver operating characteristic curve (AUC) was 70% or less for models of occupancy, which indicates poor discriminatory power for predicting occupied and unoccupied roosts [115].
These results broadly indicate that bat roosts are not linearly associated with the available covariate data and largely reflect the geography of nearby villages that were surveyed (Tables S5 and S6, Supplementary Materials). For example, an average roost site is situated in an area with high human population density, close to inland water bodies, with a nearby feeding site (fruit trees) or date palm tree within 5 km, and numerous feeding sites or date palm trees within a 15 km radius around the site (Table 2; Figure S8, Supplementary Materials). This pattern is consistent with Bangladesh as a whole, where human population density is high everywhere (Figure 3C) and villages contain numerous potential fruit and date palm trees that could attract bats (Figure S7, Supplementary Materials). Only seven out of 474 roost sites had no date palm trees or feeding sites within 15 km of the roost site. However, all of these roost sites had a date palm tree or feeding site within 25 km of the roost site. Roost sizes showed similarly static distributions compared to the other 28 covariates assessed (Table S1 and Figures S9–S11, Supplementary Materials). Similar to other studies of P. medius, roost sites were close to water bodies (Table 1) [105,106,109], but distance to water did not explain variation in the occupancy or abundance of bats at roost sites (Tables S5 and S6, Supplementary Materials).
Despite the widespread distribution of bat roost sites and the presence of some relatively large roosts (>1000 bats), interviewees report that, with respect to their own memory, most roosts are decreasing in size (Figure 4A). These patterns support anecdotal reports of decreasing P. medius populations from biologists and bat hunters, a trend attributed to cutting of roost trees and overhunting [66,67]. Local Nipah virus spillover investigation teams have reported that village residents will often cut down roost trees within villages after an outbreak [44]. In support of this, we observed that roost sites in and around Nipah virus case villages had more unoccupied roosts than control villages that were either near (>5 km) or far (>50 km) from case villages (Figure 4B). In addition to cutting down roost trees, interviewees listed a number of other reasons that bats left a roost site, including that bats were hunted, or bats were harassed with rocks, mud, sticks, or gunfire (Figure 4C).

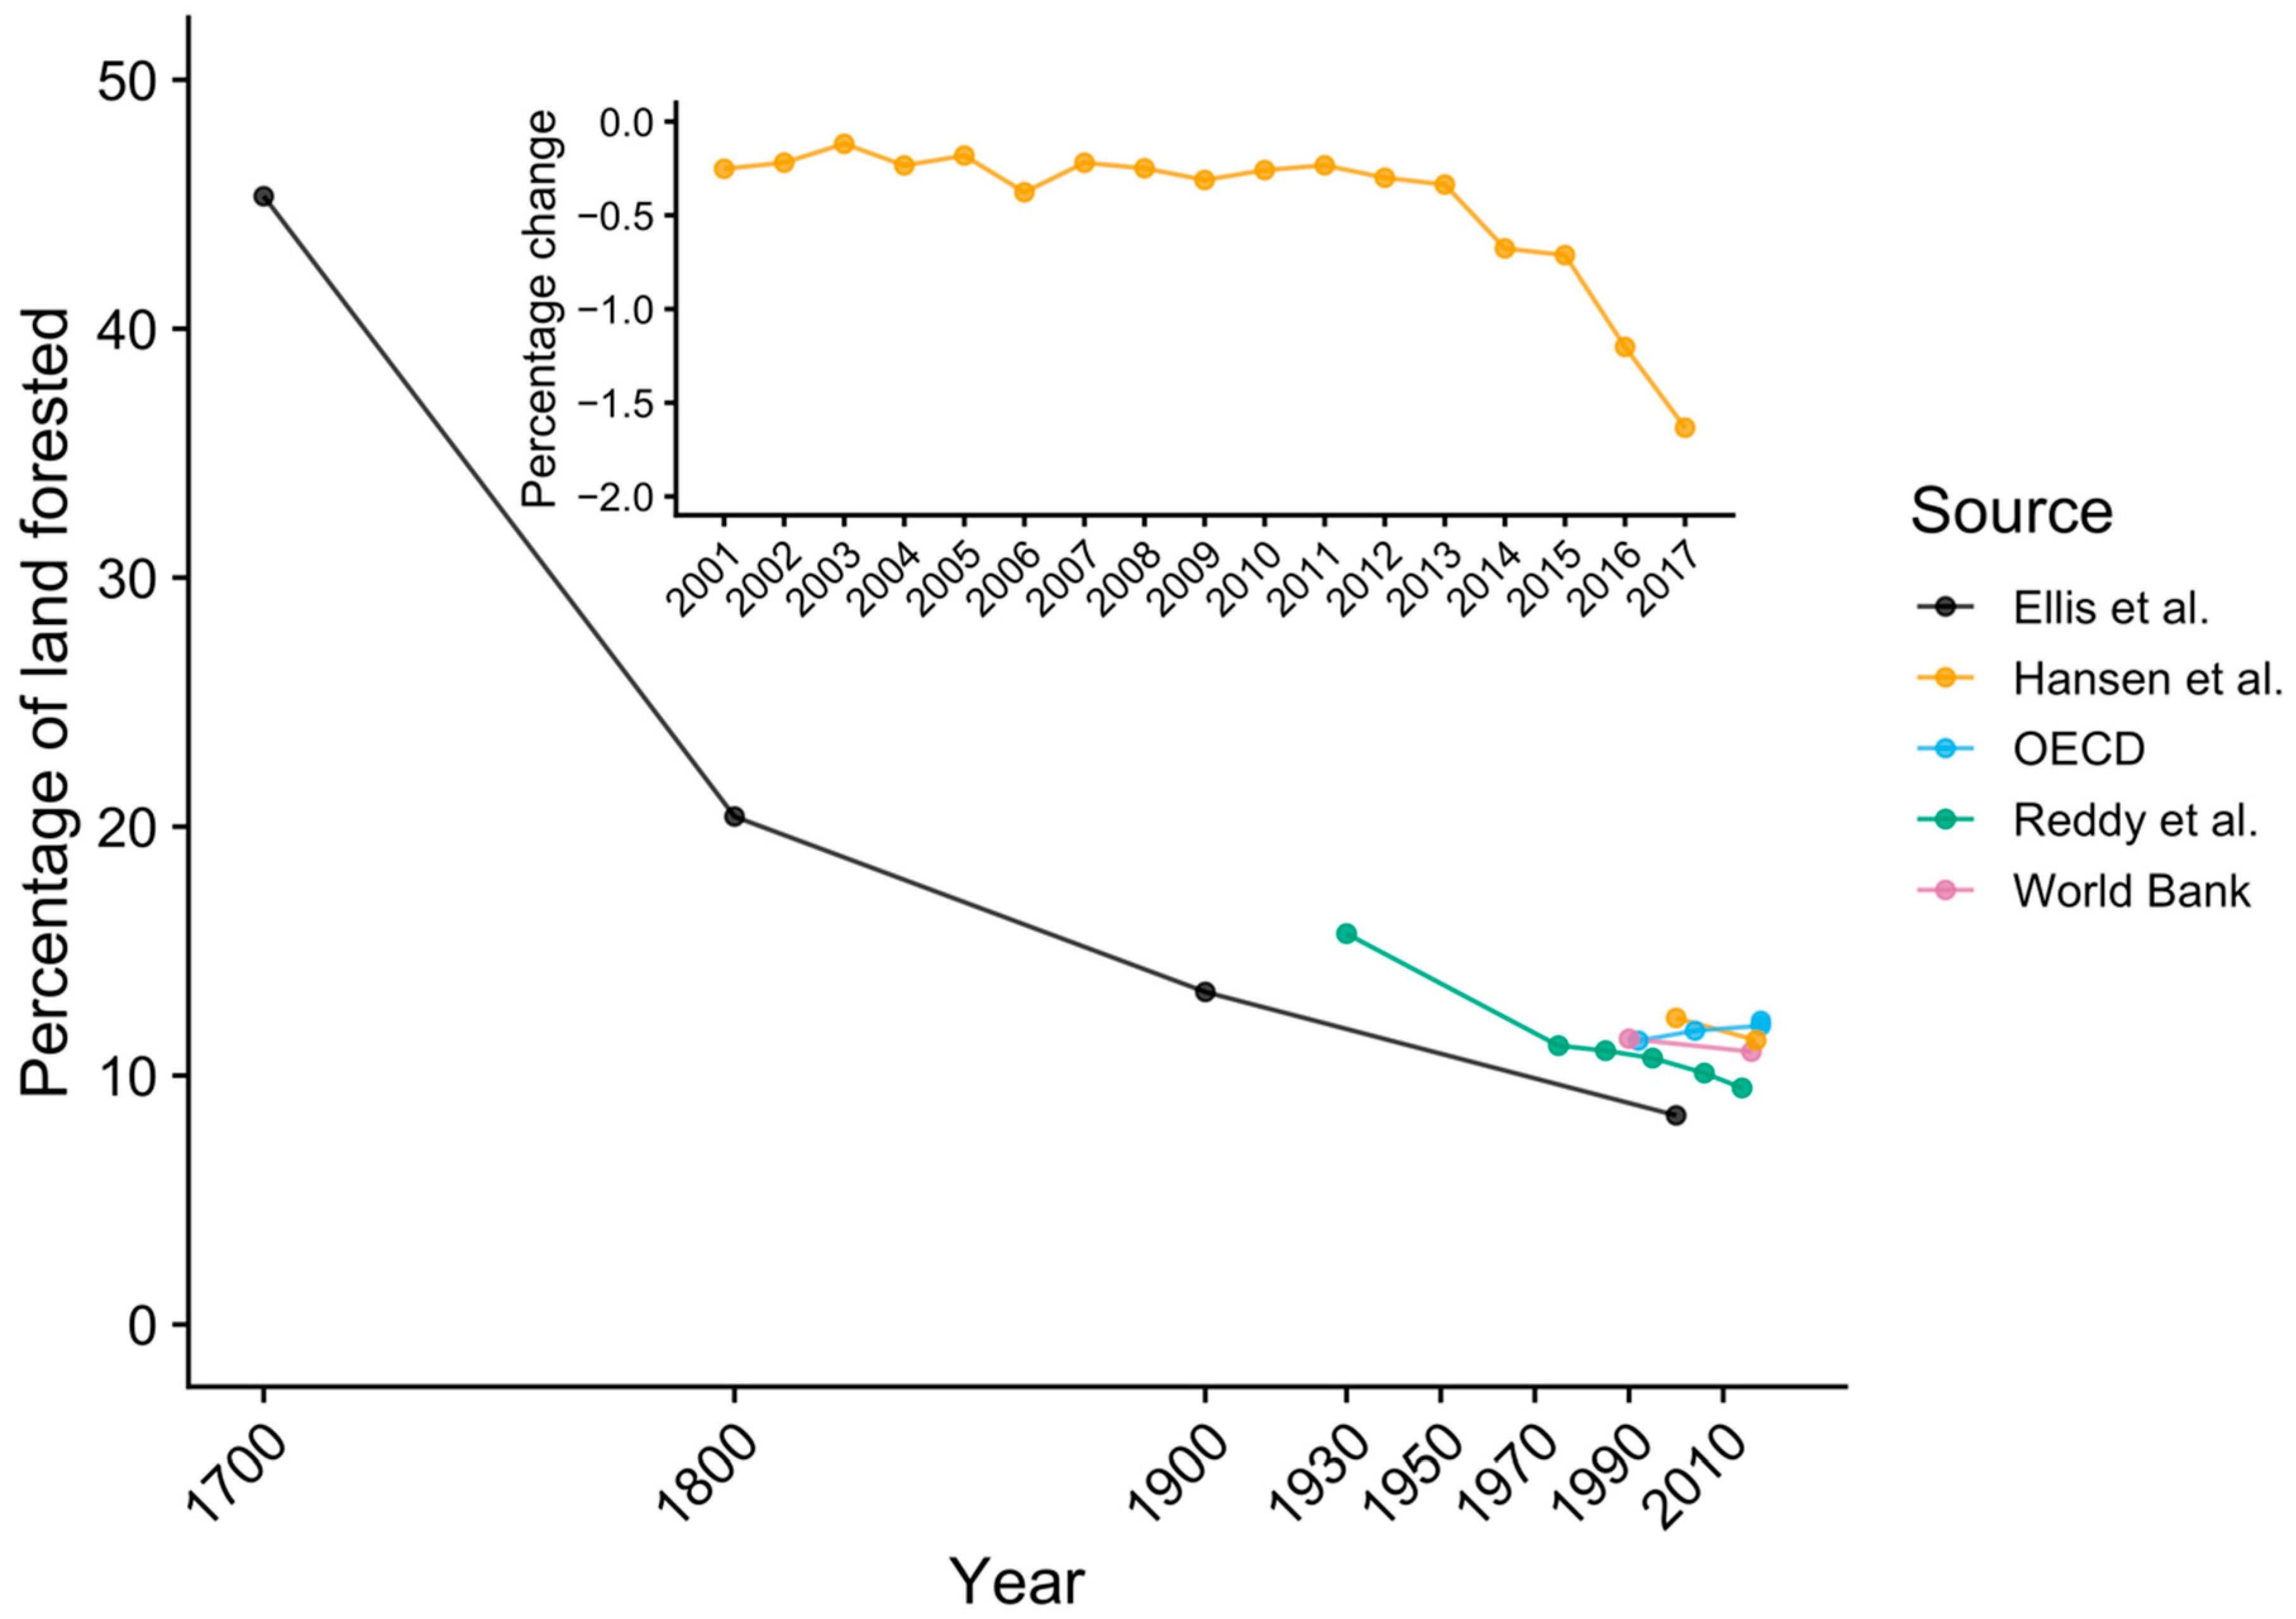
3.3. Historical Land-Use Change in Bangladesh

According to the collated data, the majority of forest loss in Bangladesh occurred prior to the 20th century but has steadily continued to the present (Figure 5). Prior to human occupation of the land area comprising Bangladesh, the whole country was likely covered in dense tropical forest, similar to neighboring countries in Southeast Asia [87]. Evidence of human occupation in Bangladesh dates back at least 20,000 years, rice cultivation and domesticated animals occurred before 1500 Before the Common Era (BCE), and sedentary urban centers were seen by the fifth century BCE [116]. Clearing of land for rice cultivation continued through to the 16th century CE, by which time rice was being exported from the Bengal delta to areas of South and Southeast Asia. During Mughal rule over the Bengal delta starting in the 1610, the Ganges (Padma) River shifted eastward; thus, Mughal officials encouraged colonists to clear forests and cultivate rice in eastern Bangladesh [116]. The result was that much of the native forests in Bangladesh were converted to cultivated land prior to 1700 (Figure 5).
Following the Battle of Plassey in 1757, the British East India Company took control of the country and established Permanent Settlement, a system of land taxation that set a fixed tax burden for landholders (zamindars). While the intention was that the fixed tax rates would allow zamindars to invest more in agricultural development of the land through better seeds, irrigation, and tools, this never materialized. Since the British would auction the zamindars’ land if they fell behind on their tax obligation, land became a valuable commodity that was bought and sold by wealthy bureaucrats and zamindars. This fostered a hierarchical system where the peasantry working the land paid rent but had no property rights, while landowners were only attached to the land through a series of intermediary managers. To meet their tax obligation and collect rent from tenant farmers, landowners encouraged cultivation of cash crops (cotton, indigo, sugarcane, silk, tea, tobacco, and jute) meant for export in the global market. Agrarian production increased not through agricultural intensification of already cultivated land, but through clearing of native forest. Forest cover declined dramatically during the 1700s and 1800s (Figure 5; Figure S12, Supplementary Materials) and the system of Permanent Settlement existed with some modifications until the 1950s [116].
Production of sugar for export and local consumption came predominantly from sugarcane during the colonial period, but a minor proportion (perhaps 10–15%) was produced from date palm sap from cultivated Phoenix sylvestris. While, historically, date palm sugar was used locally for the preparation of sweetened foods, it became integrated into the global sugar trade starting in 1813, and the value of date palm sap increased. The number of date palms in Bangladesh increased rapidly from the 1830s and remained high until at least the early 1900s, propelled by British encouragement of landowners and the development of mills by the British to produce sugar from date palm sap [65]. Roughly 1370 mt of raw sugar (gur) was produced from date palm sap on average during 1792–1813 in Bangladesh, which increased to 38,000 t of gur in 1848 and 162,858 t by 1905, and then decreased to 66,930 t by 1911 [65]. The most recent figures from the Bangladesh Bureau of Statistics for 2016–2017 put the area of Bangladesh under date palm cultivation for sap at 20.8 km2 with a production of 169,056 mt of palm sap (perhaps 10% of which might be converted to gur) [117,118]. This is compared to 920 km2 under sugarcane producing 3,862,775 t of sugarcane juice during the same year [117].
Today, Bangladesh has less than 14% of its forest remaining (Figure 5), and the only dense forests are restricted to the southwestern mangrove forests of the Sundarbans and the southeastern forests of the Chittagong Hill Tracts (Figure S12, Supplementary Materials). The portion of the Sundarbans in Bangladesh is a protected as the Sundarban Reserve Forest containing three large wildlife sanctuaries. The region of the Chittagong Hills enjoyed a level of political autonomy during Mughal rule and was also the last part of Bangladesh to come under state rule after the British invaded in 1860, but it retained some regional autonomy in their system of taxation and land rights [116]. Combined with the more rugged terrain of this region, intensification of industrial forestry and agricultural production was delayed until the 1900s, and this region remains one of the least populated areas of the country (Figure 3). These conditions have, thus, preserved much of the primary forest until the present (Figure S12, Supplementary Materials). The conditions in neighboring Myanmar were similar, as the British did not begin their rule of the country until 1824. Prior to British rule, Myanmar’s agricultural economy was not as export-focused compared to Bangladesh, but this shifted toward intensified production of rice for export during the colonial period [119]. Partly due to a delayed agricultural intensification imposed by the British, trees still cover around half of Myanmar’s land area [89], and the population density was only 77 persons/km2 in 2010 [76].
Recent deforestation in Bangladesh has continued at a steady pace, with a net rate of 0.75% or less per year during 1930–2014 [92], and is concentrated in eastern Chittagong Division (Figure S13, Supplementary Materials). However, there has been a rise in deforestation since 2013 (Figure 5, inset). Additionally, felling of tall trees continued even in largely deforested areas of Bangladesh for the purpose of curing tobacco leaves and brick burning [71]. Since P. medius relies on tall tree species such as banyan (Ficus benghalensis) to form large roosts [77], the loss of single tall trees can scatter bats into ever smaller populations.

4. Discussion

4.1. Historical Land-Use Change, Bat Ecology, and Nipah Virus Spillover

Given the nearly two decades of research on Nipah virus in Bangladesh, there are facets of its ecology that are now clear. Historical patterns of forest loss have drastically diminished native habitat for fruit bats. Pteropus medius bats now live in mostly small, resident roosts in close proximity to humans and opportunistically feed on cultivated food resources. These gradual but dramatic changes have produced a system that facilitates spillover of a bat-borne virus. The consequence is almost annual spillover of Nipah virus in winter months following consumption of raw or fermented date palm sap that has been contaminated with bat excreta containing Nipah virus.
Our analysis suggests that the current state of the bat–human ecological system in Bangladesh supports Nipah virus spillover: a mobile metapopulation of reservoir hosts living amongst humans and sharing food resources that has likely existed for many years prior to the first recognized outbreaks. While the loss of forests in Bangladesh is still occurring and potentially affecting the distribution of P. medius, the majority of the land-use change from forest to cultivated areas occurred at least a century ago (Figure 5). Cultivation of date palm trees for their sap and other products is a tradition that has likely been practiced for centuries [120], and bats have been potentially consuming sap for an equal amount of time. Importantly, the date palm sap industry was greatly expanded by the British during the late 19th and early 20th centuries and continues at a similar scale to the present [65,117]. Time-calibrated phylogenetic analyses indicate that Nipah virus has been circulating in P. medius in Bangladesh and India since the 1950s or earlier [10,121,122]. Thus, none of the conditions that promote Nipah virus spillover in Bangladesh are new. Spillovers almost certainly occurred in the past but were undetected prior to the first isolation of Nipah virus in 1999 and the subsequent development of diagnostic tests. Even recent outbreaks since surveillance was established in 2007 might have been missed. Hegde et al. found that, because encephalitis case patients are less likely to attend a surveillance hospital if it is distant from their home and if their symptoms are less severe, at least half of all Nipah virus outbreaks during 2007–2014 were likely missed [123].
The ecological state of Nipah virus in Bangladesh has important similarities and differences with the ecology of the related Hendra virus in Pteropus spp. in Australia. Spillover events from bats primarily occur in the cooler, dry winter months in both Australia and Bangladesh, and evidence from Australia suggests that this season is when bats are potentially experiencing nutritional stress, are residing in small roosts close to humans, and are shedding more viruses [28,124]. In contrast to P. medius in Bangladesh, Pteropus populations in Australia exhibit a range of population sizes and behaviors, from large, nomadic groups that track seasonally available nectar sources to small, resident colonies that feed on anthropogenic resources [112]. The increasing incidence of Hendra virus spillovers is linked with periods of acute food shortage that shift bats from nomadism to residency and drive bats to feed on suboptimal food sources, thereby exacerbating stress and associated viral shedding (Eby et al., in review) [125].
We propose that the systems of Nipah virus in Bangladesh and Hendra virus in Australia represent distinct points on a continuum describing patterns of bat aggregation and feeding behavior in a landscape of available roosting sites and food resources (Figure 6). One end of the spectrum is characterized by seasonal shifts from smaller populations to large aggregations of bats in response to transient pulses in fruit and nectar resources (fission–fusion). The other end of the spectrum represents a permanent state of fission, where bats are distributed in small, mostly resident roosts in a matrix of anthropogenic food resources. Bangladesh appears to fall at the latter end of the spectrum, wherein historical land-use change and urbanization removed the native forest habitats that supported Pteropus medius populations, leaving limited roosting sites but abundant cultivated fruits that are sufficient for sustaining small populations of bats. Australia would traditionally have been on the opposite end of the spectrum, but loss of winter habitat and urban encroachment may be pushing the system toward more permanent fission, which could result in more consistent spillovers of Hendra virus (Eby et al., in review) [125]. Similar anthropogenic pressures acting on pteropodid bat populations in Southeast Asia or Africa could push these systems into a state similar to Bangladesh, consequently increasing the risk of henipavirus spillover [28].
The proposed shift in P. medius roosting behavior may have modulated the frequency of spillovers into human populations in multiple ways. The frequency of spillovers depends on a cascade of events including viral shedding by reservoir hosts, survival of the virus in the environment, and human behavior that leads to exposure to the virus [7]. Decreasing roost sizes would be expected to decrease density-dependent transmission of a virus. However, it is unclear whether henipavirus transmission dynamics are entirely driven by density-dependent processes [28]. It is also unknown whether fruit bat density within roosts scales with overall roost size. There is evidence from P. medius in India that larger colonies occupy more roost trees [105]. Such behavior could keep absolute bat density constant, thereby mitigating any changes in intra-roost virus transmission. Furthermore, virus transmission dynamics are not isolated to individual roosts, but are connected with other roosts as a metapopulation via bat movement. At the landscape level, the association between roost density and spillover risk is also unclear. In Bangladesh, there were greater numbers of P. medius roosts in villages with reported Nipah virus spillovers, and both smaller roosts and the occurrence of human Nipah virus cases were associated with greater forest fragmentation [78]. Multiple studies of Pteropus populations in Australia indicate that the landscape density of bat roosts, not the population density of bats, is associated with Hendra virus spillover [28]. This association may be driven by the availability of cultivated food resources and shifts in bat feeding behavior, which would increase the probability of human exposure to henipaviruses. Therefore, while decreases in roost size may decrease density-dependent transmission among roosting bats, the landscape-level effects on roost density, proximity to human populations, and food resource use could counteract this effect and result in a greater probability of virus spillover.

4.2. Seasonality of Date Palm Sap Consumption and Spillovers

Beyond the broad ecological forces that facilitate henipavirus spillover from bats, there are epidemiological patterns that will require further research to explain. Perhaps the most complex are the causes of winter seasonality in Nipah virus spillovers. Recent evidence suggests that P. medius shed Nipah virus at low levels throughout the year but with no consistent periodicity or seasonality across years [67]. There was also poor correspondence in the timing of viral isolation from bats, low seroprevalence in bat populations, and observed spillover events [67]. Periods of increased Nipah virus transmission in bat populations were not explained by seasonal birth pulses [126] but were instead attributed to increases in bat population density, waning immunity in adult and juvenile bats, and potential viral recrudescence in previously infected individuals [67]. Date palm trees are tapped year-round for tari production, but harvesting increases during winter months to meet increased demand for tari and fresh sap [45,47]. Visits by P. medius to date palm trees are more frequent in winter [60], even when date palms are tapped year-round for tari production (Islam et al., in review). Therefore, the risk of viral spillover is always present, but may increase during winter because bats are capitalizing on a resource when it is most available, thereby increasing the probability that sap is contaminated during the winter harvest. While infection dynamics in bats could theoretically result in higher levels of shedding during winter, aligning with peak human consumption of date palm sap, there is no evidence that this is a consistent annual pattern [67].
The observation that more Nipah virus spillovers occur during years with colder winters indicates that climate is affecting one or more factors in the system: date palm physiology, bat and human behavior, bat physiology and immunology that affect viral replication, or some combination of these factors. Date palm sap collectors report that date palm sap is sweeter and flows more freely during cooler weather [47,60,65]. These might be physiological responses of Phoenix sylvestris to seasonal weather conditions (e.g., sugar or water is concentrated in the trunk during cool, dry weather), yet no data are available on variation in sap flow or sugar content for this species outside of winter months [65]. Harvesting date palm sap when it is sweetest would be optimal not only for the collectors, but also for bats. Fewer cultivated fruits are available during winter than other seasons [62]; hence, bats may gravitate toward date palms because it is readily available during a time of relative food scarcity. More surveys of P. medius feeding behavior and the fruits they consume at different times of the year would be necessary to assess this hypothesis [127]. Complementary experiments could be performed to evaluate whether pteropodid bats perceive small differences in sugar concentration and modify their feeding behavior in response to varying energy demands [128].
Another hypothesis, derived from research on Hendra virus in Australian bats, posits that bats shed viruses more frequently during periods of nutritional stress that compromise bat immune function [28,129]. Increased metabolic demands of thermoregulation during winter when food resources are already limited could produce physiological and nutritional stress in bats. Bats may seek out alternative foods (e.g., date palm sap) to compensate for this stress. Whether P. medius are shedding more Nipah virus when they are experiencing physiological or nutritional stress in winter is an open question. We need more documentation of body condition, biomarkers of stress and immune function, or abortion rates among female bats to understand any relationships among Nipah virus shedding, stress, and climate [28,130,131,132].
We also lack information on how seasonal bat movements might influence Nipah virus spillover dynamics. Although our data suggest that most roost sites are continuously occupied (Figure 2), there may still be some seasonal dynamics in bat population sizes as individuals make occasional movements to use seasonally available resources or aggregate for mating. There is evidence from India and Nepal that P. medius roost populations vary seasonally, with larger populations in fall and winter than in summer [133,134]. This is mirrored by our data showing winter is the season when more roosts were founded and bats are present at intermittently occupied sites (Figure S6, Supplementary Materials). There is also evidence that P. medius home ranges contract during the dry season (including winter) in comparison to the wet season [67]. Nevertheless, genetic data on P. medius and Nipah virus in Bangladesh indicate that bat movements are common enough to promote genetic admixture and spread distinct Nipah virus genotypes among geographically distant P. medius populations [10]. To better understand how bat movements influence spillover dynamics, we need more information on seasonal variation in bat population sizes at roost sites and potentially individual movement tracking data, which could be used to parameterize metapopulation models of Nipah virus transmission.

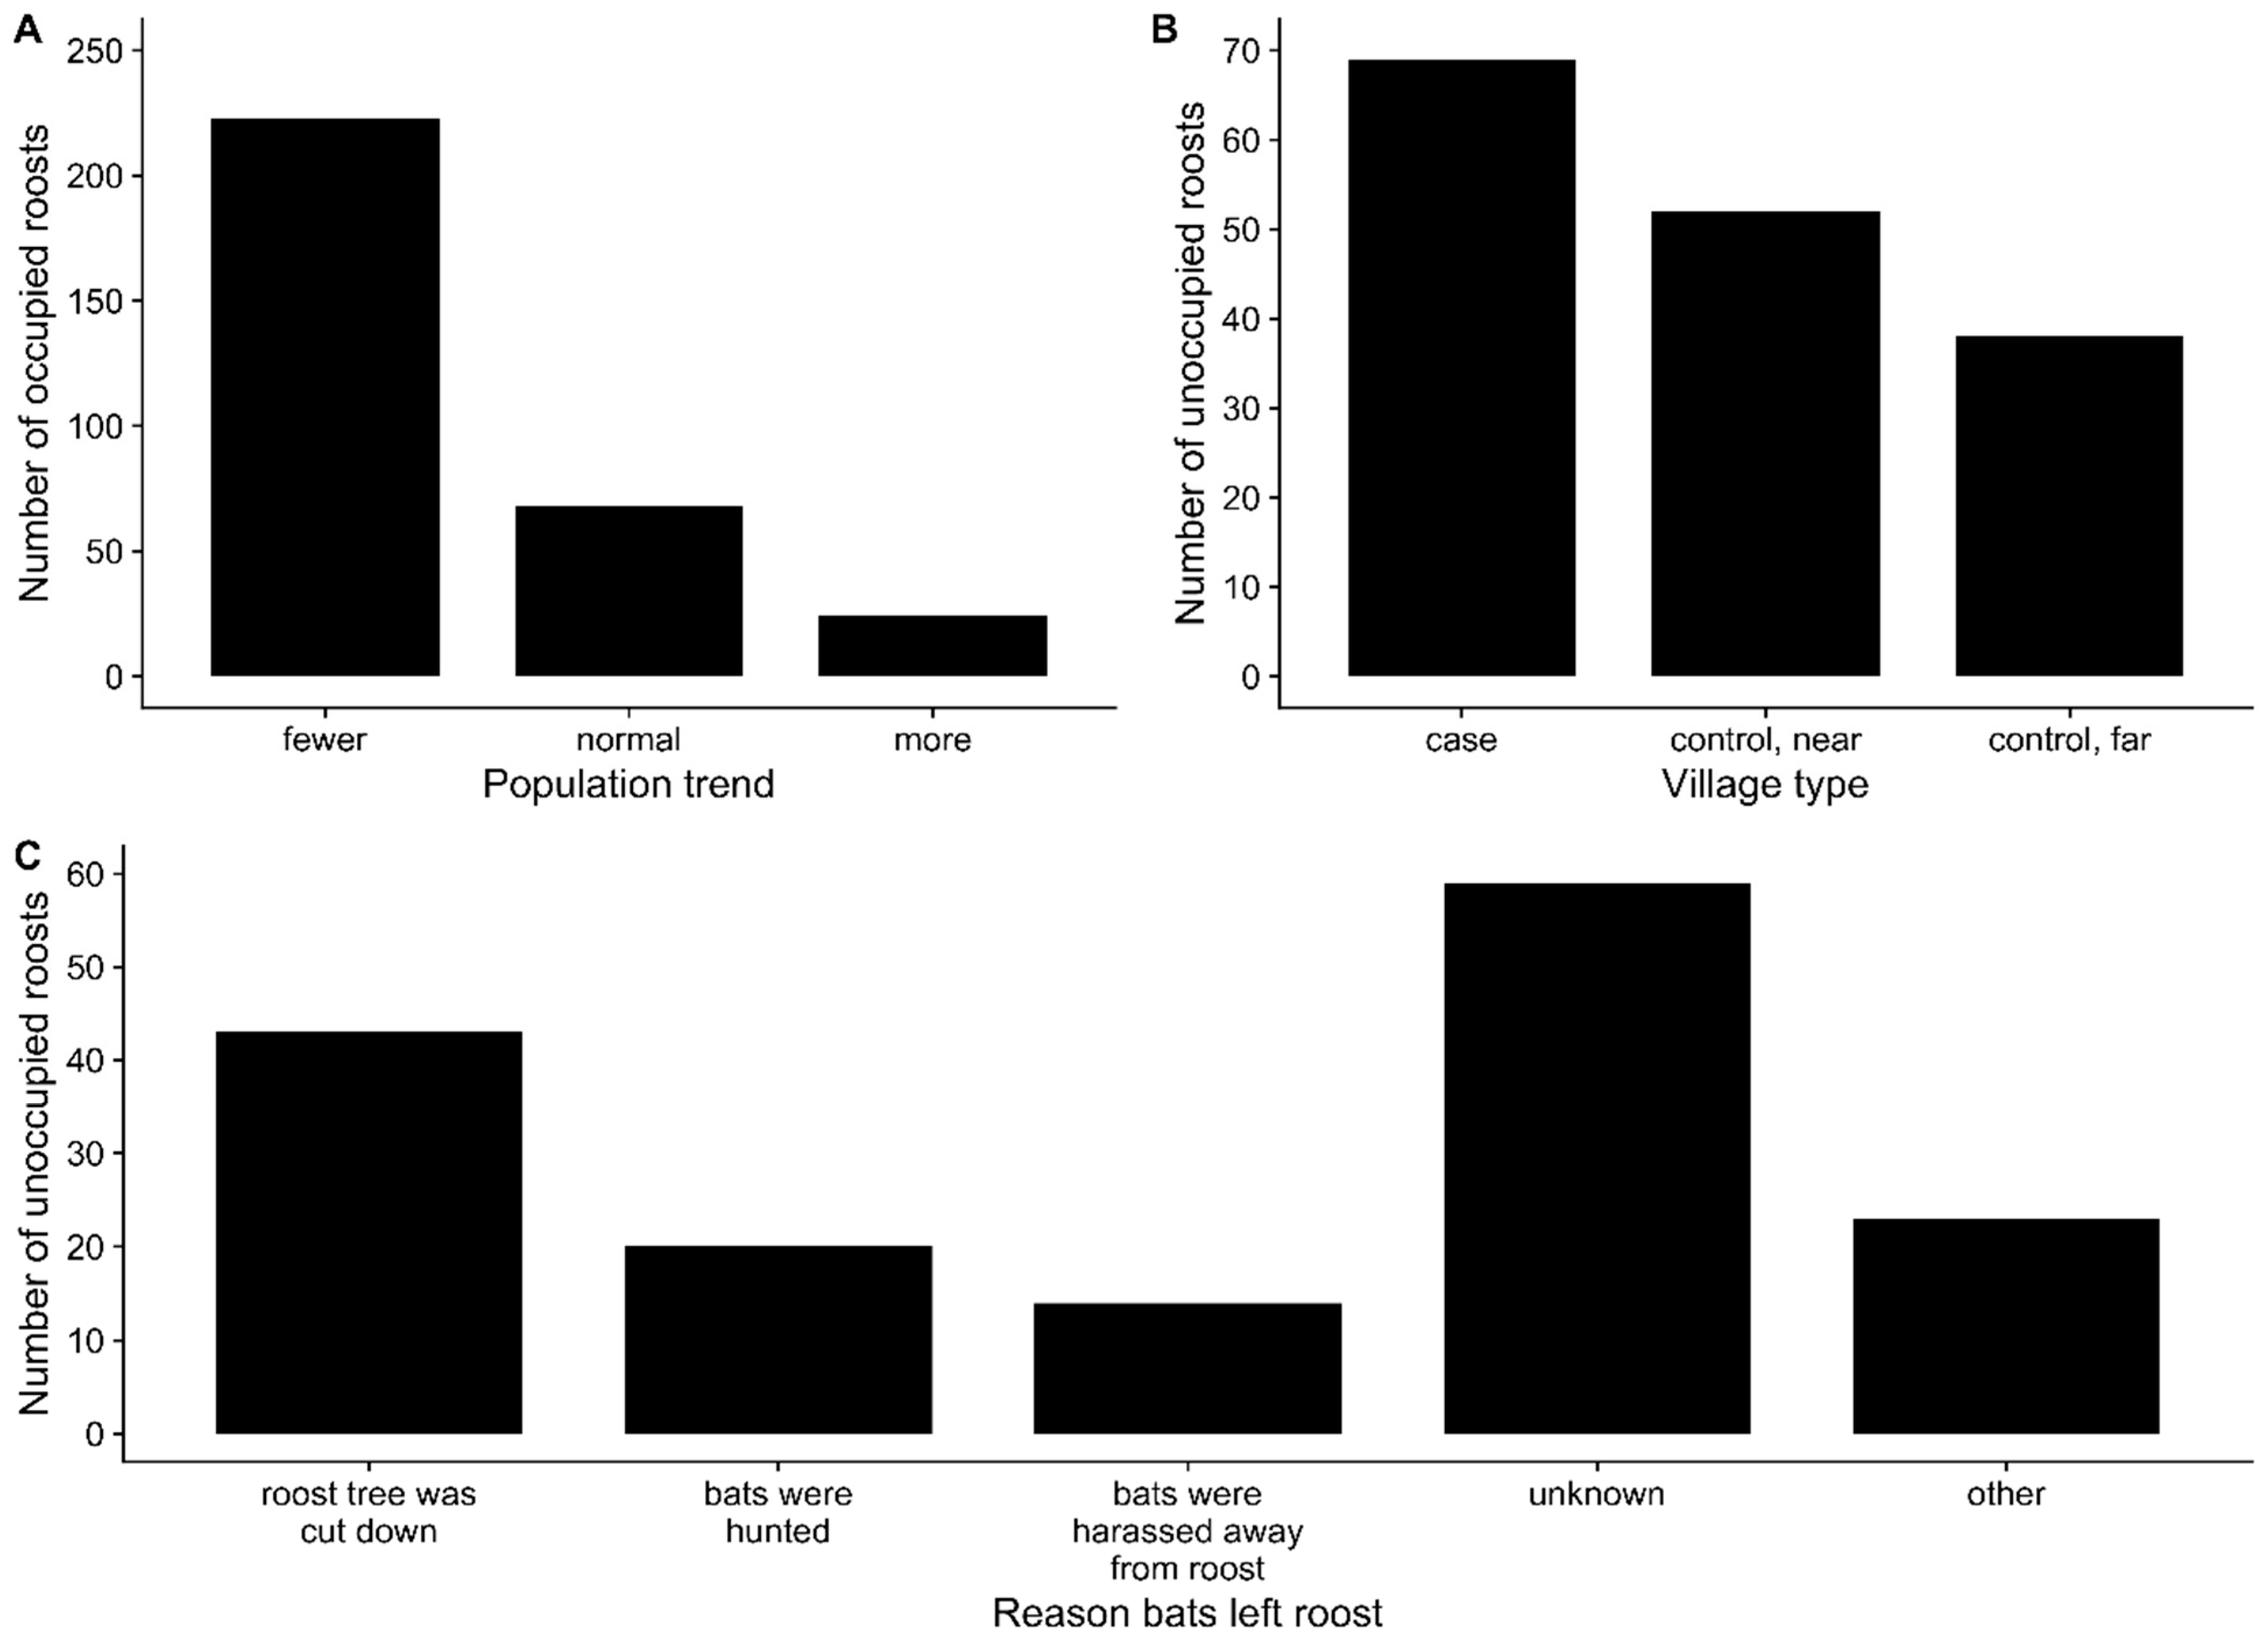
4.3. Roost Tree Loss and Pteropus Roosting Behavior

In addition to the causes of seasonality in Nipah virus spillover, more research is needed to determine the effects of current deforestation and human disturbance on P. medius populations. While historical patterns of deforestation and land-use change have undoubtedly reduced available habitat for pteropodid bats (Figure 5), the effects of current deforestation may be easiest to measure at the scale of individual roost trees. If a single tree in a largely deforested area has qualities that are preferred by bats and, therefore, supports a large population of bats, loss of that tree could have a very large effect on the bat population but would contribute very little to overall deforestation rates. Our statistical analysis was unable to explain substantial variation in the occupancy and size of roosts using available data on spatial covariates, including land-use, human population density, bioclimatic variables, and distribution of cultivated fruit and date palm trees (Table 1; Table S1, Supplementary Materials). Similar results were observed for P. medius populations in Uttar Pradesh, India [105]. Kumar and Elangovan [105] were unable to explain variation in colony size using data on distance to human settlements, roads, or water bodies. However, they did find that colony size increased with tree height, trunk diameter, and canopy spread. The majority of colonies were found in tree species with wide canopies, including Ficus spp., mango, Syzygium cumini, and Madhuca longifolia [105]. Hahn et al. [77] compared occupied roost trees to non-roost trees within a 20 × 20 m area around central roost trees and found that P. medius in Bangladesh favor tall canopy trees with large trunk diameters. Therefore, future efforts to understand variation in P. medius population sizes across Bangladesh should collect more data on characteristics of roost trees. Furthermore, the sampling design of our population meant that no bat roosts could have been observed further than 5 km from a village, meaning that bat roosts in remnant forested areas in the Sundarbans and Chittagong Hills were much less likely to be included in the study (Figure S7, Supplementary Materials). Further surveys of roost sites may reveal distinct roosting patterns of P. medius populations living in these areas or in other areas within the range of P. medius where human population density is lower and forested habitat is more intact.
Our survey data also indicate that many roost sites are frequently abandoned following harassment, hunting, or removal of roost trees and that more unoccupied roosts are found near villages that have experienced Nipah virus spillover (Figure 4). Presumably, these bats disperse and form new roosts or join existing roosts, but the new roost trees may be of lower quality than the previous roost and only support a smaller population of bats. More granular data on the cumulative effects of roost tree loss on average P. medius population sizes would refine our conceptual model of shifting roosting behavior in pteropodid bats (Figure 6). Moreover, movements of bats following abandonment of roost sites could have implications for Nipah virus transmission dynamics. Dispersal of bats following roost tree loss or harassment could lead infected bats to seed outbreaks elsewhere [129]. Therefore, reactionary cutting of roost trees in villages with Nipah virus spillovers is counterproductive for spillover prevention and bat conservation and should be discouraged.

4.4. Possible Interventions to Prevent Nipah Virus Spillover

Lastly, there is a need to explore possible interventions to prevent Nipah virus spillover. Without a vaccine for Nipah virus, much of the research has focused on mitigating the risk of spillovers. Several studies in Bangladesh have centered on educating the public about the risks of drinking raw date palm sap and methods for preventing bat access to date palm sap during collection [135,136,137]. There is also a need for increased surveillance of bats and humans in close contact with bats in Bangladesh and other areas within the range of Pteropus bats. These enhanced surveillance efforts could include serosurveys of bat hunters, date palm sap collectors, people who drink sap or eat fruits that have been partially consumed by bats, and people who live in close proximity to bat roost sites [20,70,138,139]. While there has been no evidence that consuming fruits partially eaten by bats is associated with Nipah virus spillover to humans in Bangladesh and Cambodia [20,140], this route was believed to be the cause of the 1998–1999 outbreaks in pigs that led to human cases in Malaysia and Singapore [58]. A 2009 survey of livestock in Bangladesh living nearby to Pteropus bat roosts also found henipavirus antibodies in 6.5% of cattle, 4.3% of goats, and 44.2% of pigs [141]. Animals were more likely to be seropositive if they had a history of feeding on fruits partially eaten by bats or birds and drinking date palm juice from Asian palmyra palms (Borassus flabellifer) [141]. Therefore, Nipah virus transmission from livestock to humans in Bangladesh is a risk that should be explored with additional serosurveys and efforts to limit contact of livestock with fruits and other materials potentially contaminated with bat excreta.
Similar risks may apply in neighboring India where Nipah virus outbreaks have been linked to fruit bats [52,142]. The index case of a 2007 Nipah outbreak in West Bengal was reported to frequently drink date palm liquor (tari) and had numerous bats living in trees around their home [52]. Researchers speculate that the 2018 and 2019 outbreaks in Kerala, India, may be linked to consumption of partially eaten fruits [142]. However, this has not been confirmed via detection of Nipah virus on partially eaten fruits or case–control studies [43,48]. The index case associated with 23 cases of Nipah virus infection during the 2018 Kerala outbreak reported possible contact with an infected baby bat, but this was also not confirmed [43]. Silver date palm is not cultivated for sap in Kerala, but coconut palm and Asian palmyra palm are [43]. The narrow-mouthed containers that are used to collect sap from these palm species are thought to prevent bat access to the sap within the container [43] but might not prevent bats from accessing and contaminating sap at the tapping site or from inflorescences. Additional studies using infrared cameras to understand fruit bat feeding behavior around other palm tree species harvested for sap and possible intervention methods similar to those done in Bangladesh are warranted [60,135]. Such information would help to clarify how Nipah virus is transmitted from fruit bats to humans in India and allow for ecological comparison of outbreaks in these two neighboring countries.
At a higher level, methods that limit human–bat contact through ecological interventions may be beneficial. Plantations of fruit- and nectar-producing tree species could provide alternative food for P. medius, such as cotton silk (Ceiba petandra, Bombax ceiba), Indian mast tree (Polyalthia longifolia), and Singapore cherry (Muntingia calabura). Trees that produce fruit year-round or specifically during winter could provide bats with the required nutrition that would have been acquired from date palm sap or other cultivated fruits. In combination with methods to prevent bat access to date palm sap, ecological interventions that would allow P. medius populations to persist in Bangladesh and other areas while lowering the risk of Nipah virus spillover should be explored.

5. Conclusions

The ecological conditions that produce yearly spillovers of Nipah virus in Bangladesh are not a new phenomenon, but rather a culmination of centuries of anthropogenic change. The opportunistic feeding behavior of P. medius has allowed populations to adapt to these modified landscapes, persisting in small, resident colonies feeding on cultivated fruits. Shared use of date palm sap by bats and humans is a key route for Nipah virus spillover during winter months. Continued research on this system could reveal how bat behavior and physiology influence the seasonality of Nipah spillovers and explore potential ecological interventions to prevent spillover.

Supplementary Materials

The following are available online at https://www.mdpi.com/1999-4915/13/2/169/s1: Supplementary File. Supplementary tables and figures.

Author Contributions

Conceptualization, E.S.G., R.K.P., and P.J.H.; data curation, C.D.M., E.S.G., and H.S.; formal analysis, C.D.M.; visualization, C.D.M.; writing—original draft preparation, C.D.M.; writing—reviewing and editing, all authors. All authors have read and agreed to the published version of the manuscript.

Funding

C.D.M., E.S.G., S.P.L., R.K.P., and P.J.H. were funded by the DARPA PREEMPT program Cooperative Agreement D18AC00031, R.K.P. and P.J.H. were funded by the U.S. National Science Foundation (DEB-1716698), and R.K.P. was funded by the USDA National Institute of Food and Agriculture (Hatch project 1015891).

Institutional Review Board Statement

Not applicable.

Informed Consent Statement

Not applicable.

Data Availability Statement

Data on climate, geographic covariates, forest cover, and land-use for this study were retrieved from publicly available databases. Links to these databases have been provided in the References. The remaining data on Nipah virus spillover events and the locations of villages, date palm trees, and bat feeding sites presented in this study are not publicly available due to legal and privacy reasons. Interested parties should apply with icddr,b to access these data.

Acknowledgments

We thank Peggy Eby and Birgit Nikolay for early discussions on data sources and analyses. Manuscript development was supported by DARPA (Defense Advanced Research Projects Agency) through Johns Hopkins University. icddr,b acknowledges with gratitude the commitment of DARPA to its research efforts. icddr,b is also grateful to the Governments of Bangladesh, Canada, Sweden, and the UK for providing core/unrestricted support.

Conflicts of Interest

The authors declare no conflict of interest.

References

  1. Armstrong, G.L.; Conn, L.A.; Pinner, R.W. Trends in infectious disease mortality in the United States during the 20th century. JAMA 1999, 281, 61–66. [Google Scholar] [CrossRef] [PubMed] [Green Version]
  2. Cohen, M.L. Changing patterns of infectious disease. Nature 2000, 406, 762–767. [Google Scholar] [CrossRef]
  3. Murray, C.J.L.; Vos, T.; Lozano, R.; Naghavi, M.; Flaxman, A.D.; Michaud, C.; Ezzati, M.; Shibuya, K.; Salomon, J.A.; Abdalla, S.; et al. Disability-adjusted life years (DALYs) for 291 diseases and injuries in 21 regions, 1990–2010: A systematic analysis for the Global Burden of Disease Study 2010. Lancet 2012, 380, 2197–2223. [Google Scholar] [CrossRef]
  4. Hansen, V.; Oren, E.; Dennis, L.K.; Brown, H.E. Infectious disease mortality trends in the United States, 1980–2014. JAMA 2016, 316, 2149–2151. [Google Scholar] [CrossRef] [PubMed] [Green Version]
  5. Woolhouse, M.E.J.; Gowtage-Sequeria, S. Host range and emerging and reemerging pathogens. Emerg. Infect. Dis. 2005, 11, 1842–1847. [Google Scholar] [CrossRef]
  6. Jones, K.E.; Patel, N.G.; Levy, M.A.; Storeygard, A.; Balk, D.; Gittleman, J.L.; Daszak, P. Global trends in emerging infectious diseases. Nature 2008, 451, 990–993. [Google Scholar] [CrossRef]
  7. Plowright, R.K.; Parrish, C.R.; McCallum, H.; Hudson, P.J.; Ko, A.I.; Graham, A.L.; Lloyd-Smith, J.O. Pathways to zoonotic spillover. Nat. Rev. Microbiol. 2017, 15, 502–510. [Google Scholar] [CrossRef] [Green Version]
  8. Daszak, P.; Olival, K.J.; Li, H. A strategy to prevent future epidemics similar to the 2019-nCoV outbreak. Biosaf. Health 2020, 2, 6–8. [Google Scholar] [CrossRef]
  9. Hsu, V.P.; Hossain, M.J.; Parashar, U.D.; Ali, M.M.; Ksiazek, T.G.; Kuzmin, I.; Niezgoda, M.; Rupprecht, C.; Bresee, J.; Breiman, R.F. Nipah virus encephalitis reemergence, Bangladesh. Emerg. Infect. Dis. 2004, 10, 2082–2087. [Google Scholar] [CrossRef]
  10. Olival, K.J.; Latinne, A.; Islam, A.; Epstein, J.H.; Hersch, R.; Engstrand, R.C.; Gurley, E.S.; Amato, G.; Luby, S.P.; Daszak, P. Population genetics of fruit bat reservoir informs the dynamics, distribution and diversity of Nipah virus. Mol. Ecol. 2020, 29, 970–985. [Google Scholar] [CrossRef]
  11. Chua, K.B.; Koh, C.L.; Hooi, P.S.; Wee, K.F.; Khong, J.H.; Chua, B.H.; Chan, Y.P.; Lim, M.E.; Lam, S.K. Isolation of Nipah virus from Malaysian island flying-foxes. Microbes Infect. 2002, 4, 145–151. [Google Scholar] [CrossRef]
  12. Rahman, S.A.; Hassan, S.S.; Olival, K.J.; Mohamed, M.; Chang, L.-Y.; Hassan, L.; Saad, N.M.; Shohaimi, S.A.; Mamat, Z.C.; Naim, M.S.; et al. Characterization of Nipah virus from naturally infected Pteropus vampyrus bats, Malaysia. Emerg. Infect. Dis. 2010, 16, 1990–1993. [Google Scholar] [CrossRef] [PubMed]
  13. Sendow, I.; Field, H.E.; Adjid, A.; Ratnawati, A.; Breed, A.C.; Darminto; Morrissy, C.; Daniels, P. Screening for Nipah virus infection in West Kalimantan province, Indonesia. Zoonoses Public Health 2010, 57, 499–503. [Google Scholar] [CrossRef] [PubMed]
  14. Breed, A.C.; Meers, J.; Sendow, I.; Bossart, K.N.; Barr, J.A.; Smith, I.; Wacharapluesadee, S.; Wang, L.; Field, H.E. The distribution of henipaviruses in Southeast Asia and Australasia: Is Wallace’s line a barrier to Nipah virus? PLoS ONE 2013, 8, e61316. [Google Scholar] [CrossRef]
  15. Breed, A.C.; Yu, M.; Barr, J.A.; Crameri, G.; Thalmann, C.M.; Wang, L.-F. Prevalence of henipavirus and rubulavirus antibodies in pteropid bats, Papua New Guinea. Emerg. Infect. Dis. 2010, 16, 1997–1999. [Google Scholar] [CrossRef]
  16. Field, H.; de Jong, C.E.; Halpin, K.; Smith, C.S. Henipaviruses and fruit bats, Papua New Guinea. Emerg. Infect. Dis. 2013, 19, 670–671. [Google Scholar] [CrossRef]
  17. Wacharapluesadee, S.; Boongird, K.; Wanghongsa, S.; Ratanasetyuth, N.; Supavonwong, P.; Saengsen, D.; Gongal, G.N.; Hemachudha, T. A longitudinal study of the prevalence of Nipah virus in Pteropus lylei bats in Thailand: Evidence for seasonal preference in disease transmission. Vector Borne Zoonotic Dis. 2010, 10, 183–190. [Google Scholar] [CrossRef]
  18. Wacharapluesadee, S.; Samseeneam, P.; Phermpool, M.; Kaewpom, T.; Rodpan, A.; Maneeorn, P.; Srongmongkol, P.; Kanchanasaka, B.; Hemachudha, T. Molecular characterization of Nipah virus from Pteropus hypomelanus in Southern Thailand. Virol. J. 2016, 13, 53. [Google Scholar] [CrossRef] [Green Version]
  19. Reynes, J.-M.; Counor, D.; Ong, S.; Faure, C.; Seng, V.; Molia, S.; Walston, J.; Georges-Courbot, M.C.; Deubel, V.; Sarthou, J.-L. Nipah virus in Lyle’s flying foxes, Cambodia. Emerg. Infect. Dis. 2005, 11, 1042–1047. [Google Scholar] [CrossRef]
  20. Cappelle, J.; Hoem, T.; Hul, V.; Furey, N.; Nguon, K.; Prigent, S.; Dupon, L.; Ken, S.; Neung, C.; Hok, V.; et al. Nipah virus circulation at human–bat interfaces, Cambodia. Bull. World Health Organ. 2020, 98, 539–547. [Google Scholar] [CrossRef]
  21. Yob, J.M.; Field, H.; Rashdi, A.M.; Morrissy, C.; van der Heide, B.; Rota, P.; bin Adzhar, A.; White, J.; Daniels, P.; Jamaluddin, A.; et al. Nipah virus infection in bats (order Chiroptera) in peninsular Malaysia. Emerg. Infect. Dis. 2001, 7, 439–441. [Google Scholar] [CrossRef] [PubMed]
  22. Ching, P.K.G.; de los Reyes, V.C.; Sucaldito, M.N.; Tayag, E.; Columna-Vingno, A.B.; Malbas, F.F.; Bolo, G.C.; Sejvar, J.J.; Eagles, D.; Playford, G.; et al. Outbreak of henipavirus infection, Philippines, 2014. Emerg. Infect. Dis. 2015, 21, 328–331. [Google Scholar] [CrossRef] [PubMed]
  23. Halpin, K.; Young, P.L.; Mackenzie, J.S.; Field, H.E. Isolation of Hendra virus from pteropid bats: A natural reservoir of Hendra virus. J. Gen. Virol. 2000, 81, 1927–1932. [Google Scholar] [CrossRef] [PubMed]
  24. Marsh, G.A.; de Jong, C.; Barr, J.A.; Tachedjian, M.; Smith, C.; Middleton, D.; Yu, M.; Todd, S.; Foord, A.J.; Haring, V.; et al. Cedar virus: A novel henipavirus isolated from Australian bats. PLoS Pathog. 2012, 8, e1002836. [Google Scholar] [CrossRef]
  25. Brook, C.E.; Ranaivoson, H.C.; Broder, C.C.; Cunningham, A.A.; Héraud, J.; Peel, A.J.; Gibson, L.; Wood, J.L.N.; Metcalf, C.J.; Dobson, A.P. Disentangling serology to elucidate henipa- and filovirus transmission in Madagascar fruit bats. J. Anim. Ecol. 2019, 88, 1001–1016. [Google Scholar] [CrossRef]
  26. Drexler, J.F.; Corman, V.M.; Müller, M.A.; Maganga, G.D.; Vallo, P.; Binger, T.; Gloza-Rausch, F.; Rasche, A.; Yordanov, S.; Seebens, A.; et al. Bats host major mammalian paramyxoviruses. Nat. Commun. 2012, 3, 796. [Google Scholar] [CrossRef] [Green Version]
  27. Peel, A.J.; Sargan, D.R.; Baker, K.S.; Hayman, D.T.S.; Barr, J.A.; Crameri, G.; Suu-Ire, R.D.; Broder, C.C.; Lembo, T.; Wang, L.-F.; et al. Continent-wide panmixia of an African fruit bat facilitates transmission of potentially zoonotic viruses. Nat. Commun. 2013, 4, 2770. [Google Scholar] [CrossRef] [Green Version]
  28. Kessler, M.K.; Becker, D.J.; Peel, A.J.; Justice, N.V.; Lunn, T.; Crowley, D.E.; Jones, D.N.; Eby, P.; Sánchez, C.A.; Plowright, R.K. Changing resource landscapes and spillover of henipaviruses. Ann. N. Y. Acad. Sci. 2018, 1429, 78–99. [Google Scholar] [CrossRef]
  29. Williamson, M.M.; Hooper, P.T.; Selleck, P.W.; Westbury, H.A.; Slocombe, R.F. Experimental Hendra virus infection in pregnant guinea-pigs and fruit bats (Pteropus poliocephalus). J. Comp. Pathol. 2000, 122, 201–207. [Google Scholar] [CrossRef]
  30. Halpin, K.; Hyatt, A.D.; Fogarty, R.; Middleton, D.; Bingham, J.; Epstein, J.H.; Rahman, S.A.; Hughes, T.; Smith, C.; Field, H.E.; et al. Pteropid bats are confirmed as the reservoir hosts of henipaviruses: A comprehensive experimental study of virus transmission. Am. J. Trop. Med. Hyg. 2011, 85, 946–951. [Google Scholar] [CrossRef] [Green Version]
  31. Almeida, F.C.; Giannini, N.P.; Simmons, N.B.; Helgen, K.M. Each flying fox on its own branch: A phylogenetic tree for Pteropus and related genera (Chiroptera: Pteropodidae). Mol. Phylogenet. Evol. 2014, 77, 83–95. [Google Scholar] [CrossRef] [PubMed]
  32. Almeida, F.C.; Giannini, N.P.; Simmons, N.B. The evolutionary history of the African fruit bats (Chiroptera: Pteropodidae). Acta Chiropterol. 2016, 18, 73–90. [Google Scholar] [CrossRef]
  33. Almeida, F.C.; Simmons, N.B.; Giannini, N.P. A species-level phylogeny of Old World fruit bats with a new higher-level classification of the family Pteropodidae. Am. Mus. Novit. 2020, 2020, 1–24. [Google Scholar] [CrossRef]
  34. Tsang, S.M.; Wiantoro, S.; Veluz, M.J.; Sugita, N.; Nguyen, Y.; Simmons, N.B.; Lohman, D.J. Dispersal out of Wallacea spurs diversification of Pteropus flying foxes, the world’s largest bats (Mammalia: Chiroptera). J. Biogeogr. 2019, 47, 527–537. [Google Scholar] [CrossRef]
  35. Stribna, T.; Romportl, D.; Demjanovič, J.; Vogeler, A.; Tschapka, M.; Benda, P.; Horáček, I.; Juste, J.; Goodman, S.M.; Hulva, P. Pan African phylogeography and palaeodistribution of rousettine fruit bats: Ecogeographic correlation with Pleistocene climate vegetation cycles. J. Biogeogr. 2019, 46, 2336–2349. [Google Scholar] [CrossRef]
  36. Chua, K.B.; Goh, K.J.; Wong, K.T.; Kamarulzaman, A.; Tan, P.S.K.; Ksiazek, T.G.; Zaki, S.R.; Paul, G.; Lam, S.K.; Tan, C.T. Fatal encephalitis due to Nipah virus among pig-farmers in Malaysia. Lancet 1999, 354, 1257–1259. [Google Scholar] [CrossRef]
  37. Paton, N.I.; Leo, Y.S.; Zaki, S.R.; Auchus, A.P.; Lee, K.E.; Ling, A.E.; Chew, S.K.; Ang, B.; Rollin, P.E.; Umapathi, T.; et al. Outbreak of Nipah-virus infection among abattoir workers in Singapore. Lancet 1999, 354, 1253–1256. [Google Scholar] [CrossRef]
  38. Goh, K.J.; Tan, C.T.; Chew, N.K.; Tan, P.S.K.; Kamarulzaman, A.; Sarji, S.A.; Wong, K.T.; Abdullah, B.J.J.; Chua, K.B.; Lam, S.K. Clinical features of Nipah virus encephalitis among pig farmers in Malaysia. N. Engl. J. Med. 2000, 342, 1229–1235. [Google Scholar] [CrossRef] [Green Version]
  39. Parashar, U.D.; Sunn, L.M.; Ong, F.; Mounts, A.W.; Arif, M.T.; Ksiazek, T.G.; Kamaluddin, M.A.; Mustafa, A.N.; Kaur, H.; Ding, L.M.; et al. Case-control study of risk factors for human infection with a new zoonotic paramyxovirus, Nipah virus, during a 1998–1999 outbreak of severe encephalitis in Malaysia. J. Infect. Dis. 2000, 181, 1755–1759. [Google Scholar] [CrossRef]
  40. Chua, K.B. Nipah virus outbreak in Malaysia. J. Clin. Virol. 2003, 26, 265–275. [Google Scholar] [CrossRef]
  41. Chadha, M.S.; Comer, J.A.; Lowe, L.; Rota, P.A.; Rollin, P.E.; Bellini, W.J.; Ksiazek, T.G.; Mishra, A.C. Nipah virus-associated encephalitis outbreak, Siliguri, India. Emerg. Infect. Dis. 2006, 12, 235–240. [Google Scholar] [CrossRef] [PubMed]
  42. Nikolay, B.; Salje, H.; Khan, A.K.M.D.; Sazzad, H.M.S.; Satter, S.M.; Rahman, M.; Doan, S.; Knust, B.; Flora, M.S.; Luby, S.P.; et al. A framework to monitor changes in transmission and epidemiology of emerging pathogens: Lessons from Nipah virus. J. Infect. Dis. 2020, 221, S363–S369. [Google Scholar] [CrossRef] [PubMed]
  43. Arunkumar, G.; Chandni, R.; Mourya, D.T.; Singh, S.K.; Sadanandan, R.; Sudan, P.; Bhargava, B.; Gangakhedkar, R.R.; Gupta, N.; Bhargava, B.; et al. Outbreak investigation of Nipah virus disease in Kerala, India, 2018. J. Infect. Dis. 2019, 219, 1867–1878. [Google Scholar] [CrossRef] [PubMed] [Green Version]
  44. Cortes, M.C.; Cauchemez, S.; Lefrancq, N.; Luby, S.P.; Jahangir Hossain, M.; Sazzad, H.M.S.; Rahman, M.; Daszak, P.; Salje, H.; Gurley, E.S. Characterization of the spatial and temporal distribution of Nipah virus spillover events in Bangladesh, 2007–2013. J. Infect. Dis. 2018, 217, 1390–1394. [Google Scholar] [CrossRef] [PubMed]
  45. Luby, S.P.; Rahman, M.; Hossain, M.J.; Blum, L.; Husain, M.M.; Gurley, E.; Khan, R.; Ahmed, B.-N.; Rahman, S.; Nahar, N.; et al. Foodborne transmission of Nipah virus, Bangladesh. Emerg. Infect. Dis. 2006, 12, 1888–1894. [Google Scholar] [CrossRef]
  46. Rahman, M.A.; Hossain, M.J.; Sultana, S.; Homaira, N.; Khan, S.U.; Rahman, M.; Gurley, E.S.; Rollin, P.E.; Lo, M.K.; Comer, J.A.; et al. Date palm sap linked to Nipah virus outbreak in Bangladesh, 2008. Vector Borne Zoonotic Dis. 2012, 12, 65–72. [Google Scholar] [CrossRef]
  47. Islam, M.S.; Sazzad, H.M.S.; Satter, S.M.; Sultana, S.; Hossain, M.J.; Hasan, M.; Rahman, M.; Campbell, S.; Cannon, D.L.; Ströher, U.; et al. Nipah virus transmission from bats to humans associated with drinking traditional liquor made from date palm sap, Bangladesh, 2011–2014. Emerg. Infect. Dis. 2016, 22, 664–670. [Google Scholar] [CrossRef] [Green Version]
  48. Gurley, E.S.; Hegde, S.T.; Hossain, K.; Sazzad, H.M.S.; Hossain, M.J.; Rahman, M.; Sharker, M.A.Y.; Salje, H.; Islam, M.S.; Epstein, J.H.; et al. Convergence of humans, bats, trees, and culture in Nipah virus transmission, Bangladesh. Emerg. Infect. Dis. 2017, 23, 1446–1453. [Google Scholar] [CrossRef] [Green Version]
  49. Harcourt, B.H.; Lowe, L.; Tamin, A.; Liu, X.; Bankamp, B.; Bowden, N.; Rollin, P.E.; Comer, J.A.; Ksiazek, T.G.; Hossain, M.J.; et al. Genetic characterization of Nipah virus, Bangladesh, 2004. Emerg. Infect. Dis. 2005, 11, 1594–1597. [Google Scholar] [CrossRef]
  50. Gurley, E.S.; Montgomery, J.M.; Hossain, M.J.; Bell, M.; Azad, A.K.; Islam, M.R.; Molla, M.A.R.; Carroll, D.S.; Ksiazek, T.G.; Rota, P.A.; et al. Person-to-person transmission of Nipah virus in a Bangladeshi community. Emerg. Infect. Dis. 2007, 13, 1031–1037. [Google Scholar] [CrossRef]
  51. Nikolay, B.; Salje, H.; Hossain, M.J.; Khan, A.K.M.D.; Sazzad, H.M.S.; Rahman, M.; Daszak, P.; Ströher, U.; Pulliam, J.R.C.; Kilpatrick, A.M.; et al. Transmission of Nipah virus—14 years of investigations in Bangladesh. N. Engl. J. Med. 2019, 380, 1804–1814. [Google Scholar] [CrossRef] [PubMed]
  52. Arankalle, V.A.; Bandyopadhyay, B.T.; Ramdasi, A.Y.; Jadi, R.; Patil, D.R.; Rahman, M.; Majumdar, M.; Banerjee, P.S.; Hati, A.K.; Goswami, R.P.; et al. Genomic characterization of Nipah virus, West Bengal, India. Emerg. Infect. Dis. 2011, 17, 907–909. [Google Scholar] [CrossRef] [PubMed]
  53. Kumar, C.P.G.; Sugunan, A.P.; Yadav, P.; Kurup, K.K.; Aarathee, R.; Manickam, P.; Bhatnagar, T.; Radhakrishnan, C.; Thomas, B.; Kumar, A.; et al. Infections among contacts of patients with Nipah Virus, India. Emerg. Infect. Dis. 2019, 25, 1007–1010. [Google Scholar] [CrossRef] [PubMed]
  54. Tan, C.T.; Tan, K.S. Nosocomial transmissibility of Nipah virus. J. Infect. Dis. 2001, 184, 1367. [Google Scholar] [CrossRef] [Green Version]
  55. Mounts, A.W.; Kaur, H.; Parashar, U.D.; Ksiazek, T.G.; Cannon, D.; Arokiasamy, J.T.; Anderson, L.J.; Lye, M.S. A cohort study of health care workers to assess nosocomial transmissibility of Nipah virus, Malaysia, 1999. J. Infect. Dis. 2001, 183, 810–813. [Google Scholar] [CrossRef] [Green Version]
  56. Altizer, S.; Becker, D.J.; Epstein, J.H.; Forbes, K.M.; Gillespie, T.R.; Hall, R.J.; Hawley, D.M.; Hernandez, S.M.; Martin, L.B.; Plowright, R.K.; et al. Food for contagion: Synthesis and future directions for studying host–parasite responses to resource shifts in anthropogenic environments. Philos. Trans. R. Soc. B Biol. Sci. 2018, 373, 20170102. [Google Scholar] [CrossRef]
  57. Chua, K.B.; Chua, B.H.; Wang, C.W. Anthropogenic deforestation, El Niño and the emergence of Nipah virus in Malaysia. Malays. J. Pathol. 2002, 24, 15–21. [Google Scholar]
  58. Pulliam, J.R.C.; Epstein, J.H.; Dushoff, J.; Rahman, S.A.; Bunning, M.; Jamaluddin, A.A.; Hyatt, A.D.; Field, H.E.; Dobson, A.P.; Daszak, P. Agricultural intensification, priming for persistence and the emergence of Nipah virus: A lethal bat-borne zoonosis. J. R. Soc. Interface 2012, 9, 89–101. [Google Scholar] [CrossRef] [Green Version]
  59. Nahar, N.; Sultana, R.; Gurley, E.S.; Hossain, M.J.; Luby, S.P. Date palm sap collection: Exploring opportunities to prevent Nipah transmission. Ecohealth 2010, 7, 196–203. [Google Scholar] [CrossRef]
  60. Khan, M.S.U.; Hossain, J.; Gurley, E.S.; Nahar, N.; Sultana, R.; Luby, S.P.; Khan, M.S.U.; Hossain, J.; Gurley, E.S.; Nahar, N.; et al. Use of infrared camera to understand bats’ access to date palm sap: Implications for preventing Nipah virus transmission. Ecohealth 2010, 7, 517–525. [Google Scholar] [CrossRef]
  61. Luby, S.P.; Hossain, M.J.; Gurley, E.S.; Ahmed, B.-N.; Banu, S.; Khan, S.U.; Homaira, N.; Rota, P.A.; Rollin, P.E.; Comer, J.A.; et al. Recurrent zoonotic transmission of Nipah virus into humans, Bangladesh, 2001–2007. Emerg. Infect. Dis. 2009, 15, 1229–1235. [Google Scholar] [CrossRef] [PubMed]
  62. Rahman, M.; Rahman, J. Medicinal value and nutrient status of indigenous fruits in Bangladesh. Nov. J. Med. Biol. Sci. 2014, 3, 1–10. [Google Scholar] [CrossRef]
  63. KewScience. Phoenix sylvestris. Available online: http://wcsp.science.kew.org/namedetail.do?name_id=152708 (accessed on 14 October 2020).
  64. Chaluvadi, S.R.; Young, P.; Thompson, K.; Bahri, B.A.; Gajera, B.; Narayanan, S.; Krueger, R.; Bennetzen, J.L. Phoenix phylogeny, and analysis of genetic variation in a diverse collection of date palm (Phoenix dactylifera) and related species. Plant Divers. 2019, 41, 330–339. [Google Scholar] [CrossRef] [PubMed]
  65. Annett, H.E.; Lele, G.K.; Amin, B.M. The date sugar industry in Bengal: An investigation into its chemistry and agriculture. Mem. Dep. Agric. India 1913, 2, 281–389. [Google Scholar]
  66. Blatter, E. The Palms of British India and Ceylon; Oxford University Press: Oxford, UK, 1926. [Google Scholar]
  67. Epstein, J.H.; Anthony, S.J.; Islam, A.; Kilpatrick, A.M.; Ali Khan, S.; Balkey, M.D.; Ross, N.; Smith, I.; Zambrana-Torrelio, C.; Tao, Y.; et al. Nipah virus dynamics in bats and implications for spillover to humans. Proc. Natl. Acad. Sci. USA 2020, 117, 29190–29201. [Google Scholar] [CrossRef] [PubMed]
  68. Fogarty, R.; Halpin, K.; Hyatt, A.D.; Daszak, P.; Mungall, B.A. Henipavirus susceptibility to environmental variables. Virus Res. 2008, 132, 140–144. [Google Scholar] [CrossRef] [Green Version]
  69. De Wit, E.; Prescott, J.; Falzarano, D.; Bushmaker, T.; Scott, D.; Feldmann, H.; Munster, V.J. Foodborne transmission of Nipah virus in Syrian hamsters. PLoS Pathog. 2014, 10, e1004001. [Google Scholar] [CrossRef]
  70. Nahar, N.; Asaduzzaman, M.; Mandal, U.K.; Rimi, N.A.; Gurley, E.S.; Rahman, M.; Garcia, F.; Zimicki, S.; Sultana, R.; Luby, S.P. Hunting bats for human consumption in Bangladesh. Ecohealth 2020, 17, 139–151. [Google Scholar] [CrossRef]
  71. Khan, M.A.R. Status and distribution of bats in Bangladesh with notes on their ecology. Zoos Print J. 2001, 16, 479–483. [Google Scholar] [CrossRef]
  72. Mickleburgh, S.P.; Hutson, A.M.; Racey, P.A. A review of the global conservation status of bats. Oryx 2002, 36, 18–34. [Google Scholar] [CrossRef] [Green Version]
  73. Epstein, J.H.; Olival, K.J.; Pulliam, J.R.C.; Smith, C.; Westrum, J.; Hughes, T.; Dobson, A.P.; Zubaid, A.; Rahman, S.A.; Basir, M.M.; et al. Pteropus vampyrus, a hunted migratory species with a multinational home-range and a need for regional management. J. Appl. Ecol. 2009, 46, 991–1002. [Google Scholar] [CrossRef]
  74. Oleksy, R.; Racey, P.A.; Jones, G. High-resolution GPS tracking reveals habitat selection and the potential for long-distance seed dispersal by Madagascan flying foxes Pteropus rufus. Glob. Ecol. Conserv. 2015, 3, 678–692. [Google Scholar] [CrossRef] [Green Version]
  75. Roberts, B.J.; Catterall, C.P.; Eby, P.; Kanowski, J. Long-distance and frequent movements of the flying-fox Pteropus poliocephalus: Implications for management. PLoS ONE 2012, 7, e42532. [Google Scholar] [CrossRef] [Green Version]
  76. United Nations. World Population Prospects 2019, Online Edition. Available online: https://population.un.org/wpp/ (accessed on 17 May 2020).
  77. Hahn, M.B.; Epstein, J.H.; Gurley, E.S.; Islam, M.S.; Luby, S.P.; Daszak, P.; Patz, J.A. Roosting behaviour and habitat selection of Pteropus giganteus reveal potential links to Nipah virus epidemiology. J. Appl. Ecol. 2014, 51, 376–387. [Google Scholar] [CrossRef] [PubMed] [Green Version]
  78. Hahn, M.B.; Gurley, E.S.; Epstein, J.H.; Islam, M.S.; Patz, J.A.; Daszak, P.; Luby, S.P. The role of landscape composition and configuration on Pteropus giganteus roosting ecology and Nipah virus spillover risk in Bangladesh. Am. J. Trop. Med. Hyg. 2014, 90, 247–255. [Google Scholar] [CrossRef] [PubMed] [Green Version]
  79. National Climatic Data Center (NCDC). NCDC Climate Data Online. Available online: https://www.ncdc.noaa.gov/cdo-web/search (accessed on 15 January 2020).
  80. Japan Agency for Marine-Earth Science and Technology Application Laboratory. APL VirtualEarth. Available online: http://www.jamstec.go.jp/virtualearth/general/en/index.html (accessed on 12 November 2020).
  81. National Oceanic and Atmospheric Administration Physical Sciences Laboratory. Multivariate ENSO Index Version 2 (MEI.v2). Available online: https://psl.noaa.gov/enso/mei/ (accessed on 12 November 2020).
  82. Lloyd, C.T.; Chamberlain, H.; Kerr, D.; Yetman, G.; Pistolesi, L.; Stevens, F.R.; Gaughan, A.E.; Nieves, J.J.; Hornby, G.; MacManus, K.; et al. Global spatio-temporally harmonised datasets for producing high-resolution gridded population distribution datasets. Big Earth Data 2019, 3, 108–139. [Google Scholar] [CrossRef] [PubMed] [Green Version]
  83. Lloyd, C.T.; Sorichetta, A.; Tatem, A.J. High resolution global gridded data for use in population studies. Sci. Data 2017, 4, 170001. [Google Scholar] [CrossRef] [Green Version]
  84. Doxsey-Whitfield, E.; MacManus, K.; Adamo, S.B.; Pistolesi, L.; Squires, J.; Borkovska, O.; Baptista, S.R. Taking advantage of the improved availability of census data: A first look at the gridded population of the world, version 4. Pap. Appl. Geogr. 2015, 1, 226–234. [Google Scholar] [CrossRef]
  85. Fick, S.E.; Hijmans, R.J. WorldClim 2: New 1-km spatial resolution climate surfaces for global land areas. Int. J. Climatol. 2017, 37, 4302–4315. [Google Scholar] [CrossRef]
  86. Hansen, M.C.; Potapov, P.V.; Moore, R.; Hancher, M.; Turubanova, S.A.; Tyukavina, A.; Thau, D.; Stehman, S.V.; Goetz, S.J.; Loveland, T.R.; et al. High-resolution global maps of 21st-century forest cover change. Science 2013, 342, 850–853. [Google Scholar] [CrossRef] [Green Version]
  87. Ellis, E.C.; Klein Goldewijk, K.; Siebert, S.; Lightman, D.; Ramankutty, N. Anthropogenic transformation of the biomes, 1700 to 2000. Glob. Ecol. Biogeogr. 2010, 19, 589–606. [Google Scholar] [CrossRef]
  88. Klein Goldewijk, K.; Beusen, A.; Van Drecht, G.; de Vos, M. The HYDE 3.1 spatially explicit database of human-induced global land-use change over the past 12,000 years. Glob. Ecol. Biogeogr. 2011, 20, 73–86. [Google Scholar] [CrossRef]
  89. OECD. Land Cover in Countries and Regions. Available online: https://stats.oecd.org/Index.aspx?DataSetCode=LAND_COVER (accessed on 6 August 2020).
  90. ESA-CCI. Land Cover. Available online: http://maps.elie.ucl.ac.be/CCI/viewer/ (accessed on 6 August 2020).
  91. World Bank. Forest Area (% of Land Area)—Bangladesh. Available online: https://data.worldbank.org/indicator/AG.LND.FRST.ZS?end=2016&locations=BD&start=1990 (accessed on 6 August 2020).
  92. Reddy, C.S.; Pasha, S.V.; Jha, C.S.; Diwakar, P.G.; Dadhwal, V.K. Development of national database on long-term deforestation (1930–2014) in Bangladesh. Glob. Planet. Chang. 2016, 139, 173–182. [Google Scholar] [CrossRef]
  93. R Core Team. R: A Language and Environment for Statistical Computing. Available online: http://www.r-project.org (accessed on 17 May 2020).
  94. Cooper, M.; Zvoleff, A. Gfcanalysis: Tools for Working with Hansen et al. Global Forest Change Dataset. Available online: https://cran.r-project.org/package=gfcanalysis (accessed on 17 May 2020).
  95. Ripley, B.; Venables, B.; Bates, D.M.; Hornik, K.; Gebhardt, A.; Firth, D. MASS: Support Functions and Datasets for Venables and Ripley’s MASS. Available online: https://cran.r-project.org/package=MASS (accessed on 17 May 2020).
  96. Burnham, K.P.; Anderson, D.R. Multimodel inference: Understanding AIC and BIC in model selection. Sociol. Methods Res. 2004, 33, 261–304. [Google Scholar] [CrossRef]
  97. Bartoń, K. MuMIn: Multi-Model Inference. Available online: http://cran.r-project.org/package=MuMIn (accessed on 17 May 2020).
  98. Guyon, I. A scaling law for the validation-set training-set size ratio. AT&T Bell Lab. 1997, 1, 1–11. [Google Scholar]
  99. Friedman, J.; Hastie, T.; Tibshirani, R. Regularization paths for generalized linear models via coordinate descent. J. Stat. Softw. 2010, 33, 1–22. [Google Scholar] [CrossRef] [Green Version]
  100. Breiman, L. Random forests. Mach. Learn. 2001, 45, 5–32. [Google Scholar] [CrossRef] [Green Version]
  101. Kuhn, M.; Wing, J.; Weston, S.; Williams, A.; Keefer, C.; Engelhardt, A.; Cooper, T.; Mayer, Z.; Kenkel, B.; R Core Team; et al. Caret: Classification and Regression Training. Available online: https://cran.r-project.org/package=caret (accessed on 17 May 2020).
  102. Friedman, J.; Hastie, T.; Tibshirani, R.; Narasimhan, B.; Tay, K.; Simon, N.; Qian, J. Glmnet: Lasso and Elastic-Net Regularized Generalized Linear Models. Available online: https://cran.r-project.org/package=glmnet (accessed on 17 May 2020).
  103. Wright, M.N.; Wager, S.; Probst, P. Ranger: A Fast Implementation of Random Forests. Available online: https://cran.r-project.org/package=ranger (accessed on 17 May 2020).
  104. Krystufek, B. Indian flying fox Pteropus giganteus colony in Peradeniya Botanical Gardens, Sri Lanka. Hystrix Ital. J. Mammal. 2009, 20, 29–35. [Google Scholar]
  105. Kumar, R.; Elangovan, V. Effect of tree characteristics on roost selection of the Indian flying fox, Pteropus giganteus. J. Bat Res. Conserv. 2019, 12, 100–106. [Google Scholar] [CrossRef]
  106. Kumar, J.; Kanaujia, A. Distribution and population status of fruit-bat (Pteropus giganteus) in district Lakhimpur-Kheri, Uttar Pradesh, India. G J. Environ. Sci. Technol. 2015, 3, 23–28. [Google Scholar]
  107. Neupane, K.R.; Basnet, K.; Katuwal, H.B. Plight of Indian flying fox (Pteropus giganteus) in lowlands of eastern Nepal. World J. Zool. 2016, 11, 81–85. [Google Scholar]
  108. Sharma, B.; Subedi, A.; Gyawali, K.; Ghimire, P.; Bist, B.S.; Baniya, S. Can Pteropus giganteus Brünnich, 1782 co-exist in a human dominated landscape? A case study in Pokhara valley, western Nepal. J. Bat Res. Conserv. 2018, 11, 1–7. [Google Scholar]
  109. Gulraiz, T.L.; Javid, A.; Mahmood-Ul-Hassan, M.; Maqbool, A.; Ashraf, S.; Hussain, M.; Daud, S. Roost characteristics and habitat preferences of Indian flying fox (Pteropus giganteus) in urban areas of Lahore, Pakistan. Turkish J. Zool. 2015, 39, 388–394. [Google Scholar] [CrossRef]
  110. Khan, W.; Nisa, N.N.; Khan, A.R.; Rahbar, B.; Mehmood, S.A.; Ahmed, S.; Kamal, M.; Shah, M.; Rasool, A.; Pahanwar, W.A.; et al. Roosting ecology and morphometric analysis of Pteropus medius (Indian flying fox) in Lower Dir, district, Pakistan. Braz. J. Biol. 2020. [Google Scholar] [CrossRef] [PubMed]
  111. Chaiyes, A.; Duengkae, P.; Wacharapluesadee, S.; Pongpattananurak, N.; Olival, K.J.; Hemachudha, T. Assessing the distribution, roosting site characteristics, and population of Pteropus lylei in Thailand. Raffles Bull. Zool. 2017, 65, 670–680. [Google Scholar]
  112. Giles, J.R.; Plowright, R.K.; Eby, P.; Peel, A.J.; McCallum, H. Models of eucalypt phenology predict bat population flux. Ecol. Evol. 2016, 6, 7230–7245. [Google Scholar] [CrossRef]
  113. Welbergen, J.A.; Klose, S.M.; Markus, N.; Eby, P. Climate change and the effects of temperature extremes on Australian flying-foxes. Proc. R. Soc. B Biol. Sci. 2008, 275, 419–425. [Google Scholar] [CrossRef] [Green Version]
  114. Van der Ree, R.; McDonnell, M.J.; Temby, I.; Nelson, J.; Whittingham, E. The establishment and dynamics of a recently established urban camp of flying foxes (Pteropus poliocephalus) outside their geographic range. J. Zool. 2006, 268, 177–185. [Google Scholar] [CrossRef]
  115. Hosmer, D.W.; Lemeshow, S. Applied Logistic Regression, 2nd ed.; Wiley and Sons, Inc.: New York, NY, USA, 2000; ISBN 9780471654025. [Google Scholar]
  116. Van Schendel, W. A History of Bangladesh; Cambridge University Press: Cambridge, UK, 2009; ISBN 9780511997419. [Google Scholar]
  117. Bangladesh Bureau of Statistics. Bangladesh Agricultural Statistics Yearbook 2017; Bangladesh Bureau of Statistics: Dhaka, Bangladesh, 2018.
  118. Alam, G.M.M.; Khatun, M.N. Sweetening food security in Bangladesh: Present situation and future strategy. Pak. Sugar J. 2012, 27, 10–18. [Google Scholar]
  119. Aung, M.H.; Steinberg, D.I.; Aung-Thwin, M.A. Myanmar. Available online: https://www.britannica.com/place/Myanmar (accessed on 16 November 2020).
  120. Ahmed, F.U. Traditional agroforestry systems in Bangladesh. Agrofor. Newsl. 1995, 3, 6–9. [Google Scholar]
  121. Sun, B.; Jia, L.; Liang, B.; Chen, Q.; Liu, D. Phylogeography, transmission, and viral proteins of Nipah virus. Virol. Sin. 2018, 33, 385–393. [Google Scholar] [CrossRef] [PubMed] [Green Version]
  122. Whitmer, S.L.M.; Lo, M.K.; Sazzad, H.M.S.; Zufan, S.; Gurley, E.S.; Sultana, S.; Amman, B.; Ladner, J.T.; Rahman, M.Z.; Doan, S.; et al. Inference of Nipah virus evolution, 1999–2015. Virus Evol. 2020. [Google Scholar] [CrossRef]
  123. Hegde, S.T.; Salje, H.; Sazzad, H.M.S.; Hossain, M.J.; Rahman, M.; Daszak, P.; Klena, J.D.; Nichol, S.T.; Luby, S.P.; Gurley, E.S. Using healthcare-seeking behaviour to estimate the number of Nipah outbreaks missed by hospital-based surveillance in Bangladesh. Int. J. Epidemiol. 2019, 48, 1219–1227. [Google Scholar] [CrossRef] [PubMed]
  124. Páez, D.J.; Giles, J.; McCallum, H.; Field, H.; Jordan, D.; Peel, A.J.; Plowright, R.K. Conditions affecting the timing and magnitude of Hendra virus shedding across pteropodid bat populations in Australia. Epidemiol. Infect. 2017, 145, 3143–3153. [Google Scholar] [CrossRef] [PubMed] [Green Version]
  125. Plowright, R.K.; Eby, P.; Hudson, P.J.; Smith, I.L.; Westcott, D.; Bryden, W.L.; Middleton, D.; Reid, P.A.; McFarlane, R.A.; Martin, G.; et al. Ecological dynamics of emerging bat virus spillover. Proc. R. Soc. B Biol. Sci. 2015, 282, 20142124. [Google Scholar] [CrossRef] [Green Version]
  126. Hayman, D.T.S. Biannual birth pulses allow filoviruses to persist in bat populations. Proc. R. Soc. B Biol. Sci. 2015, 282, 20142591. [Google Scholar] [CrossRef]
  127. Mahmood-Ul-Hassan, M.; Gulraiz, T.L.; Rana, S.A.; Javid, A. The diet of Indian flying-foxes (Pteropus giganteus) in urban habitats of Pakistan. Acta Chiropterol. 2010, 12, 341–347. [Google Scholar] [CrossRef]
  128. Walter, M.H.; Verdong, A.; Olmos, V.; Weiss, C.C.; Vial, L.-R.; Putra, A.; Müller, J.; Tschapka, M.; Schnitzler, H.-U. Discrimination of small sugar concentration differences helps the nectar-feeding bat Leptonycteris yerbabuenae cover energetic demands. J. Exp. Biol. 2020, 223, jeb.215053. [Google Scholar] [CrossRef]
  129. Plowright, R.K.; Peel, A.J.; Streicker, D.G.; Gilbert, A.T.; McCallum, H.; Wood, J.; Baker, M.L.; Restif, O. Transmission or within-host dynamics driving pulses of zoonotic viruses in reservoir–host populations. PLoS Negl. Trop. Dis. 2016, 10, e0004796. [Google Scholar] [CrossRef] [Green Version]
  130. Edson, D.W.; Field, H.E.; McMichael, L.; Jordan, D.; Kung, N.Y.; Mayer, D.; Smith, C.S. Flying-fox roost disturbance and Hendra virus spillover risk. PLoS ONE 2015, 10, e0125881. [Google Scholar] [CrossRef]
  131. McMichael, L.; Edson, D.; Mayer, D.; Broos, A.; Kopp, S.; Meers, J.; Field, H. Physiologic biomarkers and Hendra virus infection in Australian black flying foxes (Pteropus alecto). J. Wildl. Dis. 2017, 53, 111. [Google Scholar] [CrossRef] [PubMed]
  132. McMichael, L.; Edson, D.; Smith, C.; Mayer, D.; Smith, I.; Kopp, S.; Meers, J.; Field, H. Physiological stress and Hendra virus in flying-foxes (Pteropus spp.), Australia. PLoS ONE 2017, 12, e0182171. [Google Scholar] [CrossRef] [PubMed] [Green Version]
  133. Dey, S.; Roy, U.S.; Chattopadhyay, S. Distribution and abundance of three populations of Indian flying fox (Pteropus giganteus) from Purulia district of West Bengal, India. TAPROBANICA J. Asian Biodivers. 2013, 5, 60. [Google Scholar] [CrossRef]
  134. Manandhar, S.; Thapa, S.; Shrestha, T.K.; Jyakhwo, R.; Wright, W.; Aryal, A. Population status and diurnal behaviour of the Indian flying fox Pteropus giganteus (Brünnich, 1782) in Kathmandu Valley, Nepal. Proc. Zool. Soc. 2018, 71, 363–375. [Google Scholar] [CrossRef]
  135. Khan, S.U.; Gurley, E.S.; Hossain, M.J.; Nahar, N.; Sharker, M.A.Y.; Luby, S.P. A randomized controlled trial of interventions to impede date palm sap contamination by bats to prevent Nipah virus transmission in Bangladesh. PLoS ONE 2012, 7, e42689. [Google Scholar] [CrossRef]
  136. Nahar, N.; Mondal, U.K.; Sultana, R.; Hossain, M.J.; Khan, M.S.U.; Gurley, E.S.; Oliveras, E.; Luby, S.P. Piloting the use of indigenous methods to prevent Nipah virus infection by interrupting bats’ access to date palm sap in Bangladesh. Health Promot. Int. 2013, 28, 378–386. [Google Scholar] [CrossRef] [Green Version]
  137. Nahar, N.; Asaduzzaman, M.; Sultana, R.; Garcia, F.; Paul, R.C.; Abedin, J.; Sazzad, H.M.S.; Rahman, M.; Gurley, E.S.; Luby, S.P. A large-scale behavior change intervention to prevent Nipah transmission in Bangladesh: Components and costs. BMC Res. Notes 2017, 10, 225. [Google Scholar] [CrossRef] [Green Version]
  138. Pernet, O.; Schneider, B.S.; Beaty, S.M.; Lebreton, M.; Yun, T.E.; Park, A.; Zachariah, T.T.; Bowden, T.A.; Hitchens, P.; Ramirez, C.M.; et al. Evidence for henipavirus spillover into human populations in Africa. Nat. Commun. 2014, 5, 1–10. [Google Scholar] [CrossRef] [Green Version]
  139. Das, P.; Sazzad, H.M.S.; Aleem, M.A.; Rahman, M.Z.; Rahman, M.; Anthony, S.J.; Lipkin, W.I.; Gurley, E.S.; Luby, S.P.; Openshaw, J.J. Hospital-based zoonotic disease surveillance in Bangladesh: Design, field data and difficulties. Philos. Trans. R. Soc. B Biol. Sci. 2019, 374, 20190019. [Google Scholar] [CrossRef] [Green Version]
  140. Hegde, S.T.; Sazzad, H.M.S.; Hossain, M.J.; Alam, M.-U.; Kenah, E.; Daszak, P.; Rollin, P.; Rahman, M.; Luby, S.P.; Gurley, E.S. Investigating rare risk factors for Nipah virus in Bangladesh: 2001–2012. Ecohealth 2016, 13, 720–728. [Google Scholar] [CrossRef] [Green Version]
  141. Chowdhury, S.; Khan, S.U.; Crameri, G.; Epstein, J.H.; Broder, C.C.; Islam, A.; Peel, A.J.; Barr, J.A.; Daszak, P.; Wang, L.-F.; et al. Serological evidence of henipavirus exposure in cattle, goats and pigs in Bangladesh. PLoS Negl. Trop. Dis. 2014, 8, e3302. [Google Scholar] [CrossRef] [PubMed] [Green Version]
  142. Yadav, P.D.; Shete, A.M.; Kumar, G.A.; Sarkale, P.; Sahay, R.R.; Radhakrishnan, C.; Lakra, R.; Pardeshi, P.; Gupta, N.; Gangakhedkar, R.R.; et al. Nipah virus sequences from humans and bats during Nipah outbreak, Kerala, India, 2018. Emerg. Infect. Dis. 2019, 25, 1003–1006. [Google Scholar] [CrossRef] [PubMed]
Figure 1. Spatiotemporal patterns of Nipah virus spillover events across Bangladesh, 2001–2018. Color contours in panels (AC) show the spatial density of events estimated with a bivariate normal kernel. Panels (D,E) show the variation in the number of Nipah spillover events across years and the association with cold winter temperatures. Gray dots in panel (E) show the years before systematic Nipah virus surveillance.
Viruses 13 00169 g001
Figure 2. Duration of occupancy of Pteropus medius populations at occupied roost sites. According to interviewees, occupied roosts were most frequently occupied for more than 10 years (A) and for 12 months out of the year (B). Continuous roost occupancy was similar over the past 10 years (C).
Viruses 13 00169 g002
Figure 3. Size and geographic distribution of Pteropus medius populations at occupied roost sites (n = 307) in Bangladesh. Roost sizes varied widely from 0 to 8000 bats (A) but most roosts contained fewer than 1000 bats (B). Roosts of varying size were observed throughout the country (C) where human population density is high (1134 persons/km2 in the whole country in 2010).
Viruses 13 00169 g003
Figure 4. (A) Reported trends for Pteropus medius populations at occupied roost sites. (B) distribution of unoccupied roost sites across Nipah virus case villages and control villages. (C) reported reasons for bats no longer occupying roost sites.
Viruses 13 00169 g004
Figure 5. Historical change in forested land area in Bangladesh according to available sources. Inset displays the rate of dense forest loss (annual percentage change) since 2000, with a recent increase in this rate of decline, drawn from Hansen et al. [86]. A cutoff value of 40% was used to define dense forests. Only gross forest loss is displayed, since data on forest gain only cover the period 2000–2012.
Viruses 13 00169 g005
Figure 6. Long-term shifts in pteropodid bat populations and seasonal movements due to anthropogenic land-use change. Black arrows show seasonal movements of bats into large aggregations. Dashed gray arrows represent occasional bat movement between roost sites.
Viruses 13 00169 g006
Table 1. Performance metrics of generalized linear models (GLMs) and random forests of bat roost occupancy and abundance.
Response VariableSetModelResponse ErrorRMSEMAER2AUC
Occupancy
(presence/absence of bats)
Training
(n = 380)
GLM0.480.450.420.120.7
Random forest 0.480.410.040.61
Test
(n = 94)
GLM0.460.460.430.020.59
Random forest 0.510.4300.49
Abundance
(roost size)
Training
(n = 255)
GLM6706313140.14
Random forest 6433120.09
Test
(n = 60)
GLM7447113200.1
Random forest 7093270.08
RMSE—root-mean-square error, MAE—mean absolute error, AUC—area under the receiver operating characteristic curve.
Table 2. Distribution of select spatial covariates across all mapped roost sites.
CovariateMedian (IQR)
Human population density (persons/km2)996 (858–1260)
Distance to nearest inland water (km)0.6 (0.3–1)
Distance to nearest feeding site (km)2 (0.9–3.6)
Distance to nearest date palm tree (km)1.2 (0.2–2.7)
Number of feeding sites within 15 km of roost site11 (3–20)
Number of date palm trees within 15 km of roost site80 (29–307)
IQR—interquartile range.
Publisher’s Note: MDPI stays neutral with regard to jurisdictional claims in published maps and institutional affiliations.

