
Modelling Mutation in Equine Infectious Anemia Virus Infection Suggests a Path to Viral Clearance with Repeated Vaccination


Abstract
:1. Introduction
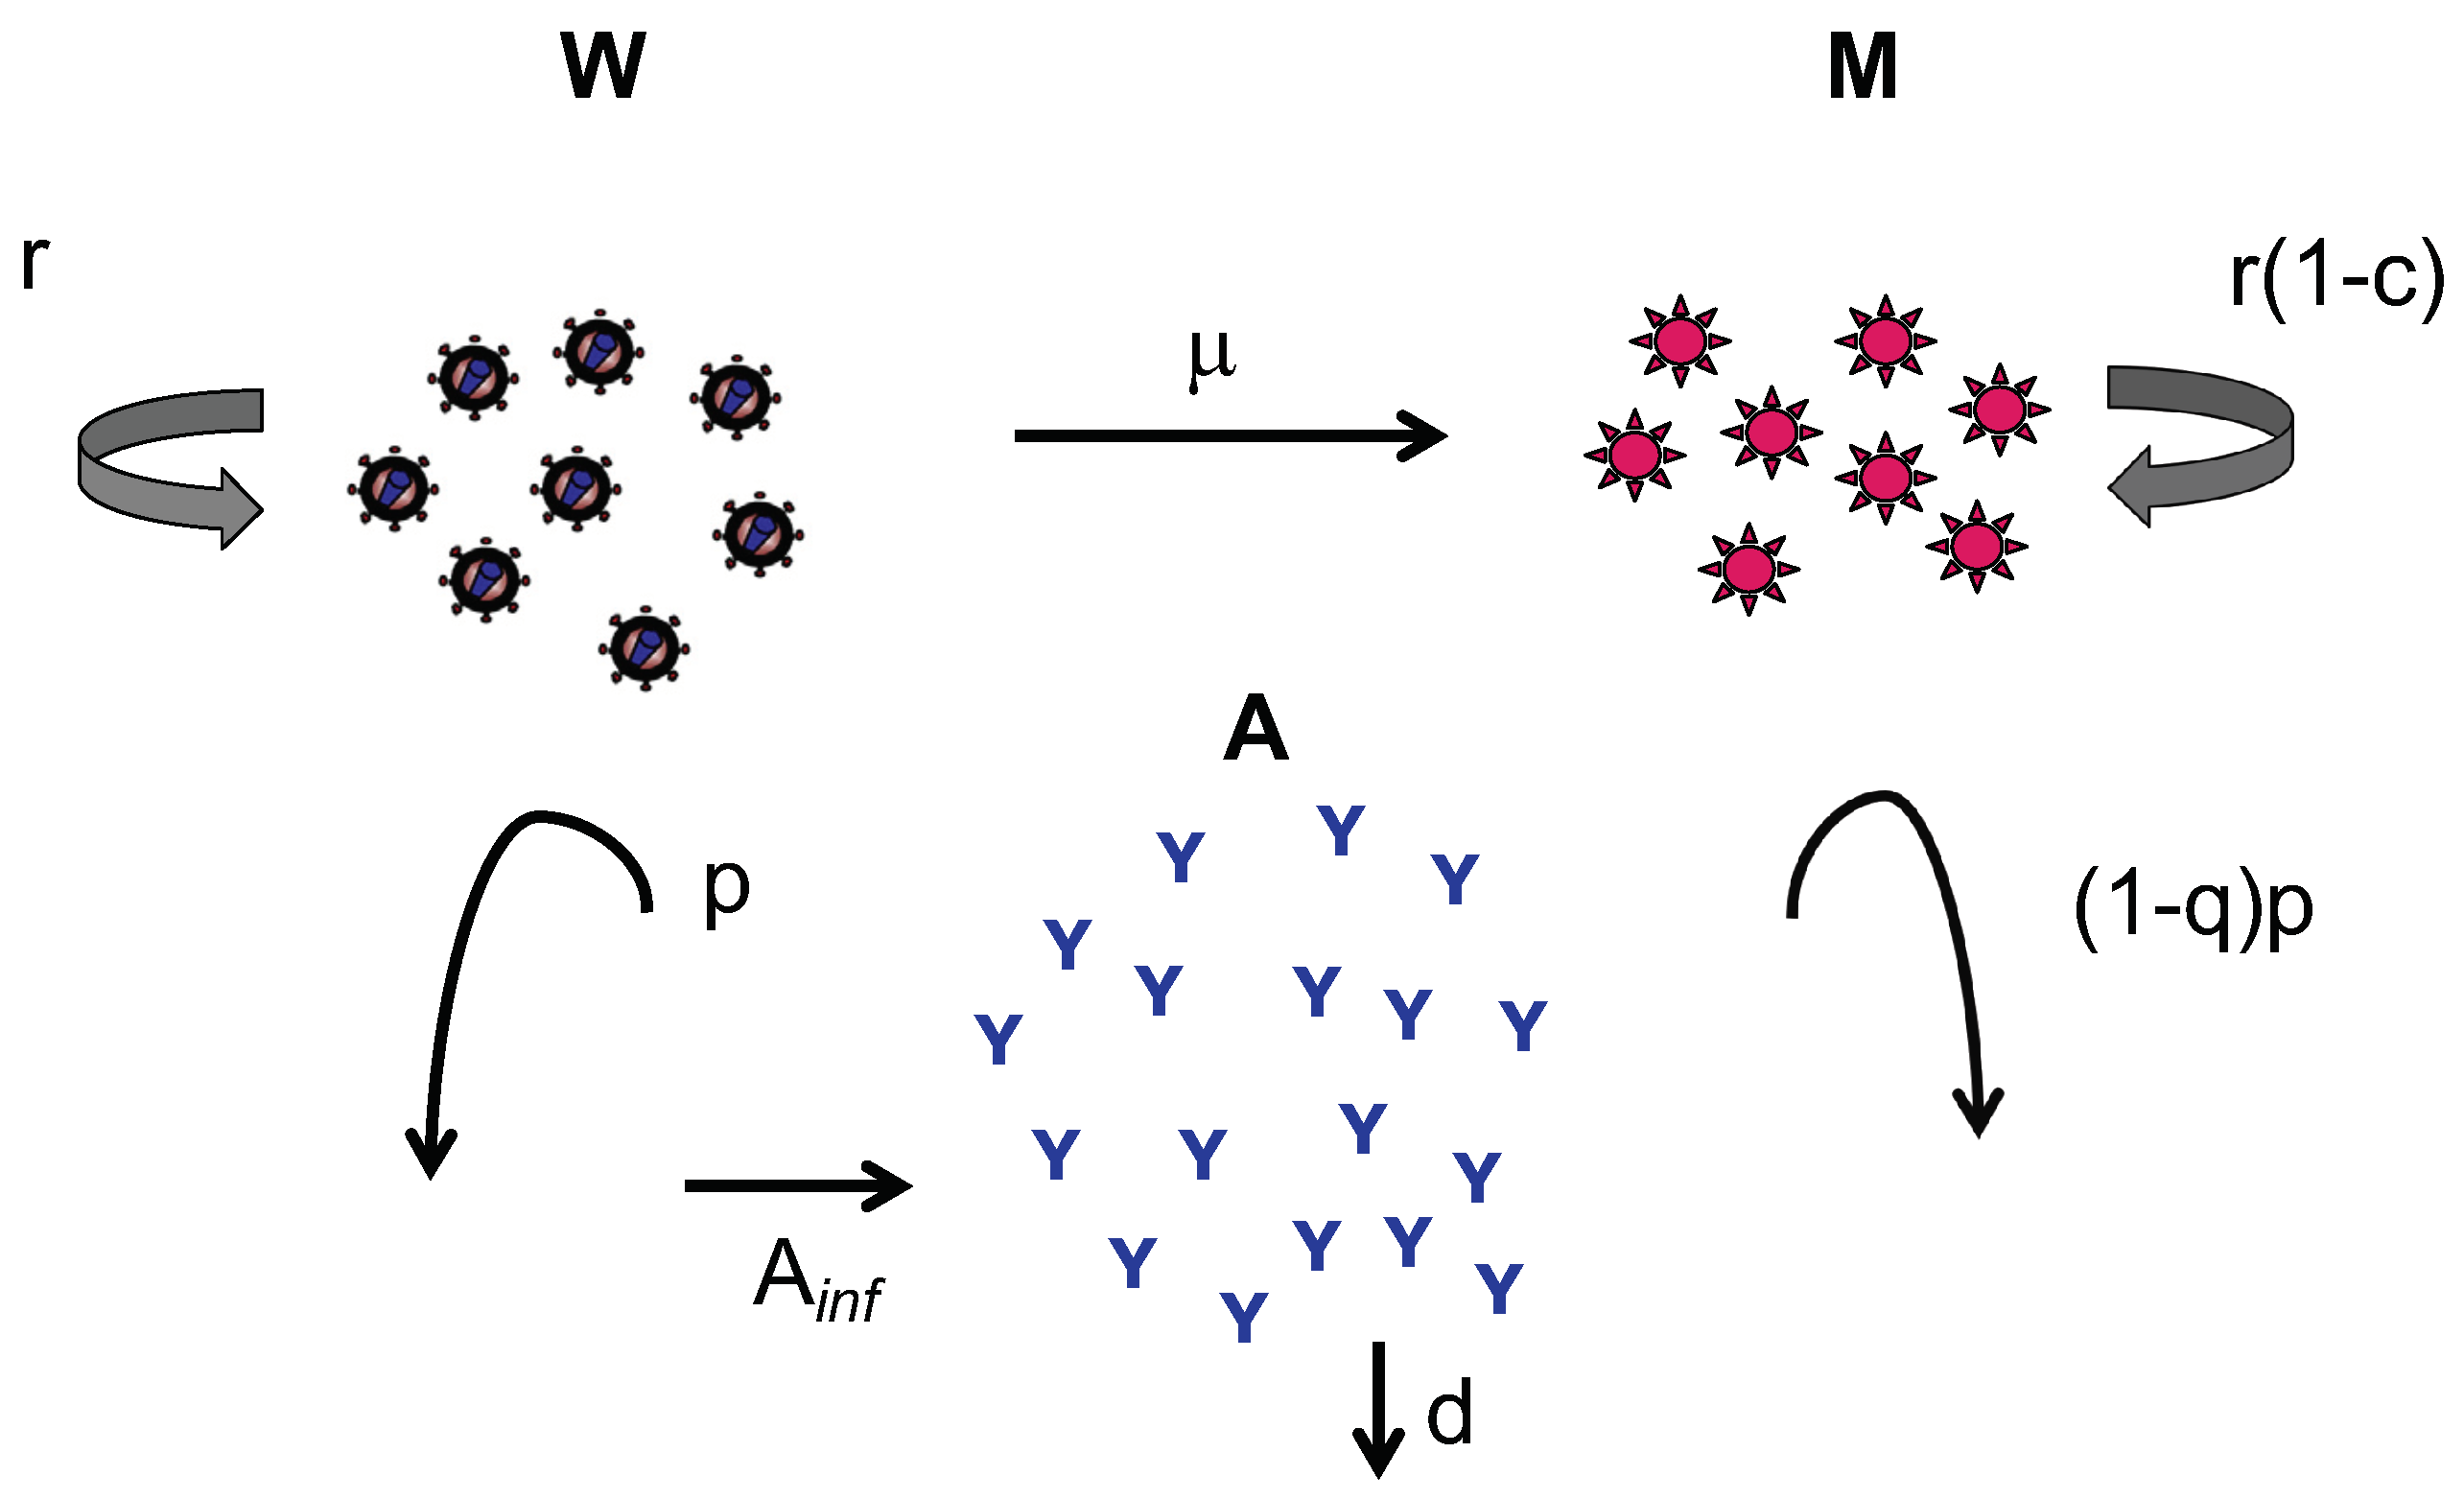
2. Methods
3. Results
4. Discussion
Author Contributions
Funding
Institutional Review Board Statement
Informed Consent Statement
Acknowledgments
Conflicts of Interest
Appendix A. Theoretical Calculations
Appendix A.1. Upper and Lower Bounds
Appendix A.1.1. Antibody Equations
Appendix A.1.2. Wild-Type Virus Equations
Appendix A.1.3. Mutant Virus Equations
References
- Albayrak, H.; Ozan, E. Serosurveillance for equine infectious anaemia in the Ardahan province of Turkey. Trop. Anim. Health Prod. 2010, 42, 1593–1595. [Google Scholar] [CrossRef] [PubMed]
- Issel, C.J.; Foil, L.D. Studies on equine infectious anemia virus transmission by insects. J. Am. Vet. Med. Assoc. 1984, 184, 293–297. [Google Scholar] [PubMed]
- Bolfa, P.; Barbuceanu, F.; Leau, S.-E.; Leroux, C. Equine infectious anaemia in Europe: Time to re-examine the efficacy of monitoring and control protocols? Equine. Vet. J. 2016, 48, 140–142. [Google Scholar] [CrossRef] [PubMed] [Green Version]
- Issel, C.J.; Cook, R.F.; Mealey, R.H.; Horohov, D.W. Equine Infectious Anemia in 2014: Live with It or Eradicate It? Vet. Clin. Equine. 2014, 30, 561–577. [Google Scholar] [CrossRef] [Green Version]
- Wang, H.N.; Rao, D.; Fu, X.Q.; Hu, M.M.; Dong, J.G. Equine infectious anemia virus in China. Oncotarget 2018, 9, 1356–1364. [Google Scholar] [CrossRef] [PubMed] [Green Version]
- Dorey-Robinson, D.L.W.; Locker, N.; Steinbach, F.; Choudhury, B. Molecular characterization of equine infectious anaemia virus strains detected in England in 2010 and 2012. Transbound. Emerg. Dis. 2019, 66, 2311–2317. [Google Scholar] [CrossRef] [PubMed]
- Jara, M.; Frias-De-Diego, A.; Machado, G. Phylogeography of Equine Infectious Anemia Virus. Front. Ecol. Evol. 2020, 8, 127. [Google Scholar] [CrossRef]
- Leroux, C.; Cadoré, J.; Montelaro, R.C. Equine Infectious Anemia Virus (EIAV): What has HIV’s country cousin got to tell us? Vet. Res. 2004, 35, 485–512. [Google Scholar] [CrossRef] [PubMed] [Green Version]
- McGuire, T.C.; Banks, K.L.; Poppie, M.J. Combined immunodeficiency in horses: Characterization of the lymphocyte defect. Clin. Immunol. Immunopathol. 1975, 3, 555–566. [Google Scholar] [CrossRef]
- Wiler, R.; Leber, R.; Moore, B.B.; VanDyk, L.F.; Perryman, L.E.; Meek, K. Equine severe combined immunodeficiency: A defect in V(D)J recombi- nation and DNA-dependent protein kinase activity. Proc. Natl. Acad. Sci. USA 1995, 92, 11485–11489. [Google Scholar] [CrossRef] [PubMed] [Green Version]
- Taylor, S.D.; Leib, S.R.; Carpenter, S.; Mealey, R.H. Selection of a rare neutralization-resistant variant following passive transfer of convalescent immune plasma in equine infectious anemia virus-challenged SCID horses. J. Virol. 2010, 84, 6536–6548. [Google Scholar] [CrossRef] [PubMed] [Green Version]
- Taylor, S.D.; Leib, S.R.; Wu, W.; Nelson, R.; Carpenter, S.; Mealey, R.H. Protective effects of broadly neutralizing immunoglobulin against homologous and heterologous equine infectious anemia virus infection in horses with severe combined immunodeficiency. J. Virol. 2011, 85, 6814–6818. [Google Scholar] [CrossRef] [Green Version]
- Cook, R.F.; Leroux, C.; Issel, C.J. Equine infectious anemia and equine infectious anemia virus in 2013: A review. Vet. Microbiol. 2013, 167, 181–204. [Google Scholar] [CrossRef]
- Cangelosi, R.A.; Schwartz, E.J.; Wollkind, D.J. A quasi-steady-state approximation to the basic viral dynamics model with a non-cytopathic effect. Front. Microbiol. 2018, 9, 54. [Google Scholar] [CrossRef] [PubMed] [Green Version]
- Schwartz, E.J.; Pawelek, K.A.; Harrington, K.; Cangelosi, R.; Madrid, S. Immune Control of Equine Infectious Anemia Virus Infection by Cell-Mediated and Humoral Responses. Appl. Math. 2013, 4, 171–177. [Google Scholar] [CrossRef]
- Schwartz, E.J.; Vaidya, N.K.; Dorman, K.S.; Carpenter, S.; Mealey, R.H. Dynamics of lentiviral infection in vivo in the absence of adaptive immune responses. Virology 2018, 513, 108–113. [Google Scholar] [CrossRef]
- Ciupe, S.M.; Schwartz, E.J. Understanding virus-host dynamics following EIAV infection in SCID horses. J. Theor. Biol. 2014, 343, 1–8. [Google Scholar] [CrossRef] [PubMed]
- Allen, L.J.S.; Schwartz, E.J. Free-virus and cell-to-cell transmission in models of equine infectious anemia virus. Math. Biosci. 2015, 270, 237–248. [Google Scholar] [CrossRef] [PubMed]
- Schwartz, E.J.; Nanda, S.; Mealey, R.H. Antibody escape kinetics of equine infectious anemia virus infection of horses. J. Virol. 2015, 89, 6945–6951. [Google Scholar] [CrossRef] [Green Version]
- Geethamalini, S.; Balamuralitharan, S. Semianalytical solutions by homotopy analysis method for EIAV infection with stability analysis. Adv. Differ. Equ. 2018, 2018, 356. [Google Scholar] [CrossRef] [Green Version]
- Balamuralitharan, S.; Geethamalini, S. Parameter Estimation of Model for EIAV Infection using HPM. Int. J. Pure Appl. Math. 2017, 113, 196–204. [Google Scholar]
- Geethamalini, S.; Balamuralitharan, S. Dynamical analysis of EIAV infection with cytotoxic T-lymphocyte immune response delay. Results Appl. Math. 2019, 2, 100025. [Google Scholar] [CrossRef]
- Schwartz, E.J.; Smith?, R.J. Identifying the conditions under which antibodies protect against infection by Equine Infectious Anemia Virus. Vaccines 2014, 2, 397–421. [Google Scholar] [CrossRef] [PubMed] [Green Version]
- Al-arydah, M.; Smith?, R.J.; Lutscher, F. Modelling gender-structured wildlife diseases with harvesting: Chronic Wasting Disease as an example. Int. Sch. Res. Not. 2012, 2012. [Google Scholar] [CrossRef] [Green Version]
- Kot, M. Elements of Mathematical Ecology; Cambridge University Press: Cambridge, UK, 2001. [Google Scholar]
- Schwartz, E.J.; Neumann, A.U.; Teixeira, A.V.; Bruggeman, L.A.; Rappaport, J.; Perelson, A.S.; Klotman, P.E. Effect of target cell availability on HIV-1 production in vitro. AIDS 2002, 16, 341–345. [Google Scholar] [CrossRef]
- Mansky, L.M.; Temin, H.M. Lower in vivo mutation rate of human immunodeficiency virus type 1 than that predicted from the fidelity of purified reverse transcriptase. J. Virol. 1995, 69, 5087–5094. [Google Scholar] [CrossRef] [Green Version]
- Lakshmikantham, V.; Bainov, D.D.; Simeonov, P.S. Theory of Impulsive Differential Equations; World Scientific: Singapore, 1989. [Google Scholar]
- Bainov, D.D.; Simeonov, P.S. Systems with Impulsive Effect; Ellis Horwood Ltd.: Chichester, UK, 1989. [Google Scholar]
- Bainov, D.D.; Simeonov, P.S. Impulsive Differential Equations: Periodic Solutions and Applications; Longman Scientific and Technical: Harlow, UK, 1993. [Google Scholar]
- Smith?, R.J.; Schwartz, E.J. Predicting the potential impact of a cytotoxic T-lymphocyte HIV vaccine: How often should you vaccinate and how strong should the vaccine be? Math. Biosci. 2008, 212, 180–187. [Google Scholar] [CrossRef]
- Canini, L.; Conway, J.M.; Perelson, A.S.; Carrat, F. Impact of Different Oseltamivir Regimens on Treating Influenza A Virus Infection and Resistance Emergence: Insights from a Modelling Study. PLoS Comput. Biol. 2014, 10, e1003568. [Google Scholar] [CrossRef]
- Handel, A.; Longini, I.M., Jr.; Antia, R. Antiviral resistance and the control of pandemic influenza: The roles of stochasticity, evolution and model details. J. Theor. Biol. 2009, 256, 117–125. [Google Scholar] [CrossRef] [Green Version]
- Smith, R.; Wahl, L. Distinct effects of protease and reverse transcriptase inhibition in an immunological model of HIV-1 infection with impulsive drug effects. Bull. Math. Biol. 2004, 66, 1259–1283. [Google Scholar] [CrossRef]
- Smith, R.; Wahl, L. Drug resistance in an immunological model of HIV-1 infection with impulsive drug effects. Bull. Math. Biol. 2005, 67, 783–813. [Google Scholar] [CrossRef] [PubMed]
- Rong, L.; Feng, Z.; Perelson, A.S. Emergence of HIV-1 Drug Resistance During Antiretroviral Treatment. Bull. Math. Biol. 2007, 69, 2027–2060. [Google Scholar] [CrossRef] [PubMed]


| Parameter | Description | Sample Value | Units | Reference |
|---|---|---|---|---|
| r | Net virus growth rate | 0.58 | day | [19,23] |
| Mutation rate | – | [23,27] | ||
| WT carrying capacity | virus/mL | Fitted | ||
| p | Antibody-neutralisation rate of WT | 0.0142 | mL/(mg·day) | [23] |
| c | Fitness cost of mutant | 0.19 | – | [19] |
| Mutant carrying capacity | virus/mL | Fitted | ||
| q | Ab neutralisation rate of mutant | 0.19 | – | Variable |
| d | Antibody decay rate | 0.0315 | day | [23] |
| Antibody infusion | 38.4 | mg/mL | [11,12,23] | |
| Period | 7 | days | Variable | |
| k | Number of infusions | 3 | – | Variable |
| time of the kth infusion | 7 | days | [11,12] | |
| Initial wild-type levels | 224 | virus/mL | [23] | |
| Initial mutant levels | 9 | virus/mL | [23] | |
| Initial antibody levels | 37.2 | mg/mL | [23] |
Publisher’s Note: MDPI stays neutral with regard to jurisdictional claims in published maps and institutional affiliations. |
© 2021 by the authors. Licensee MDPI, Basel, Switzerland. This article is an open access article distributed under the terms and conditions of the Creative Commons Attribution (CC BY) license (https://creativecommons.org/licenses/by/4.0/).
Share and Cite
Schwartz, E.J.; Costris-Vas, C.; Smith?, S.R. Modelling Mutation in Equine Infectious Anemia Virus Infection Suggests a Path to Viral Clearance with Repeated Vaccination. Viruses 2021, 13, 2450. https://doi.org/10.3390/v13122450
Schwartz EJ, Costris-Vas C, Smith? SR. Modelling Mutation in Equine Infectious Anemia Virus Infection Suggests a Path to Viral Clearance with Repeated Vaccination. Viruses. 2021; 13(12):2450. https://doi.org/10.3390/v13122450
Chicago/Turabian StyleSchwartz, Elissa J., Christian Costris-Vas, and Stacey R. Smith?. 2021. "Modelling Mutation in Equine Infectious Anemia Virus Infection Suggests a Path to Viral Clearance with Repeated Vaccination" Viruses 13, no. 12: 2450. https://doi.org/10.3390/v13122450