Mixed-Severity Fire Fosters Heterogeneous Spatial Patterns of Conifer Regeneration in a Dry Conifer Forest

Abstract
:1. Introduction
2. Materials and Methods
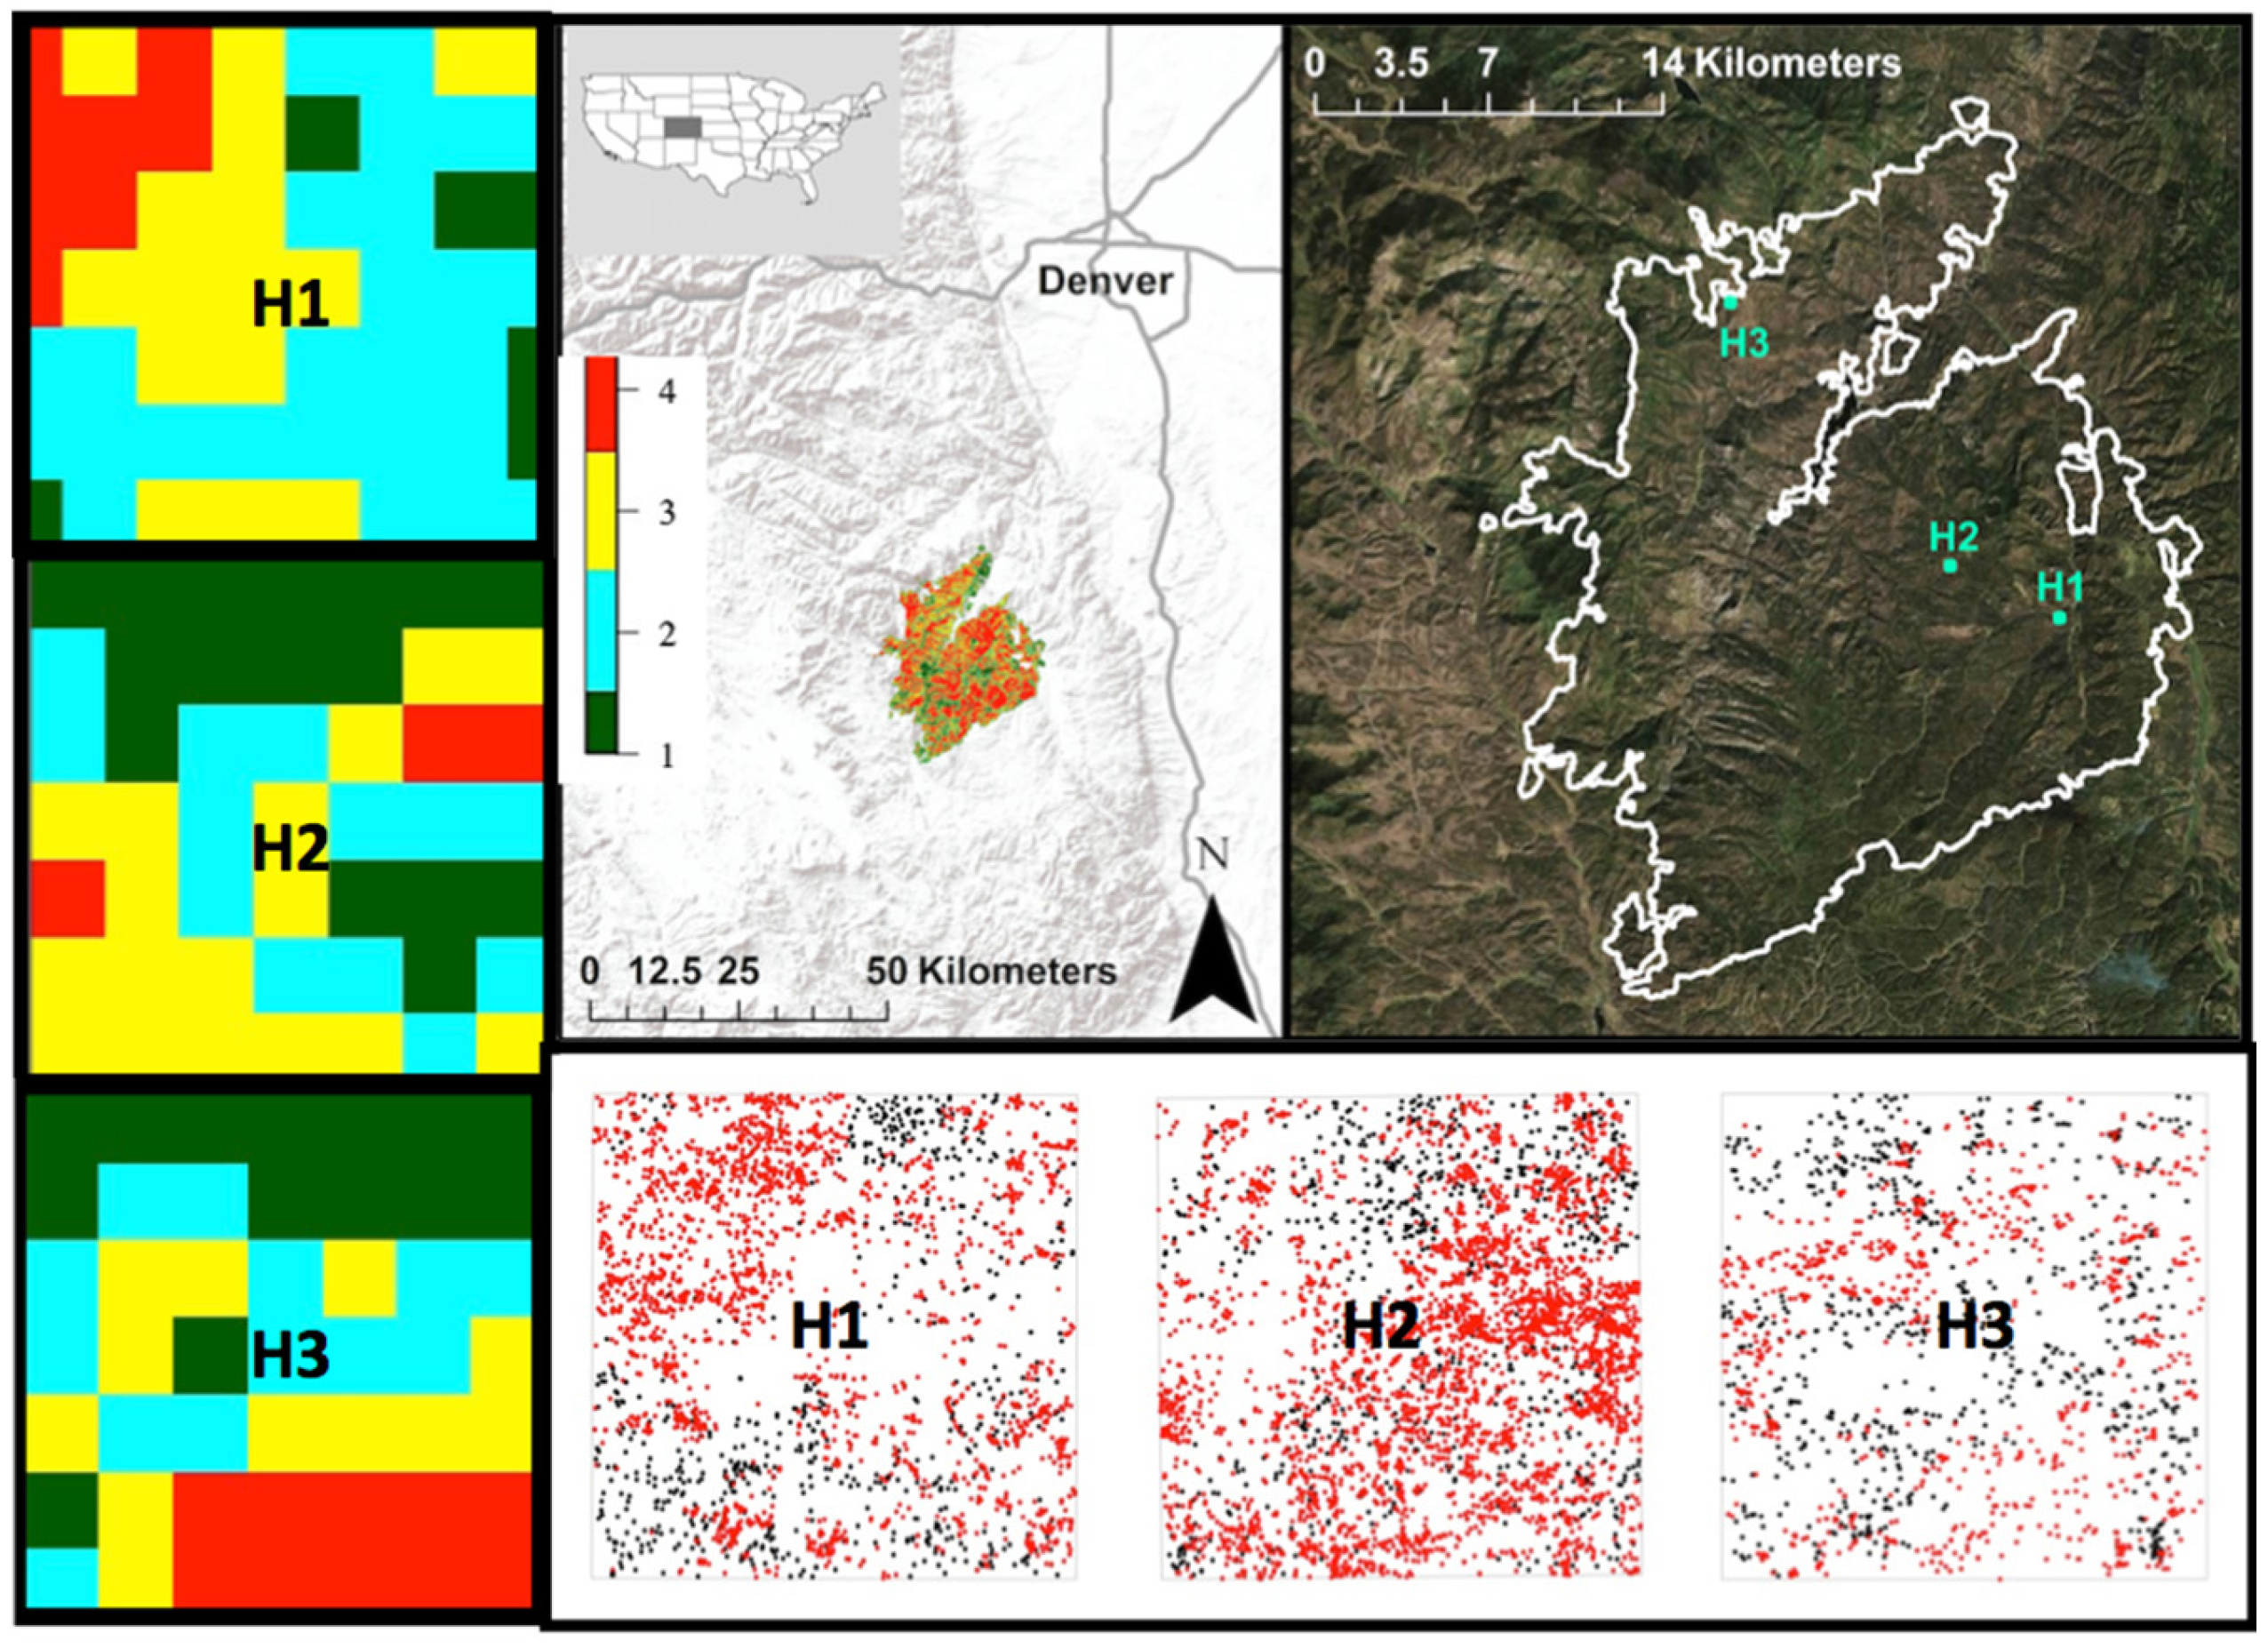
2.1. Study Area
2.2. Study Design
2.3. Residual Forest Structure
2.4. Post-Fire Regeneration
3. Results
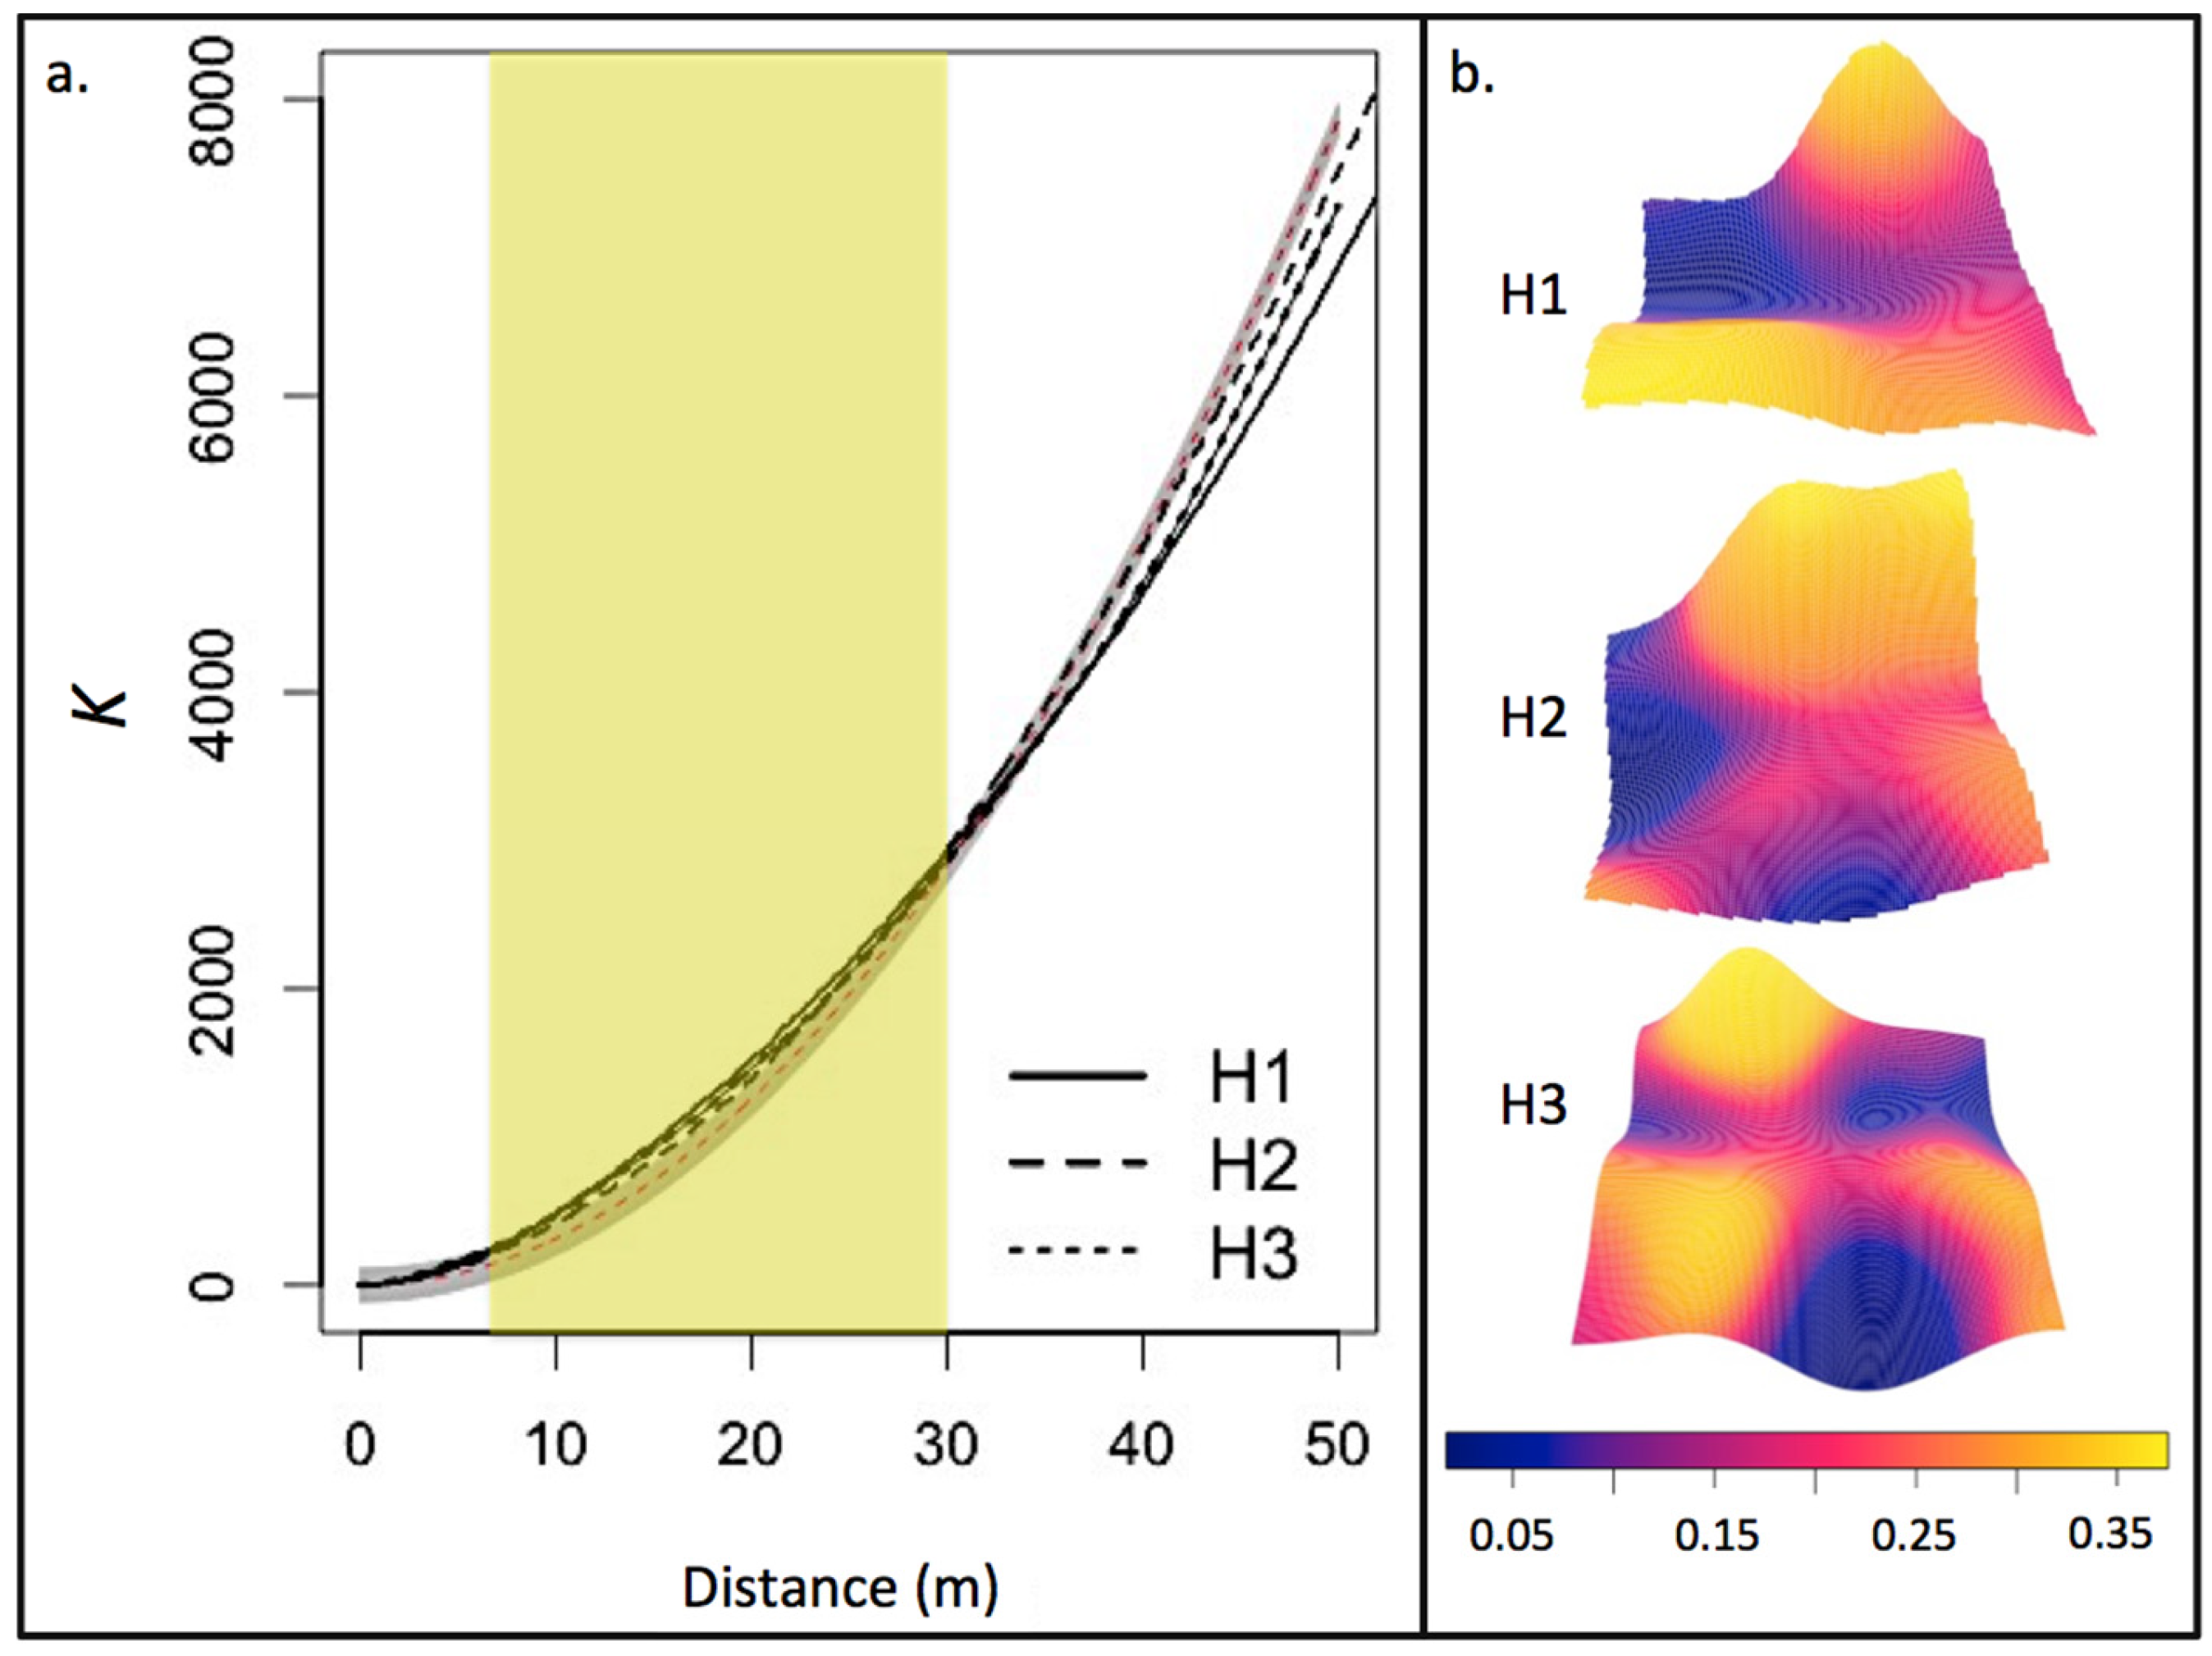
3.1. Residual Forest Structure
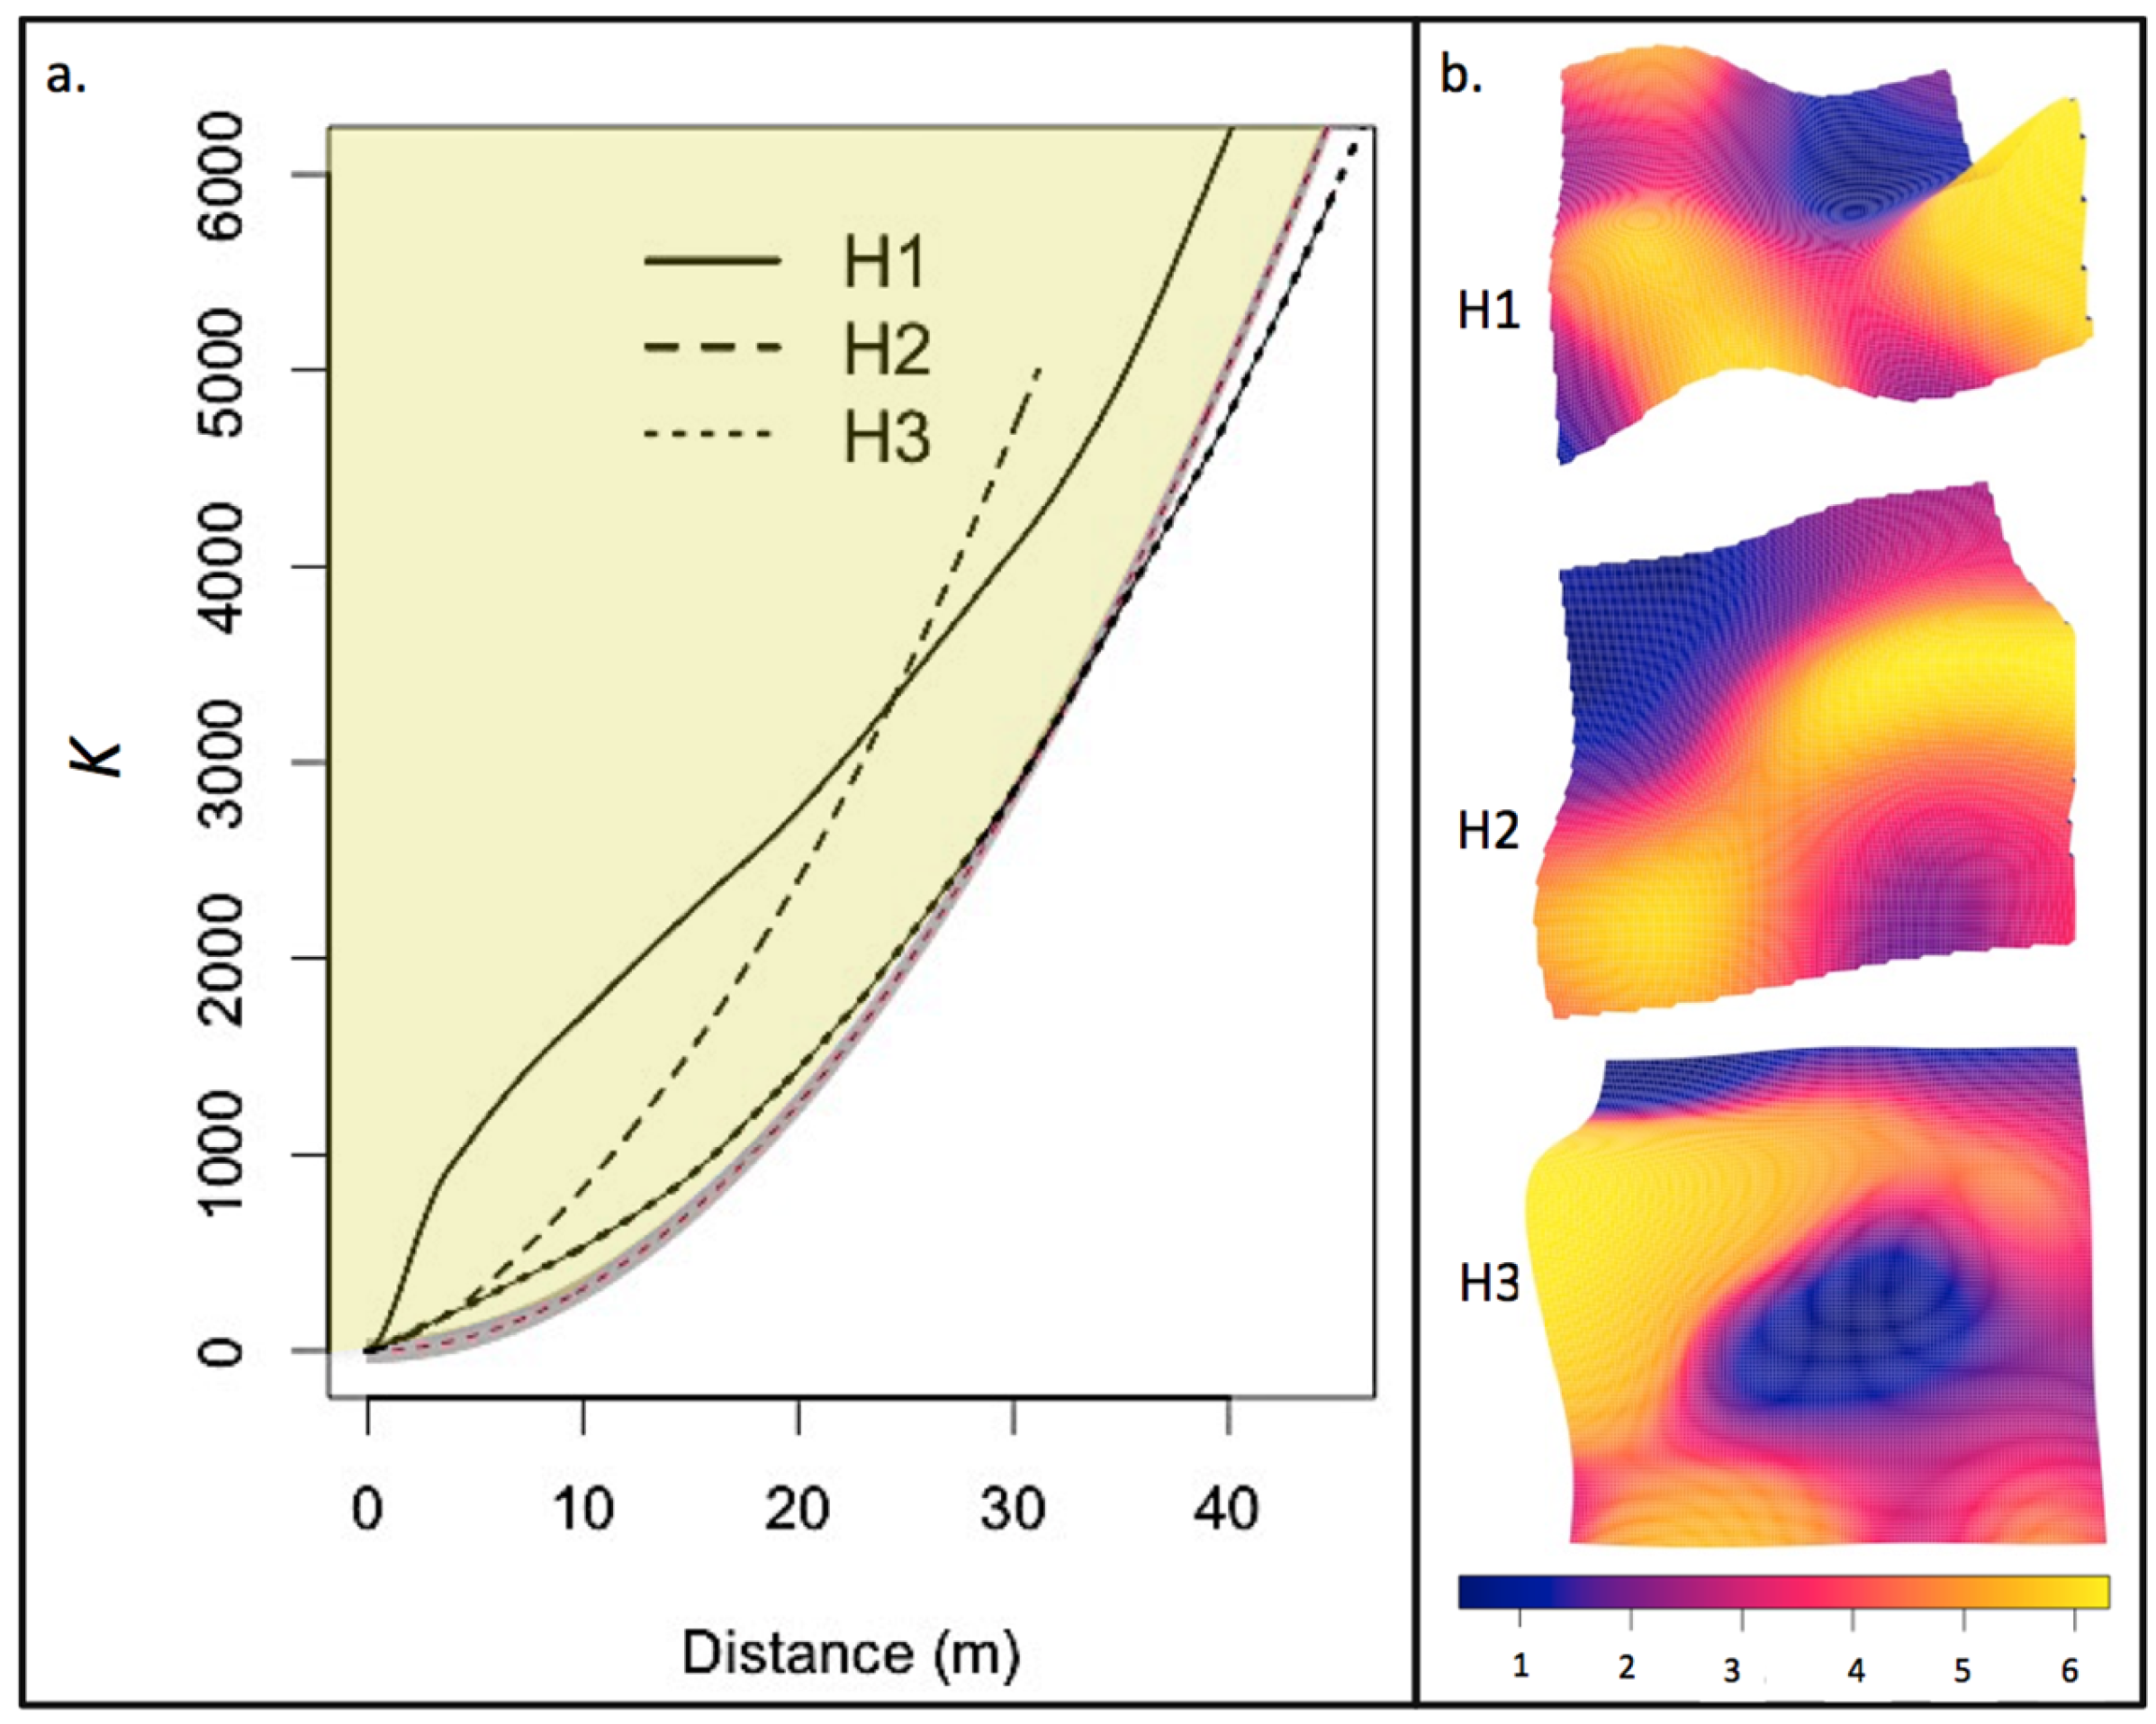
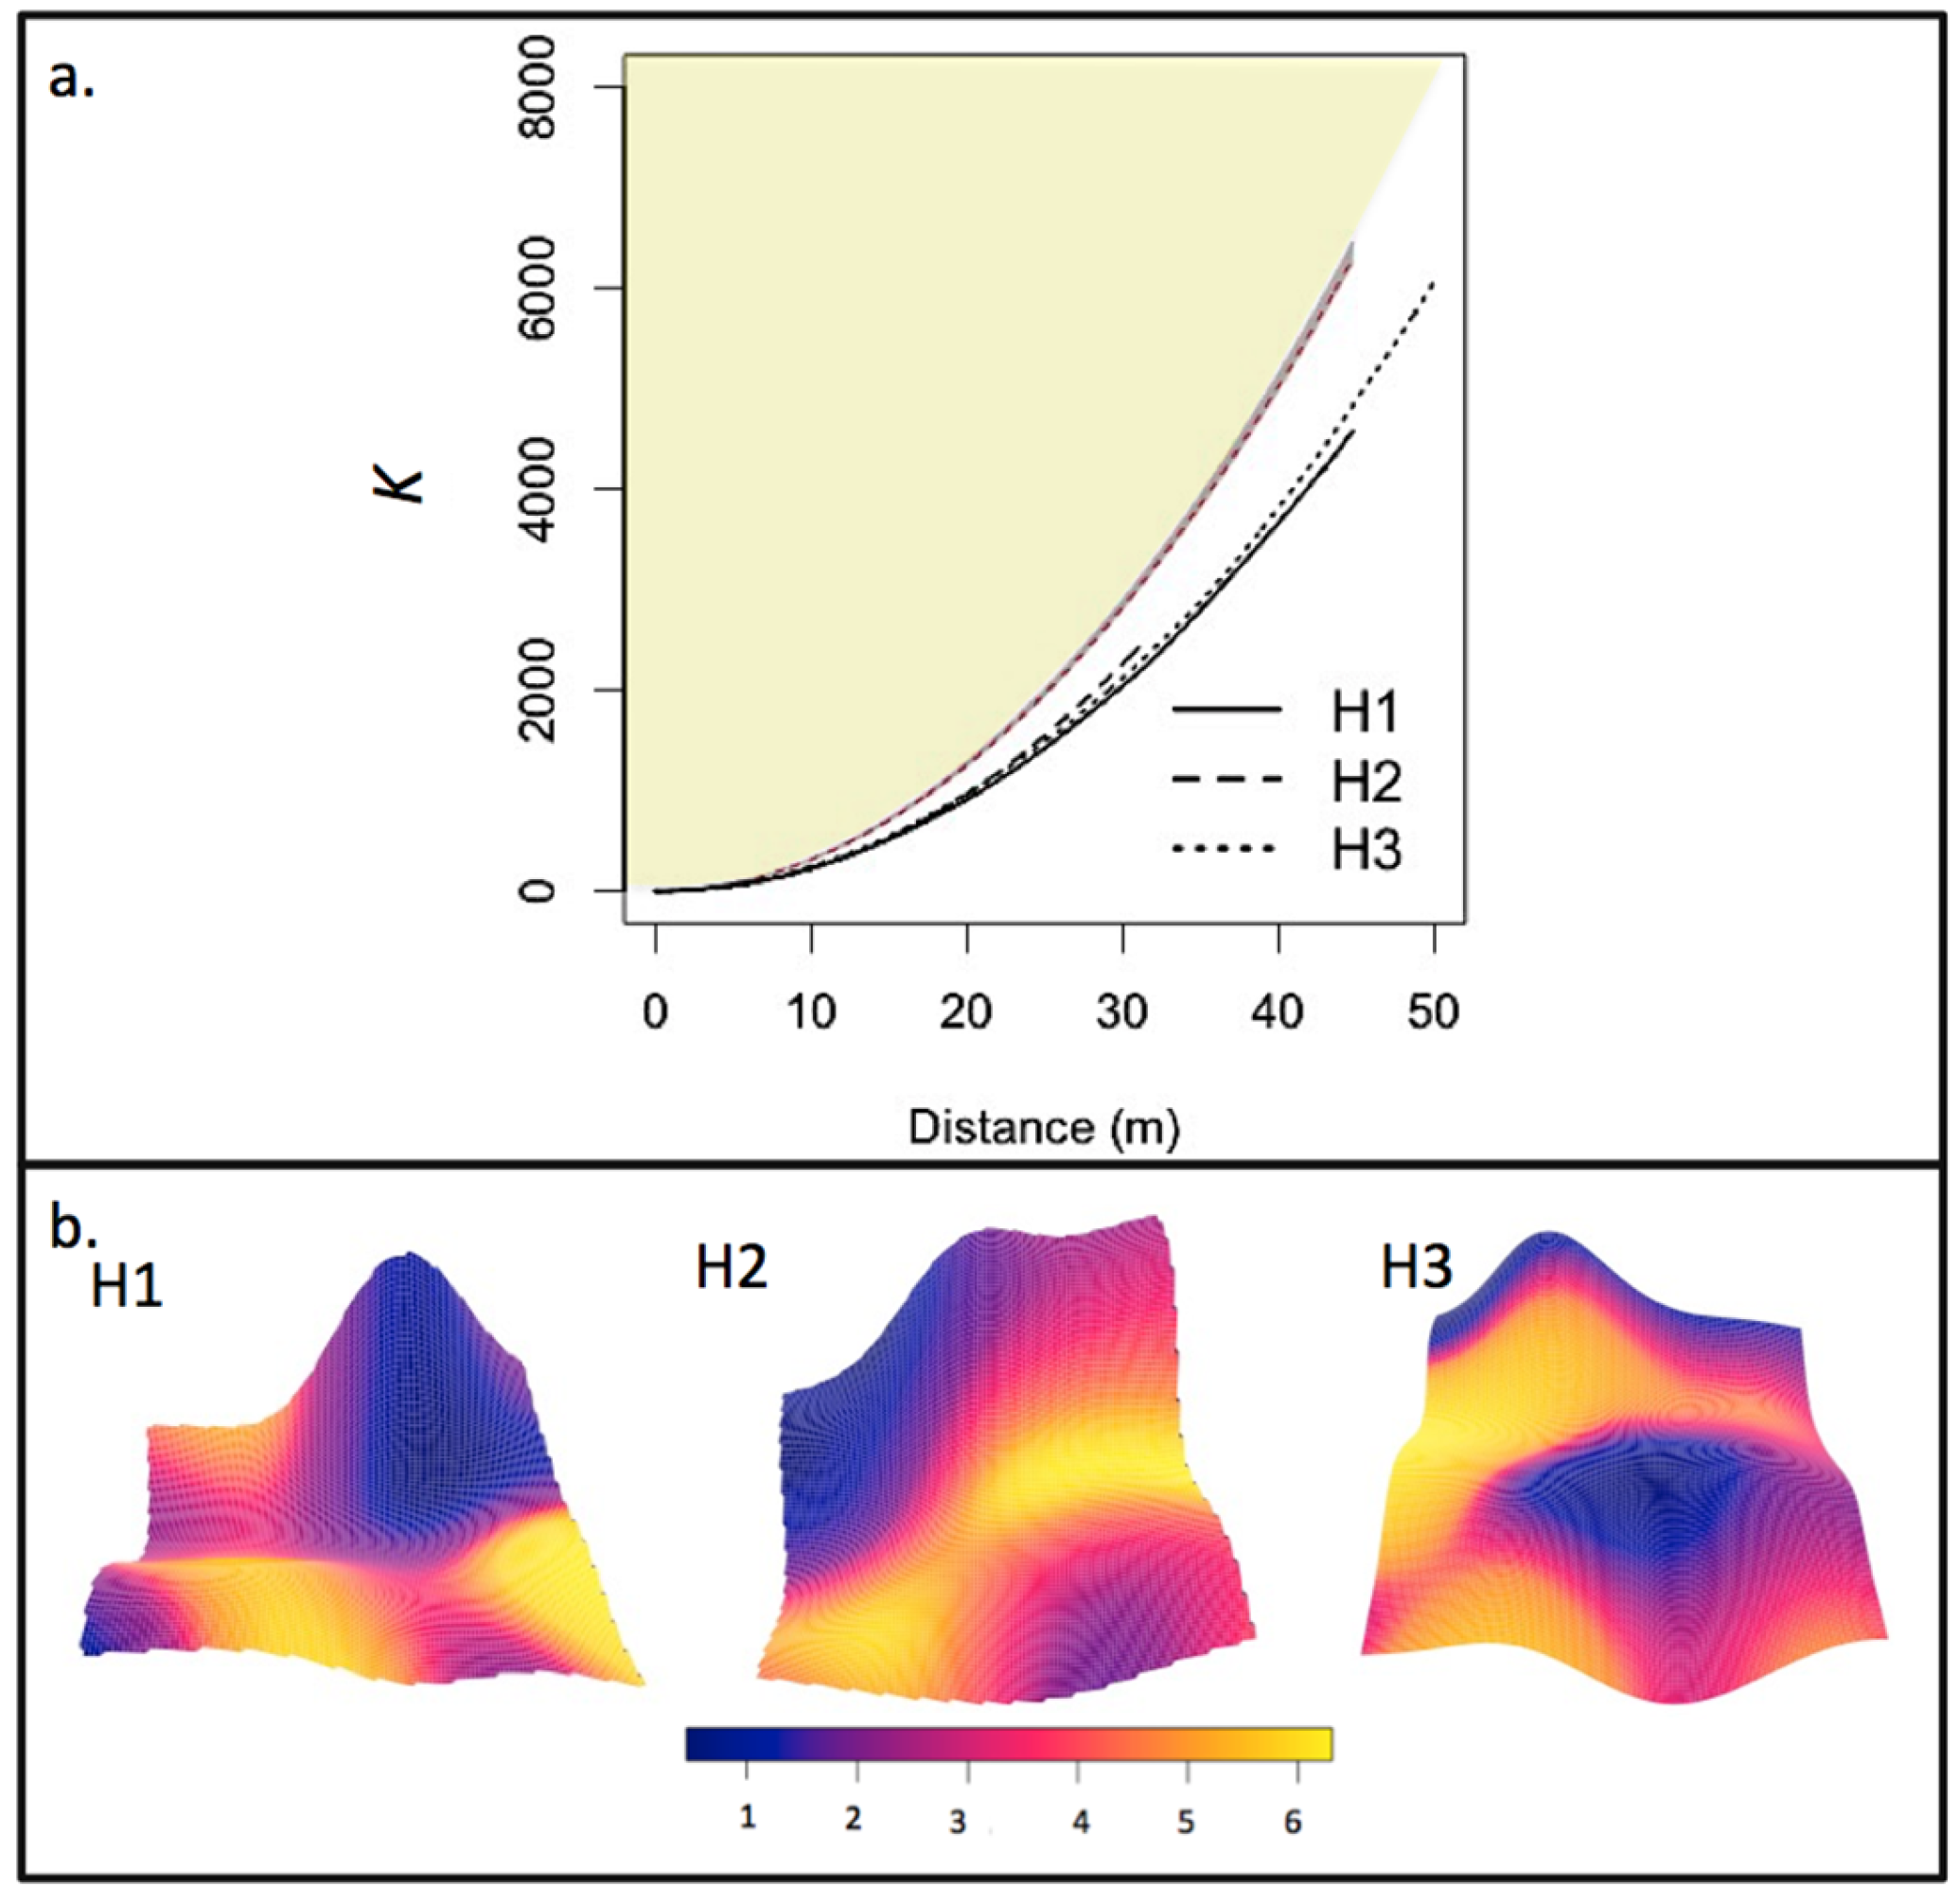
3.2. Post-Fire Regeneration
4. Discussion
4.1. Residual Forest Structure
4.2. Post-Fire Regeneration
4.3. Study Limitations
5. Conclusions
Acknowledgments
Author Contributions
Conflicts of Interest
References
- Allen, C.D.; Savage, M.; Falk, D.A.; Suckling, K.F.; Swetnam, T.W.; Schulke, T.; Stacey, P.B.; Morgan, P.; Hoffman, M.; Klingel, J.T. Ecological Restoration of Southwestern Ponderosa Pine Ecosystems: A Broad Perspective. Ecol. Appl. 2002, 12, 1418–1433. [Google Scholar] [CrossRef]
- Perry, D.A.; Hessburg, P.F.; Skinner, C.N.; Spies, T.A.; Stephens, S.L.; Taylor, A.H.; Franklin, J.F.; McComb, B.; Riegel, G. The ecology of mixed severity fire regimes in Washington, Oregon, and Northern California. For. Ecol. Manag. 2011, 262, 703–717. [Google Scholar] [CrossRef]
- Stevens, J.T.; Safford, H.D.; North, M.P.; Fried, J.S.; Gray, A.N.; Brown, P.M.; Dolanc, C.R.; Dobrowski, S.Z.; Falk, D.A.; Farris, C.A.; et al. Average stand age from forest inventory plots does not describe historical fire regimes in ponderosa pine and mixed-conifer forests of western North America. PLoS ONE 2016, 11, e0147688. [Google Scholar] [CrossRef] [PubMed]
- Covington, W.W.; Moore, M.M. Southwestern ponderosa pine forest structure: Changes since Euro-American settlement. J. For. 1994, 92, 39–47. [Google Scholar]
- Brown, P.M.; Wu, R. Climate and Disturbance Forcing of Episodic Tree Recruitment in a Southwestern Ponderosa Pine landscape. Ecology 2005, 86, 3030–3038. [Google Scholar] [CrossRef]
- Arno, S.F.; Parsons, D.J.; Keane, R.E. Mixed-severity fire regimes in the northern Rocky Mountains: Consequences of fire exclusion and options for the future. In Proceedings: Wilderness Science in a Time of Change Conference; Utah State University: Logan, UT, USA, 2000; Volume RMRS-P-15-5, pp. 225–232. [Google Scholar]
- Larson, A.J.; Churchill, D. Tree spatial patterns in fire-frequent forests of western North America, including mechanisms of pattern formation and implications for designing fuel reduction and restoration treatments. For. Ecol. Manag. 2012, 267, 74–92. [Google Scholar] [CrossRef]
- Brown, P.M.; Battaglia, M.A.; Fornwalt, P.J.; Gannon, B.; Huckaby, L.S.; Julian, C.; Cheng, A.S. Historical (1860) forest structure in ponderosa pine forests of the northern Front Range, Colorado. Can. J. For. Res. 2015, 45, 1462–1473. [Google Scholar] [CrossRef]
- Westerling, A.L.; Hidalgo, H.G.; Cayan, D.R.; Swetnam, T.W. Warming and earlier spring increase western U.S. forest wildfire activity. Science 2006, 313, 940–943. [Google Scholar] [CrossRef] [PubMed]
- Miller, J.D.; Safford, H.D.; Crimmins, M.; Thode, A.E. Quantitative Evidence for Increasing Forest Fire Severity in the Sierra Nevada and Southern Cascade Mountains, California and Nevada, USA. Ecosystems 2009, 12, 16–32. [Google Scholar] [CrossRef]
- Dillon, G.K.; Holden, Z.A.; Morgan, P.; Crimmins, M.A.; Heyerdahl, E.K.; Luce, C.H. Both topography and climate affected forest and woodland burn severity in two regions of the western US, 1984 to 2006. Ecosphere 2011, 2, 1–33. [Google Scholar] [CrossRef]
- Miller, J.D.; Safford, H.D. Trends in wildfire severity: 1984 to 2010 in the Sierra Nevada, Modoc Plateau, and southern Cascades, California, USA. Fire Ecol. 2012, 8, 41–57. [Google Scholar] [CrossRef]
- Belsky, A.J.; Blumenthal, D.M. Effects of Livestock Grazing on Stand Dynamics and Soils in Upland Forests of the Interior West. Conserv. Biol. 1997, 11, 315–327. [Google Scholar] [CrossRef]
- O’Connor, C.D.; Falk, D.A.; Lynch, A.M.; Swetnam, T.W. Fire severity, size, and climate associations diverge from historical precedent along an ecological gradient in the Pinaleño Mountains, Arizona, USA. For. Ecol. Manag. 2014, 329, 264–278. [Google Scholar] [CrossRef]
- Guiterman, C.H.; Margolis, E.Q.; Swetnam, T.W. Dendroecological Methods for Reconstructing High-Severity Fire in Pine-Oak Forests. Tree-Ring Res. 2015, 71, 67–77. [Google Scholar] [CrossRef]
- Harris, L.; Taylor, A.H. Topography, fuels, and fire exclusion drive fire severity of the rim fire in an old-growth mixed-conifer forest, Yosemite National Park, USA. Ecosystems 2015, 18, 1192–1208. [Google Scholar] [CrossRef]
- Lentile, L.B.; Smith, F.W.; Shepperd, W.D. Patch structure, fire-scar formation, and tree regeneration in a large mixed-severity fire in the South Dakota Black Hills, USA. Can. J. For. Res. 2005, 35, 2875–2885. [Google Scholar] [CrossRef]
- Haire, S.L.; McGarigal, K. Effects of landscape patterns of fire severity on regenerating ponderosa pine forests (Pinus ponderosa) in New Mexico and Arizona, USA. Landsc. Ecol. 2010, 25, 1055–1069. [Google Scholar] [CrossRef]
- Reilly, M.J.; Dunn, C.J.; Meigs, G.W.; Spies, T.A.; Kennedy, R.E.; Bailey, J.D.; Briggs, K. Contemporary patterns of fire extent and severity in forests of the Pacific Northwest, USA (1985–2010). Ecosphere 2017, 8. [Google Scholar] [CrossRef]
- Arno, S.F. Forest Fire History in the Northern Rockies. J. For. 1980, 78, 460–465. [Google Scholar]
- Keyser, T.L.; Lentile, L.B.; Smith, F.W.; Shepperd, W.D. Changes in Forest Structure After a Large, Mixed-Severity Wildfire in Ponderosa Pine Forests of the Black Hills, South Dakota, USA. For. Sci. 2008, 54, 328–338. [Google Scholar]
- Fulé, P.Z.; Crouse, J.E.; Roccaforte, J.P.; Kalies, E.L. Do thinning and/or burning treatments in western USA ponderosa or Jeffrey pine-dominated forests help restore natural fire behavior? For. Ecol. Manag. 2012, 269, 68–81. [Google Scholar] [CrossRef]
- Collins, B.M.; Roller, G.B. Early forest dynamics in stand-replacing fire patches in the northern Sierra Nevada, California, USA. Landsc. Ecol. 2013, 28, 1801–1813. [Google Scholar] [CrossRef]
- Dodson, E.K.; Root, H.T. Conifer regeneration following stand-replacing wildfire varies along an elevation gradient in a ponderosa pine forest, Oregon, USA. For. Ecol. Manag. 2013, 302, 163–170. [Google Scholar] [CrossRef]
- Chambers, M.E.; Fornwalt, P.J.; Malone, S.L.; Battaglia, M.A. Patterns of conifer regeneration following high severity wildfire in ponderosa pine—Dominated forests of the Colorado Front Range. For. Ecol. Manag. 2016, 378, 57–67. [Google Scholar] [CrossRef]
- Rother, M.T.; Veblen, T.T. Limited conifer regeneration following wildfires in dry ponderosa pine forests of the Colorado Front Range. Ecosphere 2016, 7, e01594. [Google Scholar] [CrossRef]
- Kemp, K.B.; Higuera, P.E.; Morgan, P. Fire legacies impact conifer regeneration across environmental gradients in the U.S. northern Rockies. Landsc. Ecol. 2016, 31, 619–636. [Google Scholar] [CrossRef]
- Welch, K.R.; Safford, H.D.; Young, T.P. Predicting conifer establishment post wildfire in mixed conifer forests of the North American Mediterranean-climate zone. Ecosphere 2016, 7, e01609. [Google Scholar] [CrossRef]
- Owen, S.M.; Sieg, C.H.; Sánchez Meador, A.J.; Fulé, P.Z.; Iniguez, J.M.; Baggett, L.S.; Fornwalt, P.J.; Battaglia, M.A. Spatial patterns of ponderosa pine regeneration in high-severity burn patches. For. Ecol. Manag. 2017, 405, 134–149. [Google Scholar] [CrossRef]
- Donato, D.C.; Harvey, B.J.; Turner, M.G. Regeneration of montane forests 24 years after the 1988 Yellowstone fires: A fire-catalyzed shift in lower treelines? Ecosphere 2016, 7, e01410. [Google Scholar] [CrossRef]
- Ziegler, J.P.; Hoffman, C.M.; Fornwalt, P.J.; Sieg, C.H.; Battaglia, M.A.; Chambers, M.E.; Iniguez, J.M. Tree Regeneration Spatial Patterns in Ponderosa Pine Forests Following Stand-Replacing Fire: Influence of Topography and Neighbors. For. Trees Livelihoods 2017, 8, 391. [Google Scholar] [CrossRef]
- Stevens-Rumann, C.S.; Sieg, C.H.; Hunter, M.E. Ten years after wildfires: How does varying tree mortality impact fire hazard and forest resiliency? For. Ecol. Manag. 2012, 267, 199–208. [Google Scholar] [CrossRef]
- Larson, A.J.; Belote, R.T.; Cansler, C.A.; Parks, S.A.; Dietz, M.S. Latent resilience in ponderosa pine forest: Effects of resumed frequent fire. Ecol. Appl. 2013, 23, 1243–1249. [Google Scholar] [CrossRef] [PubMed]
- Graham, R.T. Hayman Fire Case Study: Summary; USDA Forest Service: Washington, DC, USA, 2003.
- Northwest Alliance for Computational Science & Engineering. PRISM Climate Data. Available online: http://prism.nacse.org/normals/ (accessed on 1 May 2014).
- Brown, P.M.; Kaufmann, M.R.; Shepperd, W.D. Long-term, landscape patterns of past fire events in a montane ponderosa pine forest of central Colorado. Landsc. Ecol. 1999, 14, 513–532. [Google Scholar] [CrossRef]
- Kaufmann, M.R.; Regan, C.M.; Brown, P.M. Heterogeneity in ponderosa pine/Douglas-fir forests: Age and size structure in unlogged and logged landscapes of central Colorado. Can. J. For. Res. 2000, 30, 698–711. [Google Scholar] [CrossRef]
- USGS. Monitoring Trends in Burn Severity. Available online: https://mtbs.gov (accessed on 1 May 2014).
- Bradshaw, L.; Bartlette, R.; McGinely, J.; Zeller, K. Fire behavior, fuel treatments, and fire suppression on the Hayman Fire—Part 1: Fire weather, meteorology, and climate. In Hayman Fire Case Study; Graham, R.T., Ed.; RMRS-GTR-114; Department of Agriculture, Forest Service, Rocky Mountain Research Station: Ogden, UT, USA, 2003; pp. 36–58. [Google Scholar]
- Fornwalt, P.J.; Kaufmann, M.R.; Huckaby, L.S.; Stohlgren, T.J. Effects of past logging and grazing on understory plant communities in a montane Colorado forest. Plant Ecol. 2009, 203, 99–109. [Google Scholar] [CrossRef]
- Franklin, J.F.; Spies, T.A.; Van Pelt, R.; Carey, A.B. Disturbances and structural development of natural forest ecosystems with silvicultural implications, using Douglas-fir forests as an example. For. Ecol. Manag. 2002, 155, 399–423. [Google Scholar] [CrossRef]
- Curtis, R.O.; Marshall, D.D. Technical note: Why quadratic mean diameter? West. J. Appl. For. 2000, 15, 137–139. [Google Scholar]
- Reilly, M.J.; Spies, T.A. Regional variation in stand structure and development in forests of Oregon, Washington, and inland Northern California. Ecosphere 2015, 6, 1–27. [Google Scholar] [CrossRef]
- Baddeley, A.; Turner, R. Spatstat: An R Package for Analyzing Spatial Point Patterns. J. Stat. Softw. 2005, 12, 1–42. [Google Scholar] [CrossRef]
- Baddeley, A.; Rubak, E.; Turner, R. Spatial Point Patterns: Methodology and Applications with R; Chapman and Hall/CRC Press: London, UK, 2015. [Google Scholar]
- Kint, V.; Lust, N.; Ferris, R.; Olsthoorn, A. Quantification of forest stand structure applied to Scots pine (Pinus sylvestris L.) forests. For. Syst. 2000, 9, 147–163. [Google Scholar]
- Ripley, B.D. Modelling Spatial Patterns. J. R. Stat. Soc. Ser. B Stat. Methodol. 1977, 39, 172–212. [Google Scholar]
- Moeur, M. Characterizing spatial patterns of trees using stem-mapped data. For. Sci. 1993, 39, 756–775. [Google Scholar]
- Besag, J.; Diggle, P.J. Simple Monte Carlo Tests for Spatial Pattern. J. R. Stat. Soc. Ser. C Appl. Stat. 1977, 26, 327–333. [Google Scholar] [CrossRef]
- Boyden, S.; Binkley, D.; Shepperd, W. Spatial and temporal patterns in structure, regeneration, and mortality of an old-growth ponderosa pine forest in the Colorado Front Range. For. Ecol. Manag. 2005, 219, 43–55. [Google Scholar] [CrossRef]
- Baddeley, A.; Diggle, P.J.; Hardegen, A.; Lawrence, T.; Milne, R.K.; Nair, G. On tests of spatial pattern based on simulation envelopes. Ecol. Monogr. 2014, 84, 477–489. [Google Scholar] [CrossRef]
- Wiegand, T.; Moloney, K.A. Handbook of Spatial Point-Pattern Analysis in Ecology; CRC Press: Boca Raton, FL, USA, 2013; ISBN 9781420082555. [Google Scholar]
- Fajardo, A.; Goodburn, J.M.; Graham, J. Spatial patterns of regeneration in managed uneven-aged ponderosa pine/Douglas-fir forests of Western Montana, USA. For. Ecol. Manag. 2006, 223, 255–266. [Google Scholar] [CrossRef]
- Fajardo, A.; McIntire, E.J.B. Under strong niche overlap conspecifics do not compete but help each other to survive: Facilitation at the intraspecific level. J. Ecol. 2011, 99, 642–650. [Google Scholar] [CrossRef]
- Lotwick, H.W.; Silverman, B.W. Methods for Analysing Spatial Processes of Several Types of Points. J. R. Stat. Soc. Ser. B Stat. Methodol. 1982, 44, 406–413. [Google Scholar]
- Neyman, J.; Scott, E.L. On a Mathematical Theory of Populations Conceived as Conglomerations of Clusters. Cold Spring Harb. Symp. Quant. Biol. 1957, 22, 109–120. [Google Scholar] [CrossRef]
- Eidenshink, J.; Schwind, B.; Brewer, K.; Zhu, Z.; Quayle, B.; Howard, S. A project for monitoring trends in burn severity. Fire Ecol. 2007, 3, 3–21. [Google Scholar] [CrossRef]
- Finco, M.; Quayle, B.; Zhang, Y.; Lecker, J.; Megown, K.A.; Brewer, C.K. Monitoring Trends and Burn Severity (MTBS): Monitoring Wildfire Activity for the Past Quarter Century Using Landsat Data; U.S. Department of Agriculture, Forest Service, Northern Research Station: Newtown Square, PA, USA, 2012.
- Sörensen, R.; Zinko, U.; Seibert, J. On the calculation of the topographic wetness index: Evaluation of different methods based on field observations. Hydrol. Earth Syst. Sci. Discuss. 2006, 10, 101–112. [Google Scholar] [CrossRef] [Green Version]
- Weiss, A. Topographic position and landforms analysis. Presented at the ESRI User Conference, San Diego, CA, USA, 9–13 July 2001; Volume 200. [Google Scholar]
- Jenness, J. Topographic Position Index (tpi_jen. avx) Extension for ArcView 3. x, v. 1.3 a. Jenness Enterprises. Available online: http://www.jennessent.com/arcview/tpi.htm (accessed on 4 July 2017).
- NASA. Global Data Explorer. Available online: https://gdex.cr.usgs.gov/gdex/ (accessed on 1 May 2014).
- Briggs, J.S.; Fornwalt, P.J.; Feinstein, J.A. Short-term ecological consequences of collaborative restoration treatments in ponderosa pine forests of Colorado. For. Ecol. Manag. 2017, 395, 69–80. [Google Scholar] [CrossRef]
- Reynolds, R.T.; Meador, A.J.S.; Youtz, J.A.; Nicolet, T.; Matonis, M.S.; Jackson, P.L.; DeLorenzo, D.G.; Graves, A.D. Restoring Composition and Structure in Southwestern Frequent-Fire Forests: A Science-Based Framework for Improving Ecosystem Resiliency. 2013. Available online: https://www.fs.fed.us/rm/pubs/rmrs_gtr310 (accessed on 25 November 2017).
- Bonnet, V.H.; Schoettle, A.W.; Shepperd, W.D. Postfire environmental conditions influence the spatial pattern of regeneration for Pinus ponderosa. Can. J. For. Res. 2005, 35, 37–47. [Google Scholar] [CrossRef]
- Cattelino, P.J.; Noble, I.R.; Slatyer, R.O.; Kessell, S.R. Predicting the multiple pathways of plant succession. Environ. Manag. 1979, 3, 41–50. [Google Scholar] [CrossRef]
- Connell, J.H.; Slatyer, R.O. Mechanisms of Succession in Natural Communities and Their Role in Community Stability and Organization. Am. Nat. 1977, 111, 1119–1144. [Google Scholar] [CrossRef]
- Crotteau, J.S.; Morgan Varner, J.; Ritchie, M.W. Post-fire regeneration across a fire severity gradient in the southern Cascades. For. Ecol. Manag. 2013, 287, 103–112. [Google Scholar] [CrossRef]
- Mooney, K.A.; Linhart, Y.B.; Snyder, M.A. Masting in ponderosa pine: Comparisons of pollen and seed over space and time. Oecologia 2011, 165, 651–661. [Google Scholar] [CrossRef] [PubMed]
- League, K.; Veblen, T. Climatic variability and episodic Pinus ponderosa establishment along the forest-grassland ecotones of Colorado. For. Ecol. Manag. 2006, 228, 98–107. [Google Scholar] [CrossRef]
- Shepperd, W.D.; Edminster, C.B.; Mata, S.A. Long-Term Seedfall, Establishment, Survival, and Growth of Natural and Planted Ponderosa Pine in the Colorado Front Range. West. J. Appl. For. 2006, 21, 19–26. [Google Scholar]
- York, R.A.; Battles, J.J.; Heald, R.C. Edge effects in mixed conifer group selection openings: Tree height response to resource gradients. For. Ecol. Manag. 2003, 179, 107–121. [Google Scholar] [CrossRef]
- Moghaddas, J.J.; York, R.A.; Stephens, S.L. Initial response of conifer and California black oak seedlings following fuel reduction activities in a Sierra Nevada mixed conifer forest. For. Ecol. Manag. 2008, 255, 3141–3150. [Google Scholar] [CrossRef]
- Jia, G.; Yu, X.; Fan, D.; Jia, J. Mechanism Underlying the Spatial Pattern Formation of Dominant Tree Species in a Natural Secondary Forest. PLoS ONE 2016, 11, e0152596. [Google Scholar] [CrossRef] [PubMed]
- Johnstone, J.F.; Allen, C.D.; Franklin, J.F.; Frelich, L.E.; Harvey, B.J.; Higuera, P.E.; Mack, M.C.; Meentemeyer, R.K.; Metz, M.R.; Perry, G.L.W.; et al. Changing disturbance regimes, ecological memory, and forest resilience. Front. Ecol. Environ. 2016, 14, 369–378. [Google Scholar] [CrossRef]
- McKenzie, D.A.; Tinker, D.B. Fire-induced shifts in overstory tree species composition and associated understory plant composition in Glacier National Park, Montana. Plant Ecol. 2012, 213, 207–224. [Google Scholar] [CrossRef]
- Denslow, J.S.; Battaglia, L.L. Stand composition and structure across a changing hydrologic gradient: Jean Lafitte National Park, Louisiana, USA. Wetlands 2002, 22, 738–752. [Google Scholar] [CrossRef]
- Rüger, N.; Huth, A.; Hubbell, S.P.; Condit, R. Response of recruitment to light availability across a tropical lowland rain forest community. J. Ecol. 2009, 97, 1360–1368. [Google Scholar] [CrossRef]
- Bever, J.D. Host-specificity of AM fungal population growth rates can generate feedback on plant growth. Plant Soil 2002, 244, 281–290. [Google Scholar] [CrossRef]
- Barker, M.G.; Press, M.C.; Brown, N.D. Photosynthetic characteristics of dipterocarp seedlings in three tropical rain forest light environments: A basis for niche partitioning? Oecologia 1997, 112, 453–463. [Google Scholar] [CrossRef] [PubMed]
- Burslem, D.F.; Garwood, N.C.; Thomas, S.C. Tropical Forest Diversity—The Plot Thickens. Science 2001, 291, 606–607. [Google Scholar] [CrossRef] [PubMed]


| Objectives | Approach | Inference | Scale | Hypotheses | |
|---|---|---|---|---|---|
| Describe residual forest structure | Non-spatial Metric | Density, DBH, Height, QMD, Canopy Cover | Non-spatial attributes of the residual forest | Plot | |
| Spatial Metric | Nearest Neighbor Distance, Distance to the Nearest Tree | Spatial attributes of trees in the residual forest | Within-plot | ||
| Spatial Metric (Positioning) | Clark and Evans Index (CEI) | Spatial pattern of the residual forest | Plot | 1 | |
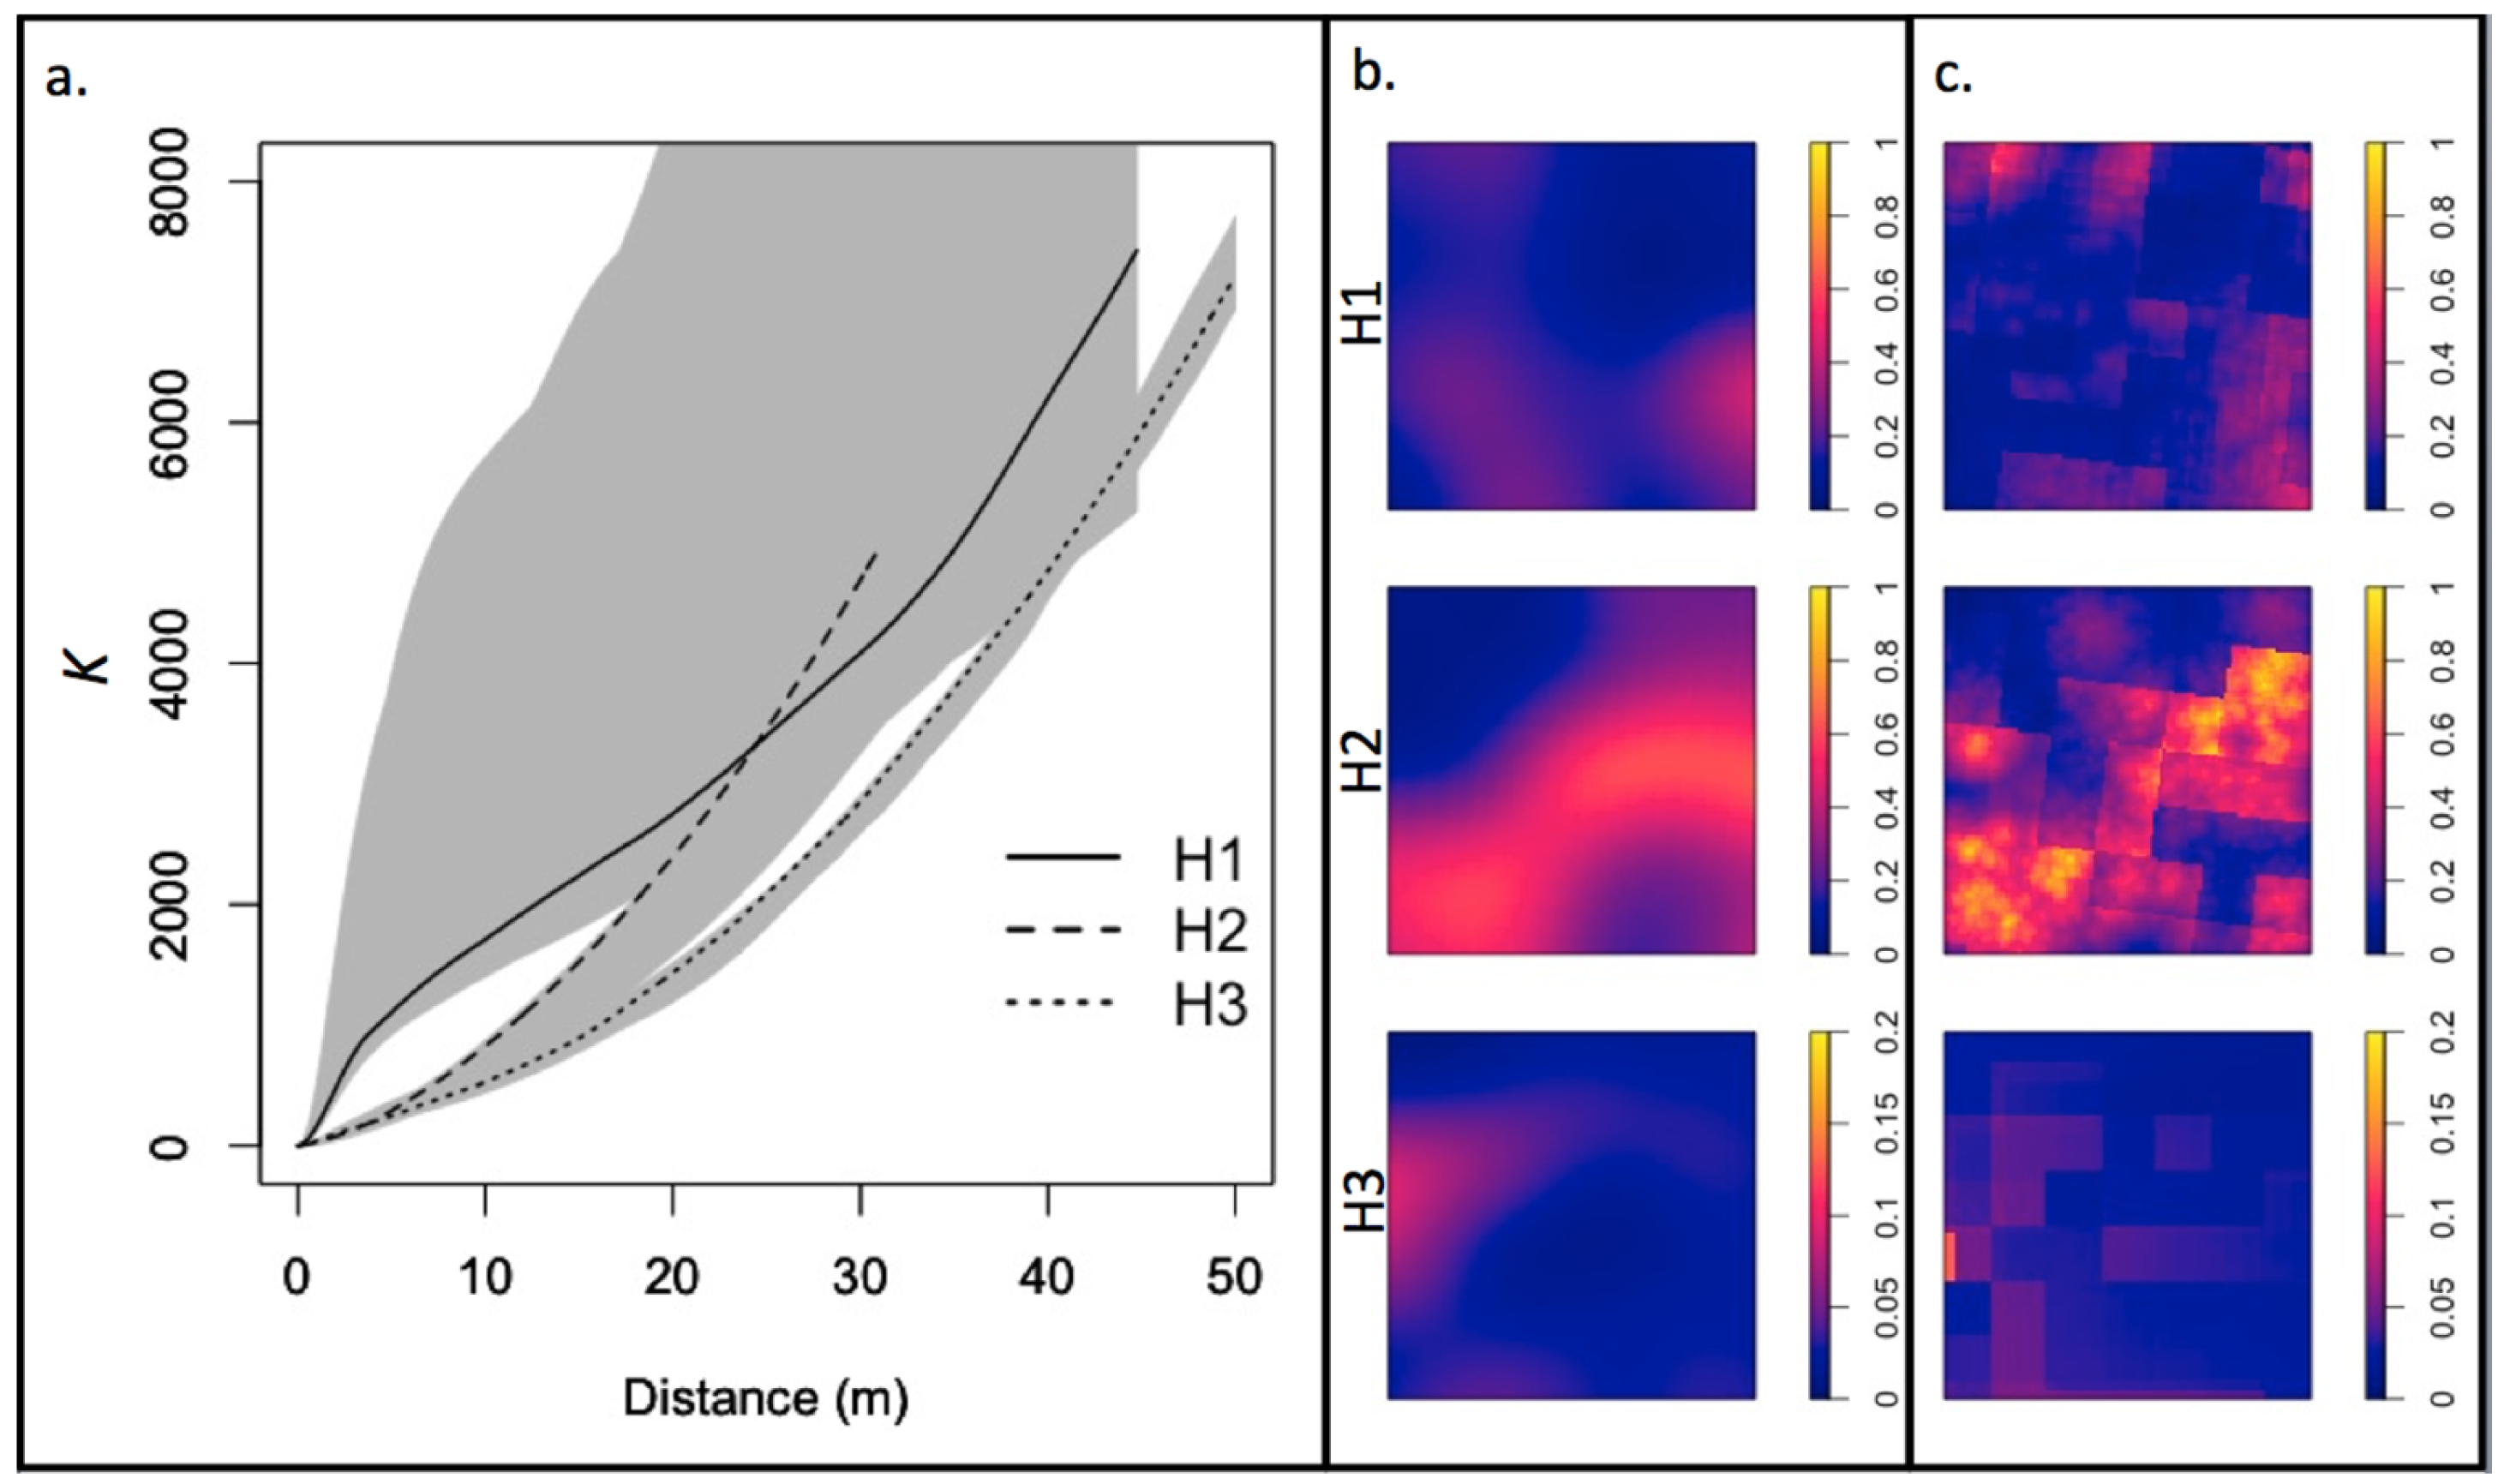
| Spatial Analysis (Positioning) | Ripley’s K Function | Spatial pattern of trees in the residual forest across distance scales | Within-plot | 1 | |
| Spatial Metric (Species Mixture) | Durchmischung Index (DMI) | Residual forest species associations | Plot | ||
| Spatial Metric (Differentiation) | Differenzierung Index (DZI) | Residual forest horizontal and vertical structural complexity | Plot | ||
| Describe the relationship between the residual forest and post-fire conifer regeneration | Spatial Analysis (Positioning) | Ripley’s K Function | Patterning of regenerating trees across distance scales | Within-plot | |
| Spatial Analysis (Positioning) | Bivariate K Function | Attraction or repulsion between residual trees and regenerating trees | Within-plot | 2 | |
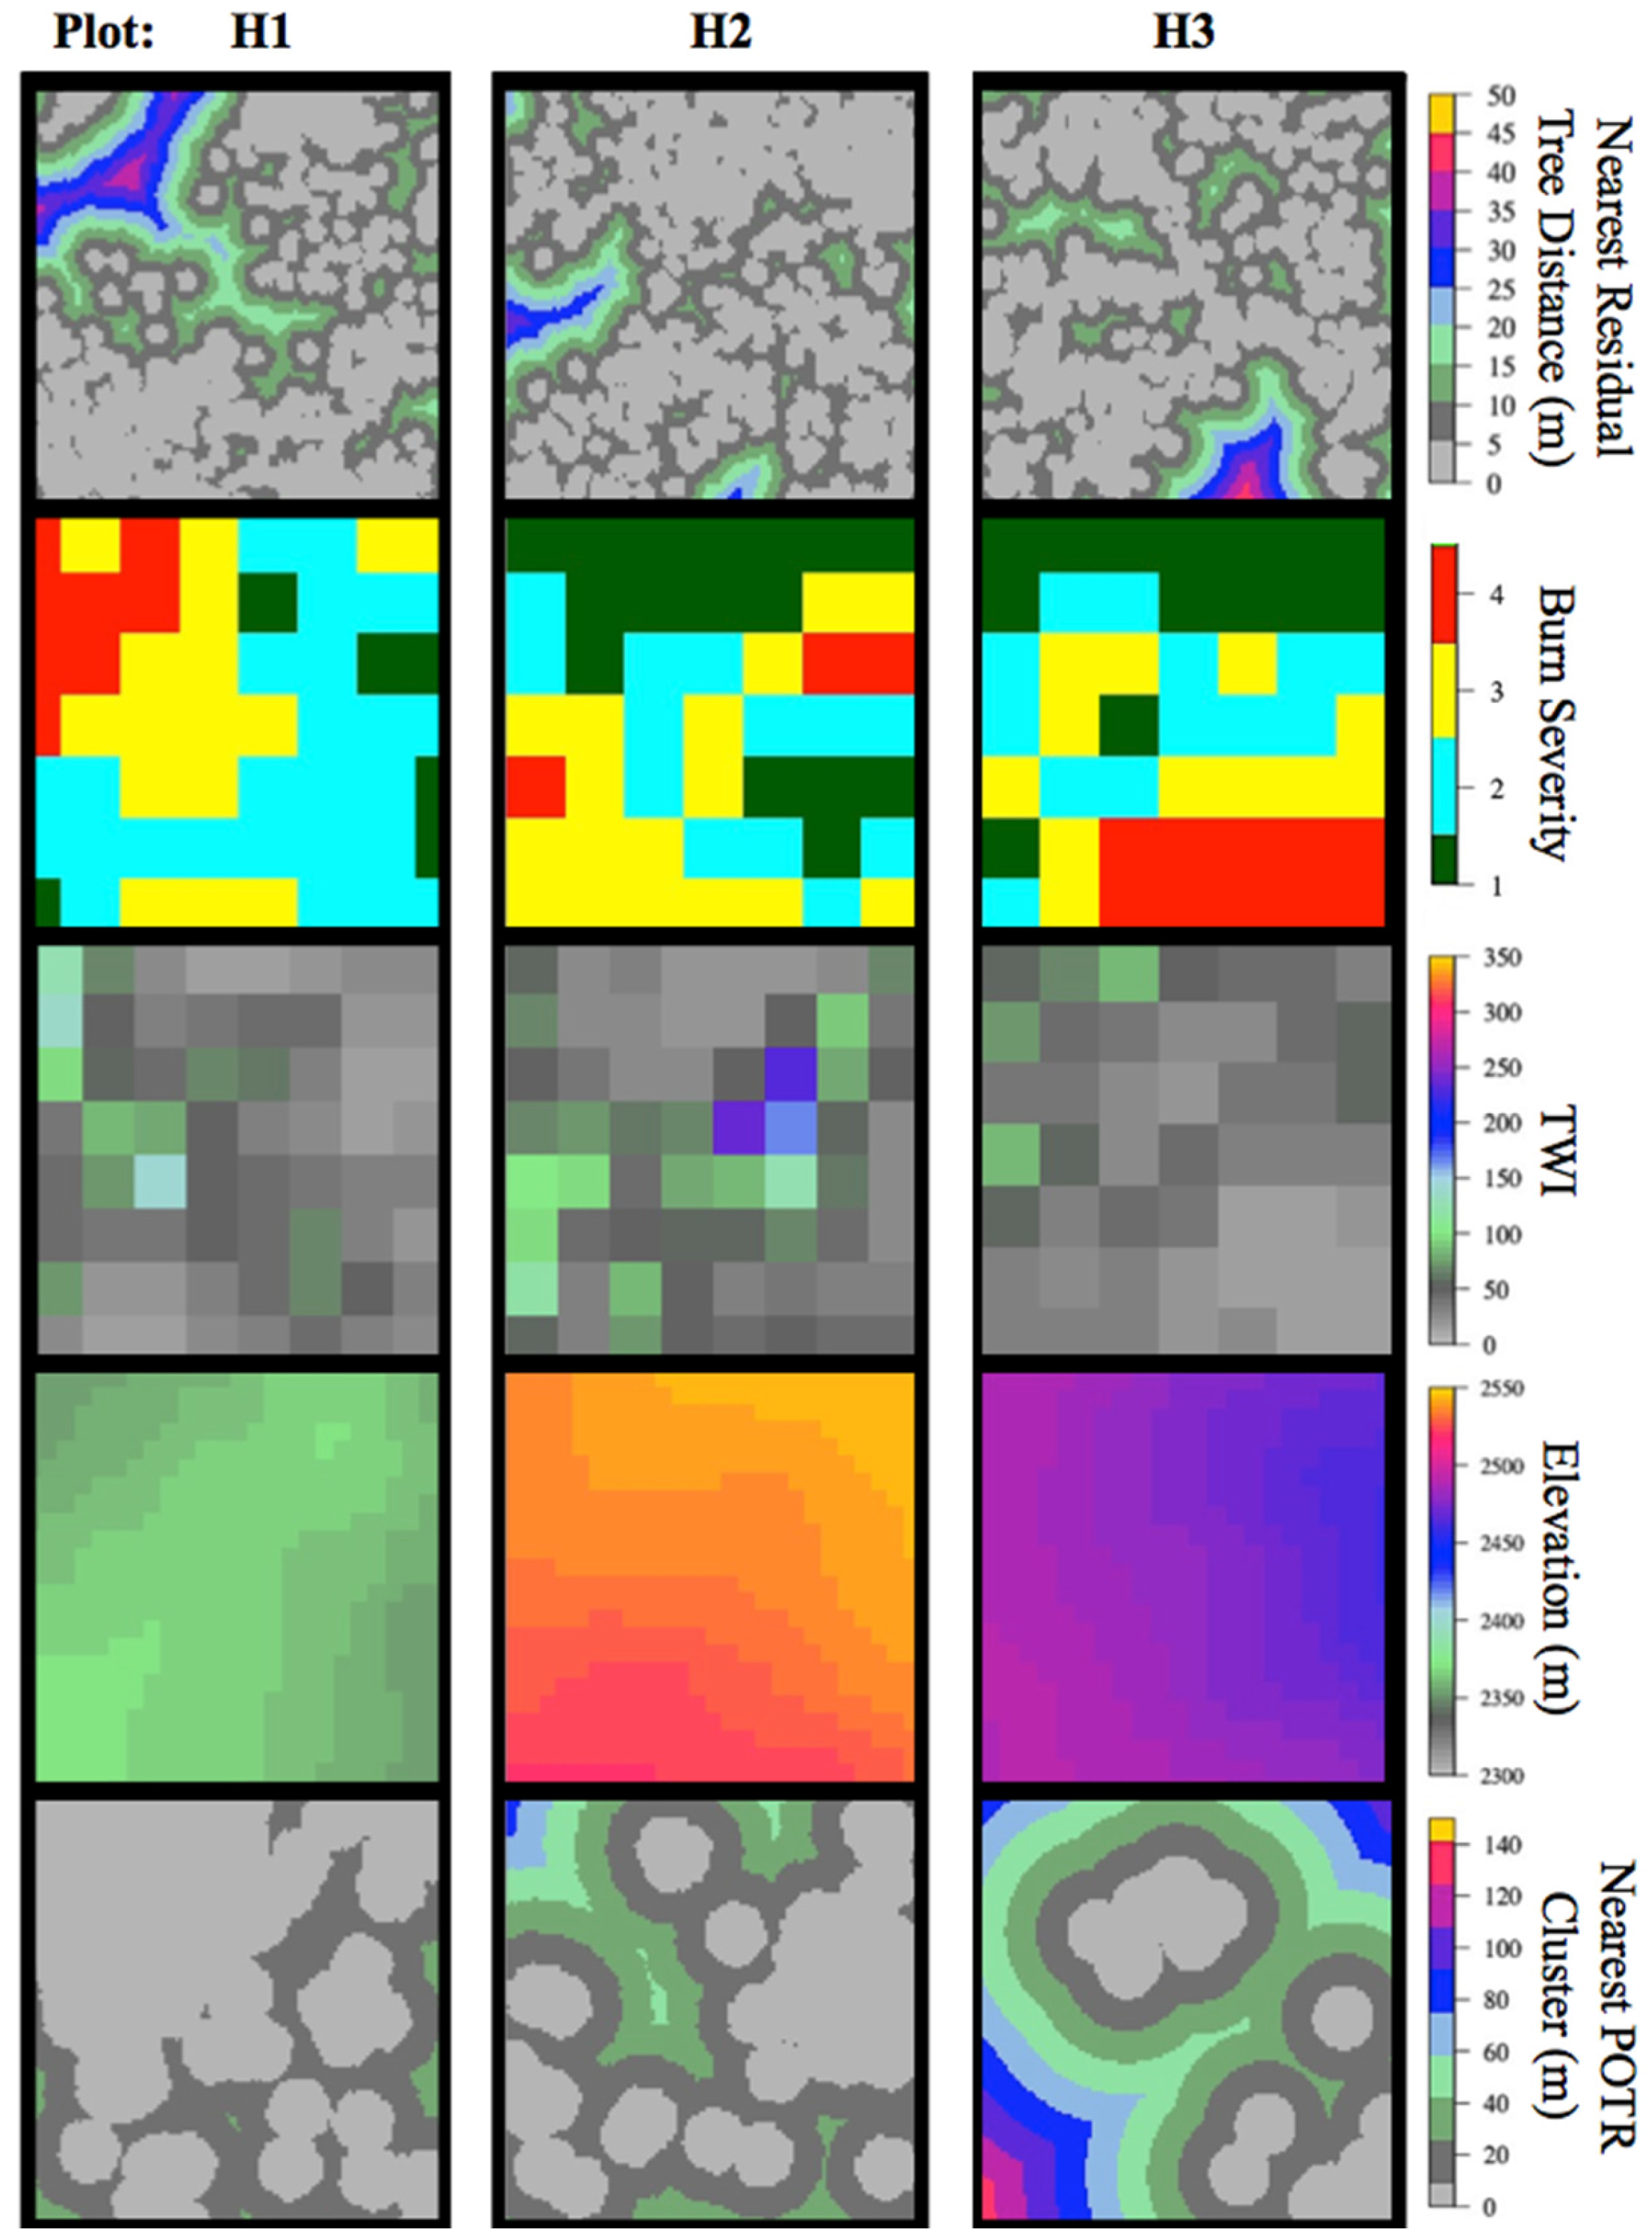
| Drivers of post-fire conifer regeneration density | Spatial Analysis (Positioning) | Neyman–Scott Point-Process Model | Drivers of regeneration density | Within-plot | 3 |
| Plot | H1 | H2 | H3 | Average | Standard Error |
|---|---|---|---|---|---|
| Residual Trees (%) | 99 | 99 | 100 | 99 | 0.4 |
| Residual Regeneration (%) | 1 | 1 | 0 | 1 | 0.4 |
| TPH | 167 | 197 | 173 | 179 | 9 |
| Canopy Cover (%) | 29 | 35 | 30 | 32 | 2 |
| % PIPO | 74 | 73 | 65 | 71 | 3 |
| % PMSE | 22 | 25 | 34 | 27 | 4 |
| % POTR | 3 | 1 | 0.4 | 1 | 1 |
| BA (m2 ha−1) | 8 | 11 | 8 | 9 | 1 |
| QMD (cm) | 25 | 27 | 23 | 25 | 1 |
| Nearest Neighbor (m) | 3 | 3 | 3 | 3 | 0.1 |
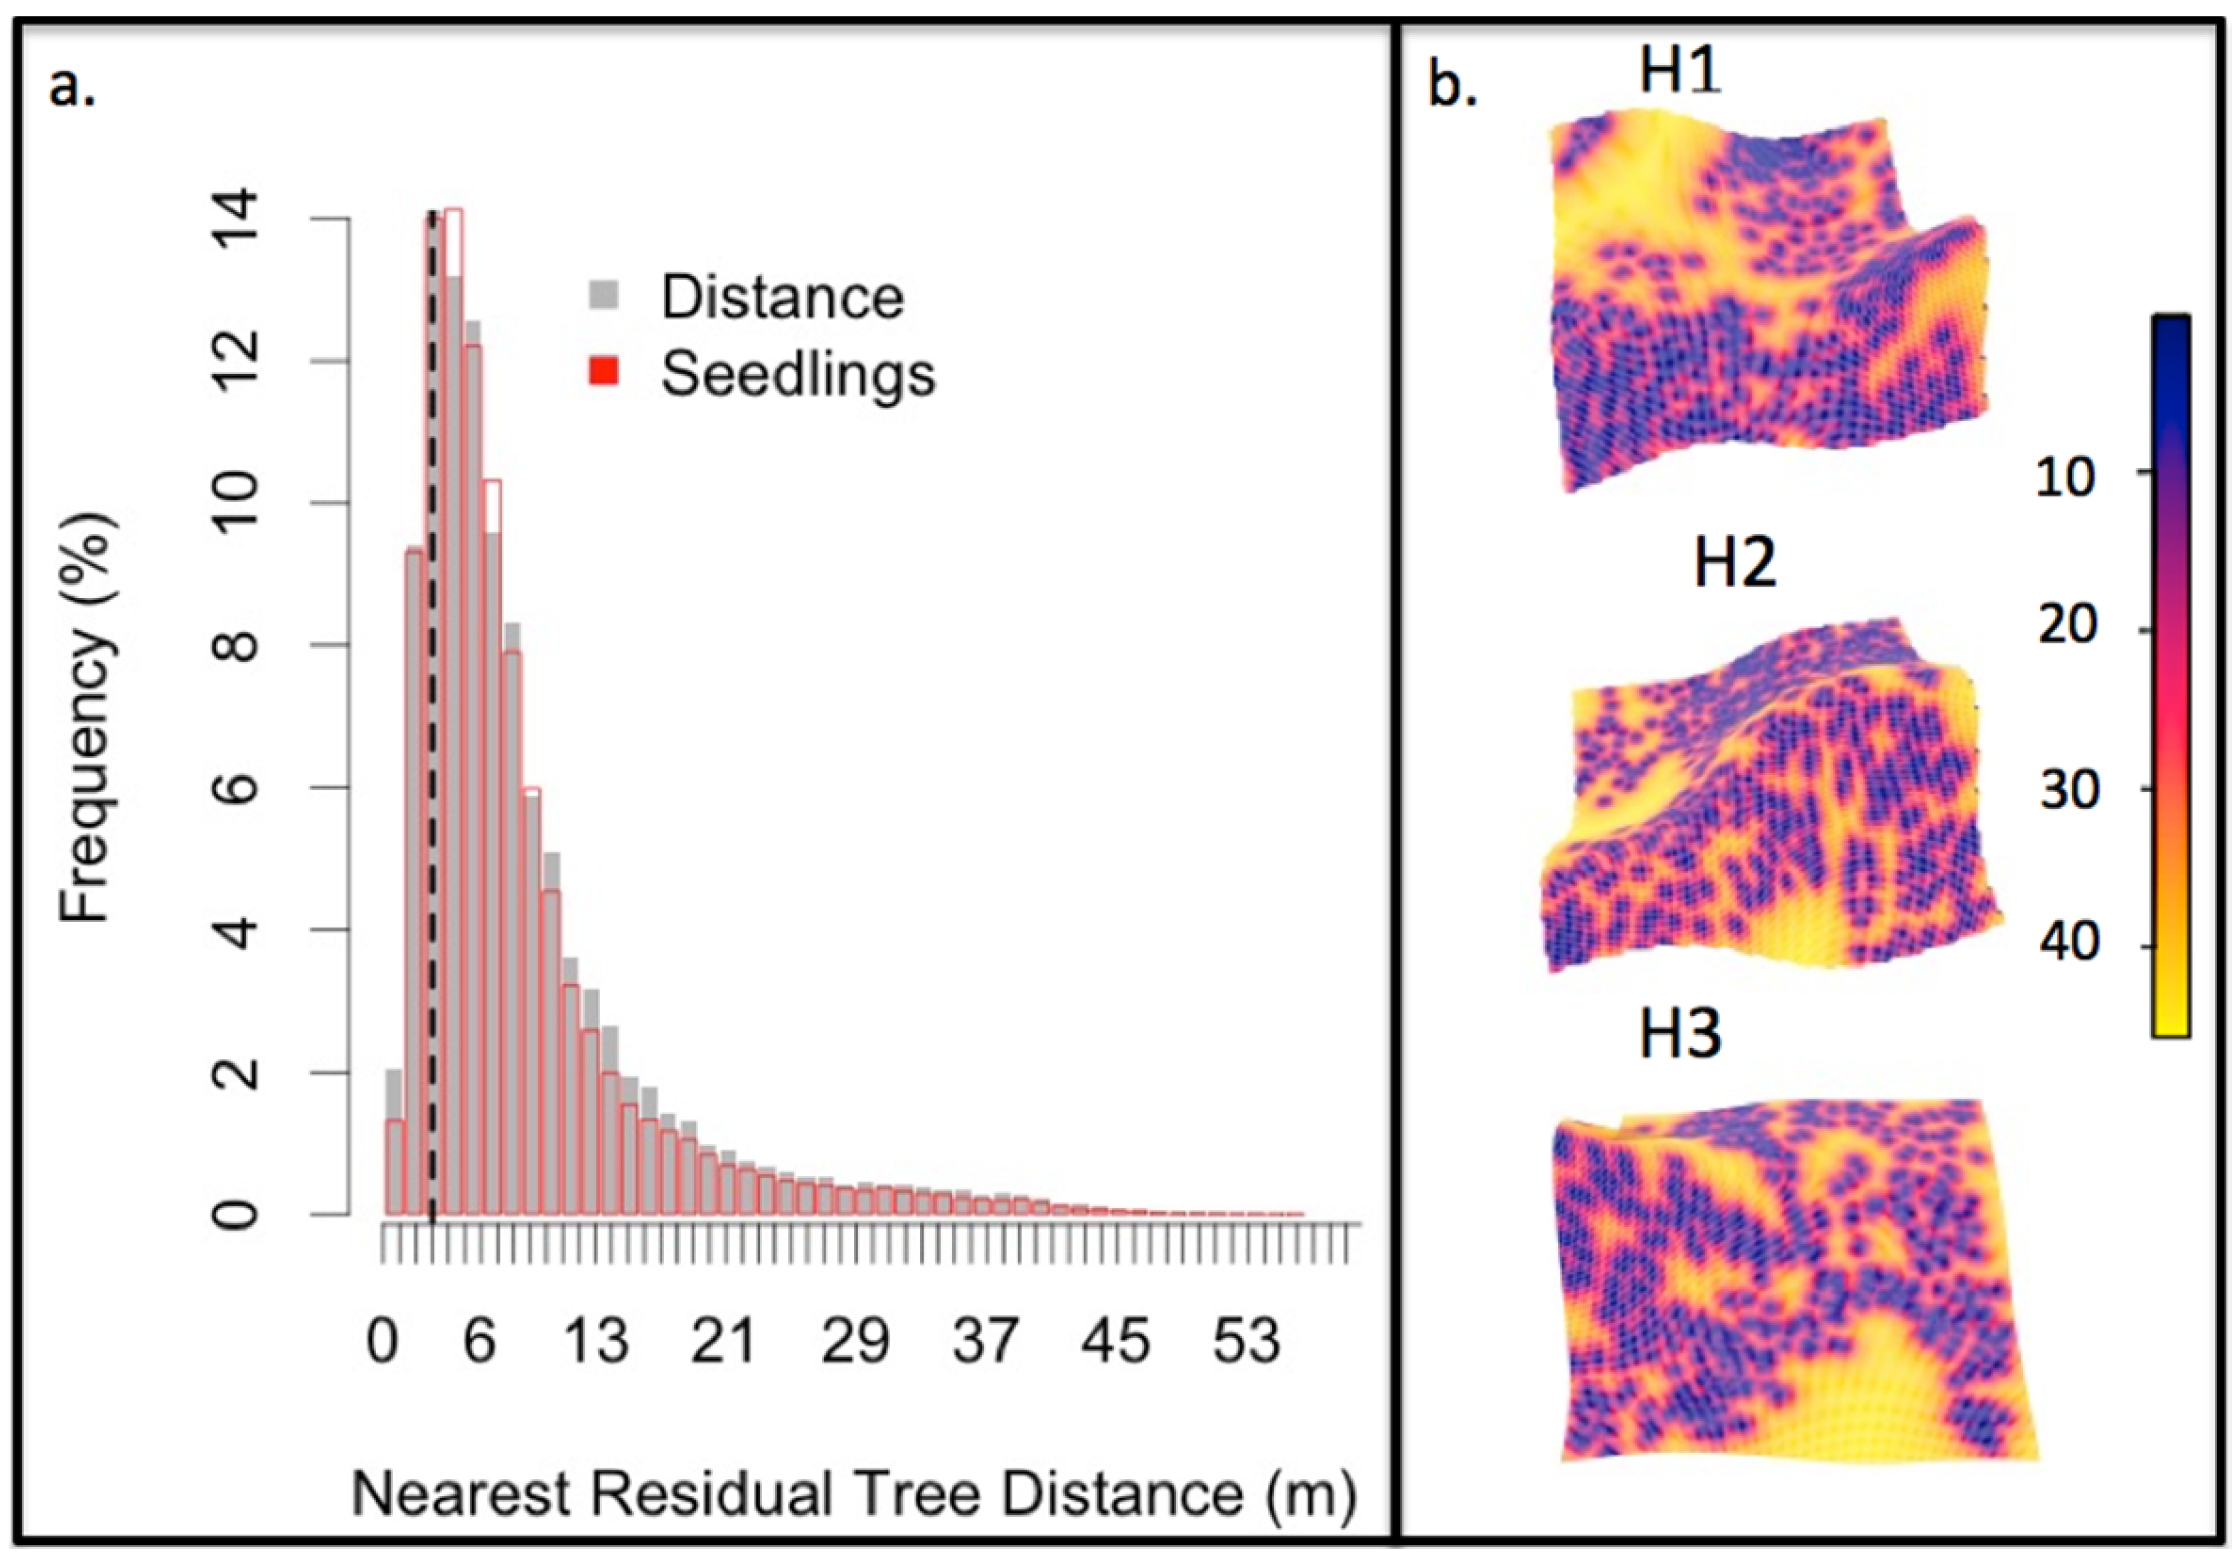
| Distance from Nearest Tree (m) | 6.2 | 5.6 | 6.6 | 6.1 | 0.3 |
| CEI | −0.3 | −0.2 | −0.3 | −0.3 | 0.01 |
| DMI | 0.6 | 0.6 | 0.6 | 0.6 | 0.01 |
| DZIDBH | 0.5 | 0.53 | 0.5 | 0.5 | 0.01 |
| DZITH | 0.3 | 0.3 | 0.3 | 0.3 | 0.01 |
| Plot | H1 | H2 | H3 | Average | Standard Error |
|---|---|---|---|---|---|
| SPH (Conifers) | 728 (613) | 1071 (1036) | 256 (241) | 685 (630) | 236 (230) |
| Stem Height (Conifers) | 0.31 (0.28) | 0.30 (0.29) | 0.41 (0.41) | 0.34 (0.33) | 0.04 (0.04) |
| % PIPO | 67 | 80 | 70 | 73 | 4 |
| % PMSE | 16 | 16 | 23 | 18 | 2 |
| % POTR | 16 | 3 | 6 | 8 | 4 |
| Plot | Intercept | Nearest Residual Tree Distance (m) | Burn Severity | TWI | Elevation | Nearest POTR Cluster (m) | |||
|---|---|---|---|---|---|---|---|---|---|
| Low | Moderate | High | |||||||
| H1 | Estimate | 262.627 | −0.036 | 0.357 | 1.029 | 0.842 | −0.007 | −0.112 | −0.007 |
| S.E. | 7.530 | 0.002 | 0.057 | 0.063 | 0.078 | −0.014 | 0.003 | −0.014 | |
| p-value | <0.001 | <0.001 | <0.001 | <0.001 | <0.001 | <0.001 | <0.001 | <0.001 | |
| H2 | Estimate | −1.113 | −0.042 | 0.657 | 1.091 | 0.939 | |||
| S.E. | 0.028 | 0.002 | 0.028 | 0.026 | 0.042 | ||||
| p-value | <0.001 | <0.001 | <0.001 | <0.001 | <0.001 | ||||
| H3 | Estimate | −49.284 | 0.266 | 0.616 | 0.301 | 0.002 | 0.018 | 0.002 | |
| S.E. | 9.175 | 0.092 | 0.087 | 0.098 | 0.001 | 0.004 | 0.001 | ||
| p-value | <0.001 | <0.001 | <0.001 | <0.001 | <0.001 | <0.001 | <0.001 | ||
© 2018 by the authors. Licensee MDPI, Basel, Switzerland. This article is an open access article distributed under the terms and conditions of the Creative Commons Attribution (CC BY) license (http://creativecommons.org/licenses/by/4.0/).
Share and Cite
Malone, S.L.; Fornwalt, P.J.; Battaglia, M.A.; Chambers, M.E.; Iniguez, J.M.; Sieg, C.H. Mixed-Severity Fire Fosters Heterogeneous Spatial Patterns of Conifer Regeneration in a Dry Conifer Forest. Forests 2018, 9, 45. https://doi.org/10.3390/f9010045
Malone SL, Fornwalt PJ, Battaglia MA, Chambers ME, Iniguez JM, Sieg CH. Mixed-Severity Fire Fosters Heterogeneous Spatial Patterns of Conifer Regeneration in a Dry Conifer Forest. Forests. 2018; 9(1):45. https://doi.org/10.3390/f9010045
Chicago/Turabian StyleMalone, Sparkle L., Paula J. Fornwalt, Mike A. Battaglia, Marin E. Chambers, Jose M. Iniguez, and Carolyn H. Sieg. 2018. "Mixed-Severity Fire Fosters Heterogeneous Spatial Patterns of Conifer Regeneration in a Dry Conifer Forest" Forests 9, no. 1: 45. https://doi.org/10.3390/f9010045