Article

Variability after 15 Years of Vegetation Recovery in Natural Secondary Forest with Timber Harvesting at Different Intensities in Southeastern China: Community Diversity and Stability

1
College of Transportation and Civil Engineering, Fujian Agriculture and Forestry University, Fuzhou 350002, China
2
Department of Ecosystem Science and Management, Texas A&M University, College Station, TX 77843, USA
*
Author to whom correspondence should be addressed.
Forests 2018, 9(1), 40; https://doi.org/10.3390/f9010040
Submission received: 21 November 2017 / Revised: 12 January 2018 / Accepted: 16 January 2018 / Published: 18 January 2018
(This article belongs to the Special Issue Disturbance, Succession, and Development of Forests)

Abstract

:
The mixed Cunninghamia lanceolata (Lamb.) Hook., Pinus massoniana Lamb., and hardwood forest in southeastern China is a major assemblage in natural secondary forests, and of national and international importance in terms of both timber and ecosystem services. However, over-harvesting has threatened its long-term sustainability, and there is a knowledge gap relating to the effect of harvesting on the ecosystem. After conifer species were selected for harvesting, the mixed Chinese fir, pine, and hardwood forest was changed into mixed evergreen broadleaf forest. In this context, we observed the restoration dynamics of plant communities over a period of 15 years (1996 to 2011) with different levels of harvesting intensity, including selective harvesting at low (13.0% removal of growing stock volume), medium (29.1%), high (45.8%), and extra-high (67.1%) intensities, as well as clear-cut harvesting (100.0%), with non-harvesting as the control, based on permanent sample plots established in a randomized block design in these forests in southeastern China. The impact on the richness, diversity, and evenness of plant species derived from descriptive statistical analyses was shown to initially increase, and then decrease, with an increase in harvesting intensity. The most critical impacts were on the richness, diversity, and evenness of shrub and herb species. Richness, diversity, and evenness of plant species recovered and increased under selective harvesting at low and medium intensities, while these parameters had not recovered and significantly decreased under selective harvesting at high and extra-high intensities, as well as with clear-cut harvesting. The impact on the plant community stability was derived from the stability test method of the improved Godron M. The plant community stability was closest to the point of stability (20/80) under selective harvesting at medium intensity, followed by selective harvesting at low intensity. The plant community stability was far from the point of stability (20/80) under selective harvesting at high and extra-high intensities, as well as with clear-cut harvesting. Of these treatments, clear-cut harvesting had the greatest effect with regard to reducing stability. Therefore, these results indicate that the selective harvesting at low and medium intensities is conducive to preserve or increase the species diversity and community stability. In order to prioritize promoting plant species diversity, clear-cut harvesting and selective harvesting at high and extra-high intensities should be avoided with regard to this type of forest in this region. This study sheds light on the practice of forest operation in the study region and subtropical forests with the same environment.

1. Introduction

Forests are increasingly recognized as a critical element of the global ecosystem, given their importance in providing multiple environmental services, such as carbon sequestration and storage, biodiversity conservation, climate change mitigation, poverty alleviation, and watershed protection [1]. Conservation of species diversity in managed forests is an important objective in sustainable forest management [2,3]. Plant diversity in forests, a measure of community structural and functional complexity, maintains the operation of an ecosystem on a complex spatial–temporal scale [4,5]. High species diversity is the basis of ecosystem stability, and this factor likely facilitates the optimization of ecosystem functions [6]. As a comprehensive feature of plant community structure and function, stability is not only closely related to community structure and function, but is also correlated with the nature and intensity of external interference [7,8,9]. Most tropical forests, even those in protected areas, are influenced by human activity [10]. To meet livelihoods, forest harvesting needs can impact forest regeneration, structure, and diversity [11], but there is scope for considerable variation with location, human activities, and histories [12]. Different types and intensities of local resource extraction can lead to varying outcomes even within one forest [13]. So, the diversity in human activities and their impacts call for different interventions.
Southeast China is located in the subtropical zone. The mixed Chinese fir (Cunninghamia lanceolata (Lamb.) Hook.), pine (Pinus massoniana Lamb.), and hardwood forest in southeastern China is a major assemblage in natural secondary forests. After conifer species were selected for harvesting, the mixed Chinese fir, pine, and hardwood forest was changed into the mixed evergreen broadleaf forest. Evergreen broadleaf forest is the common zonal vegetation found in the northern Fujian Province of China and is one of the typical types of vegetation in subtropical areas. Evergreen broadleaf forest is characterized by a rich floristic composition and biodiversity, as well as significant ecological functions. However, many primary forests have been or are currently being converted into secondary forests because of historical reasons and human interference [14]. Except for several natural conservation areas, only a few primitive, evergreen, broadleaf forests are left because of human interference, which is unsustainable at the landscape and timber stand level. Sustainable forest management is being advanced by the forestry sector with the expectation, amongst others, that it will reduce the environmental impacts caused by deforestation [15]. Conservation and utilization are both integral parts of sustainable forest management. Forest selective harvesting and clear-cut harvesting are the management practices most frequently used for silvicultural rotation and timber harvesting worldwide [16,17]. In terms of the ecological perspective of forest harvesting, selective harvesting is common and most reasonable as applied to natural secondary forests based on forest characteristics and geographic locations [18,19]. Evergreen broadleaf forest is widely recognized as providing ecological, economic, and social benefits and supporting governmental efforts related to biodiversity conservation and forest protection [20]. A major challenge of forest management is to maintain the biodiversity and integrity of the forests, while at the same time satisfying human needs through productive activities. While the selective extraction of natural resources has less severe consequences on biodiversity and ecosystem function than the complete removal of vegetation, such consequences need to be evaluated in detail [21,22,23]. Therefore, investigating the long-term impact of harvesting intensity on community species diversity and stability is significant to forest management theory and practice.
Vast expanses of tropical forests worldwide are being impacted by selective harvesting [24]. To select the appropriate level of harvesting intensity for a certain stand is a basic challenge in forest management planning. The decision depends on economic as well as biological factors [25]. Forest management employing clear-cut harvesting and artificial reforestation has been the dominant silviculture regime in natural forests in China for 50–60 years. After 1998, the implementation of natural forest protection projects saw increased attention drawn to uneven-aged forests, selective harvesting, and natural reforestation. This increased interest is partly due to expected enhancements for landscape aesthetics and biodiversity, and to expected benefits for reforestation costs, timber quality, and profits. Selective harvesting has certain characteristics: (i) only a part of the standing volume is harvested; (ii) conditions for recruitment are favoured in order to maintain or develop an uneven-aged forest structure; (iii) the decision unit is the individual tree, or small groups of trees; and (iv) the choice of trees to be harvested is based on certain specified attributes (e.g., tree size, timber quality, volume increment, or financial maturity) [25]. Long-term field experiments with selective harvesting in uneven-aged coniferous forests have shown that inappropriate forest structures and poor conditions for natural reforestation can cause low volume production, and hence, low profitability [26]. Previous research on plant diversity in forests mainly focused on biodiversity features and differences among various undisturbed forest types and communities [27]. In terms of human interference, the effect of selective harvesting intensity on species diversity and stability should be described in detail. For instance, the monitoring of changes in species diversity and stability during vegetation restoration after different harvesting intensities is one of the main research goals of sustainable forest management [28,29]. Many studies have referred to the impact of harvesting intensity on biodiversity [30,31,32].
For the purpose of timber production, the traditional clear-cut harvesting was a productive forest operation. It only considered economic benefits and seriously damaged the ecological environment. A large number of studies have shown that selective harvesting is the most suitable management of natural secondary forests [19,25,33]. But, for specific natural secondary forest, in order to protect species diversity and maintain community stability, the suitable selective harvesting intensity is not yet clear. To date, only a few studies have reported on the effect of selective harvesting intensity on plant species diversity and community stability of natural, secondary forests in subtropical areas. Most of the studies used space instead of time (temporary plots) to analyze the short-term effects of harvesting on species diversity, but few established long-term, fixed plots for the study [19,33]. In order to manage the forest scientifically, our study examined the long-term effects of harvesting intensity on the species diversity and community stability of natural secondary forests in subtropical areas 15 years after harvesting. We addressed the following two questions. Was the plant species diversity different in natural secondary forests with different harvesting intensities? Was plant community stability different in natural secondary forests with different harvesting intensities?

2. Methods

2.1. Study Area

The selected study area was in the Dayuan Forest Farm, Jianou County, Fujian Province, southeastern China (117°58′45″–118°57′11″ E, 26°38′54″–27°20′26″ N). The study area was located between two mountains, with the Wuyi Mountains to the northwest and the Jiufeng Mountains to the southeast. The experimental site is characterized as low mountain hilly terrain. The elevation of the site ranges from 600 to 800 m, with a slope of 25–34°. This area has a subtropical maritime monsoon climate. The mean annual temperature is 15–17 °C, and annual precipitation is 1890 mm. According to the United States Department of Agriculture (USDA) soil taxonomy, the soil at the study site is oxisol [33].
Main tree species in the natural secondary forest are Castanopsis eyrei (Champ.) Tutch., Castanopsis carlesii (Hemsl.) Hayata, Daphniphyllum oldhamii (Hemsl.) Rosenth, Schima superba Gardner and Champ., Pinus massoniana Lamb. and Adinandra millettii Hook. Main shrub species on the site include Adinandra millettii Hook. and Arn., Lithocarpus glaber (Thumb.) Nakai, Engelhardtia fenzelii Merr., Symplocos congesta Benth., Eurya nitida Korth., and Rhaphiolepis indica (L.) Lindl. Ex Ker Gawl. Underground herbaceous and liana species are dominated by Dicranopteris dichotoma (Thunb.) Bernh., Smilax china L., Woodwardia japonica (L.f.) Sm., Hicriopteris chinensis (Rosenst.) Ching, and Gahnia tristis Nees. More details about the characteristics of this forest can be found in a previous study [33].

2.2. Sampling Design and Survey

The experiment plots (20 m × 20 m) were established using a randomized block design. Blocking factors included topography, soil, and initial forest stand conditions. There were five treatments, including four selective harvesting intensities, clear-cut harvesting, and non-harvesting as the control. Three replicates plots were set up for each treatment. The four selective harvesting intensities were low intensity (13.0% removal of growing stock volume), medium intensity (29.1%), high intensity (45.8%), and extra-high intensity (67.1%). The plots were established in March, 1996. The characteristics of the forest stands in the treatment plots before and immediately after the harvesting were shown in our previous study [33].
Selective harvesting was executed in accordance with the technical requirements established by the single-tree selection method [34]. Defective and inferior trees were cut out first, followed by over-mature and some mature trees, to create healthy and vigorous forest stands that had a similar species composition to the original forest and the target density under each harvesting intensity. The low intensity mainly harvested Pinus massoniana Lamb. and Schima superba Gardn. et Champ. The medium intensity mainly harvested Pinus massoniana Lamb. The high and extra-high intensity mainly harvested Pinus massoniana Lamb. and Castanopis carlesii (Hemsl.) Hay. After conifer species were selected for harvesting, the mixed Chinese fir, pine, and hardwood forest was changed into mixed evergreen broadleaf forest. The harvesting operations were as follows: harvesting used a chainsaw, branching and bucking also used a chainsaw on site, and skidding used manual power. Branches of >5 cm in diameter were collected and utilized. This harvesting method is common in this region. The plots were investigated again in August 2011 (15 years after harvesting).
As shown in Figure 1, the adjacent gridding method was used to measure the trees. Each plot was divided into sixteen 5 m × 5 m quadrats by nylon rope. Trees with a diameter at breast height (DBH) >5 cm within the plots were identified individually, with their species name, DBH, height, and crown breadth recorded. Eight quadrates of 5 m × 5 m (200 m2) were selected along the diagonal of the plot to measure shrubs, with their species name, number, and height recorded. One quadrate of 1 m × 1 m in every shrub quadrate (8 m2) was selected to measure herbs, with their species name, number, and coverage recorded.

2.3. Data Analysis

In a 20 m × 20 m plot for each harvesting treatment, all survey samples of the tree, shrub, and herb layer were merged together, respectively. To determine the plant species diversity of different harvesting intensities, plant diversity was evaluated by computing three classical indices: the Margalef species richness index [35], the Shannon–Wiener diversity index [36], and the Pielou evenness index [37,38], as follows:
Margalef richness index : R = ( S 1 ) / ln N
Shannon-Wiener diversity index : H = i = 1 s P i ln P i
Pielou evenness index : J = H / ln S
where N is the total number of individuals in a plot; Pi is the relative frequency of ith species within a plot (Pi = Ni/N, Ni is the number of individuals of ith species in a plot); and S is the total number of species in a plot. According to various layers (tree, shrub, and herb), their diversity indices were calculated separately. R1, H1, and J1 are the richness, diversity, and evenness of the tree layer, respectively. R2, H2, and J2 are the richness, diversity, and evenness of the shrub layer, respectively. R3, H3, and J3 are the richness, diversity, and evenness of the herb layer, respectively.
One-way ANOVA and Scheffe multiple tests were performed to compare the impacts on species diversity indices of various layers and overall plants. Scheffe is one of multiple comparisons based on t statistics. It can make a comparison between any two treatments. Means for groups in homogeneous subsets are displayed. These methods have been confirmed to be effective in previous studies [39,40].
Community diversity indices:
R 4 = α R 1 + β R 2 + γ R 3
H 4 = α H 1 + β H 2 + γ H 3
J 4 = α J 1 + β J 2 + γ J 3
where R4, H4, and J4 are the richness, diversity, and evenness of overall plants (community), respectively; α, β, and γ are the given weighting coefficients of tree, shrub, and herb, which are determined to be 0.50, 0.25, and 0.25, respectively [41,42].
With the date derived from field measurements and the mean value of three species diversity indices, we calculated the percentage change in species diversity indices under different harvesting intensities relative to non-harvesting. That is, we computed the ρ value [33,43] as follows:
ρ = X i j X i 0 X i 0 × 100 %
where Xij is the mean value of the species diversity index i at the sites with harvesting intensity j and Xi0 is the mean value of the species diversity index i in the non-harvesting plots. The percentage change (ρ) reflects the change in species diversity indices at a specific harvesting intensity when compared to non-harvesting 15 years after the harvesting.
The stability test method of Godron M. was discovered by the French ecologists from industrial production and introduced into plant ecology [44]. After this method was introduced into China, it was improved by Zheng (2000) and has been confirmed to be reliable in previous studies of community stability [45]. This method considers the relative frequency of a community in a variety of plants and the stability of the relationship between the plants species as a decision basis [45]. The species number and individuals reflected to a certain extent the characteristics of a community, and reflected the stage of development and the degree of community stability. The frequency of different species is conversed into relative frequency, is accumulated according to the cumulative from big to small order together, and then, a smooth curve and fuzzy model is set. At last, the coordinate of the crossing point is determined by the curve and linear aspect (y = 100 − x). According to the stability test method of improved Godron M., the stability point of a community is 20/80 [44,45]. That is to say when the accumulative inverse of the species number reached 20% and the accumulative relative frequency of these species reached exactly 80%, the plant community was considered a stable community. The gap between the point of the intersection and the point of stability was measured by the Euclidean distance (d), so as to judge the degree of proximity of the actual community and the stable community. The farther the Euclidean distance, the less stable the community.
On the basis of the stability test method of improved Godron M., we implemented curve fitting by using the quadratic equation, compound curve, geometric progression curve, logarithmic equation, exponential equation, and power function. Finally, the quadratic equation and the logarithmic equation with the maximum relevant coefficient (R2) were selected as the optimal fitting model. In this study, we filtered the following smooth curve models.
The selected curve model:
y = a x 2 + b x + c
y = d ln ( x ) + e
where x is the accumulative inverse of species number (%); y is the accumulative relative frequency of these species (%); and a, b, c, d, and e are the undetermined coefficients.

3. Results

3.1. General Situation of Stand in Studied Area

Harvesting intensity had a significant impact on the stand characteristics of natural secondary forest 15 years after harvesting (Table 1).
Compared with non-harvesting (Table 2), the stand density of selective harvesting at different intensities increased significantly, but that of clear-cut harvesting decreased significantly. After different harvesting intensities, the mean DBH and height values were significantly lower than non-harvesting. The volume of growing stock exhibited no significant differences among non-harvesting and selective harvesting at low, medium, and high intensities, but it was significantly lower than non-harvesting after selective harvesting at extra-high intensity and clear-cut harvesting.

3.2. Impacts on Species Diversity Indices of Various Layers

According to the ANOVA results (Table 3), 15 years after harvesting, the harvesting intensity had a significant impact on the species richness and evenness of tree, shrub, and herb layers (p < 0.05). Harvesting intensity had a significant impact on the species diversity of shrub and herb layers (p < 0.05), but it had no significant impact on the species diversity of the tree layer (p > 0.05).
According to the results of multiple comparisons (Table 4), under different intensities of selective harvesting and clear-cut harvesting, the diversity of the tree layer was not significantly different with non-harvesting; the richness of the shrub layer was significantly different with non-harvesting; and the richness, diversity, and evenness of the herb layer were significantly different with non-harvesting.
Compared with non-harvesting (Table 4 and Table 5), under the low harvesting intensities, a few diversity indices of various layers significantly increased; under the medium harvesting intensities, most of the diversity indices of various layers significantly increased; under the high and extra-high harvesting intensities, most of the diversity indices of various layers significantly decreased; and under clear-cut harvesting, almost all of the diversity indices of various layers significantly decreased.

3.3. Impacts on Community Diversity Indices of Overall Plants

Harvesting intensity had a significant impact on the species richness, diversity, and evenness of overall plants 15 years after different harvesting intensities (Table 6).
According to the results of multiple comparisons (Figure 2), the species richness, diversity, and evenness of overall plants were not significantly different after selective harvesting at low intensity. These parameters significantly increased after selective harvesting at medium intensity. The species richness and evenness of overall plants significantly decreased after selective harvesting at high and extra-high intensities. The species richness, diversity, and evenness of overall plants significantly decreased after clear-cut harvesting.
According to the percentage changes in species diversity indices of overall plants due to different harvesting intensities compare to non-harvesting (Table 7), the species richness, diversity, and evenness of overall plants significantly increased by 23.1%, 21.0%, and 5.1% after selective harvesting at medium intensity, respectively, and these parameters were the highest. However, after selective harvesting at high and extra-high intensities, the species richness of overall plants significantly decreased by 19.9% and 22.2%, respectively; and the species evenness of overall plants significantly decreased by 8.6% and 14.8%, respectively. The species richness, diversity, and evenness of overall plants significantly decreased by 47.0%, 31.2%, and 25.9% after clear-cut harvesting, respectively, and these parameters were the lowest.

3.4. Community Stability Analysis

Taking non-harvesting as an example, the coordinate of the intersection between the smooth curve and the straight line y = 100 − x was 29.9/70.1. The coordinate of the stable point was 20/80. The Euclidean distance (d) between these two crossing points was 13.985 (Figure 3). In order to analyze the stability of the community with different treatments, the crossing point and the Euclidean distance were calculated by the same method for the other harvesting intensities (Figure 3).
According to the Euclidean distances (d) between the intersection and the stable point (20/80) (Table 8), there was a certain gap between the intersection and the stable point 20/80. The intersection at low intensity of selective harvesting was closest to the stable point, but intersections at high and extra-high intensities of selective harvesting and clear-cut harvesting were far from the stable point; especially, clear-cut harvesting was farthest from the stable point. The community stability comparisons of different harvesting intensities were as follows: medium intensity of selective harvesting > low intensity of selective harvesting > non-harvesting > high intensity of selective harvesting > extra-high intensity of selective harvesting > clear-cut harvesting. So, the medium intensity of selective harvesting was the most beneficial to promoting the development of the natural, secondary forest community in the direction of stability. Second, the low intensity of selective harvesting was to a certain degree also favorable.

4. Discussion

Numerous studies have shown that disturbances such as harvesting and other human activities in some cases cause an immediate decline in plant diversity followed by a recovery [46,47]. But, some studies have shown an increase in species richness after harvesting or other disturbance. Sassen (2013) et al. found that human impacts, as well as natural gradients, had major impacts on species richness patterns, and several areas in intermediate states of disturbance showed higher tree species richness than either old-growth forest or more severely degraded areas [12]. The results of some perious studies were different because these influences had a close relationship with location, histories, harvesting intensity, and recovery time, and so on [48,
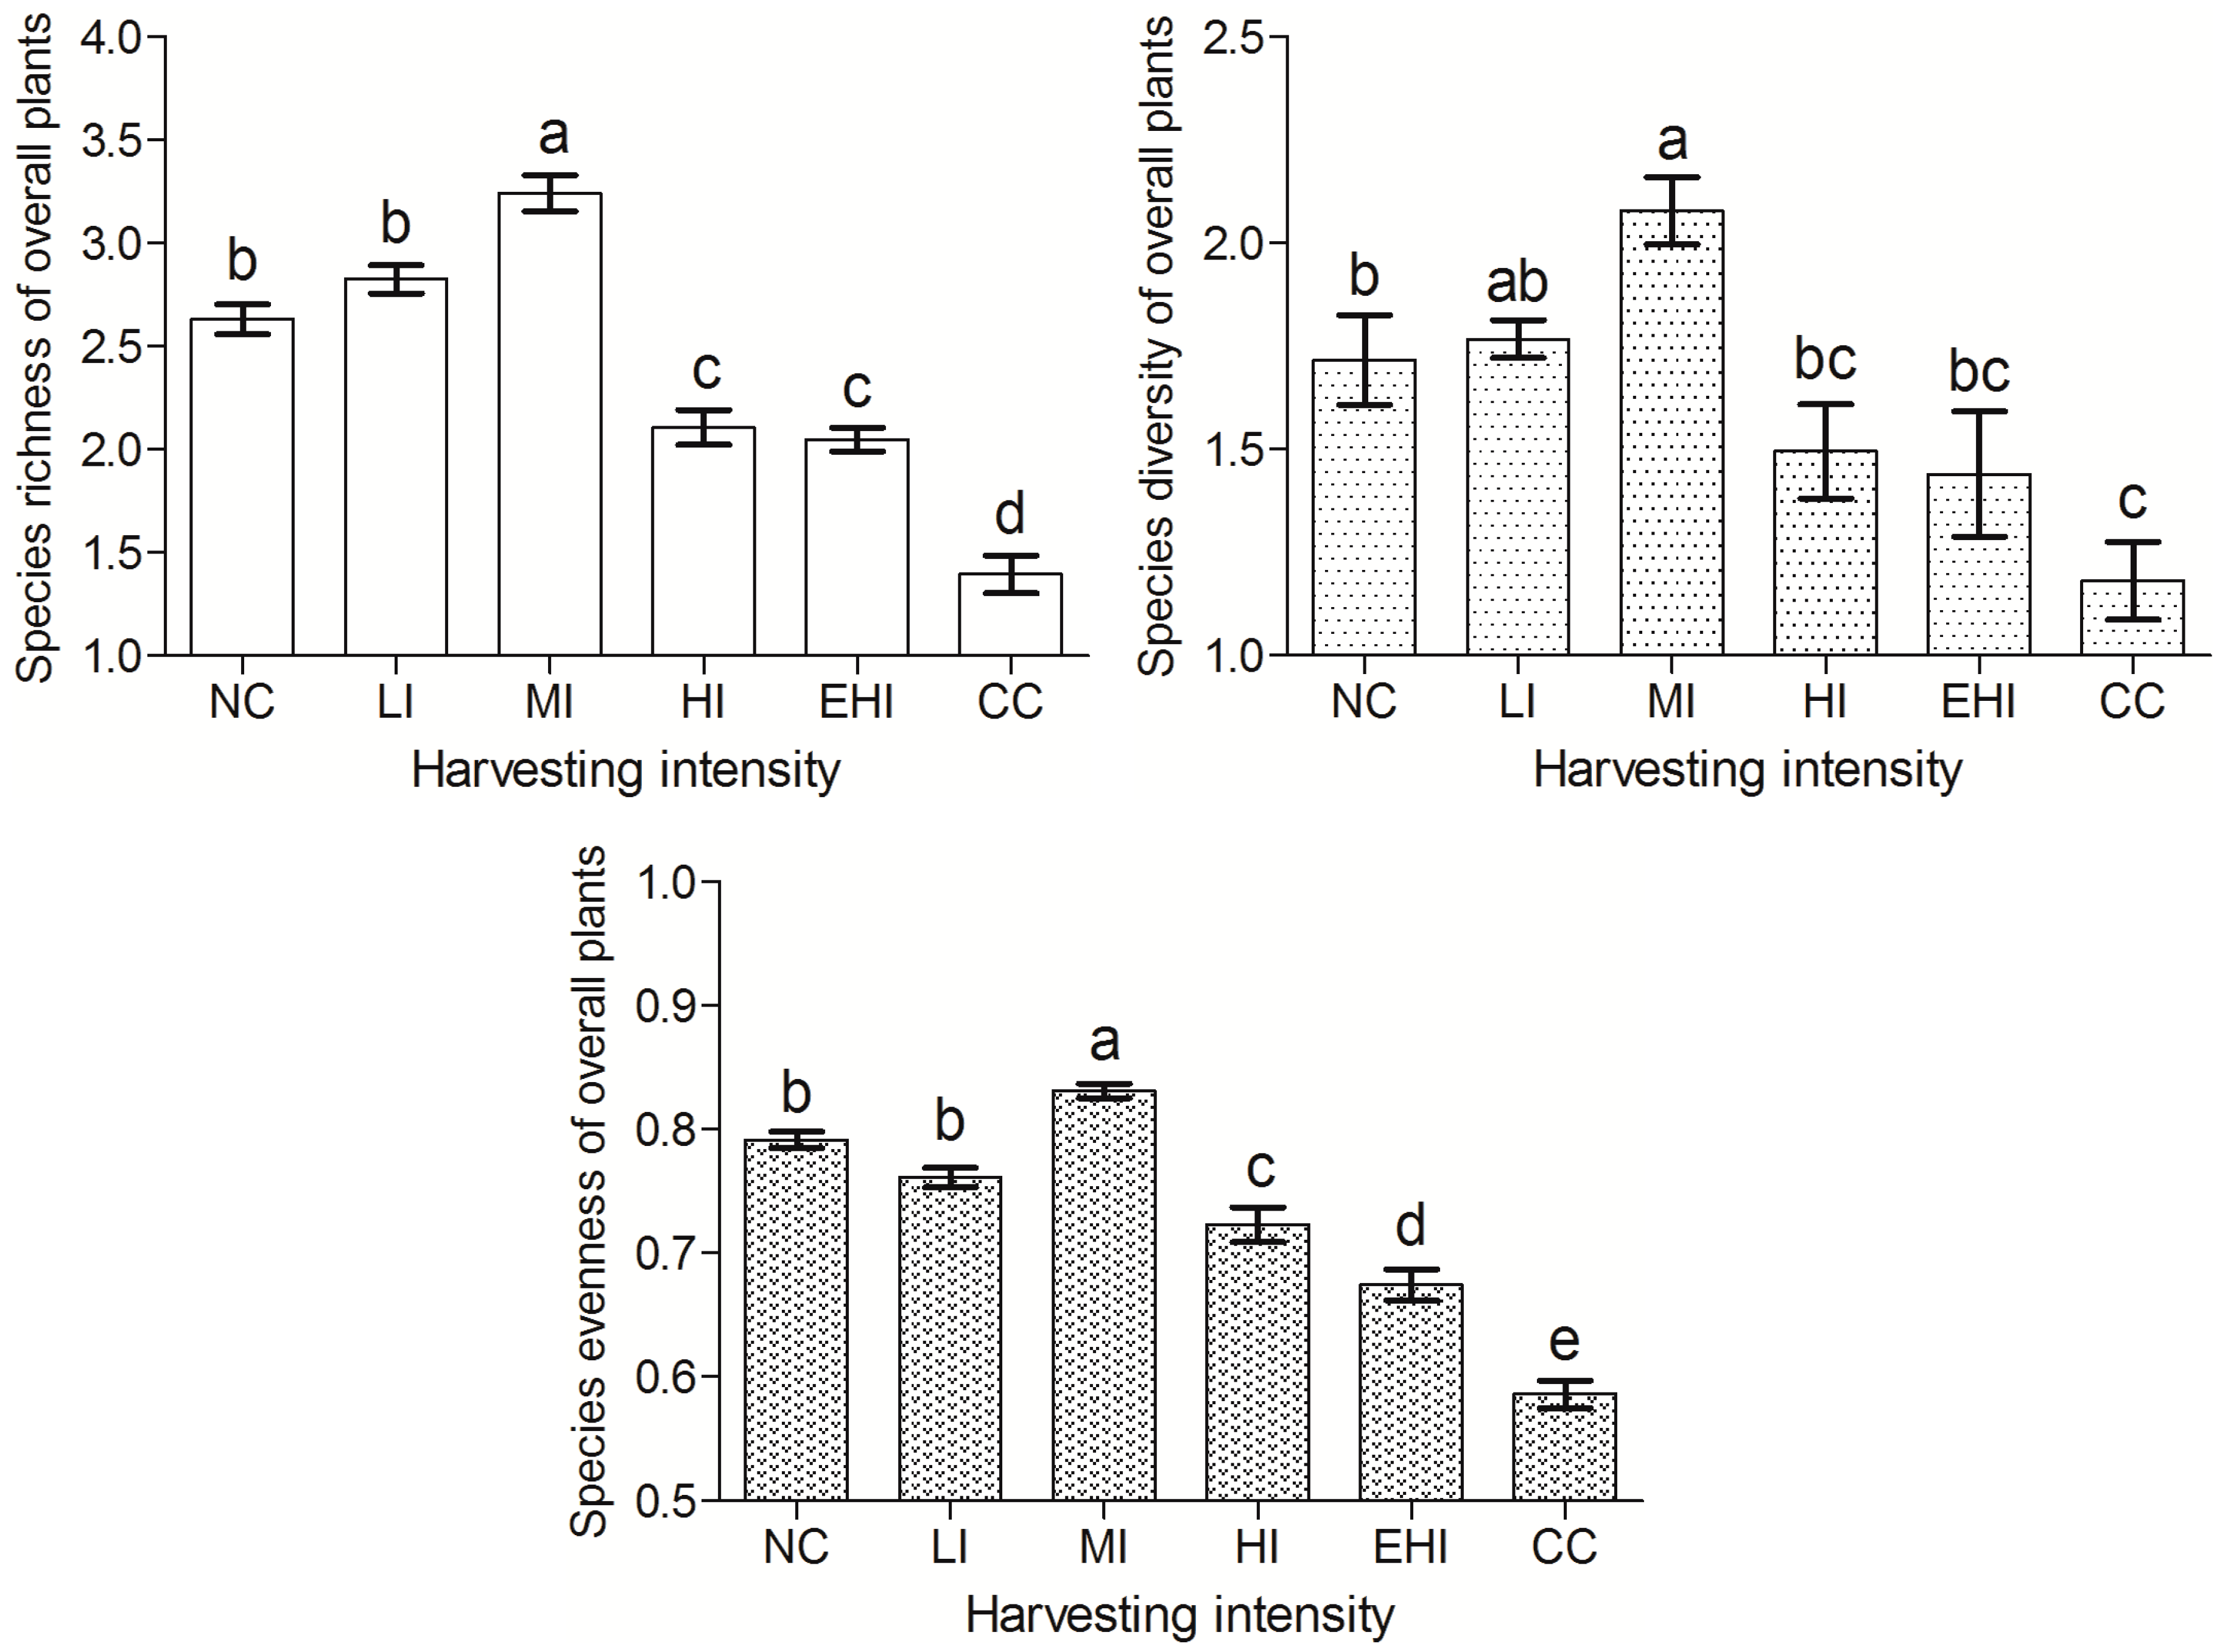
49]. In our study, we found the plant species richness, diversity, and evenness in natural secondary forest increased after selective harvesting at low and medium intensities, and these parameters were the highest with selective harvesting at a medium intensity. This conclusion was similar to some related studies, and the course of succession in subtropical forests seems to support the intermediate disturbance hypothesis [21,50,51]. After selective harvesting at low and medium intensities, a certain amount of forest space was released, sunlight in the forest was enhanced, and the soil environment was improved [34]. Changes of these factors were conducive to creating good conditions for plant growth, promoting natural reforestation, and increasing species richness, diversity, and evenness [52,53].
Non-harvesting might require a long time to facilitate biological features of vegetation communities and restored species diversity [29]. Some studies have shown that the percent of species lost was significantly higher in reference (non-harvesting) than harvested plots [35]. In our study, species diversity indices of selective harvesting at a medium intensity were significantly greater than non-harvesting, but these parameters were not significantly different between non-harvesting and selective harvesting of low intensity. This was because the forest was inhibited by a high canopy density (>0.9) due to non-harvesting, which resulted in reduced sunlight exposure and thus, a limited growth of understory shrubs and herbs. Although a natural forests protection project was proposed by the Chinese government after 1998, the natural forests require scientific management.
Some studies assessing the effects of different types of disturbances, such as firewood harvesting [46,54], slash-and-burn [55], or cattle grazing [56,57], have found that species diversity was reduced as the intensity and frequency of disturbance increased [46,58]. In our study, plant species richness, diversity, and evenness significantly decreased with selective harvesting at high and extra-high intensities, as well as with clear-cut harvesting. This might be due to overly large canopy gaps under over-harvesting [33], resulting in major changes to the ecological environment, such as the stand structure, soil moisture, porosity, and nutrients [19,50,51]. For instance, the worst-case scenario was from clear-cut harvesting, which resulted in the disappearance of the tree layer and a significant change in stand structure. Moreover, the Dicranopteris pedata (Houtt.) Nakaike coverage rate was very high (>90%), so plant species of shrub and herb layers were few. The reduction in species diversity, changes in patterns of dominance, and the proliferation of species associated with disturbed sites suggested that current practices of selective harvesting at an exorbitant intensity require adjustments to make this forest management application more consistent with the local conservation of woody plant species diversity and community structure [23].
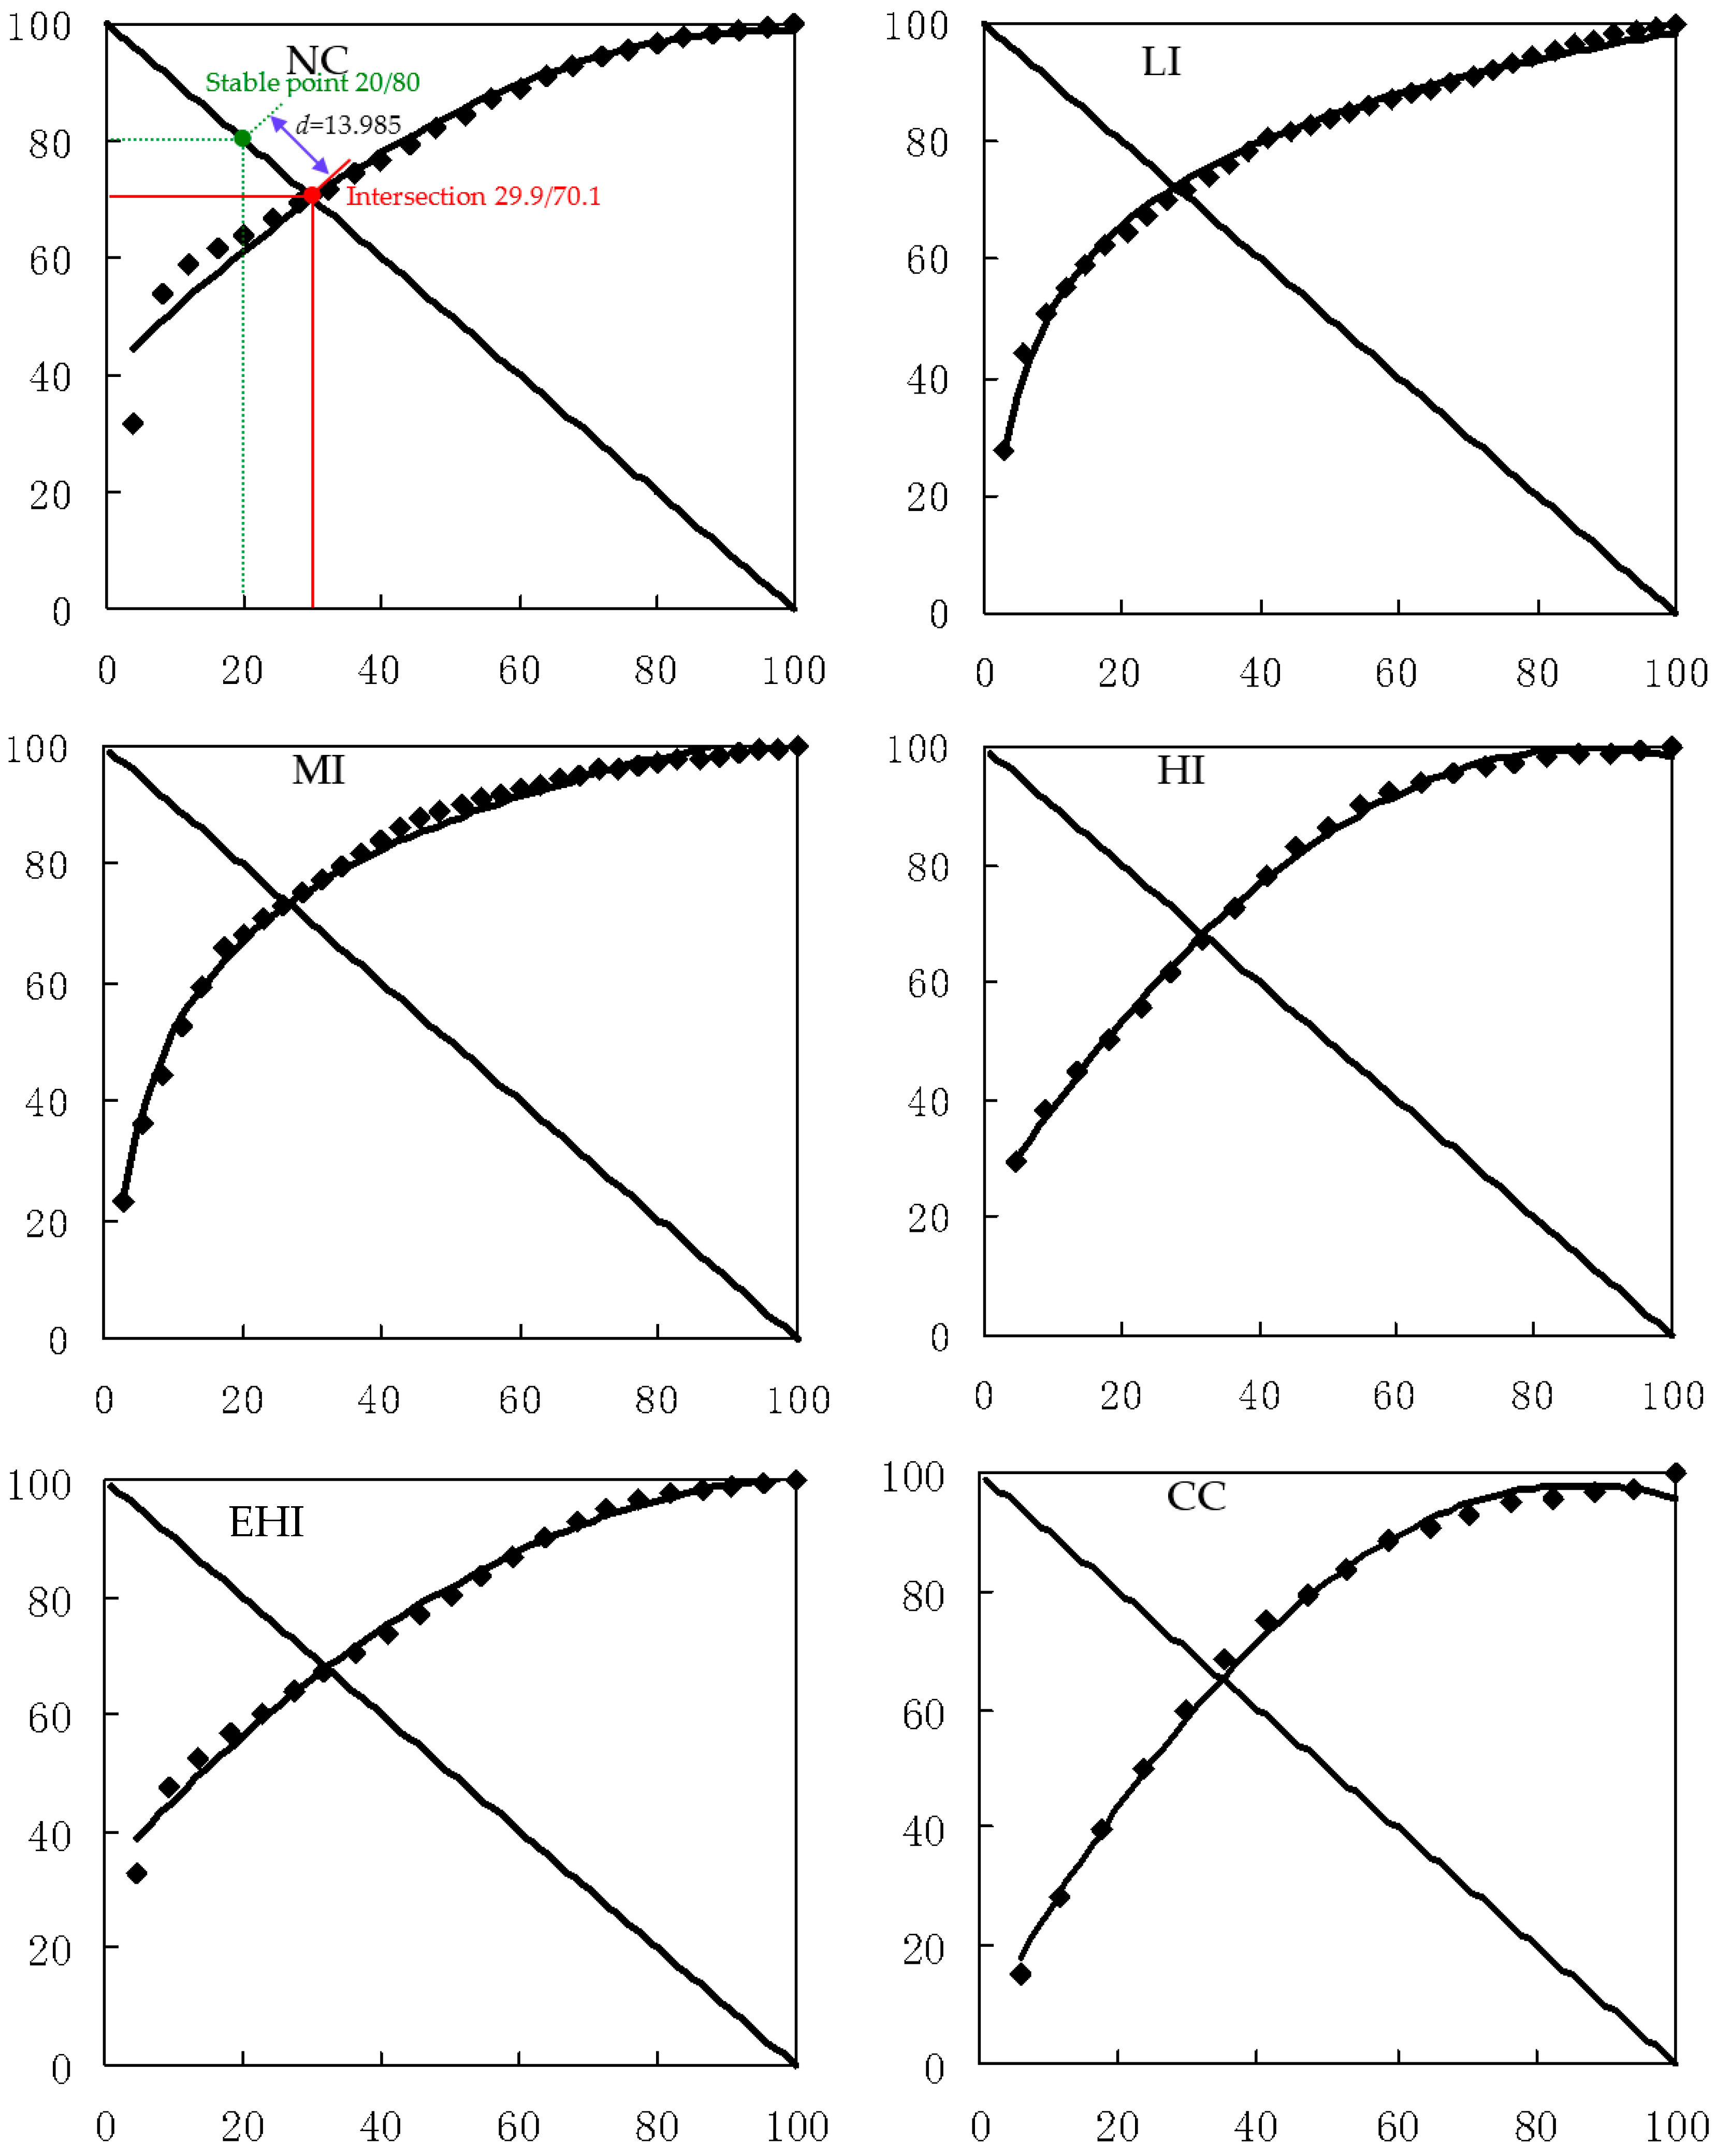
The relationship between community stability and species diversity has always been a complex theoretical issue of ecology. Most scholars have hypothesized that the higher species diversity resulted in higher forest community stability [59,60]. We obtained the same results in our study area. In our study, we found that the plant community was closer to stability after selective harvesting at low and medium intensities. But it was far from stable after clear-cut harvesting and selective harvesting at high and extra-high intensities. We tested the forest community stability based on the stability test method of improved Godron M., which made full use of the overall characteristics of the plant community and was a more comprehensive method including tree, shrub, and herb species. However, the forest community stability test could only determine whether the community was stable, but could not reveal community succession direction and trend [44,45]. Natural restoration of natural secondary forest after harvesting still exhibited dynamic change. The long-term tracking of permanent sample plots was very necessary to understand the long-term response mechanism of species diversity and stability to harvesting intensity. This measure was also needed to determine the relationship between species diversity and stability, as well as their mutual influencing mechanisms. Our study focuses on the impact of harvesting intensity on species diversity and community stability. Future studies should be conducted to obtain additional time series data. Coordinated multiple-regional studies can help explore the impact of other forcing such as environmental conditions together with timber harvesting intensity.

5. Conclusions

Results of this study showed that the plant species diversity indices of tree, shrub, and herb layers in this forest slightly increased with selective harvesting at low intensity. These parameters significantly increased with selective harvesting at medium intensity, but significantly decreased with selective harvesting at high and extra-high intensities, as well as with clear-cut harvesting. With increasing harvesting intensity, the richness, diversity, and evenness of the overall plants first increased, and then decreased, and these parameters achieved maxima with selective harvesting at medium intensity, but clear-cut harvesting reduced these parameters to their minima. The results of this study also showed that the plant community of this forest was closest to a stable community with selective harvesting at medium intensity. It was far from the stability with selective harvesting at high and extra-high intensities with clear-cut harvesting, and it was farthest from the stability with clear-cut harvesting.
With all the above impacts in mind, if diversity and community stability are prioritized, selective harvesting at low and medium intensities should be chosen in natural secondary forest management. Selective harvesting at medium intensity is the most favorable. However, clear-cut harvesting and selective harvesting at high and extra-high intensities should be avoided in this type of forest in this region.

Acknowledgments

This study was supported in part by grants from the National Natural Science Foundation of China (30972359 and 31070567) and the University Development Foundation of Fujian Agriculture and Forestry University (113-612014018). We also would like to thank the two anonymous reviewers for their valuable comments and suggestions which helped improve this paper.

Author Contributions

Zhilong Wu contributed to the field experiment, data collection, and analysis, and wrote the initial version of the manuscript. Chengjun Zhou contributed to the field experiment, data collection, and analysis. Xinnian Zhou was the project director and designed the study. Xisheng Hu participated in data collection and analysis. Jianbang Gan contributed to data analysis.

Conflicts of Interest

The authors declare no conflict of interest.

References

  1. Brashears, M.B.; Fajvan, M.A.; Schuler, T.M. An assessment of canopy stratification and tree species diversity following clear cutting in central Appalachian hardwoods. For. Sci. 2004, 50, 54–64. [Google Scholar]
  2. Li, Y.M.; Li, X.; Hua, J. Ecological system stability and diversity based on complex networks. Chin. J. Ecol. 2014, 33, 1700–1706. [Google Scholar]
  3. Agrawal, A.; Chhatre, A.; Hardin, R. Changing governance of the world’s forests. Science 2008, 320, 1460–1462. [Google Scholar] [CrossRef] [PubMed]
  4. Frelich, L.E.; Cornett, M.W.; White, M.A. Controls and reference conditions in forestry: The role of old-growth and retrospective studies. J. For. 2005, 103, 339–344. [Google Scholar]
  5. Mitchell, R.J.; Hunter, M.L.; Palik, B.J. Natural disturbance as a guide to silviculture. For. Ecol. Manag. 2002, 155, 315–317. [Google Scholar] [CrossRef]
  6. Chen, L.; Wang, X.G. Biodiversity and forest ecosystem health: some key problems. Chin. J. Ecol. 2008, 27, 816–820. [Google Scholar]
  7. Ito, S.; Ishigami, S.; Mizoue, N.; Buckley, G.P. Maintaining plant species composition and diversity of understory vegetation under strip-clearcutting forestry in conifer plantations in Kyushu, southern Japan. For. Ecol. Manag. 2006, 231, 234–241. [Google Scholar] [CrossRef]
  8. Tilman, D.; Downing, J.A.; Wedln, D.A. Does diversity beget stability? Natural 1994, 371, 113–114. [Google Scholar] [CrossRef]
  9. Ives, A.R.; Carpenter, S.R. Stability and diversity of ecosystems. Science 2007, 317, 58–62. [Google Scholar] [CrossRef] [PubMed]
  10. MacKenzie, C.A.; Chapman, C.A.; Sengupta, R. Spatial patterns of illegal resource extraction in Kibale National Park, Uganda. Environ. Conserv. 2012, 39, 38–50. [Google Scholar] [CrossRef]
  11. Olupot, W. A variable edge effect on trees of Bwindi Impenetrable National Park, Uganda, and its bearing on measurement parameters. Biol. Conserv. 2009, 142, 789–797. [Google Scholar] [CrossRef]
  12. Sassen, M.; Sheil, D. Human impacts on forest structure and species richness on the edges of a protected mountain forest in Uganda. For. Ecol. Manag. 2013, 307, 206–218. [Google Scholar] [CrossRef]
  13. Thapa, S.; Chapman, D.S. Impacts of resource extraction on forest structure and diversity in Bardia National Park, Nepal. For. Ecol. Manag. 2010, 259, 641–649. [Google Scholar] [CrossRef]
  14. Tang, X.H.; Huang, Q.F.; Wu, W.Y. Community structure and species diversity of the evergreen-deciduous broadleaf forest in Yeshan. J. Anhui Agric. Univ. 2014, 41, 116–121. [Google Scholar]
  15. Chen, J.; Innes, J.L. The implications of new forest tenure reforms and forestry property markets for sustainable forest management and forest certification in China. J. Environ. Manag. 2013, 129, 206–215. [Google Scholar] [CrossRef] [PubMed]
  16. Zerva, A.; Mencuccini, M. Short-term effects of clearfelling on soil CO2, CH4 and N2O fluxes in a Sitka spruce plantation. Soil Biol. Biochem. 2005, 37, 2025–2036. [Google Scholar] [CrossRef]
  17. Dannenmann, M.; Gasche, R.; Ledebuhr, A.; Holst, T.; Mayer, H.; Papen, H. The effect of forest management on trace gas exchange at the pedosphere-atmosphere interface in beech (Fagus sylvatica L.) forests stocking on calcareous soils. Eur. J. For. Res. 2007, 126, 331–346. [Google Scholar] [CrossRef]
  18. Liu, Y.C. Study of applications of selective cutting management techniques in natural forests. For. Eng. 2006, 22, 7–9. [Google Scholar]
  19. Zhou, X.N.; Wu, Z.L.; Zheng, L.F.; Deng, S.M.; Lin, H.M.; Xu, S.H. Research progress on forest selective cutting. J. Mt. Sci. 2008, 25, 629–636. [Google Scholar]
  20. White, A.; Martin, A. Who Owns the World’s Forests? Forest Tenure and Public Forests in Transition; Forest Trends & Center for International Law: Washington, DC, USA, 2002. [Google Scholar]
  21. Burke, D.A.; Elliott, K.A.; Holmes, S.B.; Bradley, D. The effects of partial harvest on the understory vegetation of southern Ontario woodlands. For. Ecol. Manag. 2008, 255, 2204–2212. [Google Scholar] [CrossRef]
  22. Foley, J.A.; DeFries, R.; Asner, G.P.; Barford, C.; Bonan, G.; Carpenter, S.R.; Chapin, F.S.; Coe, M.T.; Daily, G.C.; Gibbs, H.K.; et al. Global consequences of land use. Science 2005, 309, 570–574. [Google Scholar] [CrossRef] [PubMed]
  23. Rendón-Carmona, H.; Martínez-Yrízar, A.; Balvanera, P.; Pérez-Salicrup, D. Selective cutting of woody species in a Mexican tropical dry forest: Incompatibility between use and conservation. For. Ecol. Manag. 2009, 257, 567–579. [Google Scholar] [CrossRef]
  24. Edwards, D.P.; Tobias, J.A.; Sheil, D.; Meijaard, E.; Laurance, W.F. Maintaining ecosystem function and services in logged tropical forests. Trends Ecol. Evol. 2014, 29, 511–520. [Google Scholar] [CrossRef] [PubMed]
  25. Lexerød, N.L.; Eid, T. Assessing suitability for selective cutting using a stand level index. For. Ecol. Manag. 2006, 237, 503–512. [Google Scholar] [CrossRef]
  26. Andreassen, K.; Øyen, B.-H. Economic consequences of three silvicultural methods in uneven-aged mature coastal spruce forests of central Norway. Forestry 2002, 75, 483–488. [Google Scholar] [CrossRef]
  27. Zhao, Z.H.; Bai, D.Z.; Hui, G.Y.; Yuan, S.Y. Species diversity of Quercus aliena var. acuteserrata natural forest with different management measures at Xiaolongshan. For. Res. 2013, 26, 326–331. [Google Scholar]
  28. Lei, X.D.; Tang, S.Z. Progress in quantitative studies on the forest management effects on community diversity. Chin. J. Ecol. 2000, 19, 46–51. [Google Scholar]
  29. Jin, Y.H.; Li, D.Q.; Jiang, H.X.; Liu, J.; Li, G.H. Changes in species diversity of natural secondary forests after selective cutting disturbance in Changbai Mountain. J. Jilin Agric. Univ. 2006, 28, 35–39. [Google Scholar]
  30. Battles, J.J.; Shlisky, A.J.; Barrett, R.H.; Heald, R.C.; Allen-Diaz, B.H. The effects of forest management on plant species diversity in a Seirran conifer forest. For. Ecol. Manag. 2001, 146, 211–222. [Google Scholar] [CrossRef]
  31. Song, Q.L.; Dong, X.B. Comprehensive evaluation of forest community stability of different types of low-quality forest stands in the Greater Higgnan Mountains. For. Sci. 2014, 50, 10–17. [Google Scholar]
  32. Zheng, C.C.; Yi, L.T.; Yu, S.Q.; Liao, W.H.; Qian, Y.F. Biodiversity and stability of ecological service forest of Jiangshan City in Zhejiang Province. J. Northeast For. Univ. 2013, 41, 31–35. [Google Scholar]
  33. Zhou, X.N.; Zhou, Y.; Zhou, C.J.; Wu, Z.L.; Zheng, L.F.; Hu, X.S.; Chen, H.X.; Gan, J.B. Effects of cutting intensity on soil physical and chemical properties in a mixed natural forest in Southeastern China. Forests 2015, 6, 4495–4509. [Google Scholar] [CrossRef]
  34. Falk, K.J.; Burke, D.M.; Elliott, K.A.; Holmes, S.B. Effects of single-tree and group selection harvesting on the diversity and abundance of spring forest herbs in deciduous forests in southwestern Ontario. For. Ecol. Manag. 2008, 255, 2486–2494. [Google Scholar] [CrossRef]
  35. Magurran, A.E. Ecological Diversity and Its Measurement; Princeton University Press: Princeton, NJ, USA, 1988; p. 179. [Google Scholar]
  36. Shannon, C.E. The mathematical theory of communication. Bell Syst. Tech. J. 1948, 27, 379–423, 623–656. [Google Scholar] [CrossRef]
  37. Pielou, E.C. An Introduction to Mathematical Ecology; Wiley Interscience: New York, NY, USA, 1969; p. 286. [Google Scholar]
  38. Jang, W.; Keyes, C.R.; Page-Dumroese, D.S. Recovery and diversity of the forest shrub community 38 years after biomass harvesting in the northern Rocky Mountains. Biomass Bioenergy 2016, 92, 88–97. [Google Scholar] [CrossRef]
  39. Prévosto, B.; Bousquet-Mélou, A.; Ripert, C.; Fernandez, C. Effects of different site preparation treatments on species diversity, composition, and plant traits in Pinus halepensis woodlands. Plant. Ecol. 2011, 212, 627–638. [Google Scholar] [CrossRef]
  40. Spatharis, S.; Roelke, D.L.; Dimitrakopoulos, P.G.; Kokkoris, G.D. Analyzing the (mis) behavior of Shannon index in eutrophication studies using field and simulated phytoplankton assemblages. Ecol. Indic. 2011, 11, 697–703. [Google Scholar] [CrossRef]
  41. Wu, Z.L.; Zhou, X.N.; Zheng, L.F.; Hu, X.S.; Zhou, C.J. Species diversity and stability of natural secondary communities with different cutting intensities after ten years. J. For. Res. 2011, 22, 205–208. [Google Scholar] [CrossRef]
  42. Zhang, F.; Zhang, J.T.; Shangguan, T.L. Study on plant diversity of Zhuweigou Forest in the Lishan natural protection area. Chin. J. Plant. Ecol. 2002, 26, 46–51. [Google Scholar]
  43. Liu, M.H.; Dong, X.B.; Guo, H.; Meng, K.H.; Fan, Y.T. Change in soil physical and chemical properties of low-quality forest stands in the Xiaoxing’an mountain after alteration by logging. J. Northeast For. Univ. 2010, 38, 36–38. [Google Scholar]
  44. Godron, M. Some aspects of heterogeneity in grasslands of Cantal. Stat. Ecol. 1972, 3, 397–415. [Google Scholar]
  45. Zheng, Y.R. Comparison of methods for studying stability of forest community. Sci. Silvae Sin. 2000, 36, 28–32. [Google Scholar]
  46. Sagar, R.; Raghubanshi, A.S.; Singh, J.S. Tree species composition, dispersion and diversity along a disturbance gradient in a dry tropical forest region of India. For. Ecol. Manag. 2003, 186, 61–71. [Google Scholar] [CrossRef]
  47. Zhu, J.J.; Mao, Z.; Hu, L.L.; Zhang, J.X. Plant diversity of secondary forests in response to anthropogenic disturbance levels in montane regions of northeastern China. J. For. Res. 2007, 12, 403–416. [Google Scholar] [CrossRef]
  48. Wu, L.C.; Liu, J.; Takashima, A.; Ishigaki, K.; Watanabe, S. Effect of selective logging on stand structure and tree species diversity in a subtropical evergreen broad-leaved forest. Ann. For. Sci. 2013, 70, 353–543. [Google Scholar] [CrossRef]
  49. Aiba, S.-I.; Hill, D.A.; Agetsuma, N. Comparison between old-growth stands and secondary stands regenerating after clear-felling in warm-temperate forests of Yakushima, southern Japan. For. Ecol. Manag. 2001, 140, 163–175. [Google Scholar] [CrossRef]
  50. Zheng, L.F.; Zhou, X.N.; Wu, Z.L. Response of soil physical and chemical properties of to impacts of different cutting intensity and its evaluation. J. Fujian Coll. For. 2009, 29, 199–202. [Google Scholar]
  51. Zheng, L.F.; Zhou, X.N. Dynamic effects of selective cutting intensity on species composition and diversity of natural forest. J. Mt. Sci. 2008, 26, 699–706. [Google Scholar]
  52. Zhou, X.N.; Chen, H.R.; You, H.; Hu, X.S.; Zheng, L.F.; Wu, Z.L. Predicting model of stand diameter distribution of natural forests based on time series. J. Fujian Coll. For. 2013, 33, 298–304. [Google Scholar]
  53. Wu, Z.L.; Chen, J.T.; Zhou, X.N.; Hu, X.S.; Zhou, C.J.; Chen, H.R. Effects of selective cutting intensities on niche of six dominant species populations on arbor layer in natural secondary forest. J. Trop. Subtrop. Bot. 2013, 21, 161–167. [Google Scholar]
  54. Parrota, J.A.; Francis, J.K.; Knowles, O.H. Harvesting intensity affects structure and composition in an upland Amazonian forest. For. Ecol. Manag. 2002, 169, 243–255. [Google Scholar] [CrossRef]
  55. Miller, P.M.; Kauffman, J.B. Effects of slash and burn agriculture on species abundance and composition of a tropical deciduous forest. For. Ecol. Manag. 1998, 103, 191–201. [Google Scholar] [CrossRef]
  56. Stern, M.; Quesada, M.; Stoner, K.E. Changes in composition and structure of a tropical dry forest following intermittent cattle grazing. Rev. Biol. Trop. 2002, 50, 1021–1034. [Google Scholar] [PubMed]
  57. Carlos Álvarez-Yépiz, J.; Martínez-Yrízar, A.; Búrquez, A.; Lindquist, C. Variation in vegetation structure and soil properties related to land use history of old-growth and secondary tropical dry forests in northwestern Mexico. For. Ecol. Manag. 2008, 256, 355–366. [Google Scholar] [CrossRef]
  58. Romero-Duque, L.P.; Jaramillo, V.J.; Pérez-Jiménez, A. Structure and diversity of secondary tropical dry forests in Mexico, differing in their prior land-use history. For. Ecol. Manag. 2007, 253, 38–47. [Google Scholar] [CrossRef]
  59. McGrady-Steed, J.; Harris, P.M.; Morin, P.J. Biodiversity regulates ecosystem predictability. Nature 1997, 390, 162–165. [Google Scholar] [CrossRef]
  60. Morin, X.; Fahse, L.; de Mazancourt, C.; Scherer-Lorenzen, M.; Bugmann, H. Temporal stability in forest productivity increases with tree diversity due to asynchrony in species dynamics. Ecol. Lett. 2014, 17, 1526–1535. [Google Scholar] [CrossRef] [PubMed]
Figure 1. Quadrat layout for one sample plot.
Forests 09 00040 g001
Figure 2. Results of multiple comparisons of diversity indices of overall plants 15 years after harvesting. Scheffe multiple test; the significance level was p < 0.05; Mean ± S.D; 95% confidence interval for mean. Letters indicate differences between different harvesting intensities. NC indicates non-harvesting; LI indicates selective harvesting at low intensity; MI indicates selective harvesting at medium intensity; HI indicates selective harvesting at high intensity; EHI indicates selective harvesting at extra-high intensity; CC indicates clear-cut harvesting.
Forests 09 00040 g002
Figure 3. Plant community stability 15 years after different harvesting intensities. Horizontal axis (x): Accumulative inverse of species number. Vertical axis (y): Accumulative relative frequency. NC indicates non-harvesting; LI indicates selective harvesting at low intensity; MI indicates selective harvesting at medium intensity; HI indicates selective harvesting at high intensity; EHI indicates selective harvesting at extra-high intensity; CC indicates clear-cut harvesting.
Forests 09 00040 g003
Table 1. ANOVA results on the impacts of harvesting intensity on the stands.
Sum of SquaresdfMean SquareFp-Value
Stand Density
Between Groups5,840,552.50051,168,110.500346.2260.000 *
Within Groups40,486.000123373.833
Total5,881,038.50017
Mean Diameter at Breast Height (DBH)
Between Groups239.823547.965273.2160.000 *
Within Groups2.107120.176
Total241.92917
Mean Height
Between Groups61.964512.39398.7040.000 *
Within Groups1.507120.126
Total63.47117
Volume of Growing Stock
Between Groups193,707.658538,741.532131.9920.000 *
Within Groups3522.17112293.514
Total197,229.82817
* The significance level was p < 0.05.
Table 2. General situation of stand in studied area 15 years after different harvesting intensities.
Harvesting IntensityHarvesting Intensity (% of Growing Stock Volume)Stand Density (No. of Tree/ha)Mean DBH (cm)Mean Height (m)Volume of Growing Stock (m3/ha)
Non-harvesting01350 ± 25 d18.6 ± 0.1 a12.9 ± 0.3 a317.83 ± 8.4 a
Low13.01809 ± 29 c16.2 ± 0.5 b10.4 ± 0.4 b302.73 ± 8.7 a
Medium29.12825 ± 43 a13.1 ± 0.6 c10.6 ± 0.2 b283.42 ± 15.5 a
High45.82000 ± 66 b15.1 ± 0.3 b10.9 ± 0.2 b276.32 ± 25.0 a
Extra-high67.11925 ± 90 bc10.6 ± 0.2 d10.0 ± 0.4 b166.36 ± 27.1 b
Clear-cut harvesting1001000 ± 66 e7.5 ± 0.6 e6.6 ± 0.6 c23.77 ± 3.9 c
Scheffe multiple test; the significance level was p < 0.05; Mean ± S.D; 95% confidence interval for mean. Letters of the same column indicated differences between different harvesting intensities. The same letter indicated that the difference was not significant, for example, a and a, or a and ab, et al. Only the different letters indicated that the difference was significant, for example, a and b, b and c, et al.
Table 3. ANOVA results on the impacts of harvesting intensity on diversity indices of various layers.
Sum of SquaresdfMean SquareFp-Value
Species Richness of Tree Layer
Between Groups5.98351.19749.8030.000 *
Within Groups0.288120.024
Total6.27117
Species Richness of Shrub Layer
Between Groups16.38453.277573.2000.000 *
Within Groups0.069120.006
Total16.45317
Species Richness of Herb Layer
Between Groups3.30650.6612032.2170.000 *
Within Groups0.004120.000
Total3.31017
Species Diversity of Tree Layer
Between Groups0.16150.0320.7720.588
Within Groups0.499120.042
Total0.66017
Species Diversity of Shrub Layer
Between Groups4.83850.968520.1590.000 *
Within Groups0.022120.002
Total4.86017
Species Diversity of Herb Layer
Between Groups4.66950.9342358.2940.000 *
Within Groups0.005120.000
Total4.67417
Species Evenness of Tree Layer
Between Groups0.08450.017115.3850.000 *
Within Groups0.002120.000
Total0.08617
Species Evenness of Shrub Layer
Between Groups0.00950.00211.7090.000 *
Within Groups0.002120.000
Total0.01117
Species Evenness of Herb Layer
Between Groups1.31750.263793.6290.000 *
Within Groups0.004120.000
Total1.32117
* The significance level was p < 0.05.
Table 4. Results of multiple comparisons of diversity indices of various layers 15 years after harvesting.
LayerHarvesting Intensity
Non-HarvestingLowMediumHighExtra-HighClear-Cut Harvesting
Species Richness
Tree2.956 ± 0.093 b3.034 ± 0.162 ab3.529 ± 0.173 a2.746 ± 0.187 b2.678 ± 0.079 b1.627 ± 0.195 c
Shrub4.062 ± 0.069 b4.388 ± 0.102 a4.498 ± 0.031 a2.533 ± 0.055 c2.569 ± 0.103 c2.216 ± 0.068 d
Herb0.554 ± 0.033 c0.845 ± 0.022 b1.407 ± 0.008 a0.402 ± 0.014 d0.269 ± 0.010 e0.110 ± 0.004 f
Species Diversity
Tree1.923 ± 0.212 a1.948 ± 0.089 a2.109 ± 0.188 a1.978 ± 0.208 a1.955 ± 0.283 a1.786 ± 0.194 a
Shrub2.431 ± 0.050 a2.442 ± 0.025 a2.543 ± 0.041 a1.748 ± 0.064 b1.735 ± 0.045 b1.104 ± 0.017 c
Herb0.590 ± 0.036 c0.730 ± 0.004 b1.552 ± 0.022 a0.276 ± 0.022 d0.115 ± 0.005 e0.047 ± 0.011 f
Species Evenness
Tree0.825 ± 0.015 a0.742 ± 0.014 b0.748 ± 0.006 b0.820 ± 0.017 a0.778 ± 0.009 b0.620 ± 0.007 c
Shrub0.978 ± 0.010 a0.925 ± 0.009 b0.926 ± 0.007 b0.968 ± 0.010 a0.976 ± 0.009 a0.946 ± 0.022 ab
Herb0.537 ± 0.023 c0.635 ± 0.012 b0.902 ± 0.010 a0.285 ± 0.021 d0.165 ± 0.027 e0.158 ± 0.010 e
Scheffe multiple test; the significance level was p < 0.05; Mean ± S.D; 95% confidence interval for mean. Letters of same row indicated differences between different harvesting intensities. The same letter indicated that the difference was not significant, for example, a and a, or a and ab, et al. Only the different letters indicated that the difference was significant, for example, a and b, b and c, et al.
Table 5. Percentage changes in species diversity indices of various layers due to different harvesting intensities relative to non-harvesting.
LayerHarvesting Intensity
LowMediumHighExtra-HighClear-Cut Harvesting
Species Richness
Tree2.619.4−7.1−9.4−45.0
Shrub8.010.7−37.6−36.8−45.4
Herb52.5154.0−27.4−51.4−80.1
Species Diversity
Tree1.39.72.91.7−7.1
Shrub0.54.6−28.1−28.6−54.6
Herb23.7163.1−53.2−80.5−92.0
Species Evenness
Tree−10.1−9.3−0.6−5.7−24.8
Shrub−5.4−5.3−1.0−0.2−3.3
Herb17.368.0−46.9−69.3−70.6
Table 6. ANOVA results on the impacts of harvesting intensity on community diversity indices.
Sum of SquaresdfMean SquareFp-Value
Richness of Overall Plants (R4)
Between Groups6.46851.294213.6200.000 *
Within Groups0.073120.006
Total6.54117
Diversity of Overall Plants (H4)
Between Groups1.44450.28926.4130.000 *
Within Groups0.131120.011
Total1.57517
Evenness of Overall Plants (J4)
Between Groups0.11650.023228.9780.000 *
Within Groups0.001120.000
Total0.11817
* The significance level was p < 0.05.
Table 7. Percentage changes in species diversity indices of overall plants due to different harvesting intensities relative to non-harvesting.
IndexHarvesting Intensity
LowMediumHighExtra-HighClear-Cut Harvesting
Species Richness of Overall Plants7.323.1−19.9−22.2−47.0
Species Diversity of Overall Plants2.921.0−12.9−16.1−31.2
Species evenness of Overall Plants−3.85.1−8.6−14.8−25.9
Table 8. Changes of plant community stability 15 years after different harvesting intensities.
Harvesting IntensityCurve TypeRelevant Coefficient (R2)Coordinate of Crossing Point (x/y)Euclidean Distance (d)
Non-harvestingy = −0.0060x2 + 1.1863x + 40.01400.965129.9/70.113.985
Lowy = 20.319ln(x) + 4.98850.995527.6/72.410.748
Mediumy = 22.326ln(x) + 0.14290.992426.6/73.49.334
Highy = −0.0101x2 + 1.7684x + 21.98100.998131.9/68.116.819
Extra-highy = −0.0060x2 + 1.2694x + 33.26600.989532.1/67.917.164
Clear-cut harvestingy = −0.0126x2 + 2.1556x + 5.40240.995634.8/65.220.956

