Article

Responses of Sap Flow of Deciduous and Conifer Trees to Soil Drying in a Subalpine Forest

1
Shenzhen Engineering Laboratory for Water Desalinization with Renewable Energy, School of Environment and Energy, Peking University Shenzhen Graduate School, Shenzhen 518055, China
2
Faculty of Environmental Horticulture, Minami Kyushu University, Miyakonojyo City, Miyazaki 885-0035, Japan
*
Author to whom correspondence should be addressed.
These authors contribute equally to this work.
Forests 2018, 9(1), 32; https://doi.org/10.3390/f9010032
Submission received: 3 December 2017 / Revised: 12 January 2018 / Accepted: 12 January 2018 / Published: 14 January 2018

Abstract

:
Co-occurring species may adopt different water-use strategies to adapt to limited soil water. In Jiuzhaigou Valley, a continuous decline in soil water after an initial recharge from the thawing of snow and frozen soil in early spring was observed, but its effects on the sap flow dynamics of co-occurring species are not well understood. To clarify the species-specific water-use strategy, variations in sap flow and environmental conditions were investigated for two co-occurring species (Betula albosinensis Burk. and Pinus tabuliaeformis Carr.) in a mixed forest during a transition from the wet to dry period in 2014. Sap flow was measured using Granier-type thermal dissipation probes, and the soil-water content was measured using time-domain reflectometry probes for a successive period. Our study showed that B. albosinensis maintained relatively high transpiration until late into the season regardless of soil moisture, while the transpiration of P. tabuliformis showed a continuous decrease in response to seasonal soil drying. Sap flow for both species exhibited a marked hysteresis in response to meteorological factors and it was conditioned by the soil-water status, especially in the afternoon. We found that P. tabuliformis was sensitive to soil-water conditions, while for B. albosinensis, the sap flow was not very sensitive to changes in soil-water conditions. These results indicate that B. albosinensis could manage the water consumption conservatively under both dry and wet conditions. These results may have implications for evaluating the species-specific water-use strategy and carrying out proper reforestation practices.

1. Introduction

Jiuzhaigou Valley (JZG), located in the upper reach of the Jialing River, is a typical subalpine river valley in the transition zone between the northeast Qinghai-Tibet Plateau and the Sichuan Basin. Jiuzhaigou Valley has been rated as a World Heritage, National Nature Reserve and a world-class place of interest, due to the so-called “color forests” in fall and the fantastic beauty of the water. It was mainly the color forests that formed and the ratio between the deciduous and conifer species greatly changed after the forest harvest from 1966 to 1978 [1] Betula albosinensis Burk. in JZG is one of the main broadleaved species forming the color forests. The local administration is hence greatly concerned with the succession trend and the rate at which the broadleaved species (e.g., B. albosinensis) are replaced by the conifers (e.g., Pinus tabuliaeformis Carr.) [2]. In recent years, the local administration has intended to increase the broadleaved species, especially Betula species in the subalpine forests to provide a more fascinating tourist attraction [3]. In addition, it is believed that the ratio change will lead to changes in evapotranspiration and therefore water balance [4,5]. In recent years, with runoff decreasing and streams drying up, the water landscape of Jiuzhaigou Valley has ultimately been affected [6,7,8,9]. Therefore, for proper reforestation practices and landscape management, common species in JZG need to be investigated to understand their water-use strategies under different climatic and soil-water conditions and to determine whether they are suitable for developing a sustainable color forest landscape.
The responses of sap flow to soil moisture and meteorological factors, such as solar radiation (Rs) and vapor pressure deficit (VPD), have been a topic of research in agricultural and forest management over the last two decades [10,11,12,13,14,15,16]. Previous studies have shown that despite a large variation in the threshold of transpiration responses to the VPD, when Rs, VPD or the variable of transpiration (VT)—which is defined as an integrated index of Rs and VPD—were below a certain threshold, transpiration increased rapidly. Then, when it exceeded the threshold value, transpiration maintained a relatively stable level. However, due to large differences in sensitivity to soil-water conditions, the transpiration response usually varies greatly among different species in a single wet–dry cycle [16] and is possibly conditioned by soil-water availability [11,17].
Sap flow characteristics vary not only with meteorological factors and soil water conditions but also with species. It has been demonstrated that different species showed different responses to meteorological and edaphic parameters [10,15,16,18]. Based on the different sap flow responses to meteorological factors under different soil-water conditions, tree species can be distinguished into types with contrasting drought sensitivity [11,14,19]. For example, by analyzing sap flow characteristics and climatic responses, Du et al. [11] found that the exotic Robinia pseudoacacia Linn. in a semiarid forest of China was drought-sensitive, while the naturally dominant Quercus liaotungensis Koidz. and the indigenous concomitant species Armeniaca sibirica Lam. were drought-insensitive. Similar studies in the greater Los Angeles area showed that the native California sycamore showed little response to shallow soil-water content, while the non-native Canary Island pine was sensitive to shallow soil-water conditions but tolerant of very low soil-water availability [14].
Therefore, the effects of soil-water availability on species distribution, forest structure and stand composition could be assessed by studying the species-specific sap flow characteristics in relation to meteorological factors and soil-water availability. This approach is particularly suitable in areas subjected to higher atmospheric demand precipitation and shallow soils [20]. In JZG, the mean annual value of precipitation and potential evapotranspiration for 1956–2014 was 762 mm and 806 mm, respectively (data are from the Songpan meteorological station (32°39′ N, 103°34′ E, 2852 m elevation) of the Chinese Meteorological Association). Additionally, the subalpine mixed forest is characterized by shallow soil depth, and our previous research showed that after a large amount of soil-water recharge in early spring, JZG experienced a general decline in soil moisture as the growing season progressed [21]. In this context, the approach is suitable for assessing species’ water-use strategy by evaluating sap flow characteristics in response to meteorological factors and soil-water availability in JZG. In JZG, two dominant tree species in the secondary mixed forest are B. albosinensis and P. tabuliformis [1,22]. Both of these species are widely distributed in the subalpine region and are pioneer, shade-intolerant species [3,23], but B. albosinensis has been regarded as a forest species that prefers a humid climate and that mostly occurs in hillside and canyon habitats [24]. It has shallower roots and more fine roots near the surface than the conifer species and could take up sufficient water in a humid subalpine valley [2]. In contrast, P. tabuliformis prefers a dry and cold climate and is widely distributed in areas with precipitation ranging from 361–1038 mm [25]. However, the species-specific water-use strategy is still unknown in the experimental shed. We hence hypothesized that these two species have different water-use strategies to cope with the limitation of soil-water availability. To test the hypothesis, the sap flow for two dominant tree species and the relevant environmental data were measured in a secondary mixed forest of JZG. For the present study, we aimed to (1) investigate the sap flow and the water-use characteristics of the typical deciduous and conifer species in cold-limited areas, (2) compare the difference in sap flow for each species to meteorological factors under different soil-water conditions, and (3) compare interspecies differences of sap flow responses. The results are expected not only to enrich the understanding of species-specific water-use strategy, but also to provide insight into species distribution, forest structure and stand composition.

2. Materials and Methods

2.1. Study Site

The study site is located in Jiuzhaigou County of the Aba Tibetan and Qiang Autonomous Prefecture, Sichuan Province (32°53′–33°20′ N, 103°46′–104°05′ E). JZG lies in a transition zone of a northern subtropical area and a warm temperate area on the Tibet Plateau designated as a highland temperate monsoon climate. From 1951 to 2009, the mean annual precipitation was 762 mm, and the mean air temperature was 7.3 °C. The mean annual humidity is more than 70%. The mean annual potential evapotranspiration (806 mm) was slightly higher than the mean annual precipitation.
JZG has an elevation range spanning from 2000 m to 4800 m and the vegetation types and vegetation compositions show distinct vertical zonation: coniferous and broadleaved mixed forest below 2800 m, coniferous forest between 2800 and 3800 m, and alpine bush and meadow above 3800 m. The experiment site for the current study was thus selected in a coniferous and broadleaved mixed forest (33°9.54′ N, 103°52.86′ E) with an elevation of 2478 m, which suffered from a forest harvest during 1964–1979. At the time of study, the forest was dominated by a secondary forest of pine (P. tabuliformis), oak (Quercus liaotungensis Koidz.), and sub-canopy species (B. albosinensis and Acer ginnala Maxim.) [1,22]. B. albosinensis was generally dominant in the lower diameter classes, while P. tabuliformis was present in all diameter classes [3]. To make both species have similar access to light, all target trees were selected in sparse parts of the mixed forest. The general characteristics of B. albosinensis and P. tabuliformis in this study are presented in Table 1.

2.2. Sap Flow Measurement

The sap flux density of the target trees was measured using the thermal dissipation method [26]. Sap flow sensors (SF-G, Ecomatik, Munich, Germany) were installed in both species (B. albosinensis and P. tabuliformis), and all probes (length: 20 mm, diameter: 2 mm) were installed at DBH on both the northern and the southern sides of the trees to avoid azimuthal variations. A radiation protection shield was installed around the sensors to minimize temperature fluctuations in the sapwood, and the top of the shield was sealed off with silicon paste to protect the sensors from dripping rainwater. Sap flow data were sampled every minute, and 10-min averages were recorded on a data logger (CR1000, Campbell Scientific, Inc., Logan, UT, USA).
Sap flux density (Fd, g m−2 s−1) was calculated using the empirical equation from Granier [26] (Equations (1)):
F d = 119 ( Δ T m Δ T Δ T ) 1.231
where Fd is sap flux density (g m−2 s−1), ΔT is the temperature difference between the heated and the unheated probe, and ΔTm is the maximum temperature difference between the two probes when sap flow was expected to be zero.
For further analysis, the measured sap flux density was averaged out from all probes for each tree species and then the normalized Fd was used to minimize the differences resulting from replicated measurement [11]. It was calculated by dividing all Fd data by the maximum value throughout the study period.

2.3. Meteorological and Soil-Water Content Measurements

Several meteorological instruments were installed on a 30-m tower over the stands. Measured climatic data included downward solar radiation and upward solar and longwave radiation (CNR-4, Kipp & Zonen, Delft, The Netherlands), air temperature and relative humidity from a thermo recorder (SKH2060, Skye, Inc., Powys, UK), and precipitation from a rain gauge (7852M-AB, Davis, CA, USA). All data were sampled every 1 min and 30-min means were recorded on a CR3000 datalogger (Campbell Scientific, Logan, UT, USA).
Considering the soil type above 85 cm is brown loam and it mainly contains stones below a depth of 85 cm, we only installed soil-water probes above 85 cm. The volumetric soil-water contents (θ) and soil temperature were measured at 3 cm, 10 cm, 20 cm, 30 cm, 40 cm and 50 cm depths using six time-domain reflectometry probes (SM300, Delta-T Devices Ltd., Burwell, Cambridge, UK). The volumetric soil-water contents at 60 cm and 80 cm depth were also measured using another two time-domain reflectometry probes (ML-2X, Delta-T Devices Ltd., Burwell, Cambridge, UK). All the sensors were installed in a flat area which was about 2 m away from the surrounding tree. These data were sampled every 1 min, and the 10-min averages were stored on a CR1000 datalogger (Campbell Scientific, Logan, UT, USA).

2.4. Data Analyses and Parameters Calculation

For investigation on the responses of sap flow to environmental factors, the solar radiation (Rs), the vapor pressure deficit (VPD) as well as an integrated index defined as the variable of transpiration (VT) were used. The VPD was calculated from the air temperature and the relative humidity [27], and the VT was determined from the Rs and the VPD as follows [11,28,29,30] (Equations (2)):
V T = V P D ( R s ) 1 / 2
Soil-water content was also a critical factor for stomatal control and could affect the response of sap flow to meteorological variables [16]. The soil-water status was expressed as relative extractable water (REW) [17,26,31], which was calculated as Equations (3):
REW = ( θ - θ min ) / ( θ max - θ min )
where θmax and θmin are the saturated water content (maximum measured θ) and the minimum measured θ, respectively, during the study period. The REW ranges from 0 to 1, representing dry soil to fully saturated soil status. Water stress was considered to occur when the REW was below 0.4 [26,32,33,34]. Thus, the datasets under two soil-water conditions (REW ≥0.4 and REW <0.4) were analyzed separately.
Previous studies analyzed the relationships between the sap flow and the Rs, the VPD and the VT mostly using the exponential saturation function [11,35,36,37] and the logarithmic function with saturated points [10,15,28,38]. Considering one high and one low asymptote for the relation in the study, three logarithmic functions (DoseResp function) were used to fit for the correlations between the sap flux density and the Rs, the VPD, and the VT under different soil-water conditions (Equations (4)):.
Y = A 1 + ( A 2 A 1 ) / ( 1 + 10 q ( b X ) )
where X and Y are the corresponding environmental factor and sap flow, b is the inflection point, q is the slope at the inflection point, and A1 and A2 are the function low value and the function high value, respectively. Moreover, the Wald test was used to compare the parameter difference for the fitting curve under different soil-water conditions. For the present study, sap flow started from 0, so the parameter A1 equals 0. According to Du et al. [11], the fitting parameter q can be used to evaluate the hydraulic conductance from soil to atmosphere. A high q for the regression curve indicates a high conductance, and larger change in q upon the drying of the soil suggests a higher sensitivity to soil drought.
Based on the seasonal pattern of soil water from 2013 to 2015, pronounced divisions of a wet period, a dry period and a transition period could be observed every year [21]. To elucidate the water-use strategy for each tree species to the daily Rs and the daytime mean VPD, the transition period was hence selected as the study period.

3. Results and Discussion

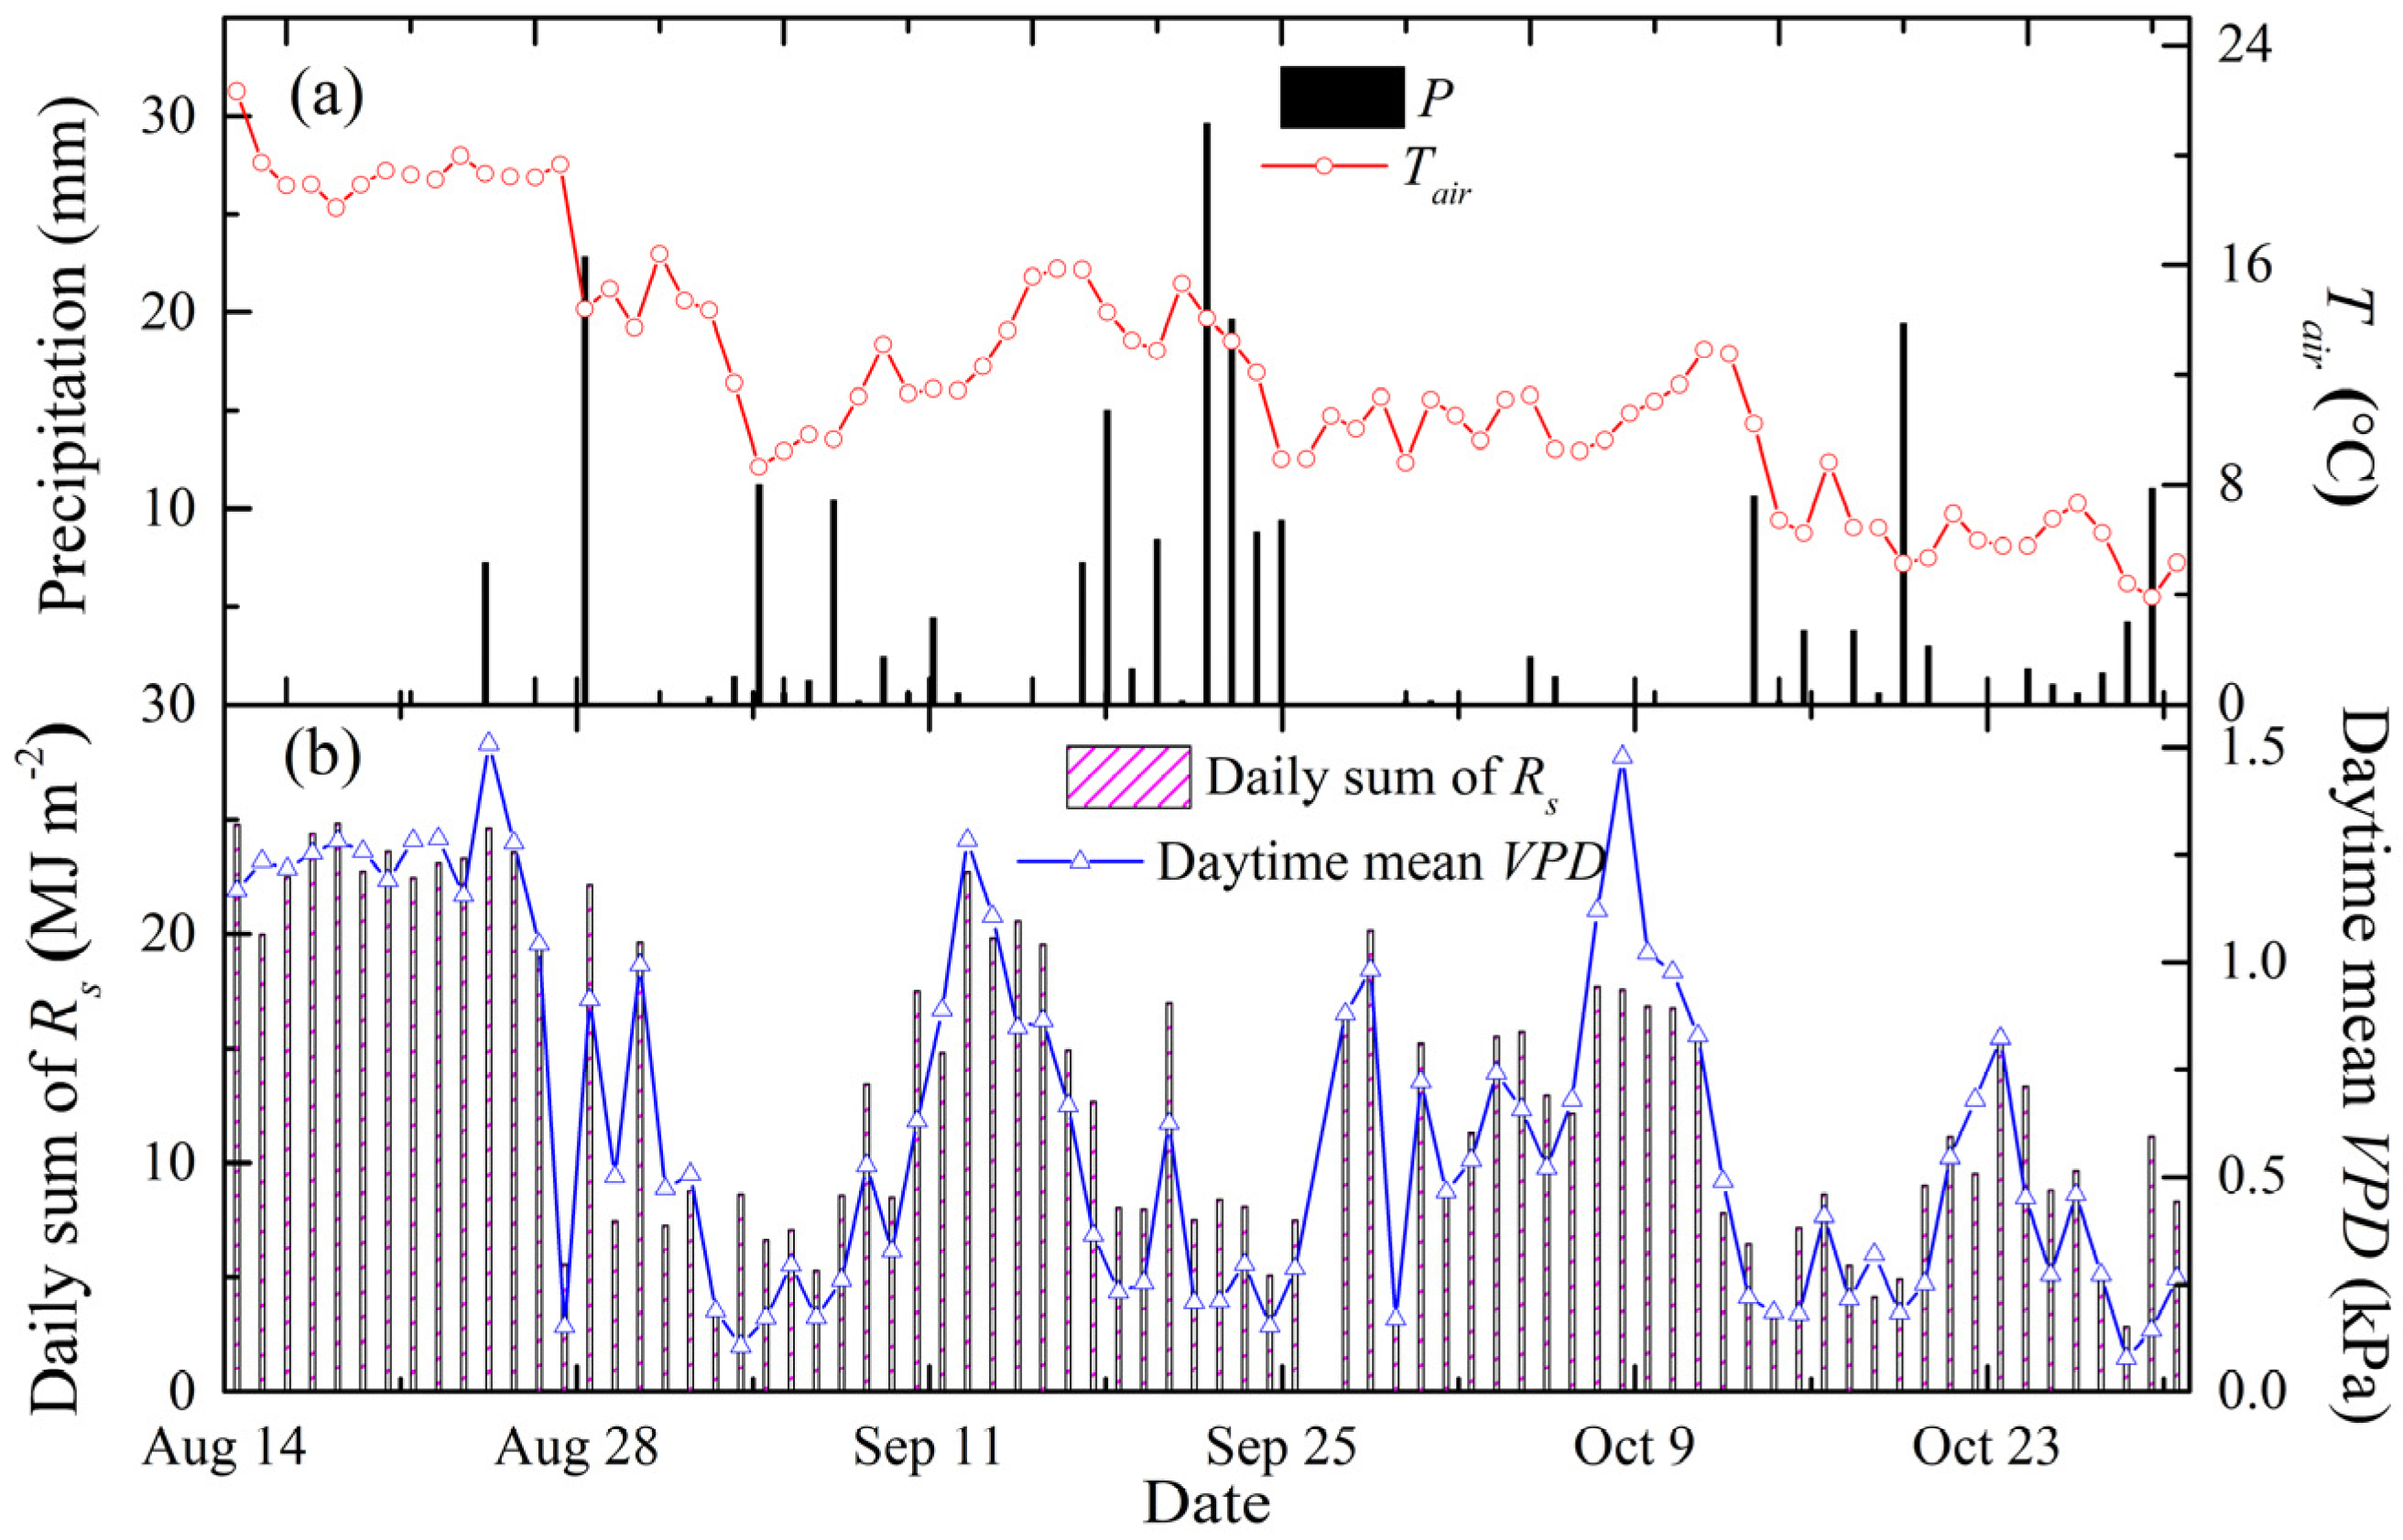
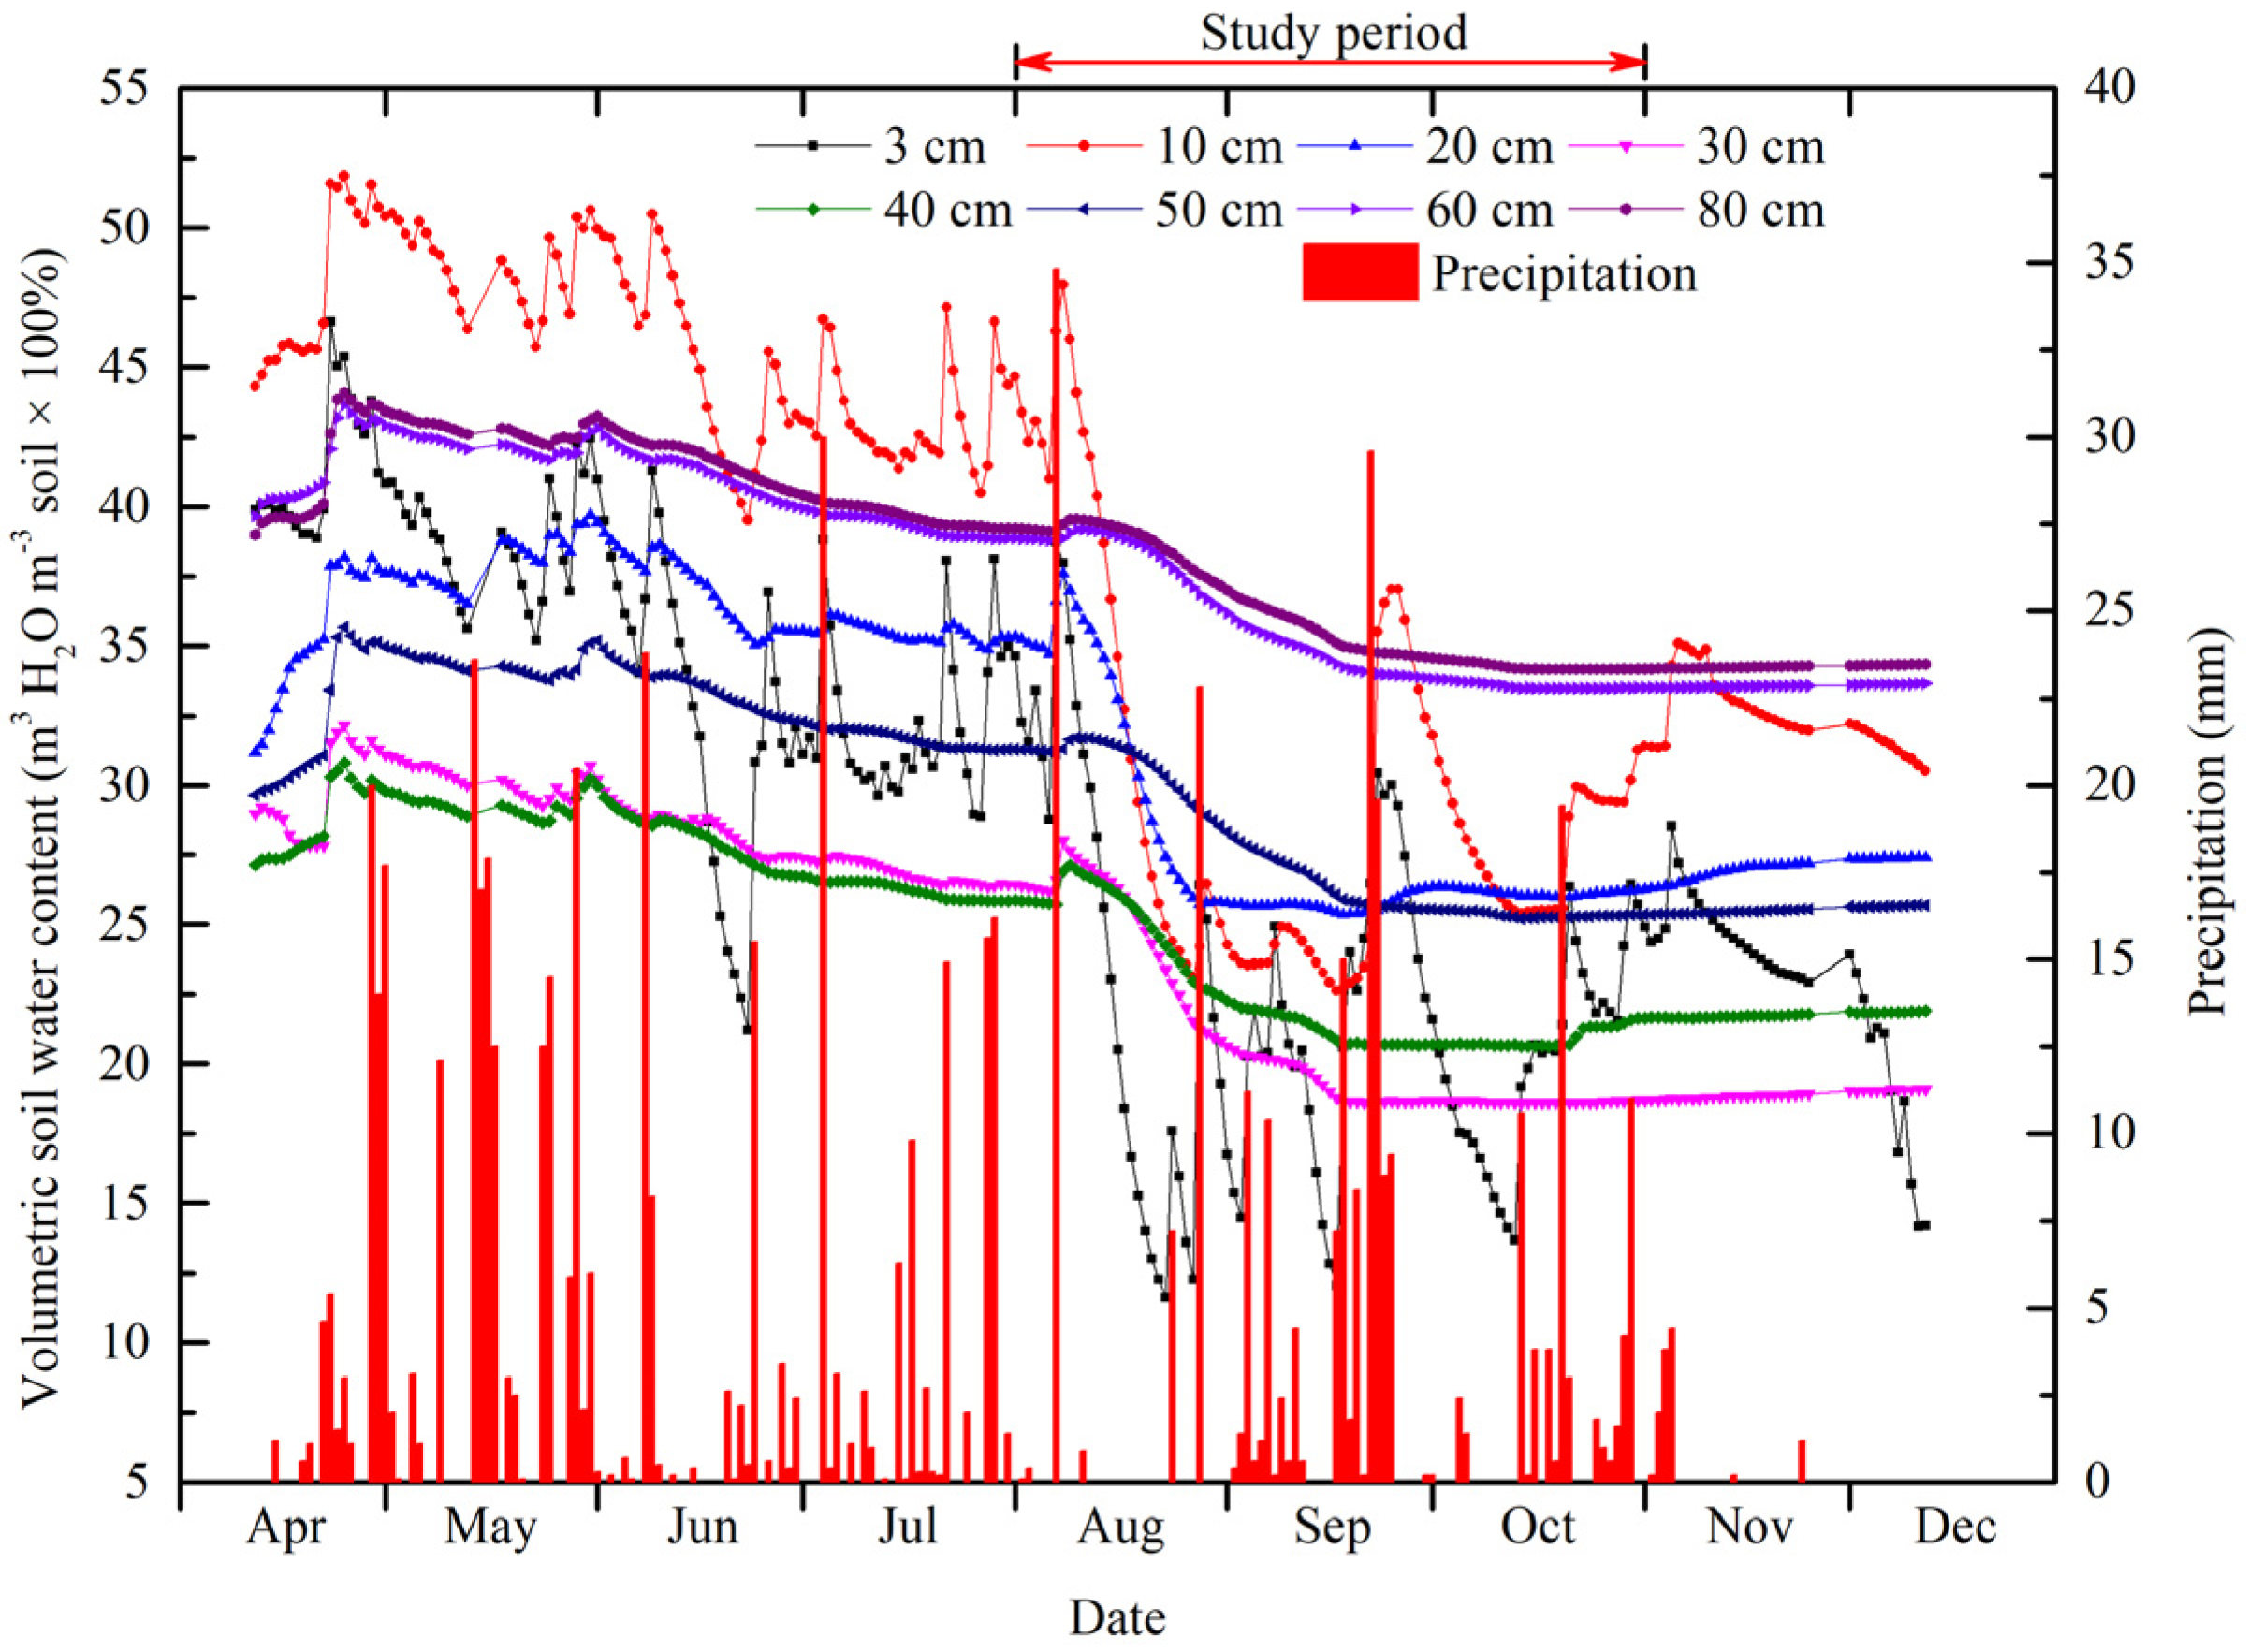
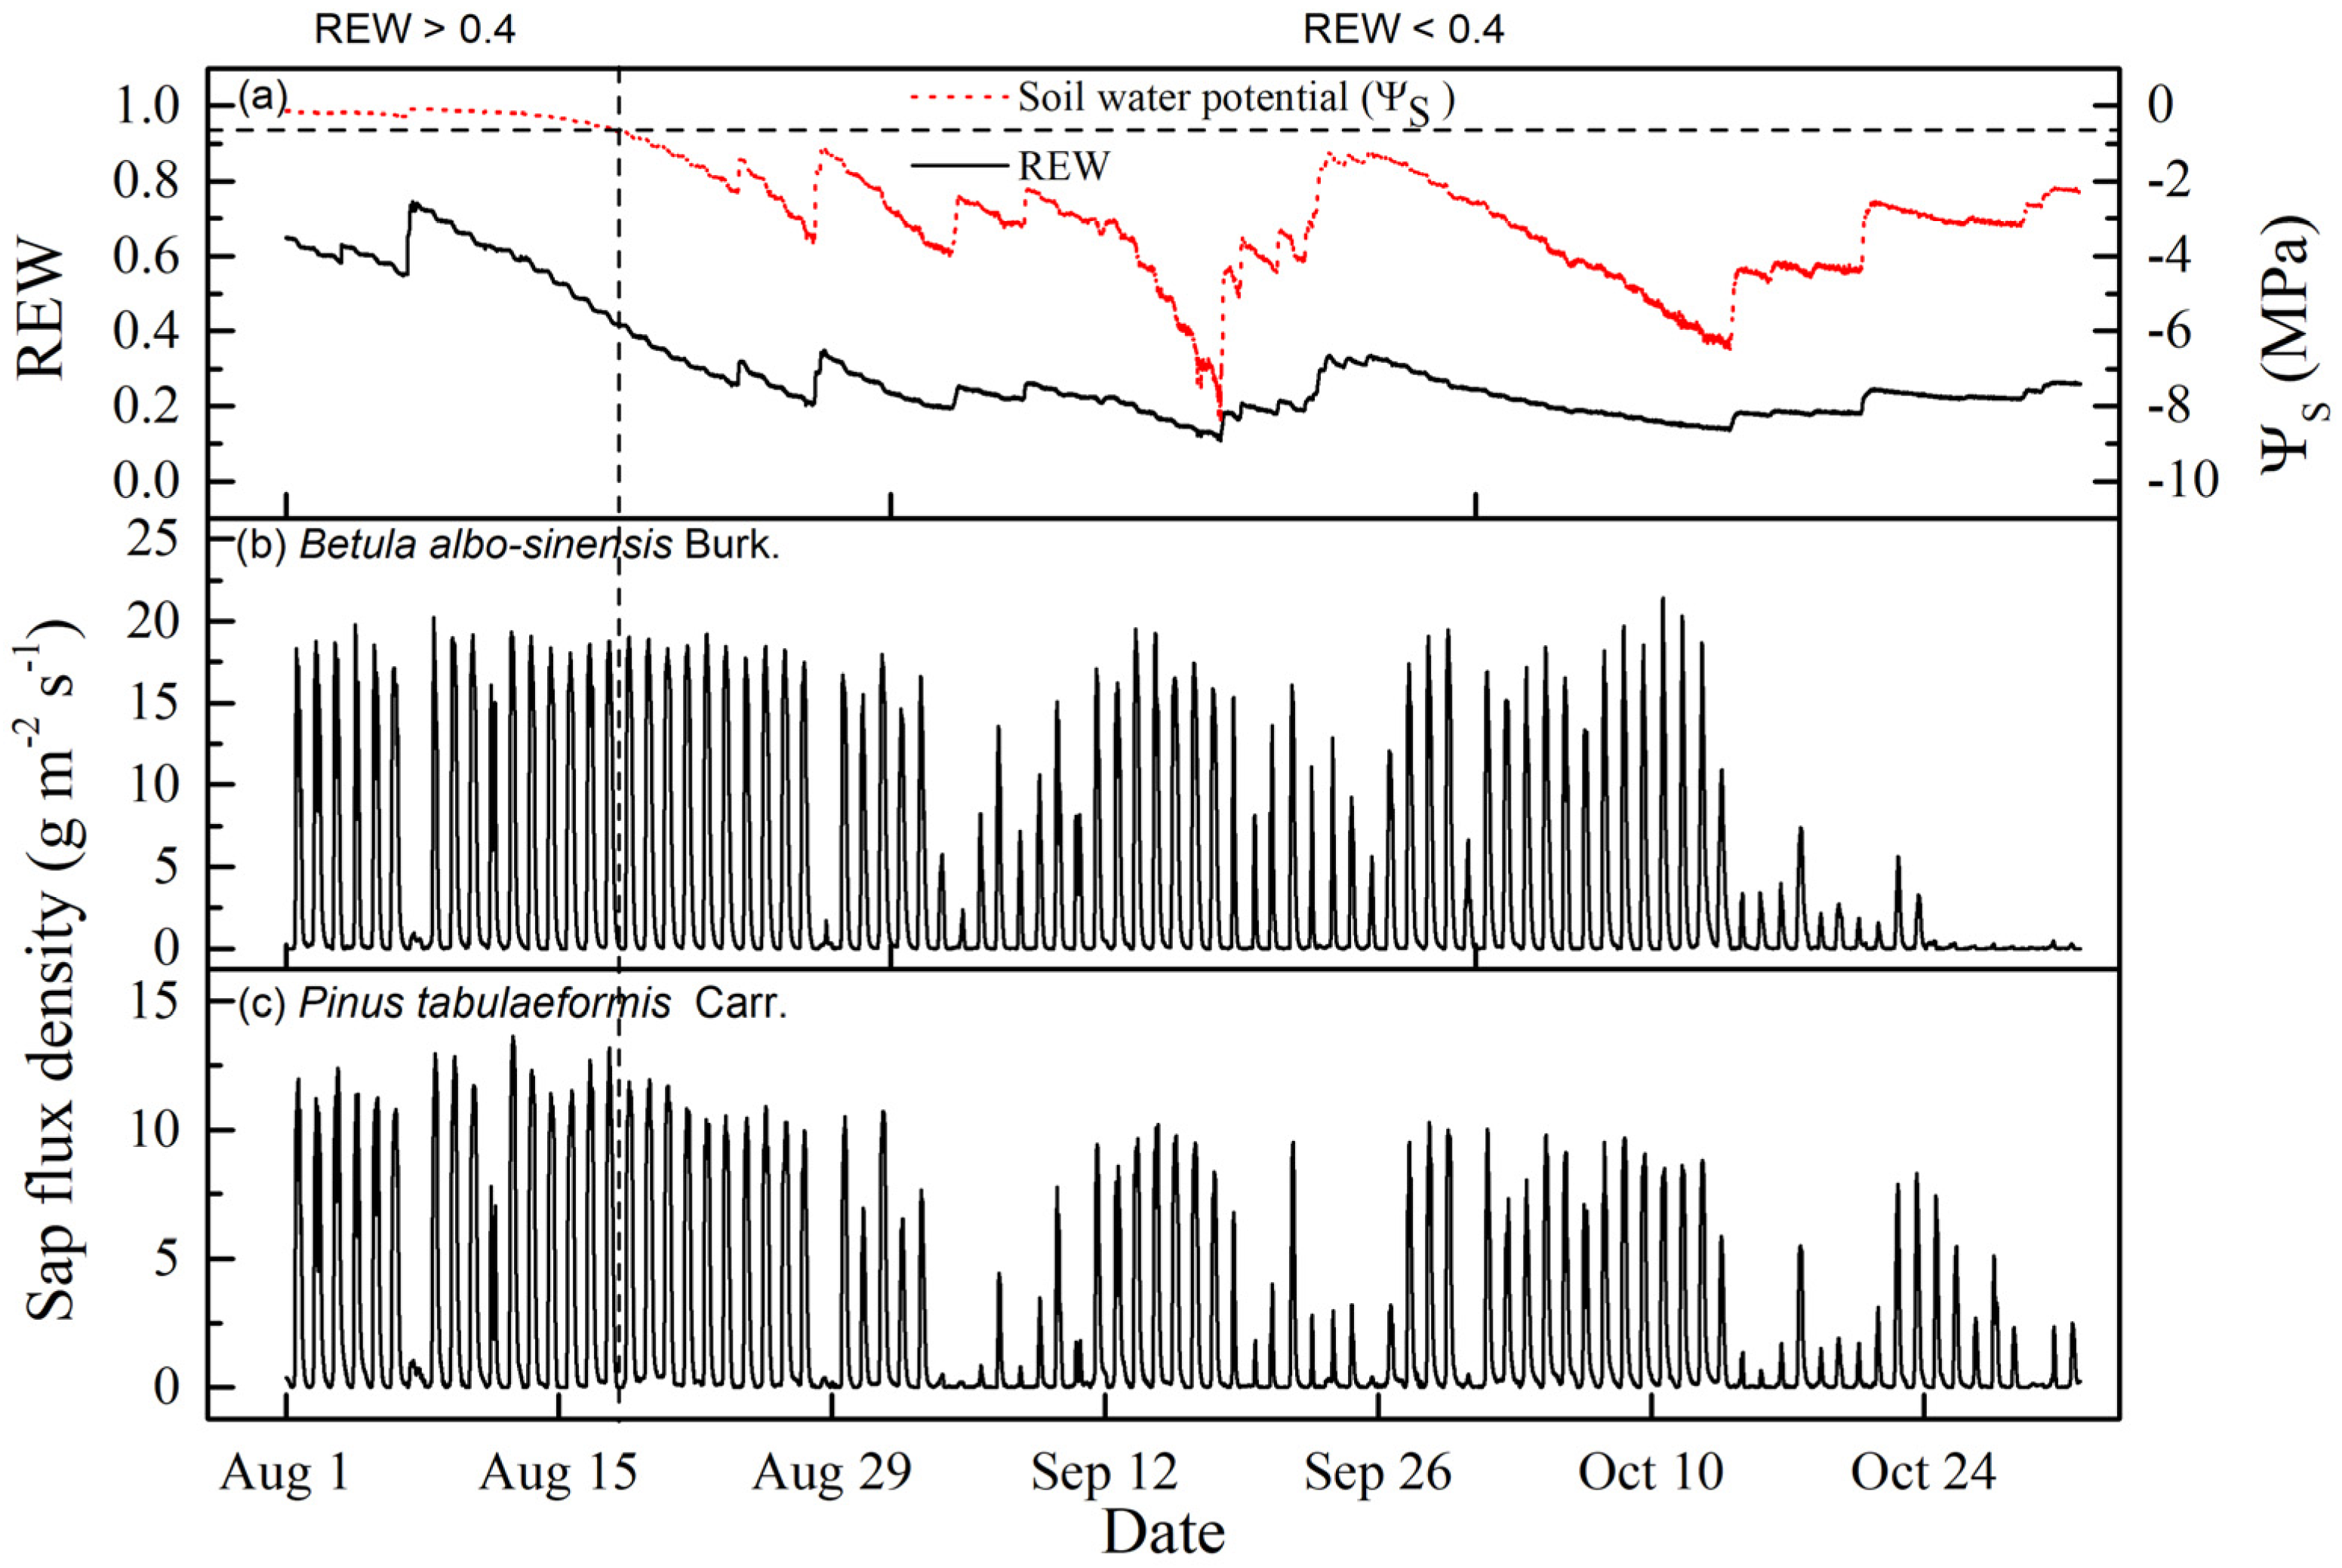
3.1. Meteorological and Soil-Water Conditions

Based on the meteorological data from the Nuorilang Central Station (approximately 2 km away from the study site), annual precipitation in 2013 was 653 mm and was 109 mm less than the mean annual value. We also found less precipitation and slightly lower relative humidity from August to October in 2013 compared to the value averaged for years, suggesting that it was a dry year in 2013.
At the study site, meteorological conditions were also observed during the study period. As shown in Figure 1a, small rain events (less than 10 mm day−1) as well as heavy rainfall events (more than 20 mm day−1) were the main cause of the pronounced change of soil water in the surface layer (Figure 2). Figure 1b shows two important climatic factors controlling the sap flow, the daily solar radiation and the daytime mean VPD for the same period of sap flow measurement.
Soil-water conditions for the entire growing season in 2013 are shown in Figure 2. Soil-water contents for all soil depths declined since the start of the growing season. Volumetric soil-water contents near the surface fluctuated more at deeper depths, coincident with rainfall events (Figure 2), indicating that precipitation mainly recharged the surface soil layer (30 cm beneath the surface). In addition, tree transpiration was reported to be associated with soil-water content at a depth of 10~20 cm in a semi-arid pine forest [39]. Sun et al. [40] found that in a humid forest, transpiration was related to soil moisture at a depth of 5~15 cm and soil evaporation was generally related to soil moisture in the topsoil (5 cm depth). The seasonal pattern of soil-water content at our site was similar to these previous studies. Thus, in this study, soil-water content at a depth of 10 cm was used to analyze sap flow response.

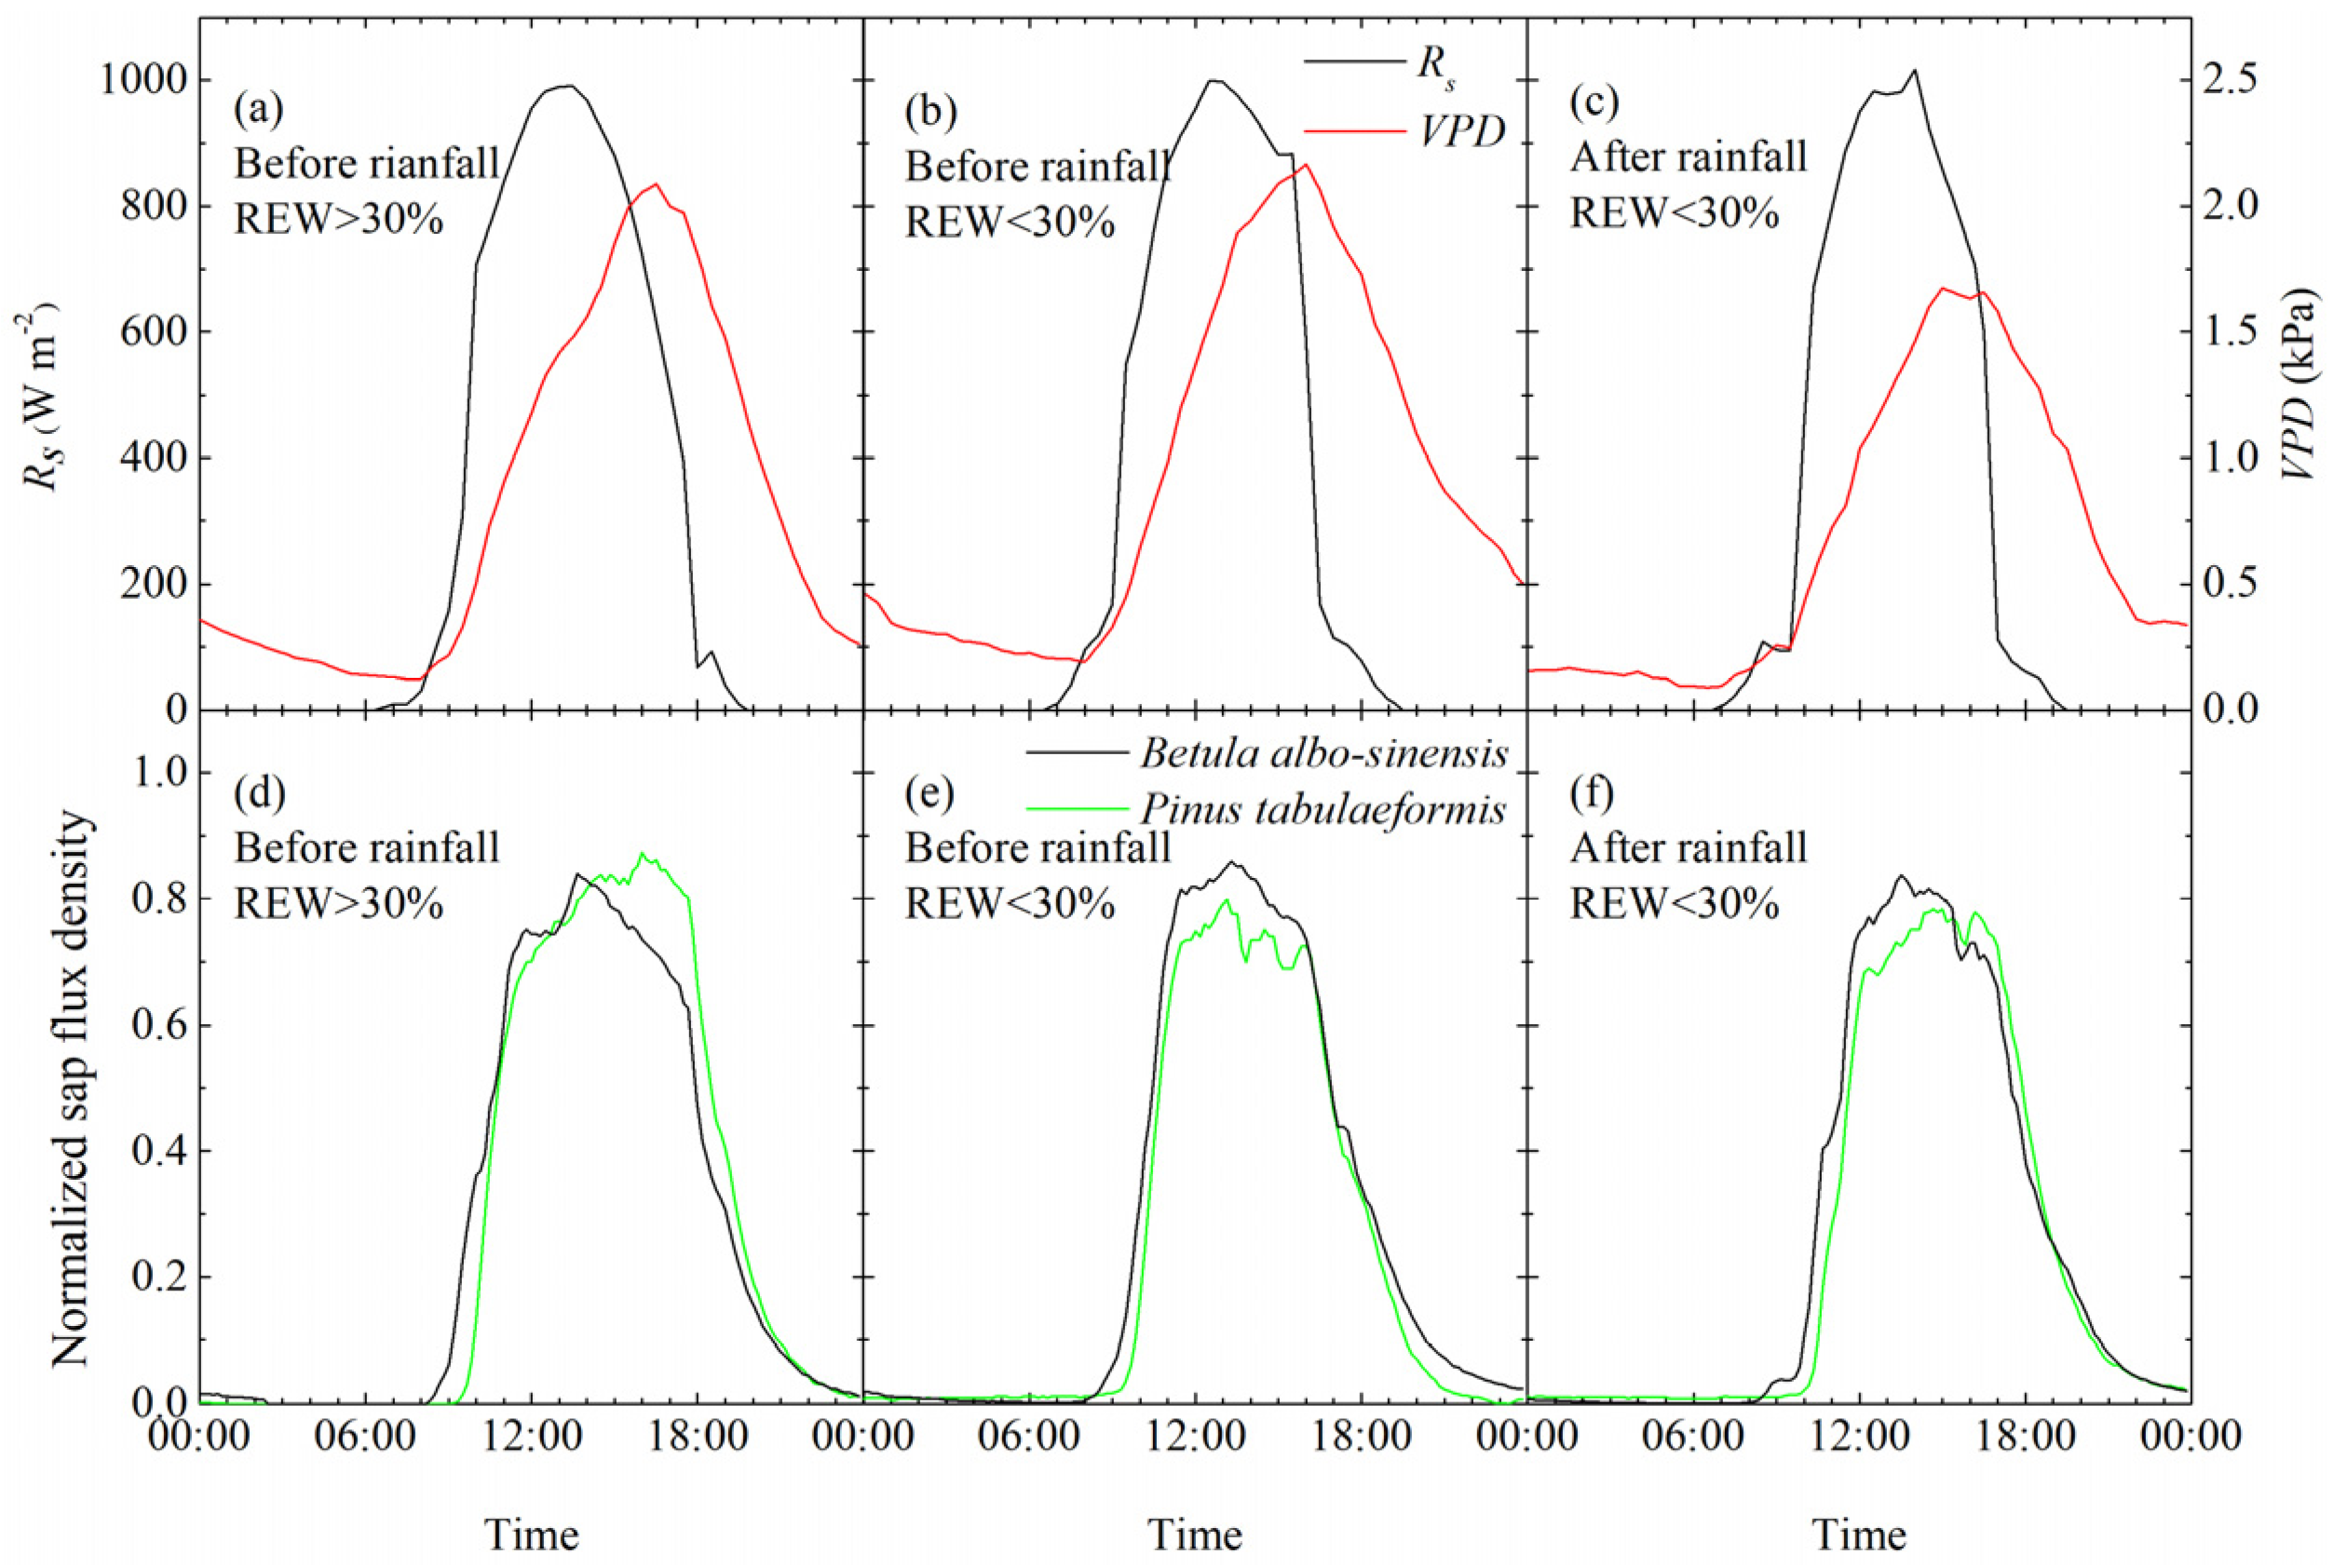
3.2. Variations in the Diurnal Course of Sap Flow

Figure 3 shows the diurnal courses of the normalized sap flux density for both tree species, the Rs, and the VPD on three typical days, two of which represent pre-rainfall days under different soil-water conditions (15 and 23 August); the other represents post-rainfall days (31 August). Although the dynamics of the normalized Fd were similar in pattern to the Rs and the VPD, they were not necessarily synchronized. We found that there was a 130–140 min time lag between the Rs and the VPD for all typical days via cross correlation analysis. The normalized Fd for P. tabuliformis increased 60–80 min after the Rs while it was 40–50 min for B. albosinensis. The peak time for B. albosinensis was close to the Rs, while for P. tabuliformis, it was close to the VPD (Figure 3). In addition, the normalized Fd started with rising solar radiation when the VPD exceeded a certain value. It was approximately 0.2 kPa and 0.3 kPa for B. albosinensis and P. tabuliformis, respectively. Then, it gradually decreased with the Rs and the VPD until midnight, when it decreased to 0.
During the continuous rain-free period with changing soil-water conditions, the variations for the normalized Fd for P. tabuliformis and B. albosinensis were different (Figure 4d,e). Under similar conditions of the Rs and the VPD (as shown in Figure 3a,b), the normalized Fd of P. tabuliformis showed a decrease in response to soil moisture decrease, while the normalized Fd of B. albosinensis under different soil-water statuses rarely changed. However, compared to the pre-rainfall days (Figure 3e,f), there was a lower normalized Fd for B. albosinensis and a similar Fd for P. tabuliformis, which could be attributed to the lower VPD (Figure 3b,c). The effects of the soil-water change on the entire hysteresis loop between the normalized Fd and the Rs/VPD were observed for both species, and we found a larger loop under dry conditions (Figure 4). These results were consistent with previous studies, in which the hysteresis tended to be larger upon soil drying to avoid extremely high sap flow and adapt to tough conditions [41,42,43]. The interspecies differences in the diurnal sap flow response to soil drying can be possibly attributed to different water-use strategies. To further investigate the water-use strategy among species, the integrated effects of multiple factors (the REW, the Rs and the VPD) should be considered on the entire hysteresis loop for the given continuous drying period.

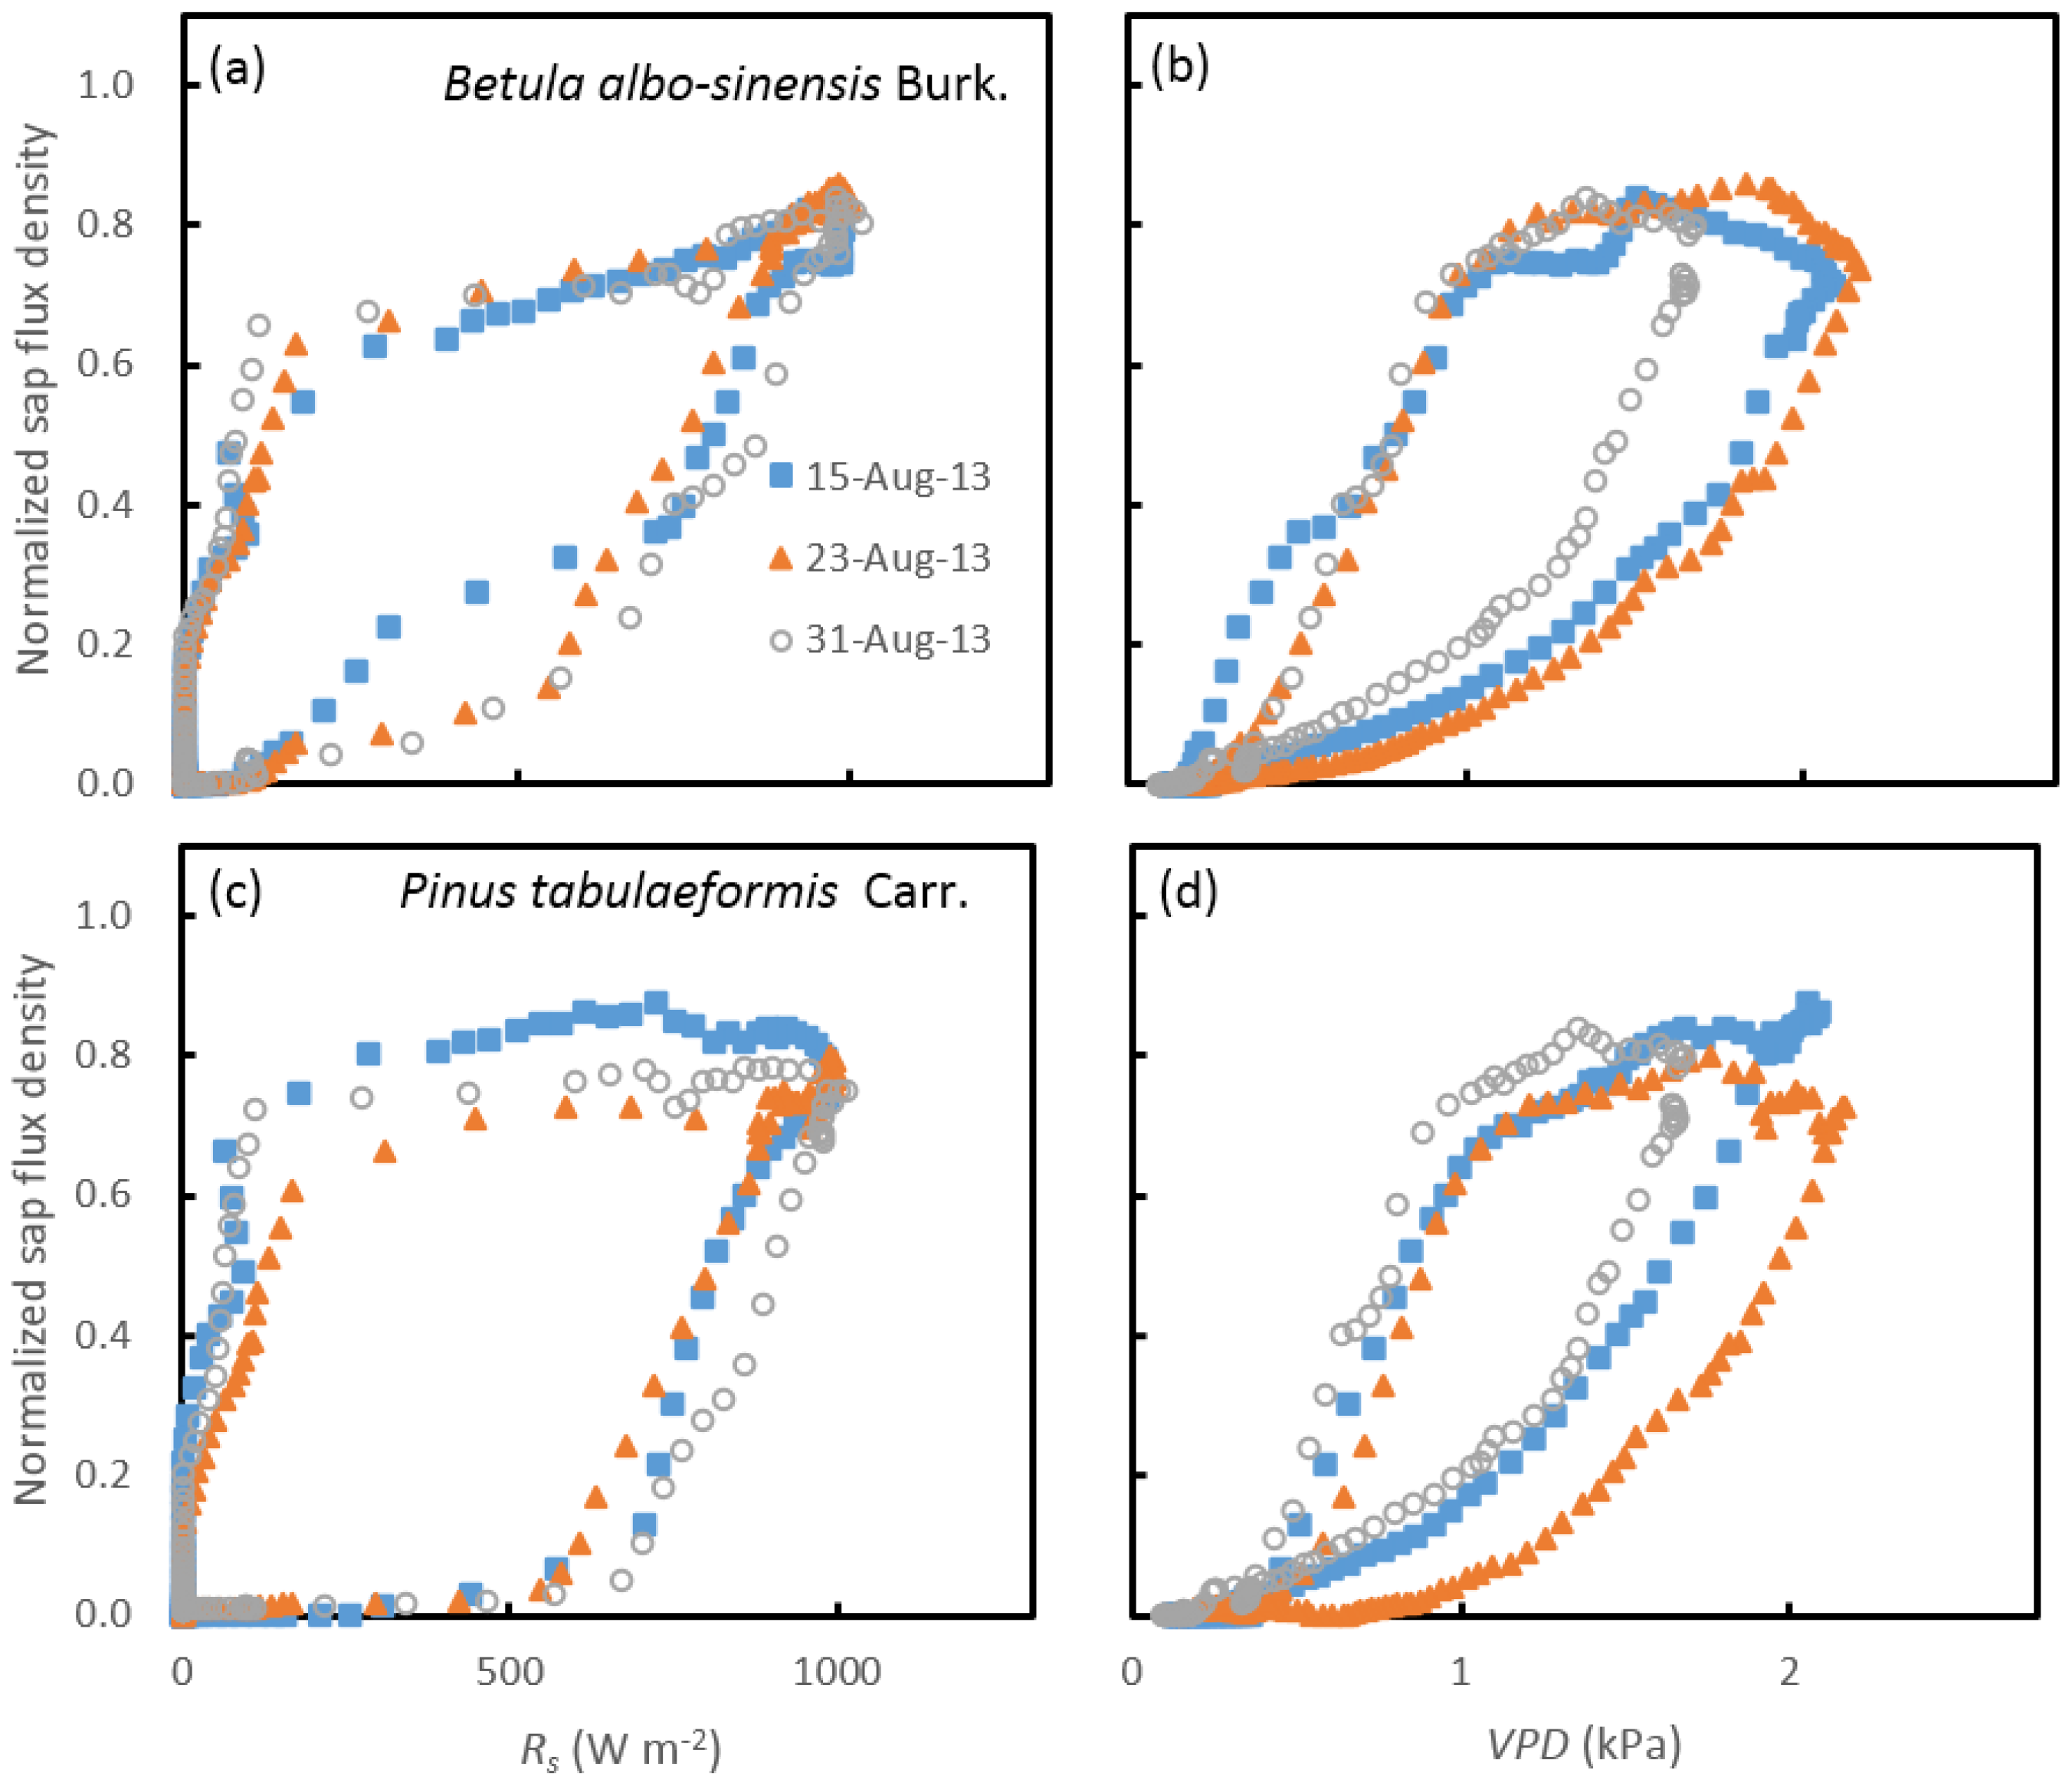
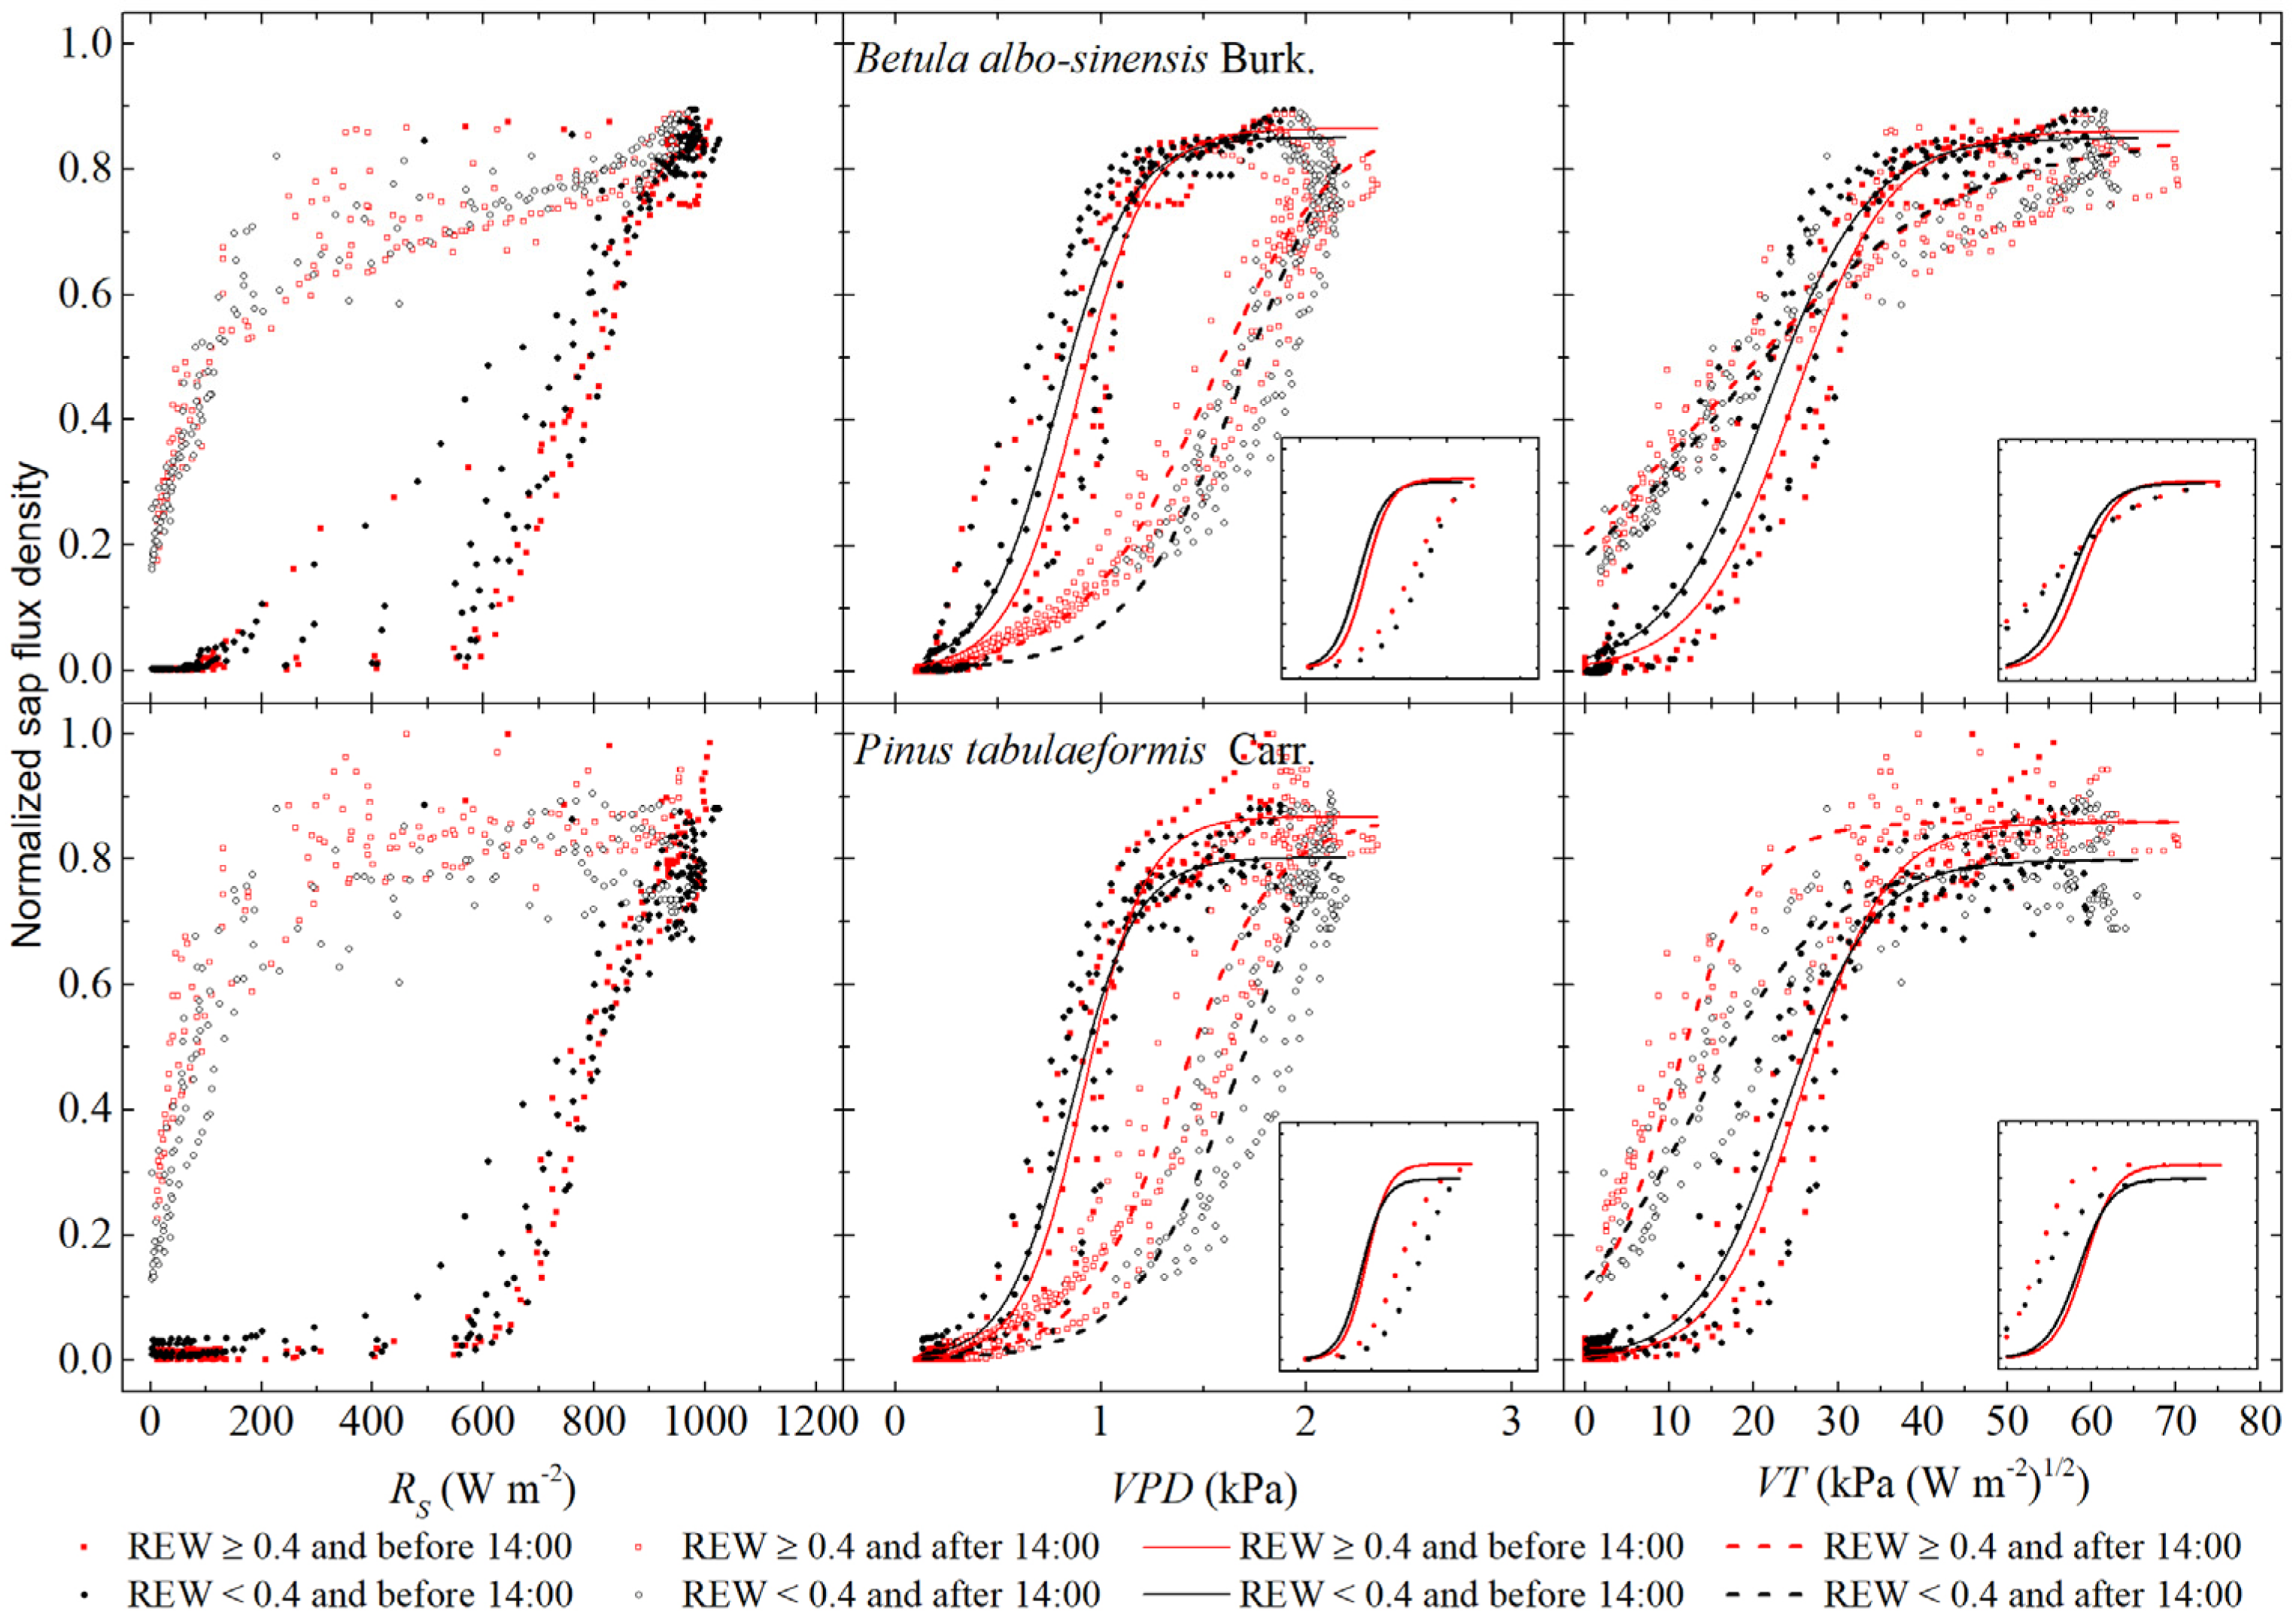
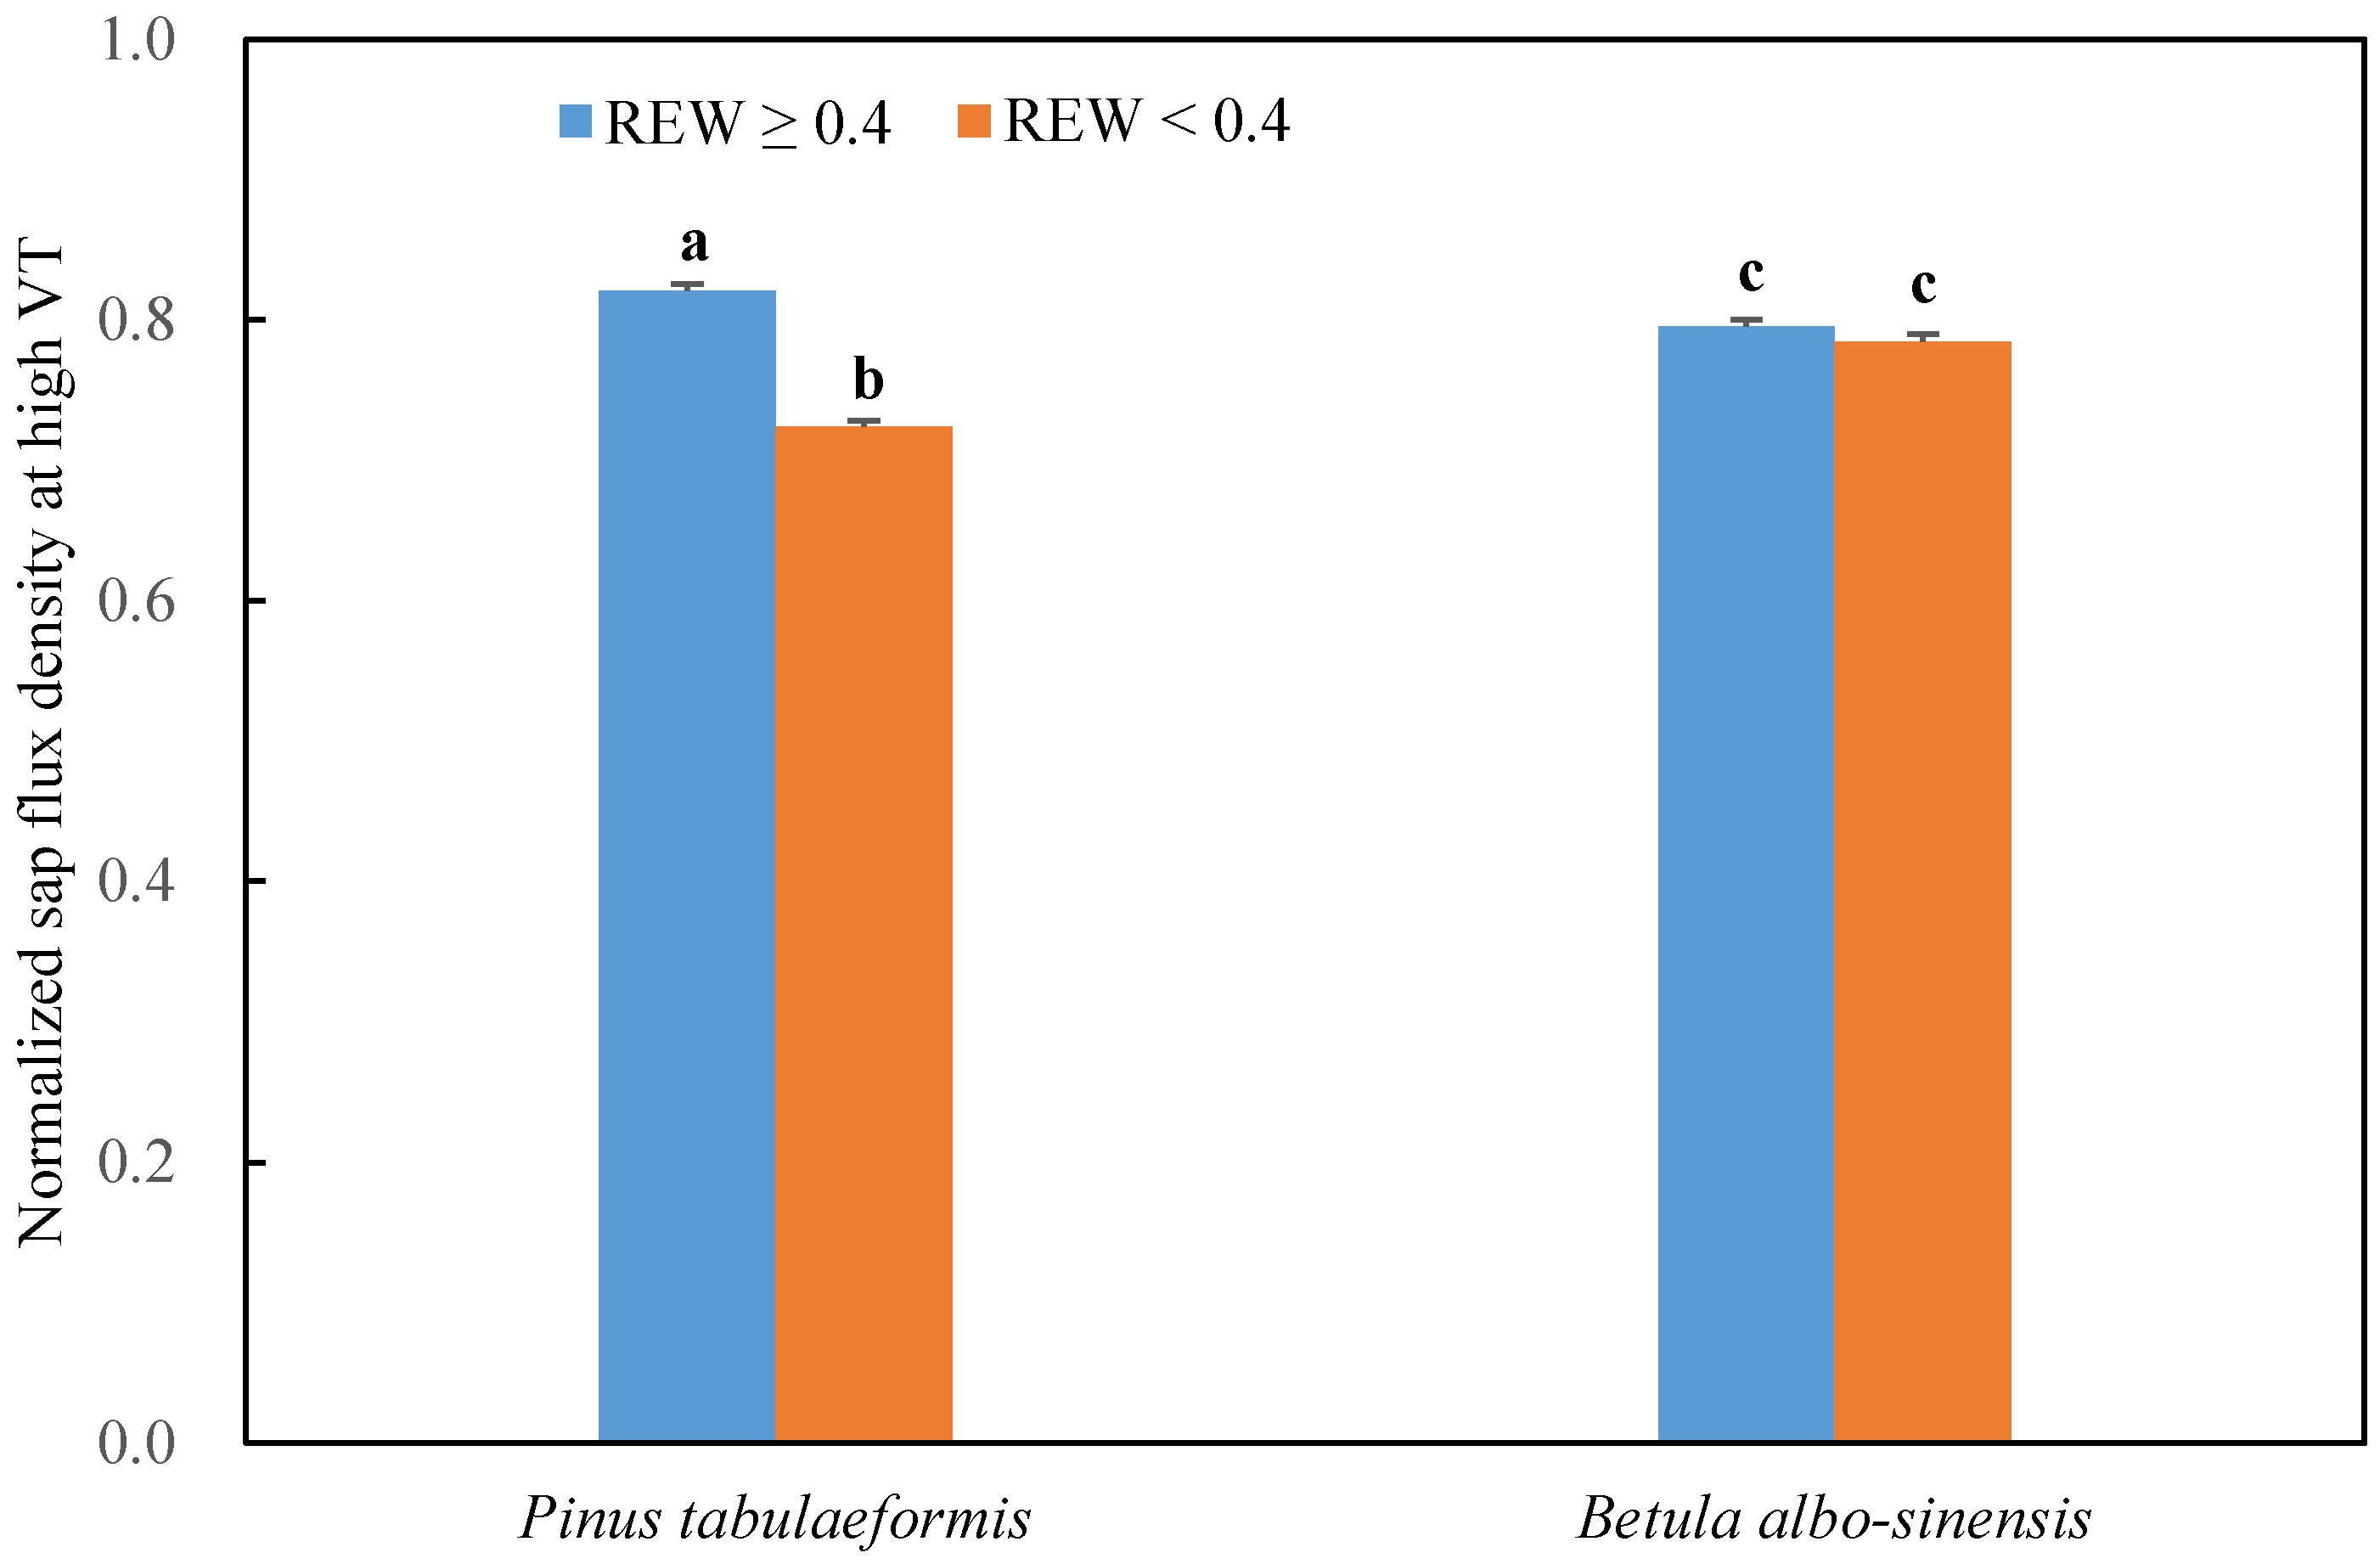
3.3. Response of Sap Flow to Meteorological Factors under Different Soil-Water Conditions

The seasonal variations in the sap flux density for P. tabuliformis and B. albosinensis during the soil drying period are shown in Figure 5. The Fd dynamics mainly reflected the variations in the Rs and the VPD (Figure 1b and Figure 5). However, B. albosinensis maintained a relatively high sap flux density of 15–20 g m−2 s−1 in the middle–late period of the growing season, and it decreased immediately to less than 5 g m−2 s−1 in mid-October, while sap flow for P. tabuliformis typically showed a gradual reduction in response to the decline in soil water. This finding likely reflects the difference in the habitats to which each species is adapted [14,44]. B. albosinensis prefers a humid climate. It has shallower roots and more fine roots near the surface than the conifer species and is therefore able to take up sufficient water in a humid subalpine valley. In contrast, P. tabuliformis prefers a dry and cold climate, indicating its adaptability and its tolerance of dry conditions. Moreover, plants growing under high relatively humidity tend to lack stomatal control, and the stomata show little response to light or drought but tended to remain open [45]. The leaves of B. albosinensis fully expand under a high humidity of more than 80% (mean annual value over the growing season from 2000 to 2013; data are from the Nuorilang Central Station, which is approximately 2 km away from the study site) and is hence to show small stomatal control. Differently, P. tabuliformis has a strong stomatal control [46]. Similar studies in Populus tremuloides also showed the smallest seasonal reductions in transpiration in comparison to the conifer species, caused by a lack of stomatal control in Populus tremuloides [20]. These results were consistent with the previous reports of the strongest stomatal control of transpiration in conifer species [47,48]. Therefore, the difference in the stomatal responses to soil water was responsible for the different seasonal patterns among species.
To further assess the effect of soil-water storage on transpiration in response to meteorological factors for the entire hysteresis loop, datasets of the normalized Fd-Rs, the VPD and the VT in August were divided and analyzed based on soil-water conditions and time. (Figure 6). Thus, sap flow datasets were divided into four groups (the REW ≥0.4 and before peaking time, the REW ≥0.4 and after peaking time, the REW <0.4 and before peaking time, and the REW <0.4 and after peaking time). To prevent the effect of the nighttime transpiration characteristics in relation to the environmental factors, only daytime datasets were used in each analysis.
As shown in Figure 6, the normalized Fd-Rs datasets showed a counter-clockwise hysteresis loop, which has also been noted in the conductance–irradiance relationship [50]. Zheng and Wang [51] reported that the hysteresis between sap flow and irradiance was counter-clockwise under wet conditions but that it shifted to clockwise under dry conditions. This result suggests that in JZG, although soil was drying, there was probably no water stress on growing plants. Figure 6 also shows that in the morning, the transpiration rate of P. tabuliformis dramatically increased within a short range of radiation, while the sap flow of B. albosinensis started earlier and maintained a longer period of increase, suggesting that P. tabuliformis had a faster stomatal response rate to light and the stomata for B. albosinensis were open at a lower Rs. In addition, the normalized Fd-Rs datasets for all species showed saturation at a high Rs. The saturation values for B. albosinensis were almost the same under different soil-water conditions, while for P. tabuliformis a higher saturation value was observed under wet conditions. These results further indicated that the stomata for B. albosinensis showed little response to light or drought, but tended to remain open and that P. tabuliformis had a strong stomatal control.
Figure 6 also depicts the fitted curves for the normalized Fd-VPD and the normalized Fd-VT datasets, respectively, under different soil-water conditions. The normalized Fd for both species exhibited a marked hysteresis in response to the VPD/VT. By comparing the magnitude of the hysteresis, which was calculated as the area enveloped by the hysteresis loop using Origin [43,52], we found that the hysteresis area was larger under dry conditions. These results were consistent with the conclusion proposed by O’Grady et al. [42] and Zhang et al. [43].
In addition, there were different responses of transpiration to soil drought during different time periods of the day. In the morning, the responses of transpiration to soil drought were similar for both species. Normalized sap flux densities were found to be initially higher in periods with lower soil water. This result was contrary to expectations based upon soil drying in arid areas of China [11,28] but was similar to studies in Europe that revealed that transpiration increased during the dry season due to a high VPD but sufficient water access [42]. Hence, the initially higher sap flow under the lower REW in JZG could also be attributed to higher VPDs (Figure 1), and trees could have had access to sufficient water even in the given dry period. However, in the afternoon, the transpiration responses to the VT under different soil-water conditions were different between the species. The transpiration for B. albosinensis tended to decrease immediately after the first half loop in the morning, while for P. tabuliformis, it maintained the saturation level for a period of time in spite of the decreasing VT. The asymptote period for P. tabuliformis was longer under wet conditions.
Table 2 and Table 3 summarize the regression results for the normalized Fd-VPD and the normalized Fd-VT datasets, respectively. Significant difference in the coefficients between periods with the REW ≥0.4 and the REW <0.4 in the afternoon suggests that the afternoon transpiration process is sensitive to soil moisture conditions for both species. In contrast, it showed less difference in the morning, especially for B. albosinensis, suggesting less amplitude of morning transpiration in response to soil drought. These results indicated that the decline of soil-water storage mainly resulted in accelerated decreases in the normalized Fd in response to the decreasing VPD or VT in the afternoon.
In addition, according to Oren et al. [53] and Du et al. [11], the slope of the FdVPD relationship can be used to evaluate the hydraulic conductance from the soil to the atmosphere. A steeper slope indicates a higher conductance. This is consistent with the parameter q in the regression function. Significant difference in parameter q for both species was observed in the afternoon (Table 2). It changed by 7.7% and 16.8% for B. albosinensis and P. tabuliformis, respectively, implying a larger change of hydraulic conductance between periods with the REW ≥0.4 and the REW <0.4 and a more sensitive response of stomata to soil-water status for P. tabuliformis. Moreover, the function high value (parameter A2) was similar for B. albosinensis regardless of soil drought in the morning, but it was significantly larger for P. tabuliformis under wet conditions for both the morning and afternoon time. This result supported the phenomenon of continuous high sap flux density for B. albosinensis and declining sap flow for P. tabuliformis upon soil drying.
The distribution of root systems may also have an effect on the sensitivity of sap flow responses to soil-water change [31,54,55,56,57]. Most of these studies showed that inherently shallow rooted species may show large reductions of sap flow or conductance in response to VPD as the soil dries, while deeply rooted species may maintain moderate rates of transpiration regardless of soil moisture. However, soil-water storage in JZG was not a limiting factor and trees had sufficient access to soil water for the transpiration. Thus, the different distribution of root systems in JZG may not contribute to water-use strategies.
To further elucidate the effect of soil-water status on the normalized sap flux density, the mean normalized Fd was also calculated from the datasets at a VT ≥40 kPa (W m−2)1/2 under different soil-water conditions over the three dry months for each species. As shown in Figure 7, a significant difference was found in the average maximum rates of the normalized Fd over the study period under different soil-water conditions for P. tabuliformis, but for B. albosinensis they were of a similar level in spite of different soil-water availabilities. The results were consistent with the findings of a more sensitive response to soil moisture for P. tabuliformis in comparison to B. albosinensis.
Similar studies in arid and semi-arid areas of China also revealed that the transpiration of P. tabuliformis was sensitive to soil-water conditions [58,59,60]. In a comparative study on the co-occurring species in a western subalpine forest of North America, it was found that the deciduous species showed less sensitivity to soil moisture than the conifer species, with relatively high transpiration continuing late into the season and moderate change in the response of transpiration to meteorological with decreasing soil moisture [20]. McCarthy and Pataki [14] also noted that the conifer species Canary Island pine was more sensitive to soil-water conditions than the deciduous species California sycamore. It was also demonstrated that species less sensitive to drought showed a moderate reduction in transpiration than species sensitive to soil drought [11,19]. Our results agreed that, in JZG, the conifer species P. tabuliformis is more sensitive to temporal changes in soil-water conditions than the deciduous species B. albosinensis.

4. Conclusions

Tree species need to manage water-use when facing soil drying, and they may adopt different water-use strategies to cope with soil-water change. This study showed species-specific behaviors of P. tabuliformis and B. albosinensis, in JZG, in response to meteorological factors and soil-water availability. The transpiration rate of P. tabuliformis showed a pronounced decrease in response to seasonal soil drying. B. albosinensis showed less sensitivity to soil water than the other species, maintaining relatively high transpiration until late in the season regardless of soil moisture.
Our results showed that sap flow is not only affected by meteorological factors (the Rs, the VPD or the VT) such as solar radiation and vapor pressure deficit but is also conditioned by soil-water conditions. The normalized Fd for both species exhibited a marked hysteresis in response to meteorological factors, and the hysteresis was conditioned by soil-water status, especially in the afternoon. The logarithmic function (DoseResp function) could be well applied for the transpiration response to the meteorological factors. According to the regression results, a pronounced decline of sap flow at a high VPD or VT appeared in P. tabuliformis, implying a strong stomatal control in relation to soil moisture [11,20].
Based on the different sap flow responses to meteorological factors under different soil-water conditions, these two species could be characterized as having different water-use strategies. P. tabuliformis was sensitive to soil-water conditions, while B. albosinensis was insensitive to soil moisture and needed access to similarly high amounts of soil water in the growing season after leaf expansion. These results suggest that B. albosinensis was able to extract water from dryer soil than P. tabuliformis and could manage the water consumption conservatively under both dry and wet conditions. These results may have implications for evaluating the water use of different forest stands and selecting sustainable reforestation species.

Acknowledgments

We acknowledge, with gratitude, the financial support from Shenzhen Science and Technology Project (JSGG20150813172407669) and the Special Fund for Forestry Research in the Public Interest (201304305). The authors would like to express their great thanks to Mr. Jiao Xiang, Minwei Chai, Wenli Zhao and Zhenhua Wang for their assistance in the field study. Great thanks also go to the Science office of Jiuzhaigou Administrative Bureau and College of Architecture and Environment, Sichuan University for their great help and cooperation in the field experiments. The authors would like to express their great thanks to Elsevier Language Editing for their efforts to improve the grammar of this paper, and to the two anonymous reviewers for their assistance in improving the quality of the paper.

Author contributions

Chunhua Yan and Bei Wang contributed equally to this work. Chunhua installed the instruments and collected the data; Bei analyzed the data and presented the results with graphs and tables; Chunhua wrote the paper. In addition, Yang Zhang and Xiaonan Zhang revised the manuscripts and gave some useful suggestions in the results and discussion section; Guo Yu Qiu designed the experiment and was the final corresponding author; Shinichi Takeuchi helped with the field experiments and data analyses.

Conflicts of Interest

The authors declare no conflict of interest.

References

  1. Hao, Y.; Wang, J.; Hong, J. The dynamics of land cover change pattern and landscape fragmentation in Jiuzhaigou Nature Reserve, China. Proc. SPIE 2009, 7498, 74983P. [Google Scholar] [CrossRef]
  2. Bossard, C.C.; Cao, Y.; Wang, J.; Rose, A.; Tang, Y. New patterns of establishment and growth of Picea, Abies and Betula tree species in subalpine forest gaps of Jiuzhaigou National Nature Reserve, Sichuan, southwestern China in a changing environment. For. Ecol. Manag. 2015, 356, 84–92. [Google Scholar] [CrossRef]
  3. Schwartz, M.W.; Dolanc, C.R.; Gao, H.; Strauss, S.Y.; Schwartz, A.C.; Williams, J.N.; Tang, Y. Forest Structure, Stand Composition, and Climate-Growth Response in Montane Forests of Jiuzhaigou National Nature Reserve, China. PLoS ONE 2013, 8, e715598. [Google Scholar] [CrossRef] [PubMed]
  4. Komatsu, H.; Tanaka, N.; Kume, T. Do coniferous forests evaporate more water than broad-leaved forests in Japan? J. Hydrol. 2007, 336, 361–375. [Google Scholar] [CrossRef]
  5. Swank, W.T.; Douglass, J.E. Streamflow greatly reduced by converting deciduous hardwood stands to pine. Science 1974, 185, 857–859. [Google Scholar] [CrossRef] [PubMed]
  6. Di, B.F.; Zhang, K.S.; Luo, H. Analysis on the Dynamic changes of Wetland Monitoring Based on Remote Sensing in Jiuzhaigou. In Proceedings of the 2011 Meeting Environmental Scientific Society of Sichuan Province, Chengdu, China; 2011; pp. 138–145. [Google Scholar]
  7. Gan, J.J.; Zheng, L.M. A Study of Landscape Geological Environment and Water Cyclic System in the Central Scenic Spot in the Jiuzhai Valley-Huanglong Scenic Spots. Acta Geol. Sichuan 2007, 27, 53–55. [Google Scholar] [CrossRef]
  8. Liu, Y.; Wang, Q.; Wang, J. Landscape pattern and stability analysis of Jiuzhaigou Nature Reserve in Sichuan China. In Proceedings of the 2011 19th International Conference on Geoinformatics, Shanghai, China, 24–26 June 2011; pp. 1–4. [Google Scholar] [CrossRef]
  9. Wu, N.; Bao, W.; Wu, Y.; Yu, S.; Ma, J.; Wang, L.; Wang, C.; Wang, J.; Wang, Q.; Wang, Y.; et al. The Ecological Environment and Sustainable Development of the World Natural Heritage Sites-Jiuzhaigou and Huanglong; Science Press: Beijing, China, 2012; p. 9. ISBN 978-70-3033-960-7. [Google Scholar]
  10. Chang, X.; Zhao, W.; He, Z. Radial pattern of sap flow and response to microclimate and soil moisture in Qinghai spruce (Picea crassifolia) in the upper Heihe River Basin of arid northwestern China. Agric. For. Meteorol. 2014, 187, 14–21. [Google Scholar] [CrossRef]
  11. Du, S.; Wang, Y.; Kume, T.; Zhang, J.; Otsuki, K.; Yamanaka, N.; Liu, G. Sapflow characteristics and climatic responses in three forest species in the semiarid Loess Plateau region of China. Agric. For. Meteorol. 2011, 151, 1–10. [Google Scholar] [CrossRef]
  12. Hogg, E.H.; Hurdle, P.A. Sap flow in trembling aspen: Implications for stomatal responses to vapor pressure deficit. Tree Physiol. 1997, 17, 501–509. [Google Scholar] [CrossRef] [PubMed]
  13. Hölscher, D.; Koch, O.; Korn, S.; Leuschner, C. Sap flux of five co-occurring tree species in a temperate broad-leaved forest during seasonal soil drought. Trees 2005, 19, 628–637. [Google Scholar] [CrossRef]
  14. McCarthy, H.R.; Pataki, D.E. Drivers of variability in water use of native and non-native urban trees in the greater Los Angeles area. Urban Ecosyst. 2010, 13, 393–414. [Google Scholar] [CrossRef]
  15. O’Brien, J.J.; Oberbauer, S.F.; Clark, D.B. Whole tree xylem sap flow responses to multiple environmental variables in a wet tropical forest. Plant Cell Environ. 2004, 27, 551–567. [Google Scholar] [CrossRef]
  16. Oren, R.; Pataki, D.E. Transpiration in response to variation in microclimate and soil moisture in southeastern deciduous forests. Oecologia 2001, 127, 549–559. [Google Scholar] [CrossRef] [PubMed]
  17. Chen, L.; Zhang, Z.; Zha, T.; Mo, K.; Zhang, Y.; Fang, X. Soil water affects transpiration response to rainfall and vapor pressure deficit in poplar plantation. New For. 2014, 45, 235–250. [Google Scholar] [CrossRef]
  18. Lagergren, F.; Lindroth, A. Transpiration response to soil moisture in pine and spruce trees in Sweden. Agric. For. Meteorol. 2002, 112, 67–85. [Google Scholar] [CrossRef]
  19. Köcher, P.; Gebauer, T.; Horna, V.; Leuschner, C. Leaf water status and stem xylem flux in relation to soil drought in five temperate broad-leaved tree species with contrasting water use strategies. Ann. For. Sci. 2009, 66, 101. [Google Scholar] [CrossRef]
  20. Pataki, D.E.; Oren, R.; Smith, W.K. Sap flux of co-occurring species in a western subalpine forest during seasonal soil drought. Ecology 2000, 81, 2557–2566. [Google Scholar] [CrossRef]
  21. Yan, C.; Zhao, W.; Wang, Y.; Yang, Q.; Zhang, Q.; Qiu, G.Y. Effects of forest evapotranspiration on soil water budget and energy flux partitioning in a subalpine valley of china. Agric. For. Meteorol. 2017, 246, 207–217. [Google Scholar] [CrossRef]
  22. Dai, X.A.; Yang, W.N.; Tang, C. Analysis of landscape spatial pattern changes using remote sensing in Jiuzhaigou Valley, Northwestern Sichuan Province, China. In Proceedings of the 2010 International Conference on Multimedia Technology (ICMT), Ningbo, China, 29–31 October 2010; pp. 1–4. [Google Scholar] [CrossRef]
  23. Winkler, D. The Forests of the Eastern Part of the Tibetan Plateau—A Case Study from Jiuzhaigou (Zitsa Degu; NNW Sichuan). Plant Res. Dev. 1998, 47, 184–212. [Google Scholar]
  24. Chinese Academy of Science Flora of China Editorial Board. Flora of China; Science Press: Beijing, China, 2004; Volume 7, p. 251, Volume 21, p. 121; ISBN 978-7-0302-7166-2. [Google Scholar]
  25. Wu, G.; Feng, Z. Study on the social characteristics and biomass of the Pinus tabulaeformis forest systems in China. Acta Ecol. Sin. 1994, 14, 415–422. [Google Scholar]
  26. Granier, A. Evaluation of transpiration in a Douglas-fir stand by means of sap flow measurements. Tree Physiol. 1987, 3, 309–320. [Google Scholar] [CrossRef] [PubMed]
  27. Campbell, G.S.; Norman, J.M. An Introduction to Environmental Biophysics; Springer: New York, NY, USA, 1998; ISBN 978-0-387-94937-6. [Google Scholar]
  28. Chen, D.; Wang, Y.; Liu, S.; Wei, X.; Wang, X. Response of relative sap flow to meteorological factors under different soil moisture conditions in rainfed jujube (Ziziphus jujuba Mill.) plantations in semiarid Northwest China. Agric. Water Manag. 2014, 136, 23–33. [Google Scholar] [CrossRef]
  29. Iida, S.; Nakatani, S.; Tanaka, T. Evaluation of Transpiration from a Natural Deciduous Broad-leaved Forest Located at a Headwater Catchment Based on Measurement of Sap Flux Density. J. Jpn. Soc. Hydrol. Water Resour. 2006, 19, 7–16. [Google Scholar] [CrossRef]
  30. Kakubari, Y.; Hosokawa, K. Estimation of stand transpiration of a beech forest based on an eco-physiological computer simulation model and superporometer. J. Jpn. For. Soc. 1992, 74, 263–272. [Google Scholar]
  31. Gartner, K.; Nadezhdina, N.; Englisch, M.; Čermak, J.; Leitgeb, E. Sap flow of birch and Norway spruce during the European heat and drought in summer 2003. For. Ecol. Manag. 2009, 258, 590–599. [Google Scholar] [CrossRef]
  32. Bréda, N.; Huc, R.; Granier, A.; Dreyer, E. Temperate forest trees and stands under severe drought: Review of ecophysiological responses, adaptation processes and long-term consequences. Ann. For. Sci. 2006, 63, 625–644. [Google Scholar] [CrossRef]
  33. Fang, S.; Zhao, C.; Jian, S. Canopy transpiration of Pinus tabulaeformis plantation forest in the Loess Plateau region of China. Environ. Earth Sci. 2016, 75, 376. [Google Scholar] [CrossRef]
  34. She, D.; Xia, Y.; Shao, M.; Peng, S.; Yu, S. Transpiration and canopy conductance of Caragana korshinskii trees in response to soil moisture in sand land of China. Agrofor. Syst. 2013, 87, 667–678. [Google Scholar] [CrossRef]
  35. Ewers, B.E.; Mackay, D.S.; Samanta, S. Interannual consistency in canopy stomatal conductance control of leaf water potential across seven tree species. Tree Physiol. 2007, 27, 11–24. [Google Scholar] [CrossRef] [PubMed]
  36. Ewers, B.E.; Mackay, D.S.; Gower, S.T.; Ahl, D.E.; Burrows, S.N.; Samanta, S.S. Tree species effects on stand transpiration in northern Wisconsin. Water Resour. Res. 2002, 38, 8-1–8-11. [Google Scholar] [CrossRef]
  37. Kumagai, T.O.; Tateishi, M.; Shimizu, T.; Otsuki, K. Transpiration and canopy conductance at two slope positions in a Japanese cedar forest watershed. Agric. For. Meteorol. 2008, 148, 1444–1455. [Google Scholar] [CrossRef]
  38. Chen, L.; Zhang, Z.; Ewers, B.E. Urban tree species show the same hydraulic response to vapor pressure deficit across varying tree size and environmental conditions. PLoS ONE 2012, 7, e47882. [Google Scholar] [CrossRef] [PubMed]
  39. Raz-Yaseef, N.; Yakir, D.; Schiller, G.; Cohen, S. Dynamics of evapotranspiration partitioning in a semi-arid forest as affected by temporal rainfall patterns. Agric. For. Meteorol. 2012, 157, 77–85. [Google Scholar] [CrossRef]
  40. Sun, X.; Onda, Y.; Kato, H.; Otsuki, K.; Gomi, T. Partitioning of the total evapotranspiration in a Japanese cypress plantation during the growing season. Ecohydrology 2014, 7, 1042–1053. [Google Scholar] [CrossRef]
  41. Brito, P.; Lorenzo, J.R.; González-Rodríguez, Á.M.; Morales, D.; Wieser, G.; Jiménez, M.S. Canopy transpiration of a semi-arid Pinus canariensis forest at a treeline ecotone in two hydrologically contrasting years. Agric. For. Meteorol. 2015, 201, 120–127. [Google Scholar] [CrossRef]
  42. O’Grady, A.P.; Eamus, D.; Hutley, L.B. Transpiration increases during the dry season: Patterns of tree water use in eucalypt open-forests of northern Australia. Tree Physiol. 1999, 19, 591–597. [Google Scholar] [CrossRef] [PubMed]
  43. Zhang, Q.; Manzoni, S.; Katul, G.; Porporato, A.; Yang, D. The hysteretic evapotranspiration—Vapor pressure deficit relation. J. Geophys. Res. G Biogeosci. 2014, 119, 125–140. [Google Scholar] [CrossRef]
  44. Tabacchi, E.; Lambs, L.; Guilloy, H.; Planty-Tabacchi, A.M.; Muller, E.; Decamps, H. Impacts of riparian vegetation on hydrological processes. Hydrol. Process. 2000, 14, 2959–2976. [Google Scholar] [CrossRef]
  45. Arve, L.E.; Terfa, M.T.; Gislerød, H.R.; Olsen, J.E.; Torre, S. High relative air humidity and continuous light reduce stomata functionality by affecting the ABA regulation in rose leaves. Plant Cell Environ. 2013, 36, 382–392. [Google Scholar] [CrossRef] [PubMed]
  46. Xu, J.; Zhang, J.; Wang, Q.; Li, H.; Ru, H.; Guo, B.; Huang, M. Photosynthesis and Transpiration Characteristics of Pinus tabulaeformis and Platycladus orientalis and Their Relationship with Environmental Factors. J. Northeast For. Univ. 2011, 39, 15–18. [Google Scholar] [CrossRef]
  47. Jarvis, P.G.; Mcnaughton, K.G. Stomatal control of transpiration: Scaling up from leaf to region. Adv. Ecol. Res. 1986, 15, 1–49. [Google Scholar] [CrossRef]
  48. Wullschleger, S.D.; Meinzer, F.C.; Vertessy, R.A. A review of whole-plant water use studies in tree. Tree Physiol. 1998, 18, 499–512. [Google Scholar] [CrossRef] [PubMed]
  49. Yin, F.; Jin, S.; Cui, D. Comparative Analysis of Brown Soil Water Characteristic Curve Fitting. Agric. Sci. Technol. Equip. 2014, 8, 017. [Google Scholar] [CrossRef]
  50. Jones, H.G. Plants and Microclimate, 2nd ed.; Cambridge University Press: Cambridge, UK, 1992; pp. 146–161. ISBN 0-521-42524-7. [Google Scholar]
  51. Zheng, C.; Wang, Q. Water-use response to climate factors at whole tree and branch scale for a dominant desert species in central Asia: Haloxylon ammodendron. Ecohydrology 2014, 7, 56–63. [Google Scholar] [CrossRef]
  52. Zeppel, M.J.; Murray, B.R.; Barton, C.; Eamus, D. Seasonal responses of xylem sap velocity to VPD and solar radiation during drought in a stand of native trees in temperate Australia. Funct. Plant Biol. 2004, 31, 461–470. [Google Scholar] [CrossRef]
  53. Oren, R.; Zimmermann, R.; Terbough, J. Transpiration in upper Amazonia floodplain and upland forests in response to drought-breaking rains. Ecology 1996, 77, 968–973. [Google Scholar] [CrossRef]
  54. Bréda, N.; Cochard, H.; Dreyer, E.; Granier, A. Water transfer in a mature oak stand (Quercus petraea): Seasonal evolution and effects of a severe drought. Can. J. For. Res. 1993, 23, 1136–1143. [Google Scholar] [CrossRef]
  55. Goulden, M.L. Carbon assimilation and water-use efficiency by neighboring mediterranean-climate oaks that differ in water access. Tree Physiol. 1996, 16, 417–424. [Google Scholar] [CrossRef] [PubMed]
  56. Granier, A.; Loustau, D. Measuring and modelling the transpiration of a maritime pine canopy from sap-flow data. Agric. For. Meteorol. 1994, 71, 61–81. [Google Scholar] [CrossRef]
  57. Kume, T.; Takizawa, H.; Yoshifuji, N.; Tanaka, K.; Tantasirin, C.; Tanaka, N.; Suzuki, M. Impact of soil drought on sap flow and water status of evergreen trees in a tropical monsoon forest in northern Thailand. For. Ecol. Manag. 2007, 238, 220–230. [Google Scholar] [CrossRef]
  58. Fan, Z.X.; Bräuning, A.; Cao, K.F.; Zhu, S.D. Growth–climate responses of high-elevation conifers in the central Hengduan Mountains, southwestern China. For. Ecol. Manag. 2009, 258, 306–313. [Google Scholar] [CrossRef]
  59. Liang, E.; Eckstein, D.; Liu, H. Climate-growth relationships of relict Pinus tabulaeformis at the northern limit of its natural distribution in northern China. J. Veg. Sci. 2009, 19, 393–406. [Google Scholar] [CrossRef]
  60. Shi, J.; Liu, Y.; Vaganov, E.A.; Li, J.; Cai, Q. Statistical and process-based modeling analyses of tree growth response to climate in semi-arid area of north central China: A case study of Pinus tabulaeformis. J. Geophys. Res. D Atmos. 2008, 113, 341–356. [Google Scholar] [CrossRef]
Figure 1. Daily values of (a) the precipitation and the air temperature (Tair), and (b) the solar radiation (Rs) and the daytime vapor pressure deficit (VPD) in the sap flow measurement period.
Forests 09 00032 g001
Figure 2. Trends of volumetric soil-water contents (m3 H2O m−3 soil × 100%) for all measurement depths of soil precipitation throughout the growing season. The period division based on soil-water conditions was obvious. Note that the study period for the present research is marked on top.
Forests 09 00032 g002
Figure 3. Diurnal courses of the Rs (black line in (ac)), the VPD (red lines in (ac)), and the normalized sap flux density for each tree species on three typical days—i.e., two pre-rainfall days with different soil-water contents, 15 August and 23 August, and a post-rainfall day on 31 August. On 28 August, a heavy rainfall event occurred (22.8 mm). Note that figures on the left, middle and right column represent diurnal courses on 15 August, 23 August and 31 August, respectively. Rs, solar radiation; VPD, vapor pressure deficit; REW, relative extractable water.
Forests 09 00032 g003
Figure 4. The diurnal hysteresis of the normalized Fd-Rs (a,c) and the normalized Fd-VPD (b,d) for B. albosinensis (upper row) and P. tabuliformis (lower row) on three typical days—i.e., two pre-rainfall days with different soil-water contents, 15 and 23 August, and a post-rainfall day on 31 August. On 28 August, a heavy rainfall event occurred (22.8 mm). Note that the normalized Fd-Rs hysteresis was counter-clockwise and the normalized Fd-VPD hysteresis was clockwise. Each dot represents the normalized sap flux density converted from the sap flux density averaged from all probes for each species. Fd, Sap flux density.
Forests 09 00032 g004
Figure 5. Seasonal variations in (a) the relative extractable water (REW), (b,c) sap flux density for both species over the study period. The vertical black dashed line represents the division of soil-water storage and the horizontal black line stands for the threshold of soil-water potential (−0.8 MPa) when REW equals to 0.4. Note that soil-water potential was not directly measured and was estimated from mean measured soil-water contents for all depths by using the soil-water characteristic curve proposed by Yin et al. [49]. Sap flux density was averaged out from all probes for each species.
Forests 09 00032 g005
Figure 6. Normalized Fd in relation to the Rs, the VPD and the variable of transpiration (VT) in the daytime hours in August for each species under different soil-water conditions and time. Note that the upper row is for B. albosinensis and the lower row is for P. tabuliformis. The black filled circles and the black solid line indicate the relationships with the REW <0.4 and before 14:00, respectively; the black open circles and the black dotted line indicate the REW <0.4 and after 14:00, respectively; the red filled squares and the red solid line indicate the REW <0.4 and before 14:00, respectively; and the red open squares and the red dotted line indicate the REW ≥0.4 and after 14:00, respectively. The DoseResp curves were well fitted to all the Fd-VPD and Fd-VT datasets (refer to Table 2 and Table 3). Each dot represents the normalized sap flux density converted from the sap flux density averaged from all probes for each species.
Forests 09 00032 g006
Figure 7. Normalized sap flux density of each species for datasets with a VT ≥40 kPa (W m−2)1/2 on different soil-water conditions over the three months. Error bars represent standard errors (n was 144 when the REW ≥0.4 and it was 431 when the REW <0.4). Means with different letters are significantly different at p < 0.01.
Forests 09 00032 g007
Table 1. Characteristics of study trees and sites. Values given in the parentheses are the range in diameter at breast height (DBH, cm), and sapwood area at DBH. After extraction of the wood core with Haglof Increment Borer, the sapwood area was estimated by dyeing the wood core.
Tree SpeciesnDiameter at Breast Height (DBH, cm)Tree Height (H, m)Sapwood Area at DBH (AS, cm2)
B. albosinensis105.9–20.66–1175.24 (19.60–284.16)
P. tabulaeformis105.6–26.86–15461.47 (23.30–479.53)
Table 2. Results of regression analyses for the relationships of the normalized Sap flux density (Fd) in response to vapor pressure deficit (VPD) in the daytime hours for respective species in Figure 7. The datasets of the normalized Fd and VPD covered periods with relative extractable water (REW) <0.4 and REW ≥0.4 at different times in August, respectively. The e logarithmic function (DoseResp function) Y = A 1 + ( A 2 A 1 ) / ( 1 + 10 q ( b X ) ) was well fitted (p < 0.001) to each dataset. Note that A1 for all datasets equals to zero. Significance for regression analyses was checked using t-test and parameter differences between the fitting curves under different soil-water conditions were checked via the Wald test. In the significance test of regression analyses, p < 0.001 represents that the nonlinear relationship between normalized Fd and VPD/VT (the variable of transpiration) was statistically significant. In the significance test of parameter differences, p < 0.05 stands for statistical difference, p < 0.01 for significant statistical difference, and p < 0.001 for extremely significant statistical difference.
SpeciesParameterBefore 14:00After 14:00
REW <0.4REW ≥0.4Parameter DifferenceREW <0.4REW ≥0.4Parameter Difference
B. albosinensisA20.850.86p = 0.460.980.89p < 0.001
b0.790.89p < 0.0011.711.52p = 0.04
p < 0.001
q2.482.57p = 0.91.521.40
R20.94680.9688 0.78810.9383
P. tabulaeformisA20.800.87p < 0.0010.790.84p < 0.001
b0.850.92p < 0.0011.571.36p < 0.001
q2.752.89p = 0.82.371.98p = 0.03
R20.94370.8784 0.79540.9540
Table 3. Results of regression analyses for the relationships of the normalized Fd in response to VT in the daytime hours for respective species in Figure 7. The datasets of the normalized Fd and VT covered periods with REW <0.4 and REW ≥0.4 at different times in August, respectively. The e logarithmic function (DoseResp function) Y = A 1 + ( A 2 A 1 ) / ( 1 + 10 q ( b X ) ) was well fitted (p < 0.001) to each dataset. Note that A1 for all datasets equals to zero. Significance for regression analyses was checked using t-test and parameter differences between the fitting curves under different soil-water conditions were checked via the Wald test.
SpeciesParameterBefore 14:00After 14:00
REW <0.4REW ≥0.4Parameter DifferenceREW <0.4REW ≥0.4Parameter Difference
B. albosinensisA20.850.861p = 0.60.820.75p < 0.001
b21.5224.63p < 0.00115.0212.37p < 0.001
q0.070.07p = 0.90.040.07P < 0.001
R20.95700.9758 0.95620.9134
P. tabulaeformisA20.800.86p < 0.0010.790.83p < 0.001
b23.6925.71p < 0.00112.759.50p < 0.001
q0.080.09p = 0.90.060.010p < 0.001
R20.95840.9837 0.90500.9610

