Article

City “Green” Contributions: The Role of Urban Greenspaces as Reservoirs for Biodiversity

by
Ian MacGregor-Fors
1,*,†,
Federico Escobar
1,*,†,
Rafael Rueda-Hernández
1,
Sergio Avendaño-Reyes
1,
Martha Lucía Baena
2,
Víctor M. Bandala
1,
Santiago Chacón-Zapata
1,
Antonio Guillén-Servent
1,
Fernando González-García
1,
Francisco Lorea-Hernández
1,
Enrique Montes de Oca
3,
Leticia Montoya
1,
Eduardo Pineda
1,
Lorena Ramírez-Restrepo
1,
Eduardo Rivera-García
1 and
Elsa Utrera-Barrillas
1
1
Instituto de Ecología, A.C. (INECOL), Carretera antigua a Coatepec 351, El Haya, Xalapa 91070, Veracruz, Mexico
2
Instituto de Investigaciones Biológicas, Universidad Veracruzana. Avenida Luis Castelazo Ayala s/n., Xalapa 91190, Veracruz, Mexico
3
Facultad de Biología, Universidad Veracruzana, Circuito Gonzalo Aguirre Beltrán s/n, Zona Universitaria, Xalapa 91070, Veracruz, Mexico
*
Authors to whom correspondence should be addressed.
These authors collaborated equally to this work.
Forests 2016, 7(7), 146; https://doi.org/10.3390/f7070146
Submission received: 31 March 2016 / Revised: 5 July 2016 / Accepted: 6 July 2016 / Published: 15 July 2016
(This article belongs to the Special Issue Urban and Periurban Forest Diversity and Ecosystem Services)

Abstract

:
Urbanization poses important environmental, social, and ecological pressures, representing a major threat to biodiversity. However, urban areas are highly heterogeneous, with some greenspaces (e.g., urban forests, parks, private gardens) providing resources and a refuge for wildlife communities. In this study we surveyed 10 taxonomic groups to assess their species richness and composition in six greenspaces that differ in size, location, management, and human activities. Species richness differed among taxonomic groups, but not all differed statistically among the studied greenspaces (i.e., sac fungi, bats). Plants, basidiomycetous and sac fungi, and birds showed intermediate assemblage composition similarity (<54%). The composition of assemblages of copro-necrophagous beetles, grasshoppers, amphibians, and bats was related to the specific traits of greenspaces, mainly size and location. The species richness contribution of each greenspace considering all studied taxonomic groups was highest in the largest greenspace that is located at the southeastern border of the city, while the lowest contribution was recorded in the smallest ones, all of them closer to the city’s center. Our results shed some light on the way in which different taxonomic groups respond to an array of neotropical urban greenspaces, providing an important basis for future studies.

Graphical Abstract

1. Introduction

As the human population rises and global economic models drive people from rural areas to urban centers, urbanization poses intensive demands with socio-economical and environmental effects at multiple scales [1,2,3]. Such effects have been related to major components of global change (i.e., land-use change, biogeochemical cycle shifts, climate change, biodiversity loss, biological invasions [1]), with urbanization identified as one of the most important causes of native species endangerment [4,5]. Thus, the functioning, sprawling, and establishment of urban areas represent important ecological and health issues [1].
Novel urban systems are highly heterogeneous, including distinctive land uses that often reflect their origin and socio-economical role [6]. Among urban land uses, greenspaces—including a wide range of variants (e.g., private gardens, sport fields, parks, urban forests/preserves, golf courses, rights-of-way)—have been shown to shelter higher biodiversity than heavily developed land-uses (e.g., residential, commercial, industrial) [7,8,9,10]. However, not all greenspaces play similar roles for biodiversity, with active management practices and human activities (e.g., pruning, high visitation volume) reducing their ecological value [11,12], as well as other habitat and geographic variables (e.g., size, location) that mold their potential as biodiversity refuges [9,13]. The responses to such variables can be attributed to underlying factors such as the biology of species, their sensitivity to disturbance, species-area relationships, edge effects, habitat heterogeneity associated with greenspaces and the history of local and regional land uses [13,14,15,16,17].
A vast body of literature focused on the ecology of urban systems has drawn generalized biodiversity patterns [8]. However, there is a worrisome lack of knowledge regarding other biological groups, given that much evidence-based urban management and planning is heavily biased towards birds and vegetation [9]. Additionally, there is also a gap in our comprehension of urban ecology patterns and processes in developing countries, where biodiversity is often high and urbanization is expected to increase in the next decades [3,16,17,18,19]. Recently, urban ecologists have addressed multi-taxonomic responses of native, non-native, and invasive species in urban areas [20,21]. These studies are not only a baseline for biological inventories, but also show the type of information that several taxonomic groups can provide when assessing their ecological responses to urbanization.
Although urban greenspaces are intended to have important environmental functions, together with other economic, social, and health functions [22], little is known about the relative role that the arrangement of greenspaces in a city can have in sheltering biodiversity. In this study we assessed multi-taxonomic species richness and composition shifts, as well as the overall species contribution of six urban greenspaces with different sizes, management, and human activities in a neotropical city (Xalapa, Veracruz, southeast Mexico). We expected an overall increase of species richness in larger, peri-urban greenspaces with fewer management practices (e.g., pruning intensity, trail clearing) and human activities (e.g., visitors, noise). Regarding species composition, we predicted peri-urban greenspaces to have higher dissimilarity in relation to intra-urban sites due to their connectivity with extra-urban systems; however, we expected the biology of each group and its association with urbanization (e.g., positive for ants) also to drive this pattern. Finally, we expected larger urban greenspaces, farther from the city’s geographic center and with fewer management practices, to shelter a greater average proportion of all the studied groups when compared to smaller, managed greenspaces located in the city’s core.

2. Materials and Methods
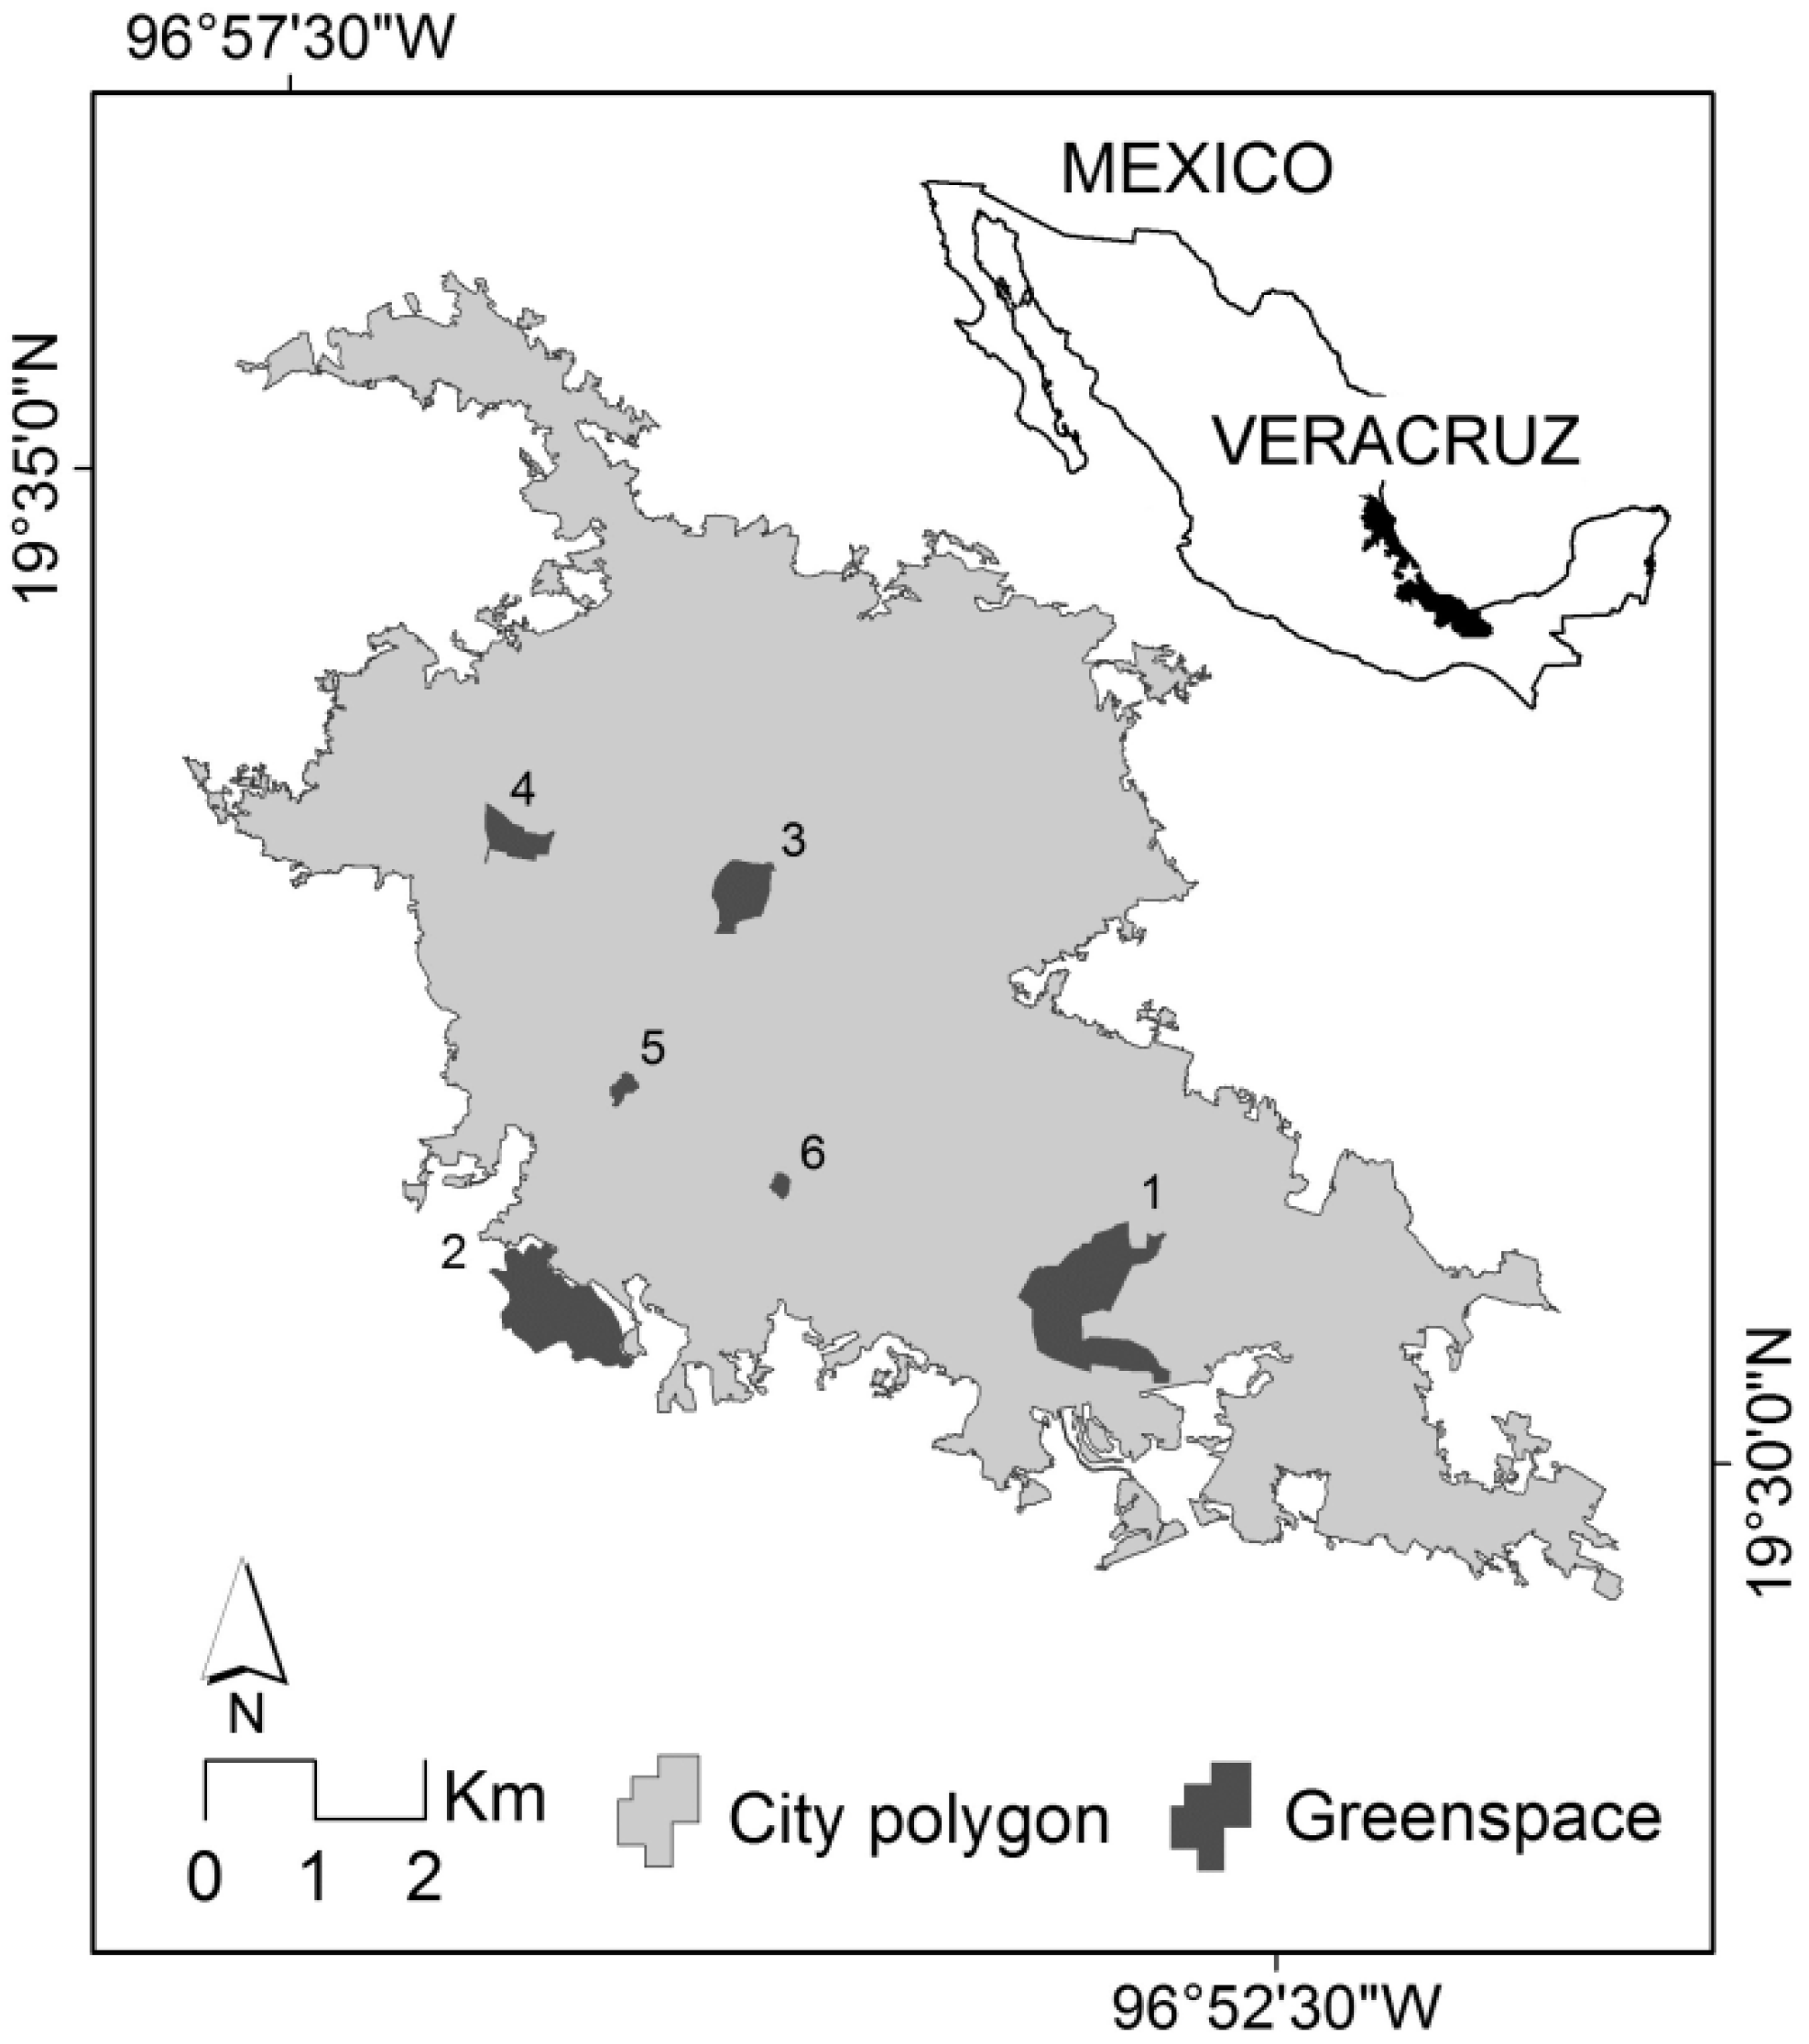
2.1. Study Area

We conducted this study in the city of Xalapa-Enríquez (referred to hereafter as Xalapa), state capital of Veracruz de Ignacio de la Llave. Xalapa is located on the hillside of the easternmost Trans-Mexican Volcanic Axis, where Neartic and Neotropic biotas meet (19°32′2″ N, 96°55′8″ W, rainfall: 1100–1600 mm/year; elevation: 1100–1560 m above sea level). Xalapa is a small- to medium-size city, the urban continuum of which includes four municipalities (~64 km2; [23]), and houses ~600,000 inhabitants [24]. Historically, predominant vegetation surrounding Xalapa included cloud forests in its central-southwestern section, tropical dry forests in its central-southeastern section, and temperate forests in the northern section [21]. Currently, the landscape in which Xalapa is embedded shows the urban land cover to be the most representative (49%), followed by agriculture (37%), grassland (9%), and “forested” areas (5%) [24]. Within its limits, Xalapa has a significant amount of woody vegetation cover, basically comprised by parks, urban forests, private gardens, and vacant lots [25]. In fact, Xalapa has been considered a green city, making it a unique setting for urban ecological studies [21].

2.2. Urban Greenspaces

We surveyed six urban greenspaces in the central and southern parts of the city of Xalapa (Figure 1), two of them peri-urban, with low management and moderate visitor rates (i.e., Parque Natura, Santuario del Bosque de Niebla); the other three are intra-urban with moderately high management and human activities (i.e., Parque Ecológico Macuiltépetl, Parque Miguel Hidalgo, Parque de Los Tecajetes), and one is intra-urban without active management (i.e., Parque Ecológico Molinos de San Roque; Figure 1).
Parque Natura (referred to hereafter as Natura; 95.5 ha; ~1300 m a.s.l.) is the largest urban greenspace of the city and part of its most extensive vegetation patch together with other greenspaces (e.g., El Tejar-Garnica). It is a State Natural Protected Area located in the southeastern end of the city. Predominant vegetation is represented by second-growth heavily-disturbed cloud-forest elements with an important calid influence, as well as the presence of post-disturbance colonizing deciduous species. Management and human activities are restricted to certain roads and recreational areas.
Santuario del Bosque de Niebla (referred to hereafter as Santuario; 76.8 ha; ~1340 m a.s.l.) is also a State Natural Protected Area (managed by INECOL) located in the southwestern section of the city, where dominant vegetation is second-growth cloud forest. This Natural Protected Area adjoins some urban settlements, forest remnants, and shade-grown coffee plantations. Management is limited to a gravel path and small trails for visitors.
Parque Ecológico Macuiltépetl (referred to hereafter as Macuiltépetl; 26.5 ha; ~1560 m a.s.l.) is also a State Natural Protected Area located near the geographic centroid of Xalapa. Vegetation in this inactive volcano includes second-growth cloud forests, although exotic ornamental species are well represented in the park. Management activities include gardening along main trails and specific areas, tree removal and pruning, as well as the maintenance of a paved road; human activities are considerable and include jogging, picnicking, group activities (e.g., dancing, martial arts), among others, that peak during weekends.
Parque Ecológico Molinos de San Roque (referred to as San Roque; 17.6 ha; ~1450 m a.s.l.) is also a State Natural Protected Area located in the northwest end of the city, mostly covered with second-growth cloud forest; firewood extraction is a common but illegal practice. Management is absent and human activities are low, with police patrolling along the trails due to increased insecurity.
Parque de Los Tecajetes (referred to hereafter as Tecajetes; 4.6 ha; ~1410 m a.s.l.) is a recreational greenspace near downtown Xalapa. It is characterized by a steep terrain and a perennial spring that supplies water to multiple fountains and fish tanks. Dominant tree species are Platanus mexicana and Liquidambar styraciflua; understory is scarce in half of the park but in the steeper areas understory resembles that of an old second-growth forest. Management includes intense gardening and landscaping. Human activities include sports (e.g., basketball, football, skating), picniking, and visiting on a regular basis.
Parque Miguel Hidalgo (referred to hereafter as Berros; 3.2 ha; ~1370 m a.s.l.) is a small recreational greenspace located southwest in downtown Xalapa with important ornamental value. Although most present tree species are planted, both native and exotic to Central Veracruz, the two dominant tree species are Platanus mexicana and Liquidambar styraciflua. Human activities are high throughout the week, including jogging, bicycling, skating, and even pony-back riding on weekends.

2.3. Sampling Methods

From June to November 2014, we sampled vascular plants, fungi (Ascomycetes and Basidiomycetes), ants, grasshoppers, copro-necrophagous beetles, butterflies, amphibians, birds, and bats in the six aforementioned greenspaces of Xalapa (Figure 1).
Plants: We sampled vegetation in the six greenspaces between July and October. We set five 10 m2 plots (1 m × 10 m) per site which represented the variety of plant condition at each greenspace, which were dominated by shrubs (woody vegetation up to 3 m with various stems) and herb species (non-woody vegetation). For all species found in each quadrant, we obtained herbarium specimens following Lot and Chiang [26]. After species identification, we deposited specimens in the XAL herbarium.
Fungi: Ascomycetes (sac fungi): We delimited one quadrant of 10 m × 20 m (200 m2) per greenspace that was visited three times between August and September to carry out random opportunistic paths, as recommended by Mueller et al. [27]. We collected sac fungi from fallen branches and trunks with the help of a hand lens [28,29]. We analyzed blade cuts made on the sporecarps and measured the asci and ascospores on a compound microscope. We dehydrated and labeled all specimens for further deposition in the fungi collection of the XAL herbarium. Basidiomycetes: We performed weekly opportunistic surveys for fructifications [27,30] of basidiomycetous macrofungi, focusing on Agaricales, Russulales, and Boletales. We performed collects with the same sample effort at each greenspace between May and October. We recorded and analyzed specimens macro- and microscopically [31,32,33]. For both fungi groups (i.e., sac, basidyomicetous), specialized literature was the basis for the taxonomic treatment of species [34,35,36,37].
Ants: We visited all sites between July and October. We outlined two perpendicular transects randomly at each park separated at least 200 m, with 10 sampling locations every 10 m (n = 20) and where bait bond papers (10 m × 10 cm), one with tuna fish and a second one with bee honey as attractants. We collected all individuals attracted by baited papers after one hour [38]. Additionally, we complemented our sampling by searching for foraging ants in the area (e.g., soil, vegetation) for 10 min per sampling site. Following capture, we identified all individuals with the aid of specialized keys [39,40] before final deposition in the entomological collection of the Instituto de Ecologia, Xalapa (IEXA).
Grasshoppers: We performed direct air net collection on four transects (36–40 m long × 1 m wide), in 12 sampling points per greenspace between July and September. Total travel time was ~10 min per sampling point [41,42].
Copro-necrophagous beetles: We sampled copro-necrophagous beetles at each greenspace in July and August. We used pitfall traps baited with decaying squid and human feces, using propylen-glycol as preserver; a modified version of the NecroTrap 80 (NTP-80) [43,44]. We set three traps with each bait type, separated at least 15 m apart from each other, across equivalent areas at each greenspace. We left the traps in site for three weeks and returned the collected material to the lab. We identified all collected individuals with specialized literature [44,45,46] and deposited them in the IEXA entomological collection.
Butterflies: We surveyed diurnal butterflies (Lepidoptera: Papilionoidea) in September and October, between 9 a.m. and 4 p.m. when environmental conditions were adequate (i.e., no rainfall, environmental temperature was ≥20 °C [47]). We recorded all individuals seen or caught during a four-hour intensive search per greenspace. Following capture, we identified most individuals in the field with the aid of specialized local field guides [48,49]. We collected the unidentified specimens and deposited them in the IEXA entomological collection after their identification.
Amphibians: We sampled amphibians between September and November using a time-constraint technique [50]. Each greenspace was sampled once at nighttime between 8 p.m. to 1 a.m. for three hours by four well-trained field technicians (12 h/greenspace, 72 total h/person). We identified all individuals to species level and released them at the site of capture.
Birds: We surveyed landbirds during June at each greenspace using 25 m radius point counts (from 7 a.m. to 10 a.m., 5 min [51]). We performed 10 point-count repetitions at each greenspace and considered all birds seen or heard actively using the surveyed area in our analysis.
Bats: We surveyed aerial insectivorous bats in August by using ultrasound detection in 20 repetitions per greenspace [52]. We started our recordings 10 min after sunset in 5 min intervals. We digitized bat calls (250 kHz sampling rate, 8 bit) with an Ultramic 250kHz microphone (Dodotronic, Dodotronic di Ivano Pelicella, Castel Gandolfo, Italy). We inspected the recordings using sonographic software (BatSound Pro, Pettersson Elektronik AB, Uppsala, Sweden) and assigned calls to species by comparison with a reference collection of recordings obtained in the region. Finally, we quantified the “relative abundance” of bats as total number of bat detection instances or “passes” registered at each site [53].

2.4. Statistical Analysis

To allow multiple comparisons, we determined the statistical expectation of species richness (Sm) of every studied taxonomic group in all greenspaces using individual-based data calculation with the package iNEXT [54]. This software, allows the calculation of comparable, rarefied species richness values for multiple datasets by simultaneously extrapolating all samples up to two times their sampling effort, which avoids unstable results [55]. To establish statistical differences in species richness among greenspaces for each taxonomic group, we contrasted Sm 84% confidence intervals (CIs) and assumed statistical differences in non-overlapping intervals. We used 84% CIs as they precisely mimic 0.05 tests, as contrasting 95% ones can lead to uncertain interpretations (often resulting in Type II errors) when intervals overlap [56].
To assess taxonomic composition differences among greenspaces, we calculated βsim [57]. This index quantifies the relative magnitude of shared species in relation to the sample with less unique species, making it useful for samples with different species richness [58,59]. We calculated βsim using the vegan package in R [60] (formula in vegan: min(b,c)/(min(b,c)+a)) and generated matrices of taxonomic similarity among greenspaces for each studied group and represented it using average hierarchical clustering dendrograms using R [60]. In order to evaluate overall species contribution of each of the studied greenspaces to the total recorded diversity, we calculated the percentage of species pertaining to each studied taxonomic group recorded at each greenspace in relation to the overall recorded species for each group. We then computed a generalized linear model (GLM, family: Gaussian; transformation for percentages: arcsin x 2 /100) to assess differences in the proportional contribution by taxonomic group at each of the studied greenspaces. Finally, we calculated post hoc general linear hypothesis tests for paired statistical comparisons in R [60].

3. Results

3.1. Species Richness

Due to the low number of recorded species of grasshoppers (in Tecajetes and Berros), as well as copro-necrophagous beetles and amphibians in all six greenspaces, we were not able to calculate CIs. Regardless of the latter, we found three main species richness patterns from the taxonomic group perspective: (1) no differences among all six greenspaces (i.e., sac fungi, copro-necrophagous beetles, bats), (2) higher richness in large outermost greenspaces and lower richness in smaller ones (i.e., basidiomycetous fungi, grasshoppers, amphibians, birds), and (3) highest richness of ants in the smallest greenspace and lower richness in the rest of studied greenspaces, except Macuiltépetl. Regarding plants and butterflies, we found no clear patterns, with the former having high richness in Tecajetes and Natura—two contrastingly different greenspaces—and similar values in the remaining greenspaces, and the latter showing highest richness in Natura, lowest richness in San Roque, and intermediate values in the remaining greenspaces (Table 1). In sum, we recorded an overall increase of species richness in larger peri-urban greenspaces (i.e., Natura, Santuario), intermediate values in Macuiltépetl and Tecajetes, and the lowest values in San Roque and Berros.

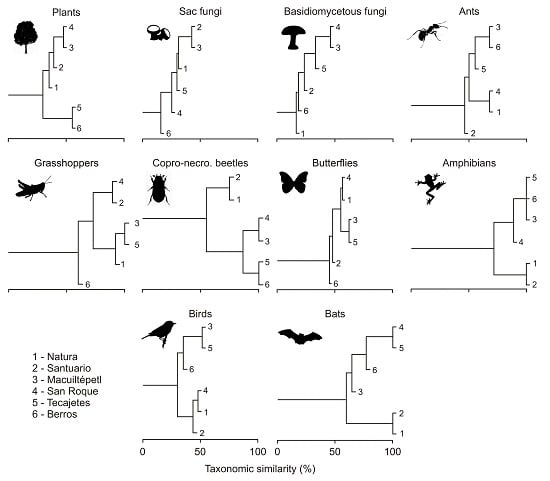
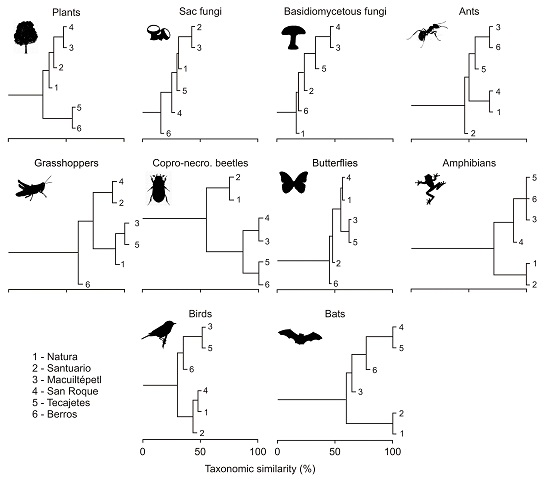
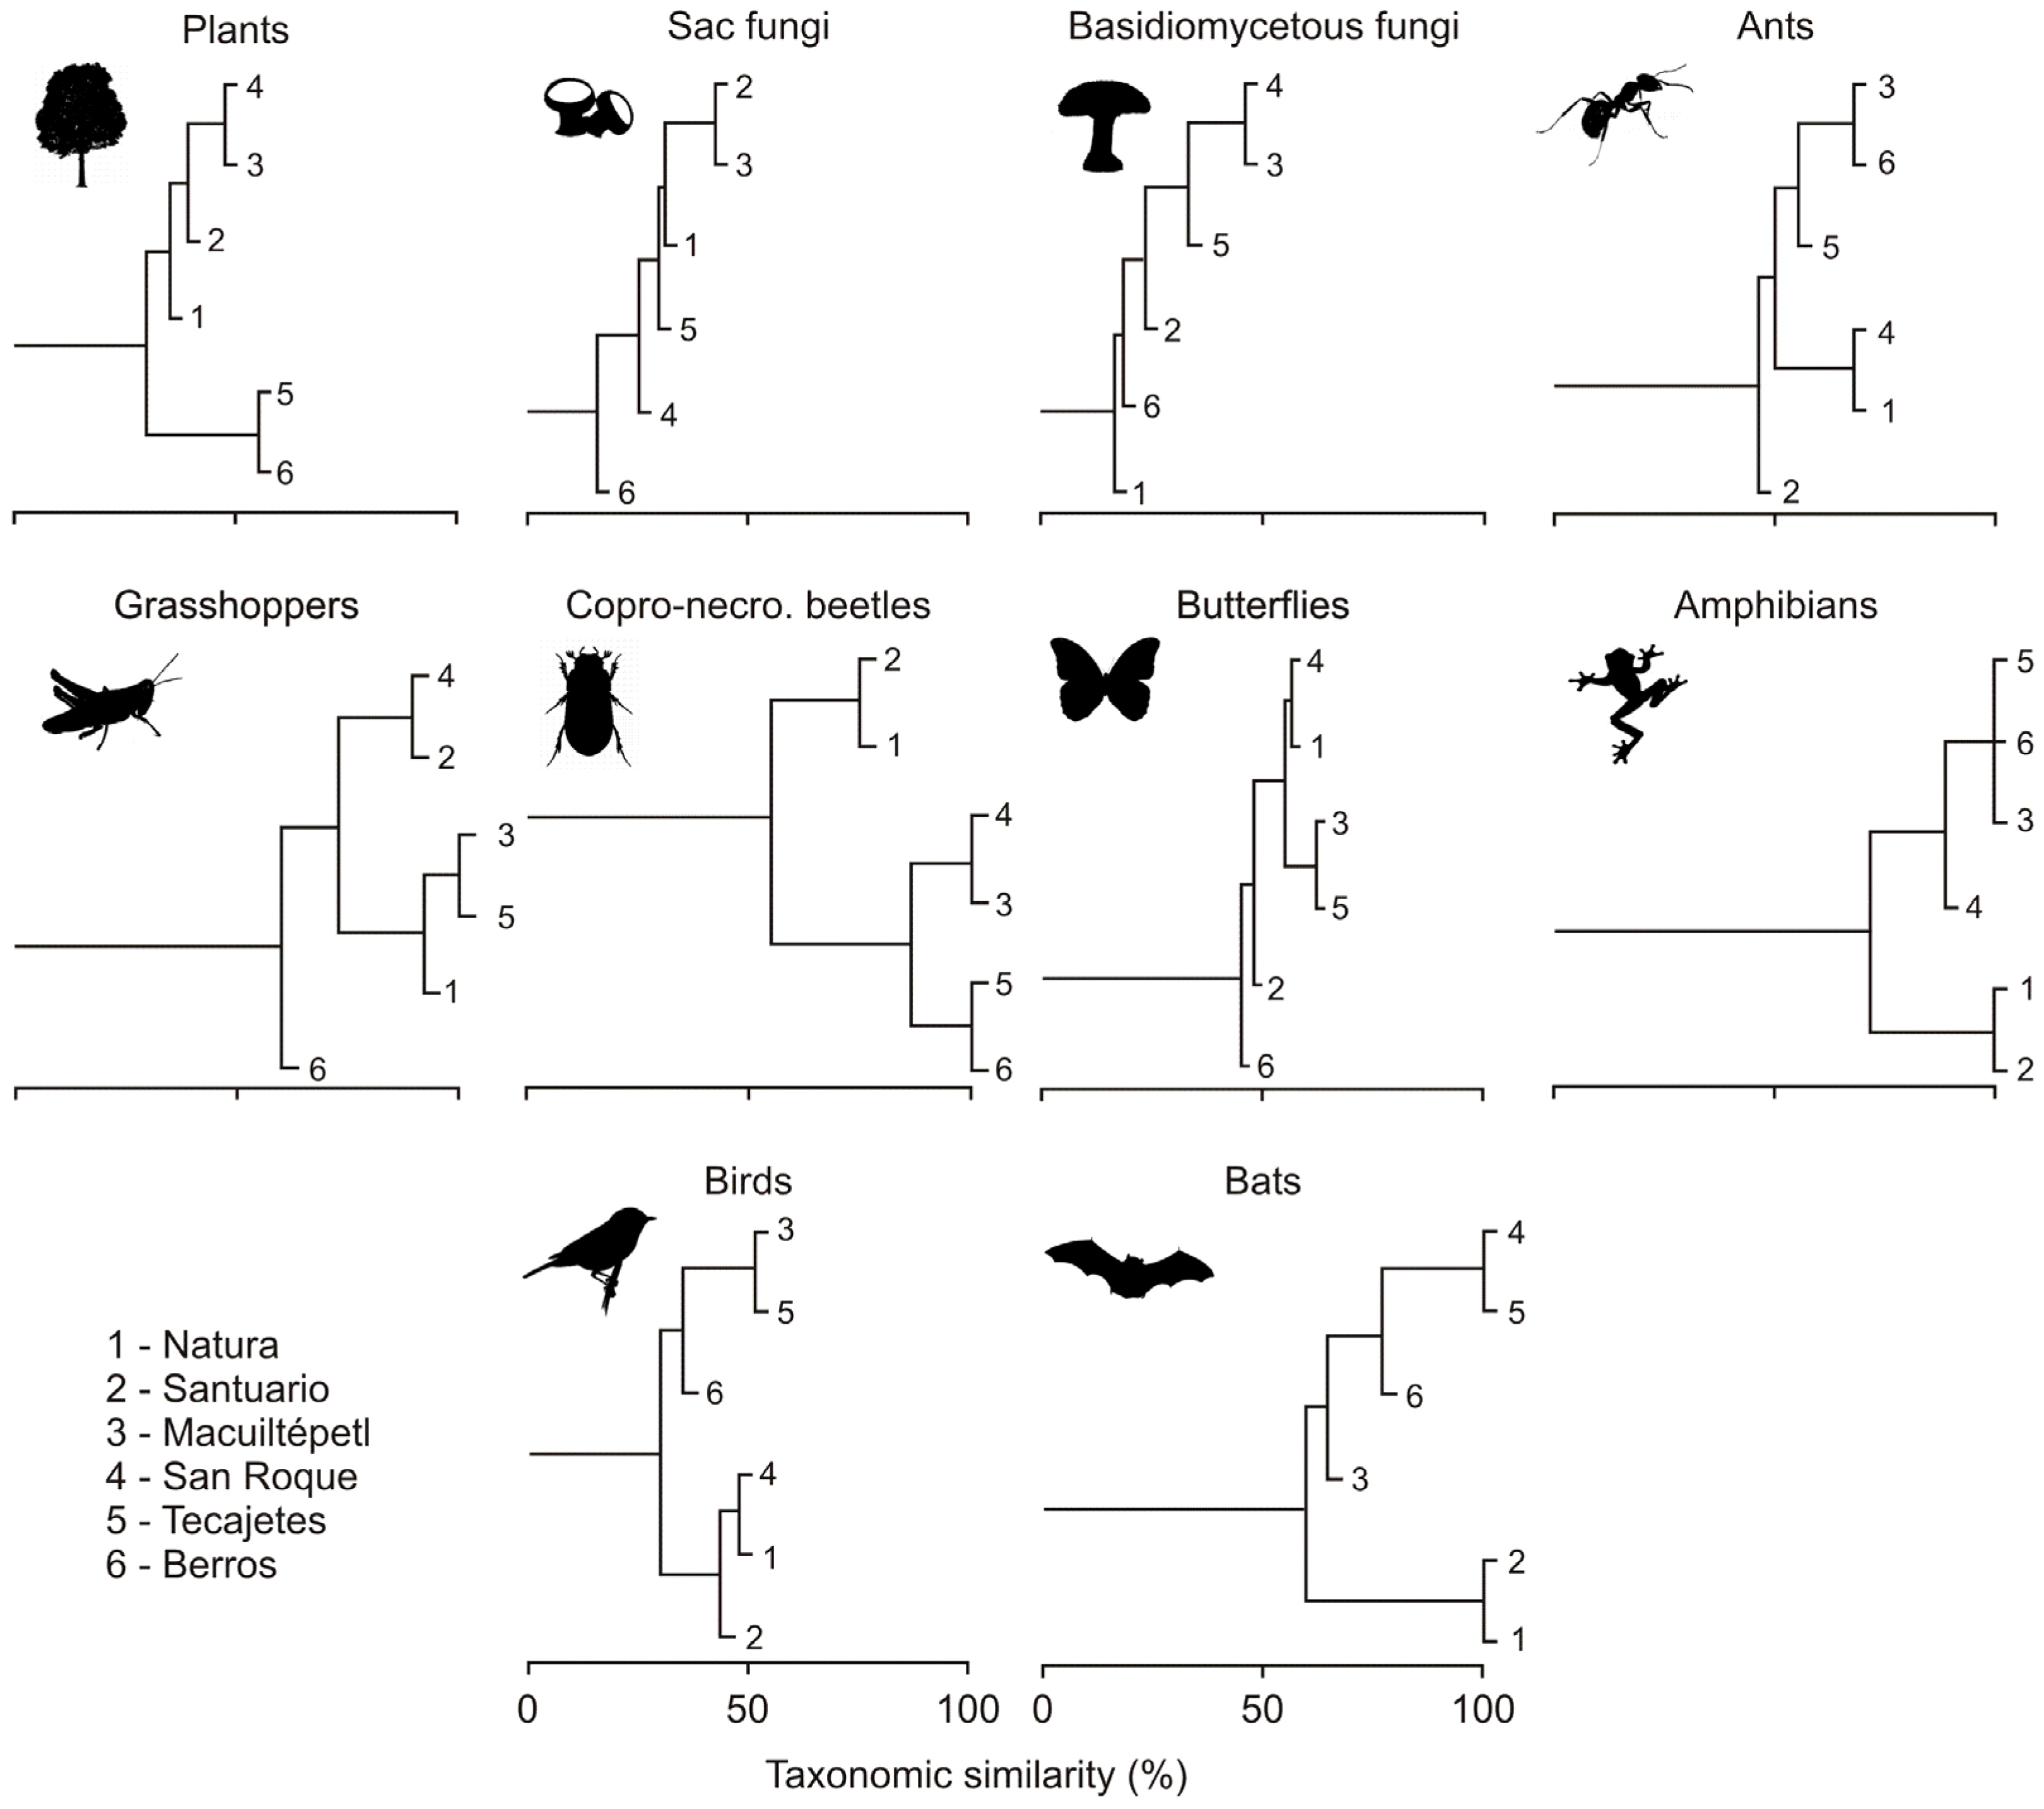
3.2. Composition Similarity

Taxonomic composition similarity, assessed using βsim matrices represented in clustering dendrograms, shows that the assemblage similarity of plants, basidiomycetous and sac fungi, and birds among greenspaces is less than half of the overall recorded species (<54%; Figure 2). Regarding assemblages with higher average assemblage similarities, four of the studied taxonomic groups responded either to size and location, as well as to management and human activities. We found three taxonomic groups with similarity values >75% (i.e., copro-necrophagous beetles, amphibians, bats), recorded in Natura and Santuario. Regarding management and human activities of the studied greenspaces, only one group (i.e., grasshoppers) responded to low management and human activities that occur in San Roque and Santuario, and two groups (i.e., copro-necrophagous beetles, amphibians) responded to the high degree of greenspace management and human activities in Berros and Tecajetes (Figure 2). It is noteworthy that the two remaining groups (i.e., ants, butterflies) that showed no clear pattern regarding the size, location, management, or human activities of the studied greenspaces did not show high average similarity clustering values (~45%–70% similarity).

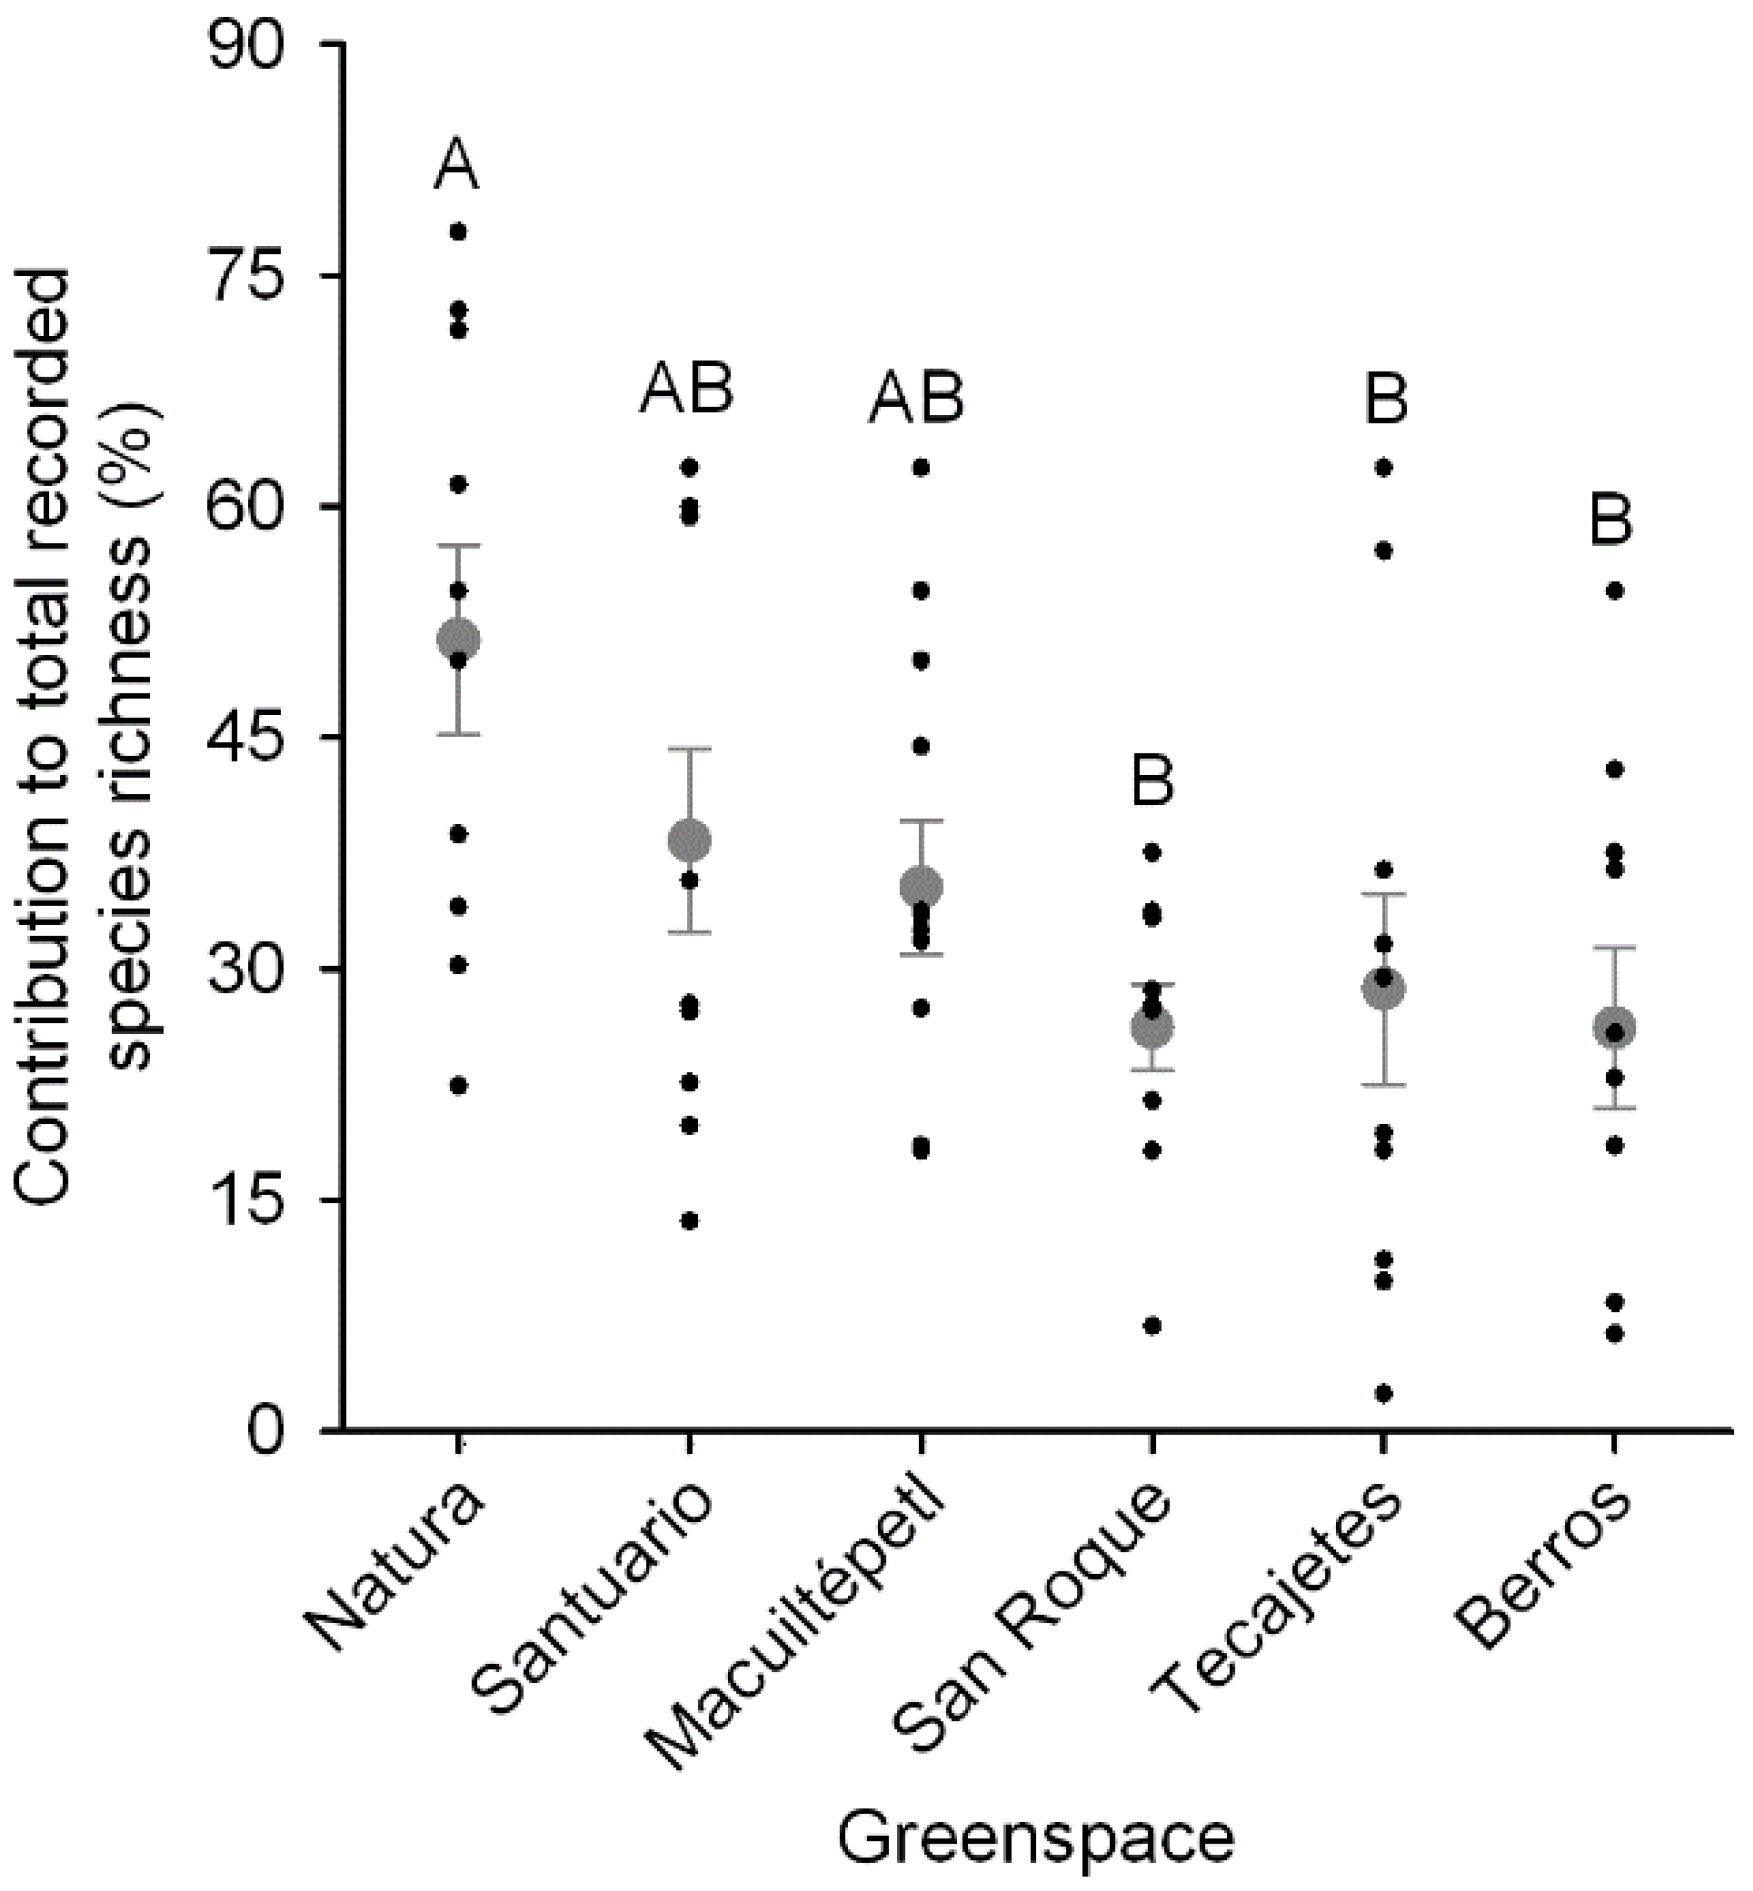
3.3. Greenspace Richness Contribution

Greenspace species richness contributions varied significantly among sites (GLM: F(5, 54) = 3.42, p = 0.009). Post-hoc general linear hypothesis tests show a significantly higher contribution of Natura when compared to Berros, San Roque, and Tecajetes (all p-values <0.016). However, no other statistical differences were recorded (all p-values >0.33), indicating that Santuario and Macuiltépetl have intermediate richness contributions in relation to the rest of studied greenspaces (Figure 3).

4. Discussion

Using multi-taxonomic approaches to assess biodiversity responses to urbanization will lead to a better understanding of the phenomenon [20,21,61]. Our multi-site and multi-taxonomic approach allowed us to unveil some interesting patterns within the complex scenario given by the greenness of Xalapa (as well as its location in the Mexican Transition Zone), regarding the relationships between size, location, management, and human activities of urban greenspaces on 10 taxonomical groups. In general, our results show that overall species richness rises in peri-urban large greenspaces, with management and human activities driving the species richness and composition of some of the studied taxonomic groups. Nevertheless, given the nature and distribution of large-sized greenspaces in Xalapa, as well as the high insecurity in peri-urban small greenspaces, we could not have a balanced design. Thus, some of our results should be taken cautiously, particularly regarding the role of management and location.
Greenspaces with highest species richness values were the larger ones, both located in the peri-urban area of Xalapa (i.e., Natura, Santuario). As seen in other studies, large, peri-urban greenspaces mitigate the negative role of urbanized areas (e.g., habitat disruption, reduced resource availability), potentially favoring species richness for certain taxa [9,62,63]. This suggests that larger areas that are connected with the non-urban matrix can offer an important array of resources. Thus, by providing supplementary or complementary resources that may compensate for limited resource availability in greenspaces, they could allow the influx of individuals from the non-urban matrix, and enable the temporal establishment of populations of species of moderate sensibility to urbanization [64,65,66]. It is noteworthy to state that both Natura and Santuario have native ecosystem remnants and/or elements, which could be also driving our species richness results. Regarding the species richness of the intra-urban medium- to small-sized greenspaces, management and human activities seemed to play a more important role than size for some taxa, highlighting the importance of multi-taxonomic studies. For instance, San Roque, a medium-sized greenspace with low management and human activities had less richness for most groups that showed statistical differences among greenspaces (except sac fungi and birds), similar to that of smaller greenspaces with higher management and human activities (i.e., Tecajetes, Berros).
From a taxonomic group perspective, our species richness results show that there are assemblages with: (1) highest richness values in large greenspaces with low management and human activities and lowest values in small, heavily managed and visited greenspaces (i.e., basidiomycetous fungi, grasshoppers, amphibians, birds), (2) highest richness in the smallest heavily managed and visited greenspaces (i.e., ants), (3) no differences among the studied greenspaces (i.e., sac fungi, copro-necrophagous beetles), (4) mild differences (i.e., bats), and (5) inconsistent patterns (i.e., butterflies, plants). This shows how the species richness of some of the studied groups can be used as indicator groups for different scenarios if the requirements to be considered as bioindicators are met [67]. It is noticeable that inconsistent patterns for plant richness could be related to the nature of urban vegetation in the greenspaces of Xalapa, many of which are planted and exotic, which in turn could be affecting the butterfly and other groups’ responses [68,69,70].
Setting our species richness results into context, assemblage composition similarity results revealed that some groups, such as plants, birds, basidiomycetous, and sac fungi, in the six studied greenspaces show a <54% similarity across the six studied greenspaces. As recorded in a previous multi-taxonomic study performed in Xalapa contrasting heavily versus lightly urbanized areas, fungi are, in general, site-specific [21]. Both studied fungi groups showed a nested pattern, highly differing in the ordering of greenspaces, which could be given as a response to habitat disruption [71,72]. However, our fungi results do not consider all active dormant mycelia [73], which is a reason why they should be interpreted cautiously. Plant assemblage composition in urban greenspaces responded primarily to the presence of native ecosystem remnants, with a mixture of Nearctic-Netropical elements, and also to the presence of planted species, making plant assemblages site-specific, responding to human decision-making [74]. The case for birds is quite interesting; their similarity values are intermediate and show a clear pattern, with two clusters: (1) Natura, Santuario, San Roque and (2) Macuiltépetl, Tecajetes, Berros. The first cluster represents the two largest peri-urban studied greenspaces, while San Roque is the intra-urban greenspace that has less management and human activities and includes cloud forest vegetation components. The second group includes more managed and visited intra-urban greenspaces. This shows that, although different bird assemblages are being sheltered in the studied greenspaces, size and location can be overridden by site-specific variables, as previously suggested by Evans et al. [75].
Assemblage composition similarity dendrograms for grasshoppers, ants, copro-necrophagous beetles, amphibians, and bats showed high average similarity values among the studied greenspaces (>75%), with many greenspace assemblages showing 100% shared species (i.e., copro-necrophagous beetles, amphibians, bats). This result could be given by the low species richness recorded in the studied greenspaces (average of about three to nine species per greenspace), which could be a result of the semi-permeable filtering of species from the non-urban matrix [9,65]. This was particularly true for copro-necrophagous beetles, amphibians, and bats, with contrastingly different assemblages in large peri-urban greenspaces. Also, management and human activities showed to play an important role in molding grasshoppers, copro-necrophagous beetles, and amphibians. In this sense, we recorded highly similar assemblages in Santuario and San Roque, two greenspaces with contrasting sizes and location, making them potential bioindicators of contrasting greenspace management and human activities, especially low ones. This agrees with previous studies that have shown grasshopper diversity to shift with habitat traits and management, mainly with those that mold their herbivorous diet [76,77]. In the case of copro-necrophagous beetles and amphibians, results are driven by the nestedness of three copro-necrophagous species in Berros also present in Tecajetes, and of one amphibian species recorded in Tecajetes and shared with Berros. It its noteworthy that we did not find any composition pattern for butterflies, suggesting that their assemblages are driven by variables that were not measured in this study (e.g., resource availability).
Finally, our greenspace richness contribution results show that, as Hostetler et al. [78] and Beninde et al. [79] highlight, creating green infrastructure, which increases connectivity, is only the first step in conserving urban biodiversity. As supported by our species richness results, Natura, the largest peri-urban greenspace, is the greenspace with the highest contribution, regardless of being, by comparison, the peri-urban greenspace with greater management and human activities. Interestingly, Santuario and Macuiltépetl, two contrastingly different greenspaces in terms of size, location, management, and human activities, contributed similarly in sheltering overall recorded species richness. It is surprising that Macuiltépetl, a small-sized inactive volcano (26.5 ha) located near the centroid of the city, can shelter similar biodiversity when compared to a lightly managed peri-urban greenspace, highlighting the importance of this unique site (as recorded previously [80,81]). Besides Macuiltépetl, the rest of studied intra-urban greenspaces sheltered significantly less overall species in average, as would be expected due to the isolation effects of urbanization [82]. Interestingly, Tecajetes sheltered a high proportion of copro-necrophagous beetles (62.5%) and bats (57.1%), while we recorded 54% of the total ant species in Berros. This underlines the value of small greenspaces for certain groups that benefit from managed, disturbed, and open areas, where resources are more abundant for them [83,84,85]. It is noticeable that among Berros, Tecajates, and San Roque (the three smallest intra-urban greenspaces), the latter was the one with lowest values for most studied taxonomic groups, noticing that although this is a lightly managed and unvisited greenspace with cloud forest elements, its contribution to local biodiversity is relatively low. Since our study design keeps us from separating the effects of management, human activities, and location, we hypothesize that these differences could be given by the biases of sampling some sites in highly heterogeneous urban greenspaces; however, further studies are needed to untangle this counterintuitive finding.
Many aspects of the biology and ecology of the studied taxonomic groups—which are most probably driving our results—are understudied, even more so within tropical and subtropical urban systems [21]. Although there is a rising interest among ecologists to study urban systems in developing countries, the current dearth of knowledge leaves us incipient evidence-based foundations to propose and/or demand different urban settlement, management, and planning strategies and practices [86]. Undoubtedly, the more we understand wildlife communities within complex urban areas, together with other physical and social components, the closer we will be to balancing the quality of human life quality and our detrimental effects on biodiversity and human welfare [87,88,89,90].

Acknowledgments

We are most thankful to Angelina Ruiz-Sánchez for her useful comments that enhanced the clarity and quality of our paper, as well as Jorge Valenzuela for his support in ant identification, Ina Falfán and Julian Avila-Campos for drawing figures, Ángeles Arenas Cruz for her support in amphibian surveys, and Cara Joos for proofreading the manuscript. Research seed funds were granted to Ian MacGregor-Fors and Federico Escobar through the “Proyectos de Investigación de Alto Valor Estratégico para la Sociedad” of the Dirección General del Instituto de Ecología, A.C. (project: “Patrones ecológicos y percepción social de la diversidad biológica que habita en la ciudad de Xalapa: Un enfoque multidisciplinario”).

Author Contributions

I.M.-F. and F.E. conceived the experimental design; I.M.-F., F.E., S.A.-R., M.L.B., V.M.B., S.C.-Z., A.G.-S., F.G.-G., F.L.H., E.M.O., L.M., E.P., L.R.-R., E.R.-G., E.U.-B. performed field work; I.M.-F., R.R.-H., and F.E. analyzed the data; I.M.-F., R.R.-H., and F.E. led the writing of the paper.

Conflicts of Interest

The authors declare no conflict of interest. The founding sponsors had no role in the design of the study; in the collection, analyses, or interpretation of data; in the writing of the manuscript, and in the decision to publish the results.

References

  1. Grimm, N.B.; Faeth, S.H.; Golubiewski, N.E.; Redman, C.L.; Wu, J.; Bai, X.; Brigs, J.M. Global change and the ecology of cities. Science 2008, 319, 756–760. [Google Scholar] [CrossRef] [PubMed]
  2. Montgomery, M.R. The urban transformation of the developing world. Science 2008, 319, 761–764. [Google Scholar] [CrossRef] [PubMed]
  3. United Nations, Department of Economic and Social Affairs, Population Division. World Urbanization Prospects: The 2014 Revision; United Nations: New York, NY, USA, 2015. [Google Scholar]
  4. Czech, B.; Krausman, P.R. Distribution and causation of species endangerment in the United States. Science 1997, 277, 1116–1117. [Google Scholar] [CrossRef]
  5. Czech, B.; Krausman, P.R.; Devers, P.K. Economic associations among causes of species endangerment in the United States. Bioscience 2001, 50, 593–601. [Google Scholar] [CrossRef] [Green Version]
  6. Pickett, S.T.; Cadenasso, M.L.; Grobe, J.M.; Nilon, C.H.; Pouyat, R.B.; Zipperer, W.C.; Costanza, R. Urban ecological systems: Scientific foundations and a decade of progress. J. Environ. Manag. 2011, 92, 331–362. [Google Scholar] [CrossRef] [PubMed]
  7. McKinney, M.L. Urbanization, biodiversity, and conservation. Bioscience 2002, 52, 883–890. [Google Scholar] [CrossRef]
  8. McKinney, M.L. Urbanization as a major cause of biotic homogenization. Biol. Conserv. 2006, 127, 247–260. [Google Scholar] [CrossRef]
  9. McKinney, M.L. Effects of urbanisation on species richness: A review of plants and animals. Urban Ecosyst. 2008, 11, 161–176. [Google Scholar] [CrossRef]
  10. Radeloff, V.C.; Hammer, R.B.; Stewart, S.I.; Fried, J.S.; Holcomb, S.S.; McKeefry, J.F. The wildland-urban interface in the United States. Ecol. Appl. 2005, 15, 799–805. [Google Scholar] [CrossRef]
  11. Lawson, D.M.; Lamar, C.K.; Schwartz, M.W. Quantifying plant population persistence in human-dominated landscapes. Conserv. Biol. 2008, 22, 922–928. [Google Scholar] [CrossRef] [PubMed]
  12. Hahs, A.K.; McDonnell, M.J.; McCarthy, M.A.; Vesk, P.A.; Corlett, R.T.; Norton, B.A.; Clemants, S.E.; Duncan, R.P.; Thompson, K.; Schwarts, M.W.; et al. A global synthesis of plant extinction rates in urban areas. Ecol. Lett. 2009, 12, 1165–1173. [Google Scholar] [CrossRef] [PubMed]
  13. MacGregor-Fors, I.; Morales-Pérez, L.; Schondube, J.E. Does size really matter? Species-area relationships in human settlements. Divers. Distrib. 2011, 17, 112–121. [Google Scholar] [CrossRef]
  14. Bazzaz, F.A. Plant species diversity in old-field successional ecosystems in southern Illinois. Ecol. Durham 1975, 56, 485–488. [Google Scholar] [CrossRef]
  15. Hobbs, E.R. Species richness of urban forest patches and implications for urban landscape diversity. Landsc. Ecol. 1988, 1, 141–152. [Google Scholar] [CrossRef]
  16. Ortega-Álvarez, R.; MacGregor-Fors, I. Living in the big city: Effects of urban land-use on bird community structure, diversity, and composition. Landsc. Urban Plan. 2009, 90, 189–195. [Google Scholar] [CrossRef]
  17. Nielse, A.B.; van den Bosch, M.; Maruthaveeran, S.; van den Bosch, C.K. Species richness in urban parks and its drivers: A review of empirical evidence. Urban Ecosyst. 2014, 14, 305–327. [Google Scholar] [CrossRef]
  18. Myers, N.; Mittermeier, R.A.; Mittermeier, C.G.; da Fonseca, G.A.; Kent, J. Biodiversity hotspots for conservation priorities. Nature 2000, 403, 853–858. [Google Scholar] [CrossRef] [PubMed]
  19. Marzluff, J.M.; Bowman, J.M.; Donnelly, R.E. A historical perspective on urban bird research: Trends, terms, and approaches. In Avian Ecology and Conservation in an Urbanizing World; Marzluff, J.M., Bowman, J.M., Donnelly, R.E., Eds.; Springer: Berlin, Germany, 2001; pp. 1–17. [Google Scholar]
  20. Sattler, T.; Pezzatti, G.B.; Nobis, M.P.; Obrist, M.K.; Roth, T.; Moretti, M. Selection of multiple umbrella species for functional and taxonomic diversity to represent urban biodiversity. Conserv. Biol. 2014, 28, 414–426. [Google Scholar] [CrossRef] [PubMed]
  21. MacGregor-Fors, I.; Avendaño-Reyes, S.; Bandala, V.M.; Chacón-Zapata, S.; Díaz-Toribio, M.H.; González-García, F.; Lorea-Hernández, F.; Martínez-Gómez, J.; Montes de Oca, E.; Montoya, L.; et al. Multi-taxonomic diversity patterns in a neotropical green city: A rapid biological assessment. Urban Ecosyst. 2015, 18, 633–647. [Google Scholar] [CrossRef]
  22. Fontana, S.; Sattler, T.; Bontadina, F.; Moretti, M. How to manage the urban green to improve bird diversity and community structure. Landsc. Urban Plan. 2011, 101, 278–285. [Google Scholar] [CrossRef]
  23. Avila-Campos, J.; Instituto de Ecología, A.C. Personal observation. 2016. [Google Scholar]
  24. Instituto Nacional de Estadística, Geografía e Informática (INEGI). Censo Nacional de Población y Vivienda 2010; INEGI: Aguascalientes, Mexico, 2010. [Google Scholar]
  25. Lemoine Rodríguez, R. Cambios en la Cobertura Vegetal de la Ciudad de Xalapa-Enríquez, Veracruz y Zonas Circundantes Entre 1950 y 2010. Master’s Thesis, Universidad Veracruzana, Xalapa, Mexico, 31 October 2012. [Google Scholar]
  26. Lot, A.; Chiang, F. Manual de Herbario; Consejo Nacional de la Flora de Mexico: Mexico City, Mexico, 1986. [Google Scholar]
  27. Mueller, G.M.; Bills, G.F.; Foster, S.M. Biodiversity of Fungi: Inventory and Monitoring Methods; Elsevier Academic Press: San Diego, CA, USA, 2004. [Google Scholar]
  28. Dennis, R.W.G. British Ascomycetes; J. Cramer: Vaduz, Liechtenstein, 1978. [Google Scholar]
  29. Breitenbach, J.; Kränzlin, F. Fungi of Switzerland. Vol. 1. Ascomycetes; VerlagMykologia: Lucerne, Switzerland, 1984. [Google Scholar]
  30. O’Dell, T.E.; Lodge, D.J.; Mueller, G.M. Approaches to Sampling Macrofungi. In Biodiversity of Fungi—An Inventory and Monitoring Methods; Elsevier Academic Press: San Diego, CA, USA, 2004. [Google Scholar]
  31. Largent, D. How to Identify Mushrooms to Genus I—Macroscopic Features; Mad River Press: Eureka, CA, USA, 1973. [Google Scholar]
  32. Largent, D.; Johnson, D.; Watling, R. How to Identify Mushrooms to Genus III—Microscopic Features; Mad River Press: Eureka, CA, USA, 1977. [Google Scholar]
  33. Lodge, J.D.; Ammirati, J.F.; O’Dell, T.E.; Mueller, G.M. Collecting and Describing Macrofungi. In Biodiversity of Fungi—An Inventory and Monitoring Methods; Elsevier Academic Press: San Diego, CA, USA, 2004. [Google Scholar]
  34. Moser, M. Keys to Agarics and Boleti; Roger Phillips: London, UK, 1983. [Google Scholar]
  35. Pegler, D.N. Agaric flora of the Lesser Antilles; HMSO: London, UK, 1983. [Google Scholar]
  36. Bessette, A.E.; Bessette, A.R.; Fischer, S.W. Mushrooms of Northeastern North America; Syracuse University Press: Syracuse, NY, USA, 1977. [Google Scholar]
  37. Horak, E. Röhrlinge und Blätterpilze in Europa; Elsevier Spektrum Akademischer Verlag: Heidelberg, Germany, 2005. [Google Scholar]
  38. Bestelmeyer, B.T.; Agosti, D.; Alonso, L.E.; Brandao, C.R.F.; Brown, W.L.; Delabie, J.H.C.; Silvestre, R. Field techniques for the study of ground-dwelling ants: An overview, description, and evaluation. In Ants—Standard Methods for Measuring and Monitoring Biodiversity; Agosti, D., Majer, J.D., Alonso, L.E., Shultz, T.R., Eds.; Smithsonian Institution Press: Washington, DC, USA, 2000; pp. 122–144. [Google Scholar]
  39. MacKay, W.P.; MacKay, E.A. Guide to the species identification of the New World ants. Sociobiology 1989, 16, 3–47. [Google Scholar]
  40. Bolton, B. Identification Guide to the Ant Genera of the World; Harvard University Press: Cambridge, MA, USA, 1994. [Google Scholar]
  41. Southwood, T.R.E. Ecological Methods with Particular Reference to the Study of Insect Populations; Springer: London, UK, 1978. [Google Scholar]
  42. Rivera-Garcia, E. Factores que Determinan la Estructura de las Comunidades de Chapulines (Orthoptera: Acridoidea) en el Desierto Chihuahuense. Ph.D. Thesis, Facultad de Ciencias, UNAM, Mexico City, Mexico, 18 January 2009. [Google Scholar]
  43. Borror, D.J.; Tripplehorn, C.A.; Johnson, N.F. An Introduction to the Study of Insects; Saunders College Publishing: Philadelphia, PA, USA, 2009. [Google Scholar]
  44. Morón, M.A.; Terrón, R.A. Entomología Práctica; Instituto de Ecología, A.C.: Mexico City, Mexico, 1988. [Google Scholar]
  45. Arnett, R.H.; Thomas, M.C. American Beetles, Volume I: Archostemata, Myxophaga, Adephaga, Polyphaga, Staphyliniformia; CRC Press: Boca Raton, FL, USA, 2001. [Google Scholar]
  46. Arnett, R.H.; Thomas, M.C.; Skelley, P.E.; Frank, J.H. American Beetles, Volume II: Polyphaga: Scarabaeoidea through Curculionoidea; CRC Press: Boca Raton, FL, USA, 2002. [Google Scholar]
  47. Pollard, E.; Yates, T.J. Monitoring Butterflies for Ecology and Conservation; Chapman and Hall: London, UK, 1993. [Google Scholar]
  48. Glassberg, J.A. Swift Guide to the Butterflies of Mexico and Central America; Sunstreak: Morristown, NJ, USA, 2007. [Google Scholar]
  49. Hernández Baz, F.; Llorente Bousquets, J.E.; Luis Martínez, A.; Vargas Fernández, I. Las Mariposas de Veracruz—Guía Ilustrada; Consejo Veracruzano de Investigación Ciencia y Desarrollo Tecnológico: Veracruz, Mexico, 2010. [Google Scholar]
  50. Heyer, R.; Donnelly, M.A.; Foster, M.; Mcdiarmid, R. Measuring and Monitoring Biological Diversity: Standard Methods for Amphibians; Smithsonian Institution: Washington, DC, USA, 2014. [Google Scholar]
  51. Ralph, C.J.; Droege, S.; Sauer, J.R. Managing and Monitoring Birds Using Point Counts: Standards and Applications; USDA: Albany, NY, USA, 1995. [Google Scholar]
  52. Ellison, L.E.; Everette, A.L.; Bogan, M.A. Examining patterns of bat activity in Bandelier National Monument, New Mexico, by using walking point transects. Southwest. Nat. 2005, 50, 197–208. [Google Scholar] [CrossRef]
  53. Fenton, M.B. Reporting: Essential information and analysis. In Bat Echolocation Research: Tools, Techniques and Analysis; Brigham, R.M., Kalko, E.K.V., Jones, G., Parsons, S., Limpens, H.J.A., Eds.; Bat Conservation International: Austin, TX, USA, 2004; pp. 133–140. [Google Scholar]
  54. Hsieh, T.C.; Ma, K.H.; Chao, A. iNEXT Online: Interpolation and Extrapolation (Version 1.0). Available online: https://chao.shinyapps.io/iNEXT (accessed on 27 October 2015).
  55. Colwell, R.K.; Chao, A.; Gotelli, N.J.; Lin, S.Y.; Mao, C.X.; Chazdon, R.L.; Longino, J.T. Models and estimators linking individual-based and sample-based rarefaction, extrapolation, and comparison of assemblages. J. Plant Ecol. 2012, 5, 3–21. [Google Scholar] [CrossRef]
  56. MacGregor-Fors, I.; Payton, M. Contrasting diversity values: Statistical inferences based on overlapping confidence intervals. PLoS ONE 2013, 8, e56794. [Google Scholar] [CrossRef]
  57. Lennon, J.J.; Koleff, P.; Greenwood, J.J.D.; Gaston, K.J. The geographical structure of British bird distri- butions: Diversity, spatial turnover and scale. J. Anim. Ecol. 2001, 70, 966–979. [Google Scholar] [CrossRef]
  58. Koleff, P.K.; Gaston, K.J.; Lennon, J.J. Measuring beta diversity for presence–absence data. J. Anim. Ecol. 2003, 72, 367–382. [Google Scholar] [CrossRef]
  59. Gaston, K.J.; Davies, R.G.; Orme, C.D.L.; Olson, V.A.; Thomas, G.H.; Ding, T.S.; Rasmussen, P.C.; Lennon, J.J.; Benneti, P.M.; Owens, I.P.F.; et al. Spatial turnover in the global avifauna. Proc. R. Soc. Lond. B Biol. 2007, 274, 1567–1574. [Google Scholar] [CrossRef] [PubMed]
  60. R Core Team. R: A Language and Environment for Statistical Computing; R Foundation for Statistical Computing: Vienna, Austria, 2015. [Google Scholar]
  61. Soykan, C.U.; Brand, L.A.; Ries, L.; Stromberg, J.C.; Hass, C.; Simmons, D.A.; Patterson, W.J.D.; Sabo, J.L. Multitaxonomic diversity patterns along a desert riparian–upland gradient. PLoS ONE 2012, 7, e28235. [Google Scholar] [CrossRef] [PubMed]
  62. Gavareski, C.A. Relation of park size and vegetation to urban bird populations in Seattle, Washington. Condor 1976, 78, 375–382. [Google Scholar] [CrossRef]
  63. Puga-Caballero, A.; MacGregor-Fors, I.; Ortega-Alvarez, R. Birds at the urban fringe: Avian community shifts in different peri-urban ecotones of a megacity. Ecol. Res. 2014, 29, 619–628. [Google Scholar] [CrossRef]
  64. Shwartz, A.; Shirley, S.; Kark, S. How do habitat variability and management regime shape the spatial heterogeneity of birds within a large Mediterranean urban park? Landsc. Urban Plan. 2008, 84, 219–229. [Google Scholar] [CrossRef]
  65. MacGregor-Fors, I. How to measure the urban-wildland ecotone: Redefining ‘peri-urban’ areas. Ecol. Res. 2010, 25, 883–887. [Google Scholar] [CrossRef]
  66. Fischer, J.D.; Schneider, S.C.; Ahler, A.A.; Miller, J.R. Categorizing wildlife responses to urbanization and conservation implications of terminology. Conserv. Biol. 2015, 29, 1246–1248. [Google Scholar] [CrossRef] [PubMed]
  67. Moreno, C.E.; Pineda, E.; Escobar, F.; Sánchez-Rojas, G. Shortcuts for biodiversity evaluation: A review of terminology and recommendations for the use of target groups, bioindicators and surrogates. Int. J. Environ. Heal. 2007, 1, 71–86. [Google Scholar] [CrossRef]
  68. Arias, H.P.F. Los Árboles de la Zona Urbana y Suburbana de Xalapa. Master’s Thesis, Universidad Veracruzana, Xalapa, Mexico, 1983. [Google Scholar]
  69. García-Campos, H.M. Las áreas verdes públicas de Xalapa. In Ecología Urbana Aplicada a la Ciudad de Xalapa; López-Moreno, I.R., Ed.; Instituto de Ecología, A.C., MAB UNESCO, H. Ayuntamiento de Xalapa: Xalapa, Mexico, 1993; pp. 99–132. [Google Scholar]
  70. Ruiz-Montiel, C.; Vázquez-Torres, V.; Martínez-Hernández, M.J.; Murrieta-Pérez, L.; Perez-Hernández, M.S. Árboles y arbustos registrados en el Parque Ecológico Molino de San Roque. Madera Bosques 2014, 20, 143–152. [Google Scholar]
  71. Martínez-Morales, M.A. Nested species assemblages as a tool to detect sensitivity to forest fragmentation: The case of cloud forest birds. Oikos 2005, 108, 634–642. [Google Scholar] [CrossRef]
  72. Ganzhorn, J.U.; Eisenbeiß, B. The concept of nested species assemblages and its utility for understanding effects of habitat fragmentation. Basic Appl. Ecol. 2001, 2, 87–99. [Google Scholar] [CrossRef]
  73. O’Dell, T.E.; Lodge, D.J.; Mueller, G.M. Approaches to sampling macrofungi. In Biodiversity of Fungi: Inventory and Monitoring Methods; Mueller, G.M., Bills, G.F., Foster, M.S., Eds.; Elsevier: San Diego, CA, USA, 2004. [Google Scholar]
  74. Konijnendijk, C.C. The Forest and the City—The Cultural Landscape of Urban Woodland; Springer: Berlin, Germany, 2008. [Google Scholar]
  75. Evans, K.L.; Newson, S.E.; Gaston, K.J. Habitat influences on urban avian assemblages. IBIS 2009, 151, 19–39. [Google Scholar] [CrossRef]
  76. Wettstein, W.; Schmid, B. Conservation of arthropod diversity in montane wetlands: Effect of altitude, habitat quality and habitat fragmentation on butterflies and grasshoppers. J. Appl. Ecol. 1999, 36, 363–373. [Google Scholar] [CrossRef]
  77. Nufio, C.R.; McClenahan, J.L.; Bowers, M.D. Grasshopper response to reductions in habitat area as mediated by subfamily classification and life history traits. J. Insect Conserv. 2011, 15, 409–419. [Google Scholar] [CrossRef]
  78. Hostetler, M.; Allen, W.; Meurk, C. Conserving urban biodiversity? Creating green infrastructure is only the first step. Landsc. Urban Plan. 2011, 100, 369–371. [Google Scholar] [CrossRef]
  79. Beninde, J.I.; Veith, M.; Hochkirch, A. Biodiversity in cities needs space: A meta-analysis of factors determining intra-urban biodiversity variation. Ecol. Lett. 2015, 18, 581–592. [Google Scholar] [CrossRef] [PubMed]
  80. Ruelas, I.E.; Aguilar Rodríguez, S.H. La avifauna urbana del Parque Ecológico Macuiltépetl en Xalapa, Veracruz, Mexico. Ornitol. Neotrop. 2010, 20, 87–103. [Google Scholar]
  81. González-García, F.; MacGregor-Fors, I.; Straub, R.; Lobato García, J.A. Birds of a neotropical green city: An up-to-date review of the avifauna of the city of Xalapa with additional unpublished records. Urban Ecosyst. 2014, 17, 991–1012. [Google Scholar] [CrossRef]
  82. MacGregor-Fors, I.; Ortega-Álvarez, R. Fading from the forest: Bird community shifts related to urban park site-specific and landscape traits. Urban For. Urban Green. 2011, 10, 239–246. [Google Scholar] [CrossRef]
  83. Ávila-Flores, R.; Fenton, M.B. Use of spatial features by foraging insectivorous bats in a large urban landscape. J. Mammal. 2005, 86, 1193–1204. [Google Scholar] [CrossRef]
  84. Carpaneto, G.M.; Mazziota, A.; Piattella, E. Changes in food resources and conservation of scarab beetles: From sheep to dog dung in a green urban area of Rome (Coleoptera, Scarabaeoidea). Biol. Conserv. 2005, 123, 547–556. [Google Scholar] [CrossRef]
  85. Guénard, B.; Cardinal-De Casas, A.; Dunn, R.R. High diversity in an urban habitat: Are some animal assemblages resilient to long-term anthropogenic change? Urban Ecosyst. 2015, 18, 449–463. [Google Scholar] [CrossRef]
  86. MacGregor-Fors, I.; Ortega-Álvarez, R. Ecología urbana: Experiencias en América Latina. Available online: http://www1.inecol.edu.mx/libro_ecologia_urbana (accessed on 30 June 2016).
  87. Rosenzweig, M.L. Win-Win Ecology: How the Earth’s Species Can Survive in the Midst of Human Enterprise; Oxford University Press: London, UK, 2003. [Google Scholar]
  88. McDonnell, M.J. Linking and promoting research and practice in the evolving discipline of urban ecology. J. Urban Ecol. 2015, 1, 1–6. [Google Scholar] [CrossRef]
  89. Ramírez-Restrepo, L.; Cultid-Medina, C.A.; MacGregor-Fors, I. How many butterflies are there in a city of circa half a million people? Sustainability 2015, 7, 8587–8597. [Google Scholar] [CrossRef]
  90. McDonnell, M.J.; MacGregor-Fors, I. The ecological future of cities. Science 2016, 352, 936–938. [Google Scholar] [CrossRef] [PubMed]
Figure 1. Greenspace location in Xalapa (light gray polygon). 1: Natura; 2: Santuario; 3: Macuiltépetl; 4: San Roque; 5: Tecajetes; 6: Berros.
Forests 07 00146 g001
Figure 2. Hierarchical clustering dendrograms showing the taxonomic composition similarity of the studied taxonomic groups among greenspaces.
Forests 07 00146 g002
Figure 3. Average greenspace contribution to total species richness of all studied taxonomic groups (error bars represent SE). Black dots indicate the contribution of each taxonomic group per greenspace; letters above values for each greenspace indicate statistically significant differences.
Forests 07 00146 g003
Table 1. Estimated species richness (Sm ± 84% CI) for the studied taxonomic groups in all studied greenspaces.
NaturaSantuarioMacuiltépetlSan RoqueTecajetesBerros
Plants50.3 ± 5.543.1 ± 3.436.5 ± 2.933.1 ± 4.053.0 ± 5.319.8 ± 8.2
(AB)(B)(C)(C)(A)(D)
Sac fungi18.9 ± 3.317.7 ± 2.919.1 ± 2.420.1± 3.018.6 ± 2.712.9 ± 7.6
(A)(A)(A)(A)(A)(A)
Basidiomycetous fungi21.9 ± 1.240.4 ± 1.720.2 ± 1.512.7 ± 2.45.0 ± 1.813.9 ± 1.6
(B)(A)(B)(C)(D)(C)
Ants6.4 ± 1.15.4 ± 0.88.2 ± 2.25.0 ± 1.26.0 ± 0.012.1 ± 4
(B)(B)(AB)(B)(B)(A)
Grasshoppers14.5 ± 1.912.1 ± 2.010.6 ± 2.012.8 ± 8.935
(A)(A)(A)(A)
Copro-necrophagous beetles454553
Butterflies30.2 ± 2.422.3 ± 6.226.5 ± 6.322.4 ± 4.327.9 ± 11.426.2 ± 12.3
(A)(AB)(AB)(B)(AB)(AB)
Amphibians752113
Birds18.0 ± 2.914.5 ± 4.713.1 ± 2.914.8 ± 3.98.8 ± 7.111.3 ± 2.2
(A)(AB)(AB)(AB)(AB)(B)
Bats5.6 ± 0.44.6 ± 1.86.6 ± 3.83.7 ± 2.15.7 ± 0.76 ± 0
(AB)(AB)(AB)(B)(AB)(A)
Letters below values for each greenspace indicate statistically significant differences.

